Susquehanna Bancshares — Shareholder Meeting (May 2009)
45 slides from Susquehanna Bancshares's shareholder meeting presentation, May 8, 2009

Slide 1: Exhibit 99.1
Exhibit 99.1

Slide 2: Susquehanna Bancshares, Inc. Annual Shareholders' Meeting
Susquehanna Bancshares, Inc. Annual Shareholders’ Meeting Susquehanna Bancshares, Inc. Annual Shareholders’ Meeting May 8, 2009 Hershey Lodge and Convention Center Hershey, PA May 8, 2009 Hershey Lodge and Convention Center Hershey, PA
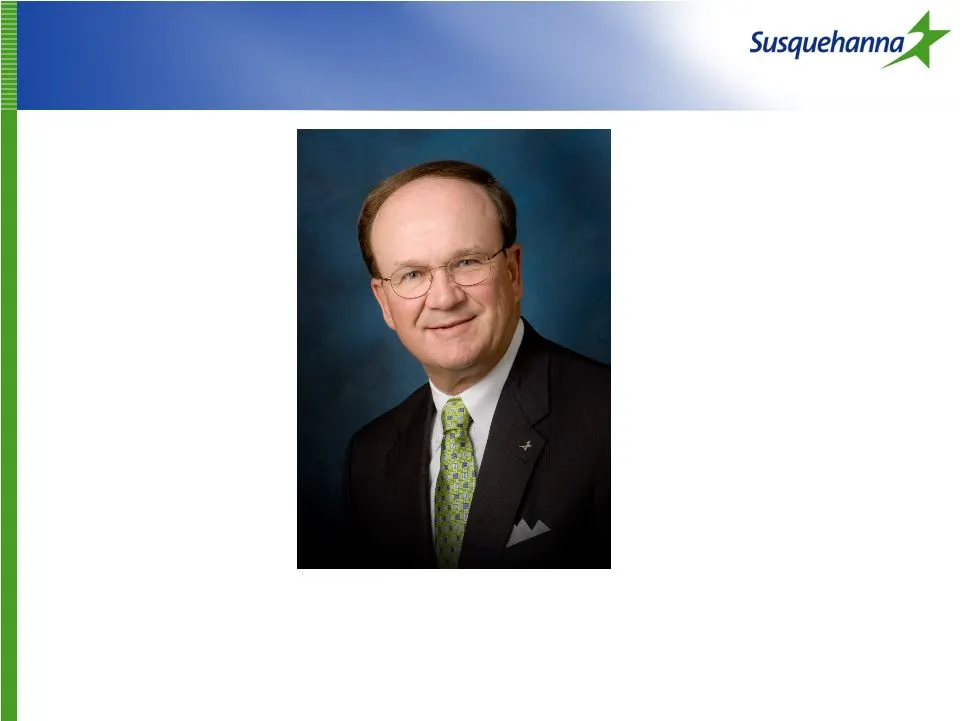
Slide 3: William J. Reuter, Chairman & CEO
William J. Reuter Chairman & CEO

Slide 4: I pledge allegiance to the flag
I pledge allegiance to the flag of the United States of America and to the republic for which it stands: one nation under God, indivisible, with liberty and justice for all.

Slide 5: Directors of Susquehanna
Directors of Susquehanna Directors of Susquehanna Anthony J. Agnone, Sr. Wayne E. Alter, Jr. Peter DeSoto Eddie L. Dunklebarger Bruce A. Hepburn Donald L. Hoffman Guy W. Miller, Jr. Michael A. Morello Scott J. Newkam E. Susan Piersol M. Zev Rose Christine Sears James A. Ulsh Dale M. Weaver Roger V.

Slide 6: Outside Counsel and CPA
Outside Counsel and CPA Outside Counsel and CPA Joanne R. Soslow, Esq. Morgan, Lewis & Bockius, LLP William J. Lewis PricewaterhouseCoopers

Slide 7: Executive Officers
Executive Officers Executive Officers Edward Balderston, Jr. Drew K. Hostetter James G. Pierné Michael M. Quick Jeffrey M. Seibert

Slide 8: Management Team
Management Team Management Team Peter R. Unger Charles R. Dovico Janice T. Lessman Kenneth R. Collins Lisa M. Cavage Bernard A. Francis, Jr. Michael E. Hough Rodney A. Lefever Joseph R. Lizza John H. Montgomery Peter J. Sahd Edward J. Wydock

Slide 9

Slide 10: Judge of Election and Proxies
Judge of Election and Proxies Judge of Election and Proxies Scot B. Crichton Broadridge Financial Solutions, Inc. Samuel G. Reel, Jr. Thomas R. Diehl

Slide 11

Slide 12: Nominations to Board of Directors
Nominations to Board of Directors Nominations to Board of Directors Anthony J. Agnone, Sr. Bruce A. Hepburn Scott J. Newkam M. Zev Rose Christine Sears Roger V. Wiest

Slide 13: Additional Orders of Business
Additional Orders of Business Additional Orders of Business Amendment and Restatement of 2005 Equity Compensation Plan Advisory Vote on Executive Compensation Ratification of PricewaterhouseCoopers LLP as Independent Registered Public Accountants

Slide 14

Slide 15: Voting Results: Directors Elected
Voting Results: Directors Elected Voting Results: Directors Elected Anthony J. Agnone, Sr. Bruce A. Hepburn Scott J. Newkam M. Zev Rose Christine Sears Roger V. Wiest

Slide 16: Voting Results: Motions Approved
Voting Results: Motions Approved Voting Results: Motions Approved Approval of Amendment and Restatement of 2005 Equity Compensation Plan Resolution Regarding Executive Compensation Approved, in an Advisory Vote Ratification of PricewaterhouseCoopers LLP as Independent Registered Public Accountants

Slide 17
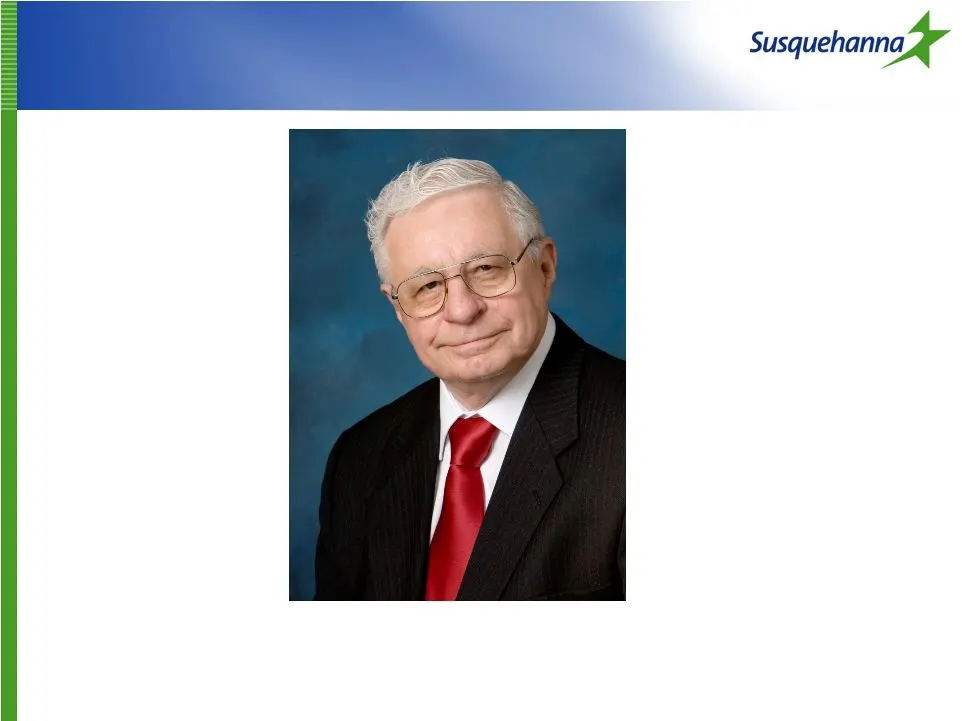
Slide 18: Retiring Board Member
Retiring Board Member Retiring Board Member William B. Zimmerman
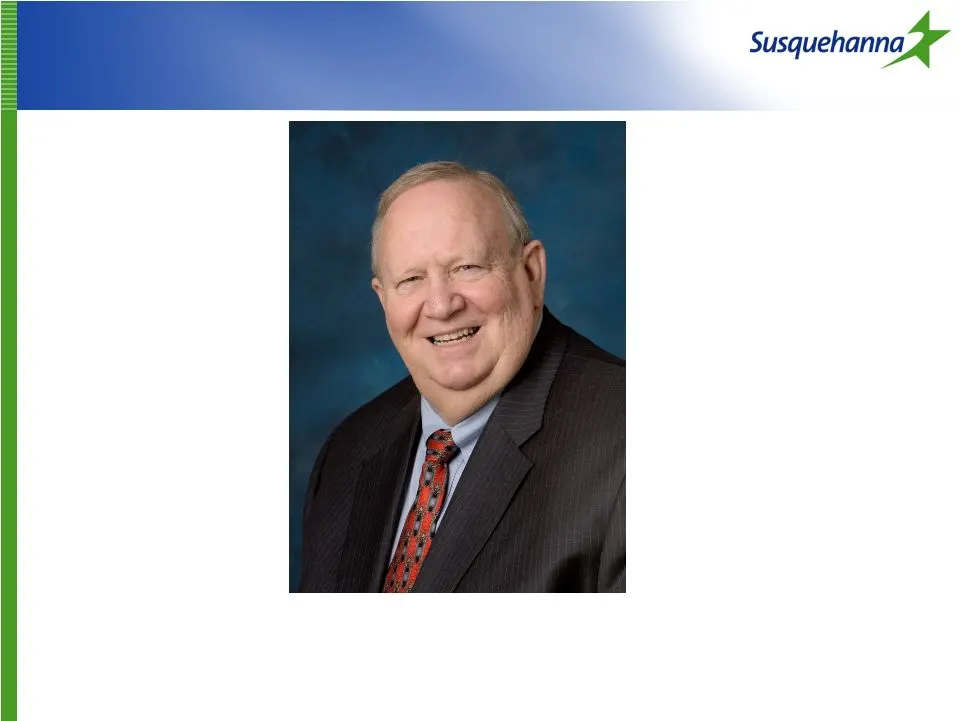
Slide 19: In Memory
In Memory In Memory Russell J. Kunkel

Slide 20

Slide 21: Forward-looking Statements
Forward-looking Statements Forward-looking Statements During the course of this presentation, management may make projections and other forward-looking statements regarding events or the future financial performance of Susquehanna. In particular, certain statements made during this presentation may
Slide 22: 2008: Year in Review
2008: Year in Review
Slide 23: Susquehanna Bank Market Area
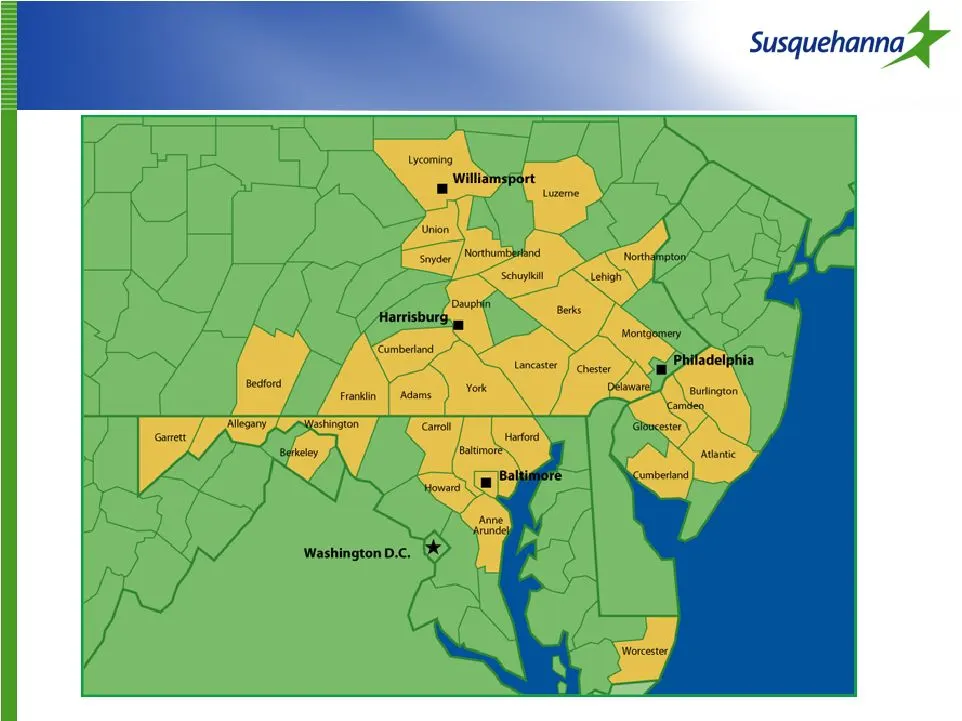
Susquehanna Bank Market Area Susquehanna Bank Market Area

Slide 24: Creating a More Efficient Organization
Creating a More Efficient Organization Creating a More Efficient Organization Consolidation of three bank charters into one Completed October 2008 More than 230 offices in PA, NJ, MD, WV Consistent customer experience Standard products & services Streamlined processes $20 million in annual cost savi

Slide 25: U.S. Treasury Capital Purchase Program
U.S. Treasury Capital Purchase Program U.S. Treasury Capital Purchase Program $300 million investment in December 2008 Increased lending capacity Enhanced capital reserves Supported government efforts to stabilize economy Dividends to be paid to U.S. Treasury in 2009: $15 million Making credit avail

Slide 26: Expense Control Initiatives
Expense Control Initiatives Expense Control Initiatives Canceled cash incentive payments Initiated plan to improve pension expense management Reduced spending on training, education reimbursement Delayed some new branch openings Limited hiring/replacement of staff Evaluating discretionary spending

Slide 27: Dividend Adjustment
Dividend Adjustment Dividend Adjustment Dividend reduced from $0.26 per share in first-quarter 2009 to $0.05 per share in second quarter Consistent with history of conservative fiscal management Enables company to retain approx. $18 million in capital quarterly Enhances capacity to grow loan portfol

Slide 28: Opportunities for Growth & Profit
Opportunities for Growth & Profit Opportunities for Growth & Profit Residential mortgage lending: First Quarter 2009 1,085 originations ($215 million) 726 settlements ($147 million) Double first-quarter volume in 2008 $2.5 million in interest, loan fees and gains on sale Initiatives to improve loan
Slide 29: Drew Hostetter, Chief Financial Officer
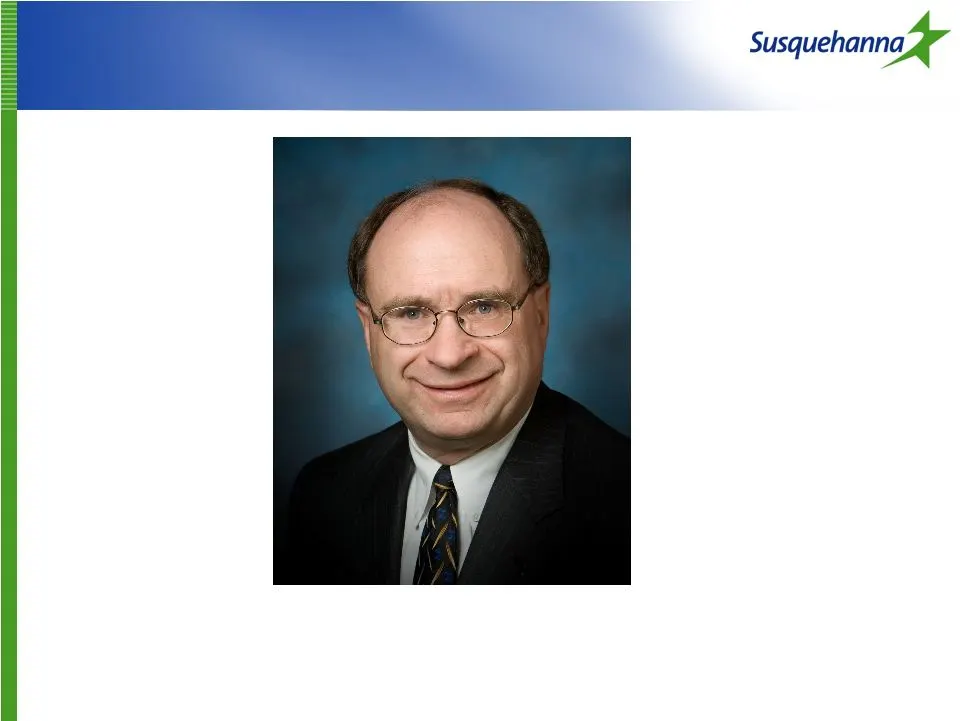
Drew Hostetter Chief Financial Officer
Slide 30: Return on Assets (2008)
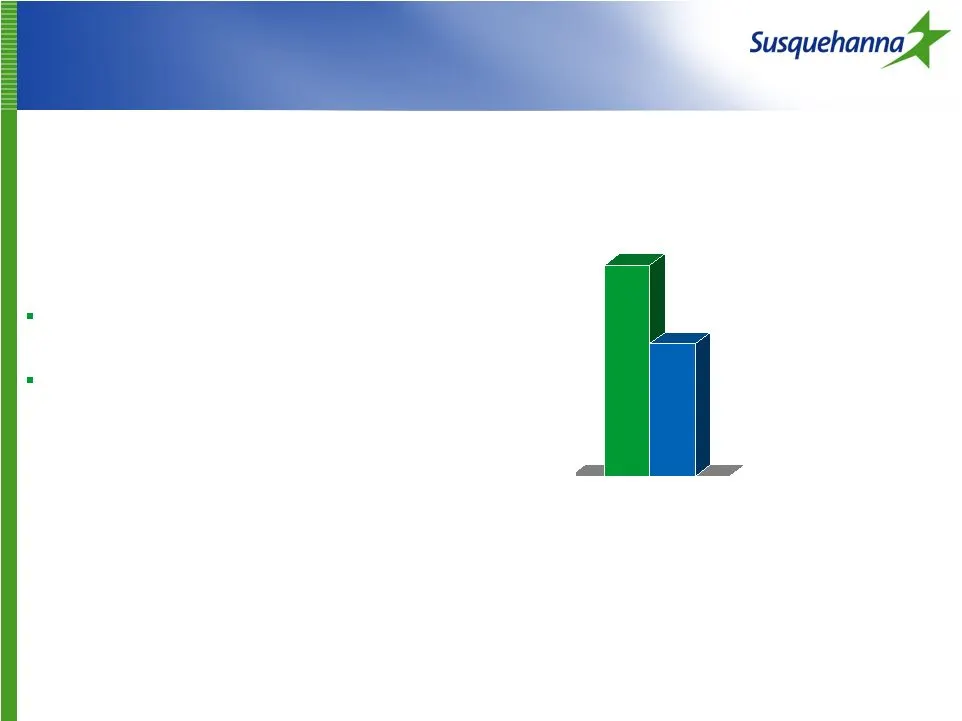
Return on Assets (2008) 0.00% 0.10% 0.20% 0.30% 0.40% 0.50% 0.60% 0.70% Return on Assets (2008) Susquehanna 0.62% Peer Bank Avg. 0.39% (Peer bank data is for U.S. banks with $10 billion - $20 billion in assets.)
Slide 31: Net Interest Margin (2008)
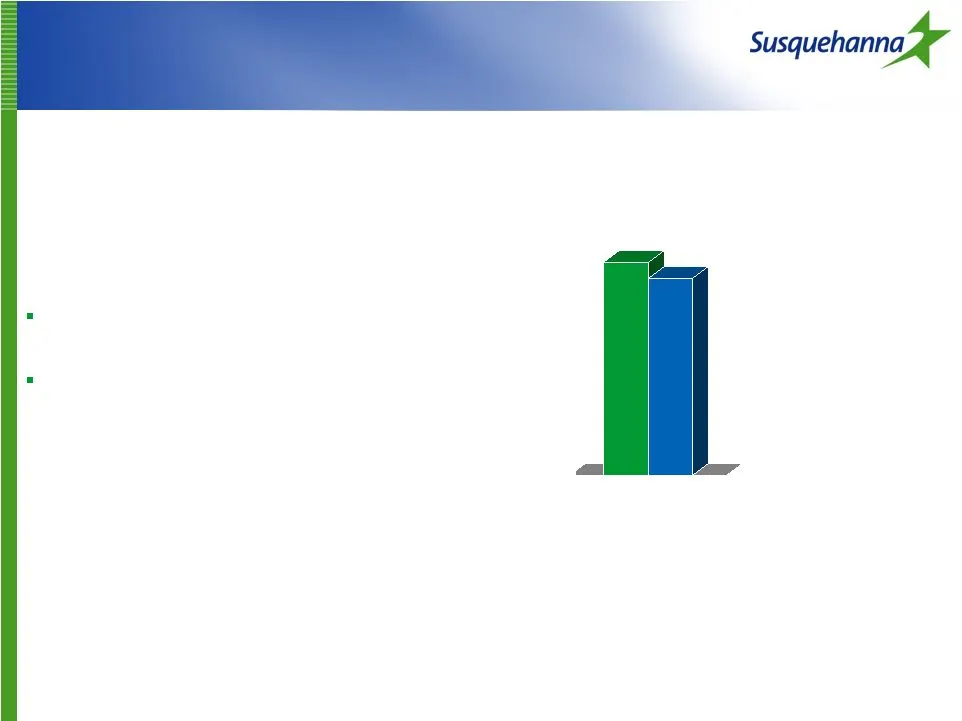
Net Interest Margin (2008) 0.00% 0.50% 1.00% 1.50% 2.00% 2.50% 3.00% 3.50% 4.00% Net Interest Margin (2008) Susquehanna 3.62% Peer Bank Avg. 3.35% (Peer bank data is for U.S. banks with $10 billion - $20 billion in assets.)

Slide 32: Efficiency Ratio (2008)
Efficiency Ratio (2008) 0.00% 10.00% 20.00% 30.00% 40.00% 50.00% 60.00% Efficiency Ratio (2008) Susquehanna 62.14% Peer Bank Avg. 60.85% (Peer bank data is for U.S. banks with $10 billion - $20 billion in assets.)

Slide 33: Investment Gain or Loss/Average Portfolio Value (2008)
Investment Gain or Loss/ Average Portfolio Value (2008) -2.50% -2.00% -1.50% -1.00% -0.50% 0.00% Investment Gain or Loss/ Average Portfolio Value (2008) Susquehanna -0.84% Peer Bank Avg. -2.50% (Peer bank data is for U.S. banks with $10 billion - $20 billion in assets.)
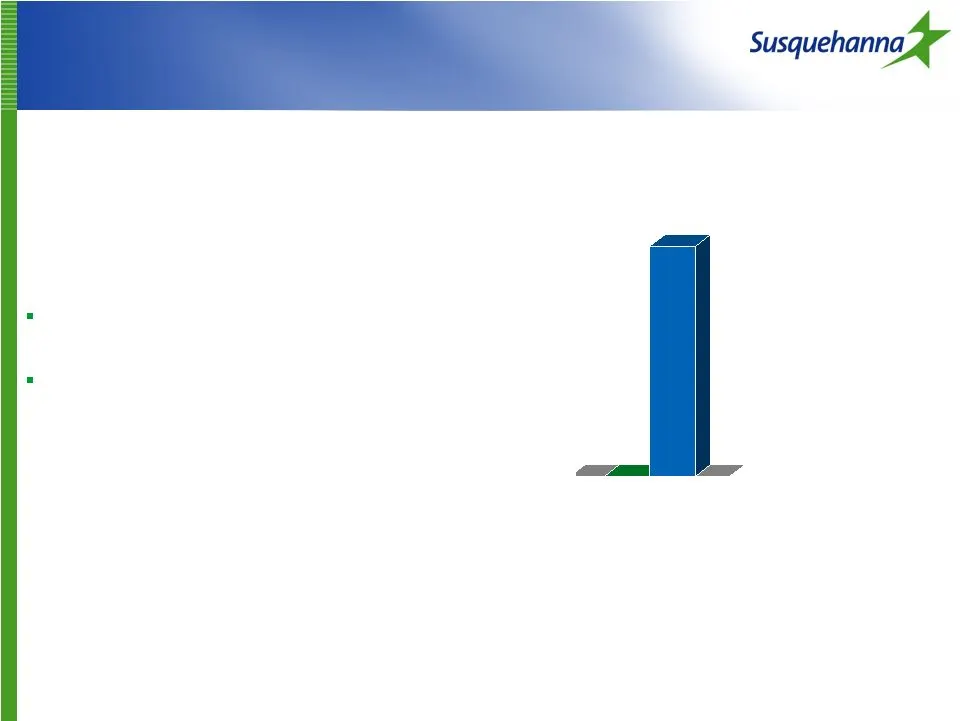
Slide 34: Goodwill Impairment Charge/Average Assets (2008)
Goodwill Impairment Charge/ Average Assets (2008) 0.00% 0.10% 0.20% 0.30% 0.40% 0.50% 0.60% Goodwill Impairment Charge/ Average Assets (2008) Susquehanna 0.00% Peer Bank Avg. 0.58% (Peer bank data is for U.S. banks with $10 billion - $20 billion in assets.)
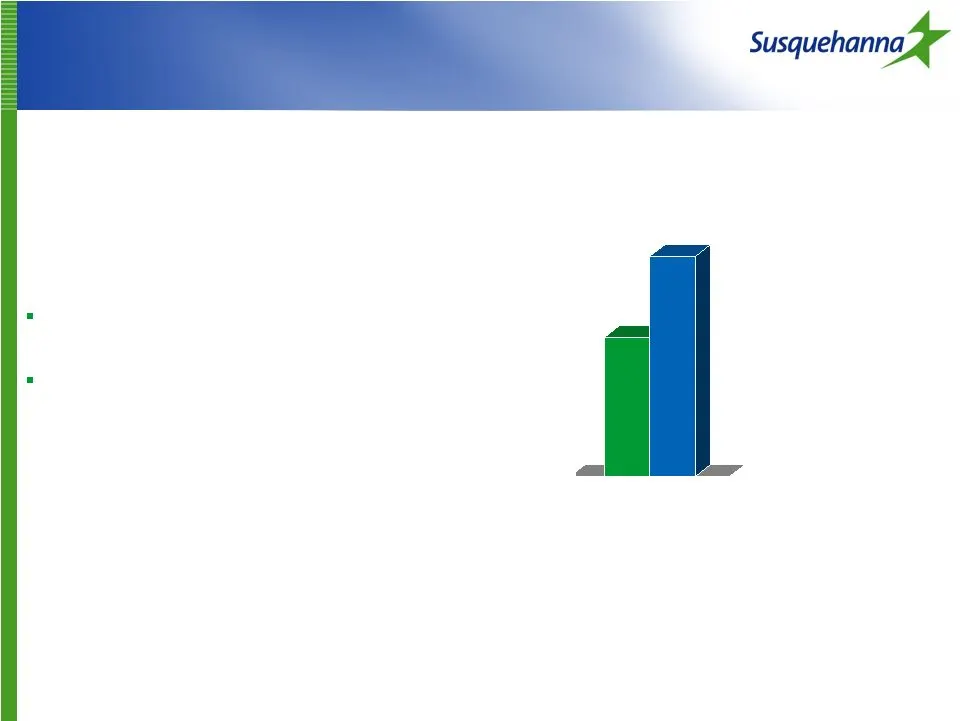
Slide 35: Loan Loss Provision/Average Loans (2008)
Loan Loss Provision/Average Loans (2008) 0.00% 0.20% 0.40% 0.60% 0.80% 1.00% 1.20% Loan Loss Provision/Average Loans (2008) Susquehanna 0.70% Peer Bank Avg. 1.11% (Peer bank data is for U.S. banks with $10 billion - $20 billion in assets.)
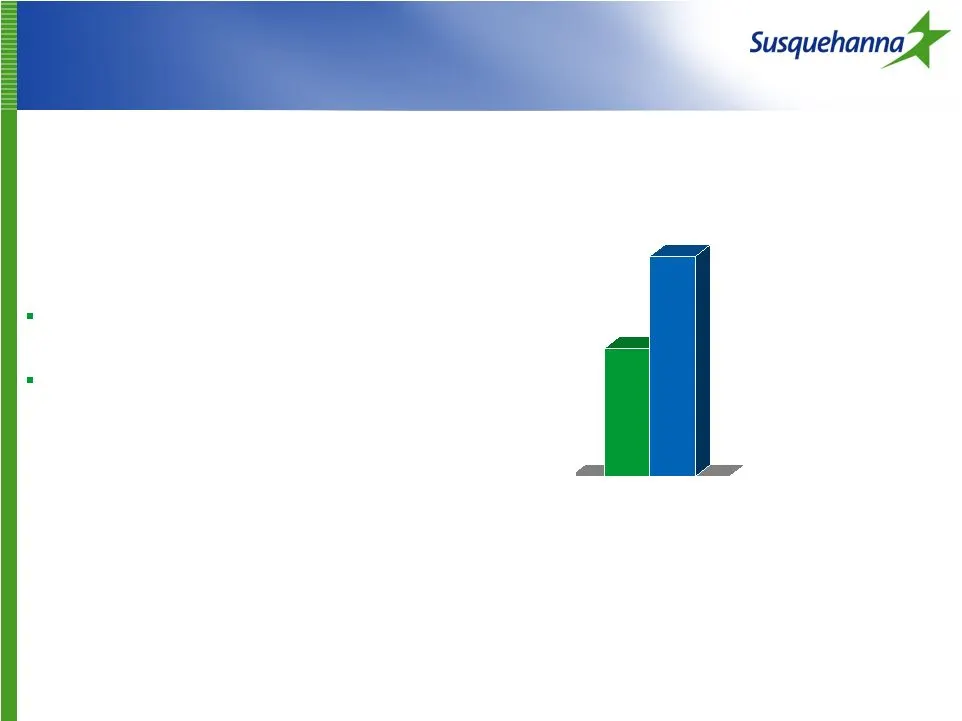
Slide 36: Non-Performing Assets/Total Assets (2008)
Non-Performing Assets/ Total Assets (2008) 0.00% 0.20% 0.40% 0.60% 0.80% 1.00% 1.20% 1.40% 1.60% Non-Performing Assets/ Total Assets (2008) Susquehanna 0.86% Peer Bank Avg. 1.48% (Peer bank data is for U.S. banks with $10 billion - $20 billion in assets.)
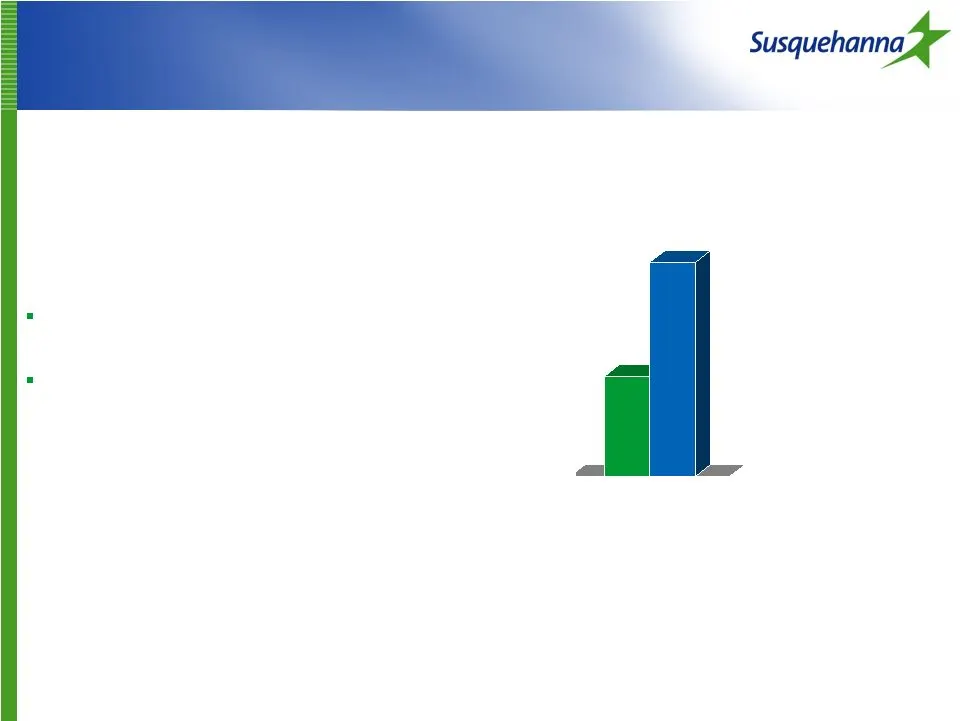
Slide 37: Net Charge-Offs/Average Loans (2008)
Net Charge-Offs/Average Loans (2008) 0.00% 0.20% 0.40% 0.60% 0.80% 1.00% Net Charge-Offs/Average Loans (2008) Susquehanna 0.42% Peer Bank Avg. 0.90% (Peer bank data is for U.S. banks with $10 billion - $20 billion in assets.)
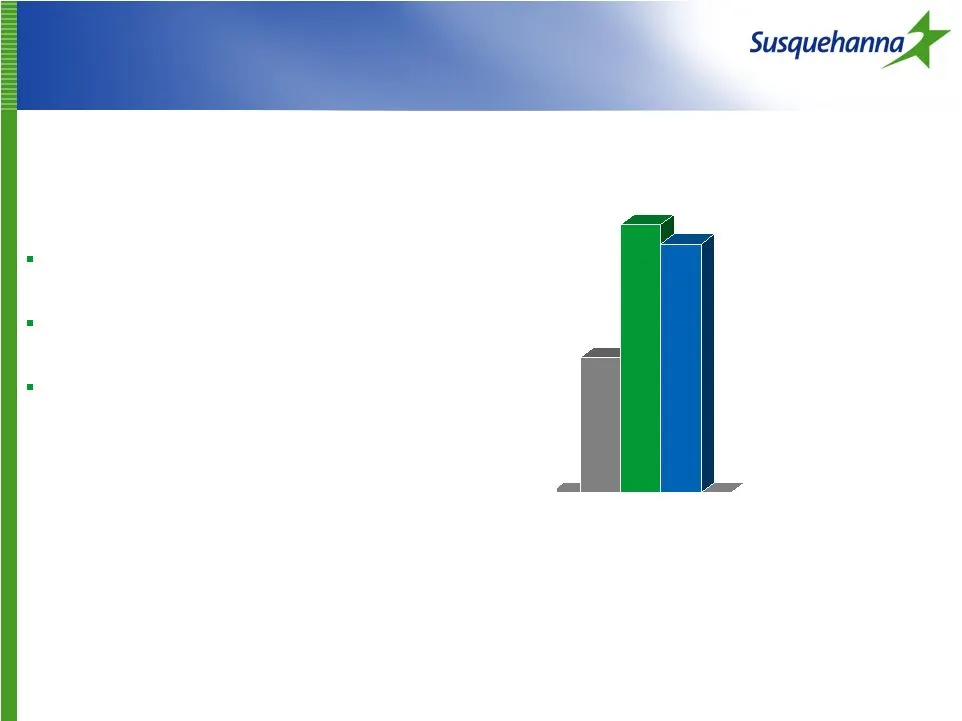
Slide 38: Leverage Ratio (2008)
Leverage Ratio (2008) 0% 2% 4% 6% 8% 10% Leverage Ratio (2008) Well-Capitalized 5.00% Susquehanna 9.92% Peer Bank Avg. 9.20% (Peer bank data is for U.S. banks with $10 billion - $20 billion in assets.)
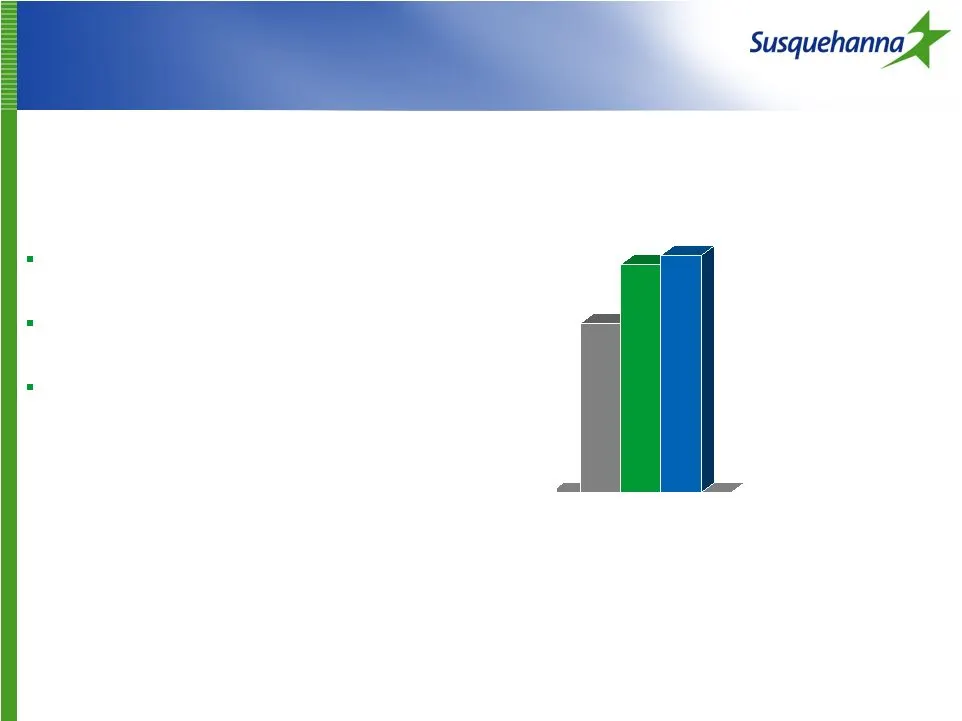
Slide 39: Total Risk-Based Capital Ratio (2008)
Total Risk-Based Capital Ratio (2008) 0% 2% 4% 6% 8% 10% 12% 14% 16% Total Risk-Based Capital Ratio (2008) Well-Capitalized 10.00% Susquehanna 13.52% Peer Bank Avg. 14.06% (Peer bank data is for U.S. banks with $10 billion - $20 billion in assets.)
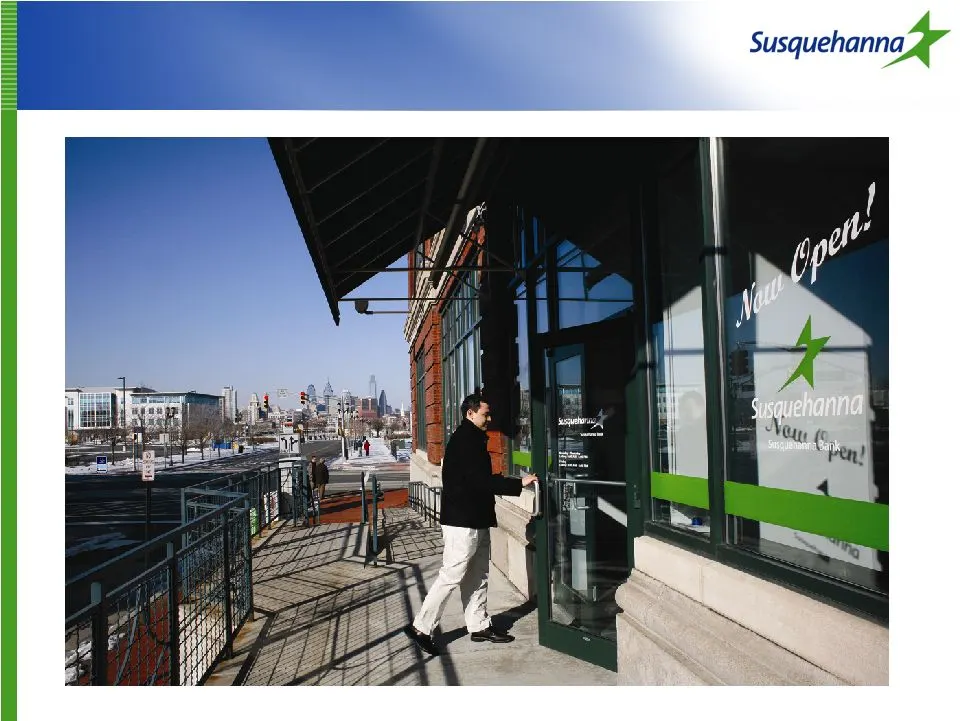
Slide 40: Susquehanna Going Forward
Susquehanna gr

Slide 41: Capital Ratios: 1st Quarter 2009
Capital Ratios: 1 st Quarter 2009 Capital Ratios: 1 st Quarter 2009 13.65% 10.00% Total Risk-Based Capital Ratio 11.13% 6.00% Tier I Risk-Based Capital Ratio 9.76% 5.00% Leverage Ratio Susquehanna at March 31, 2009 Well-Capitalized Threshold

Slide 42: Susquehanna's Strengths
Susquehanna’s Strengths Susquehanna’s Strengths 100+ year legacy as engine of economic growth in local communities Solid track record of generating deposits and making loans in markets we know well Consistent loan growth, with credit quality superior to majority of our peer companies Consolidation a

Slide 43

Slide 44: Quarterly Webcast
Quarterly Webcast Quarterly Webcast www.susquehanna.net

Slide 45
Source: SEC EDGAR · 8-K filed May 8, 2009
More decks from Susquehanna Bancshares Inc
 Investor Presentation (December 2014)51 slides · Dec 3, 2014
 Merger or Acquisition (November 2014)28 slides · Nov 17, 2014
 Merger or Acquisition (November 2014)13 slides · Nov 12, 2014
 Q2 2014 Earnings Presentation46 slides · Aug 11, 2014
 Investor Presentation (May 2014)44 slides · May 5, 2014
 Shareholder Meeting (May 2014)35 slides · May 2, 2014