Energy XXI — Debt Investor Presentation (April 2016)
103 slides from Energy XXI's debt investor presentation, Apr 14, 2016
Slide 1: Project Bluewater Creditor Presentation
NASDAQ: EXXI www.energyxxi.com March 3, 2016 Project Bluewater Creditor Presentation Confidential; Subject to NDA Subject to Material Revision Exhibit 99.1
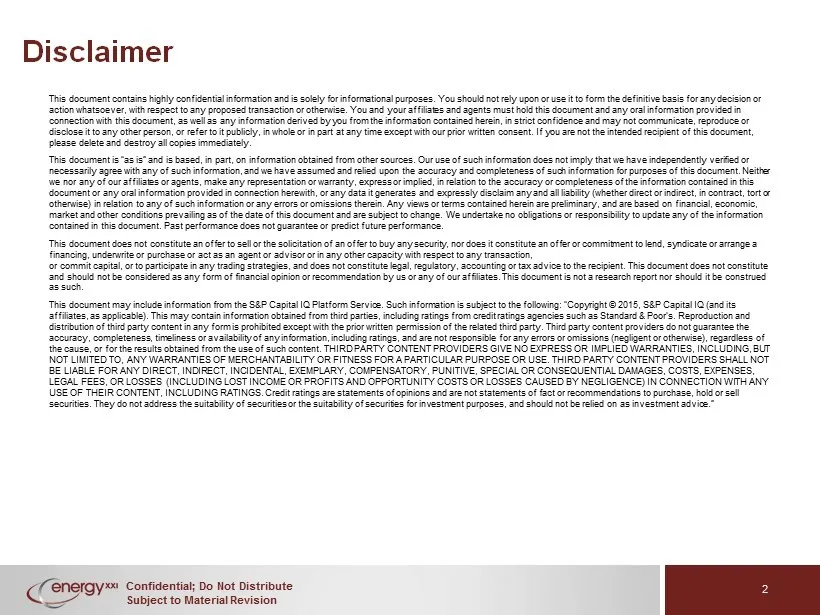
Slide 2: Disclaimer
Confidential; Do Not Distribute Subject to Material Revision Disclaimer This document contains highly confidential information and is solely for informational purposes. You should not rely upon or use it to form the definitive basis for any decision or action whatsoever, with respect to any proposed
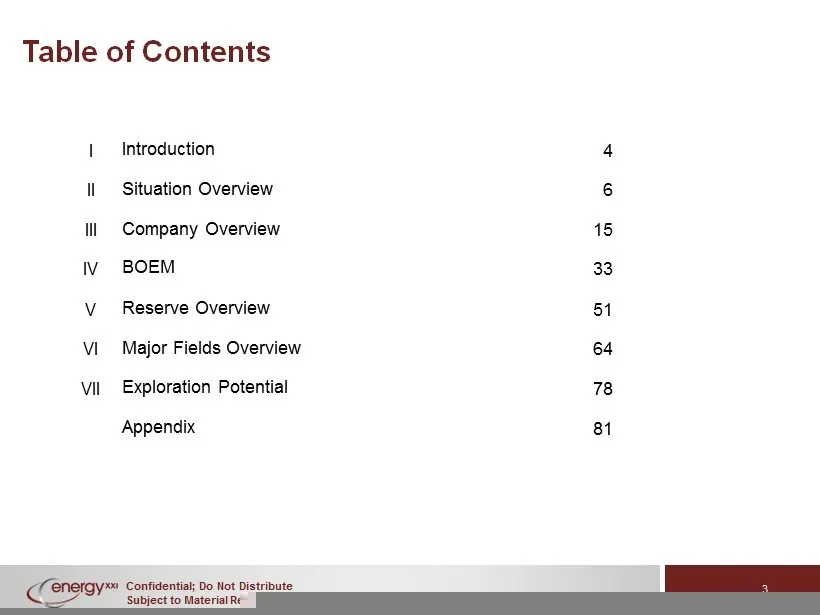
Slide 3: Table of Contents
Confidential; Do Not Distribute Subject to Material Revision 3 Table of Contents Introduction 4 I Situation Overview 6 II Company Overview 15 III Reserve Overview 51 V Major Fields Overview 64 VI Exploration Potential 78 VII Appendix 81 BOEM 33 IV
Slide 4: I. Introduction
Confidential; Do Not Distribute Subject to Material Revision I. INTRODUCTION 4
Slide 5: Today's Presenters
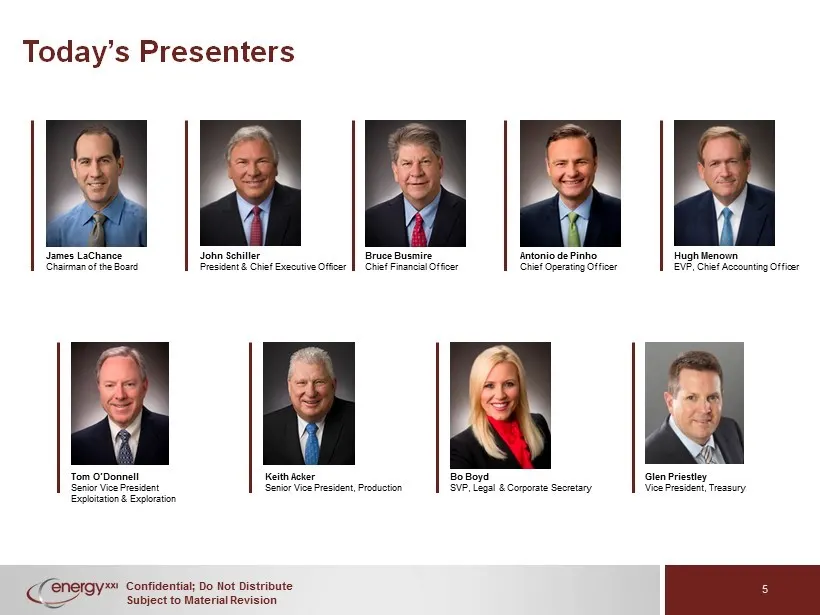
Confidential; Do Not Distribute Subject to Material Revision Today’s Presenters John Schiller President & Chief Executive Officer Bruce Busmire Chief Financial Officer Antonio de Pinho Chief Operating Officer Glen Priestley Vice President, Treasury Tom O’Donnell Senior Vice President Exploitation &
Slide 6: II. Situation Overview
Confidential; Do Not Distribute Subject to Material Revision II. SITUATION OVERVIEW 6
Slide 7: Situation Overview
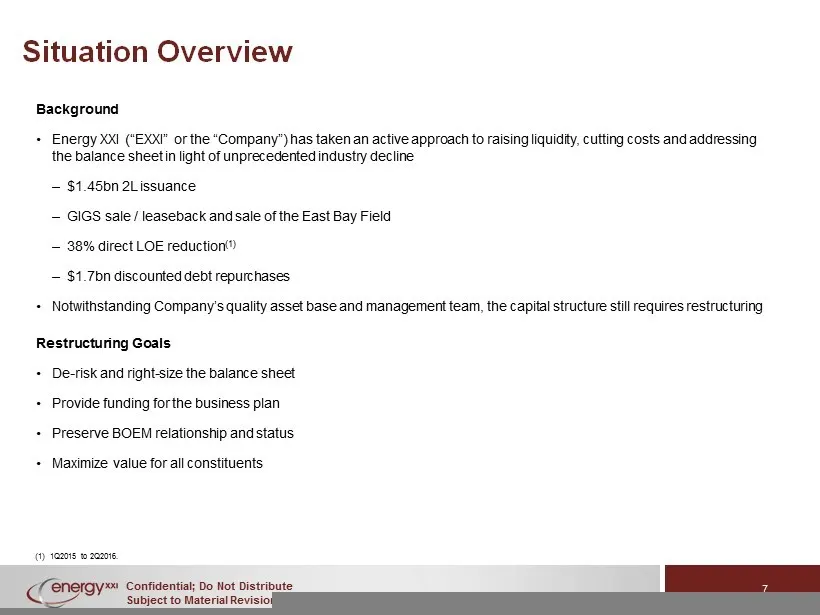
Confidential; Do Not Distribute Subject to Material Revision 7 Situation Overview Background • Energy XXI (“EXXI” or the “Company”) has taken an active approach to raising liquidity, cutting costs and addressing the balance sheet in light of unprecedented industry decline – $ 1.45bn 2L issuance – GI
Slide 8: US Commodities Perspectives and Outlook
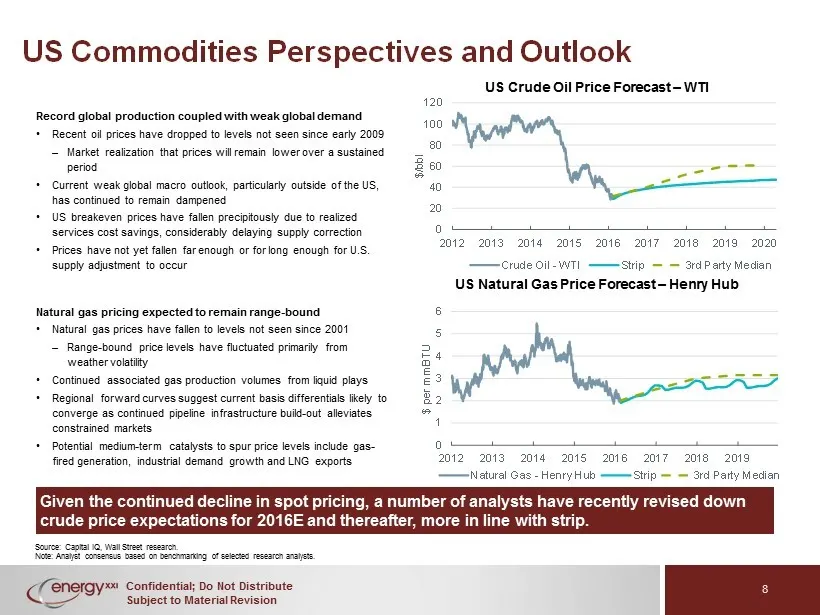
Confidential; Do Not Distribute Subject to Material Revision 8 US Commodities Perspectives and Outlook Source: Capital IQ, Wall Street research. Note: Analyst consensus based on benchmarking of selected research analysts. Record global production coupled with weak global demand • Recent oil prices h
Slide 9: Capital Structure
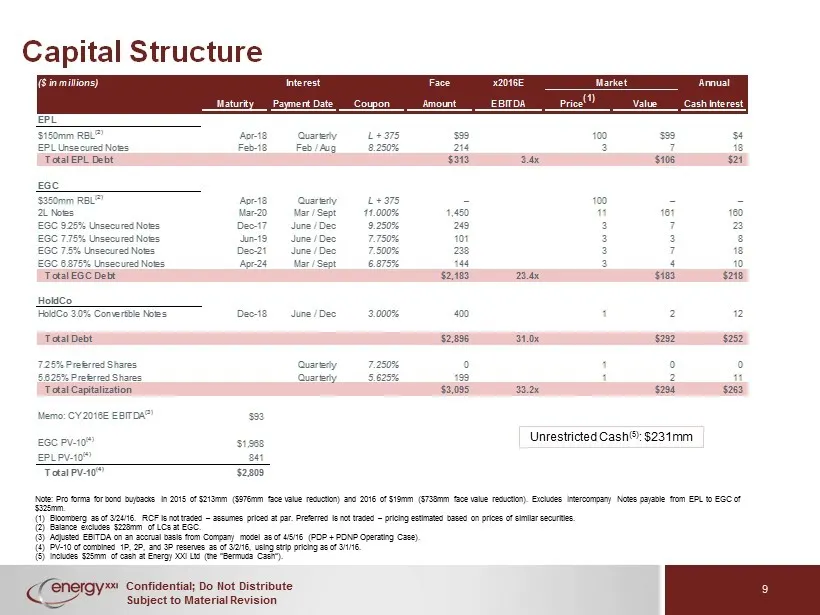
Confidential; Do Not Distribute Subject to Material Revision 9 Capital Structure Note: Pro forma for bond buybacks in 2015 of $213mm ($976mm face value reduction) and 2016 of $ 19mm ($738mm face value reduction). Excludes Intercompany Notes payable from EPL to EGC of $325mm. (1) Bloomberg as of 3/24
Slide 10: Summary Organizational Chart
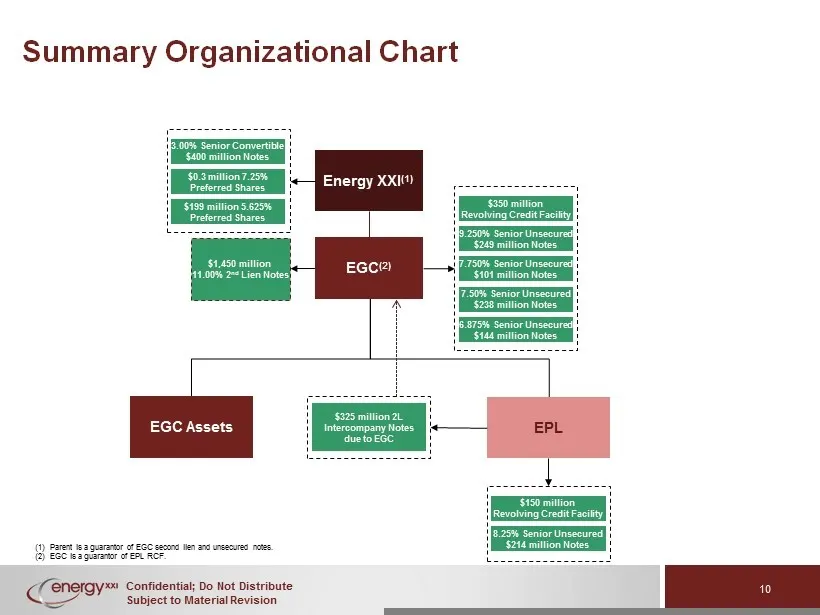
Confidential; Do Not Distribute Subject to Material Revision 10 Summary Organizational Chart (1) Parent is a guarantor of EGC second lien and unsecured notes. (2) EGC is a guarantor of EPL RCF. $350 million Revolving Credit Facility 9.250% Senior Unsecured $249 million Notes 7.750% Senior Unsecured
Slide 11: Current Liquidity
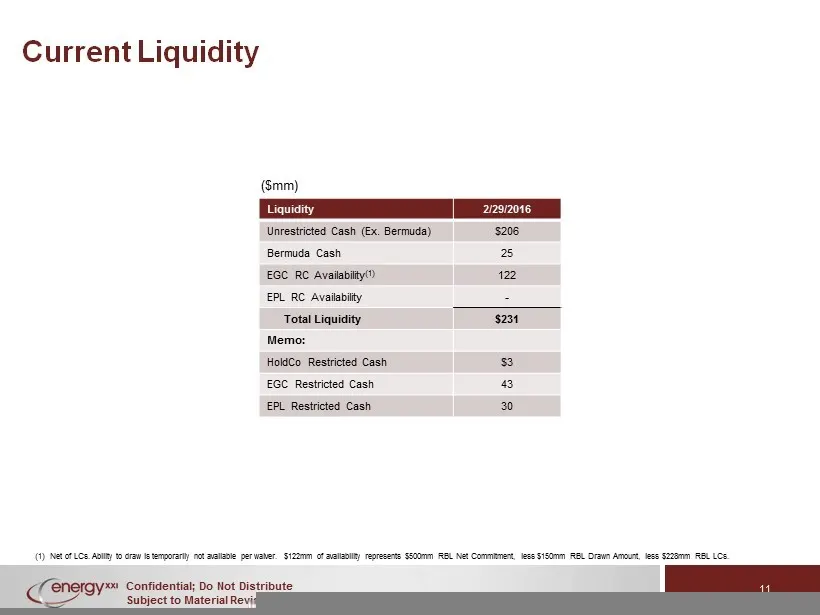
Confidential; Do Not Distribute Subject to Material Revision 11 Current Liquidity (1) Net of LCs. Ability to draw is temporarily not available per waiver. $122mm of availability represents $500mm RBL Net Commit men t, less $150mm RBL Drawn Amount, less $228mm RBL LCs. Liquidity 2/29/2016 Unrestricte
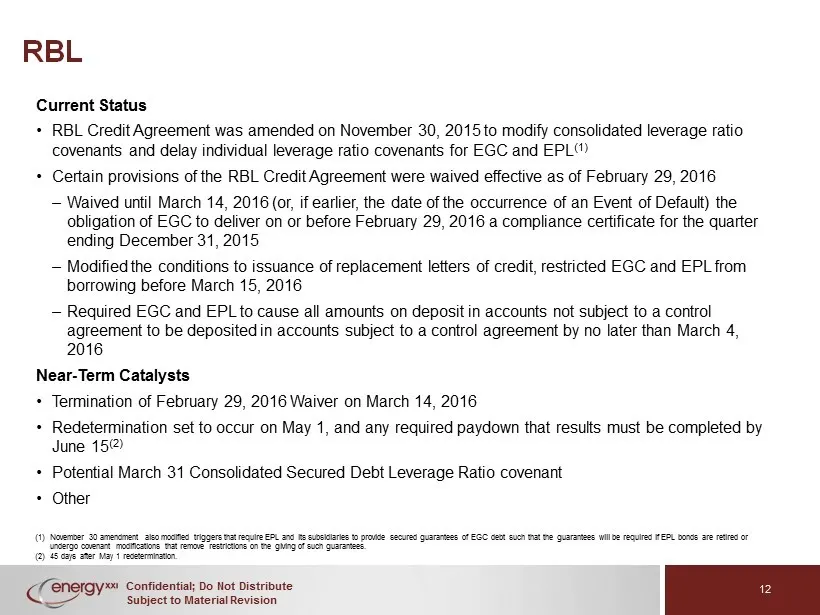
Slide 12: RBL
Confidential; Do Not Distribute Subject to Material Revision 12 RBL (1) November 30 amendment also modified triggers that require EPL and its subsidiaries to provide secured guarantees of EGC debt such that the guarantees will be req uir ed if EPL bonds are retired or undergo covenant modifications
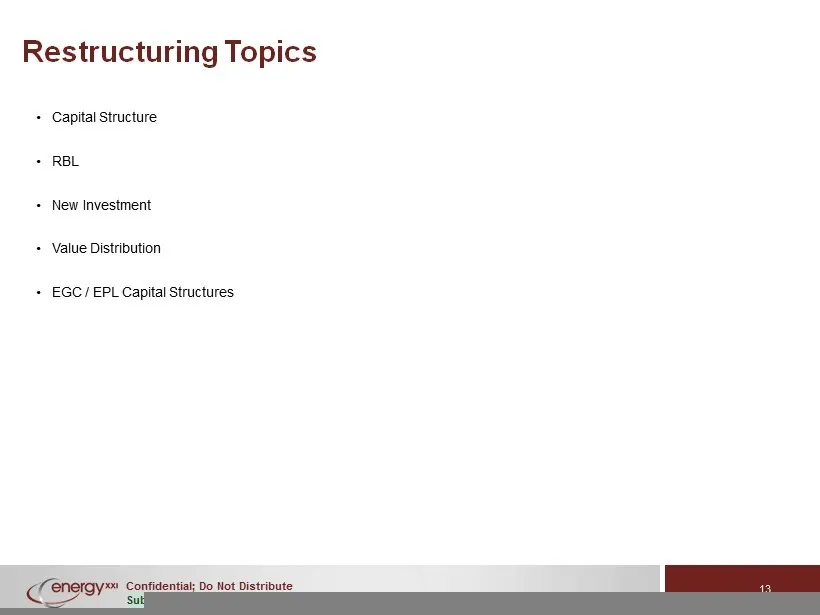
Slide 13: Restructuring Topics
Confidential; Do Not Distribute Subject to Material Revision 13 Restructuring Topics • Capital Structure • RBL • New Investment • Value Distribution • EGC / EPL Capital Structures
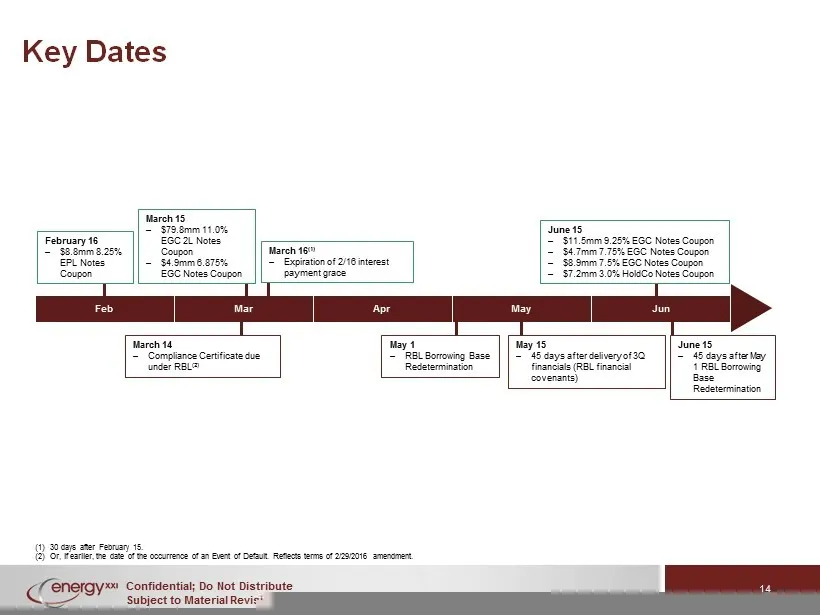
Slide 14: Key Dates
Confidential; Do Not Distribute Subject to Material Revision 14 Key Dates June 15 – 45 days after May 1 RBL Borrowing Base Redetermination February 16 – $8.8mm 8.25% EPL Notes Coupon March 15 – $79.8mm 11.0% EGC 2L Notes Coupon – $4.9mm 6.875% EGC Notes Coupon June 15 – $11.5mm 9.25% EGC Notes Coupo
Slide 15: III. Company Overview
Confidential; Do Not Distribute Subject to Material Revision III. COMPANY OVERVIEW 15
Slide 16: Company History
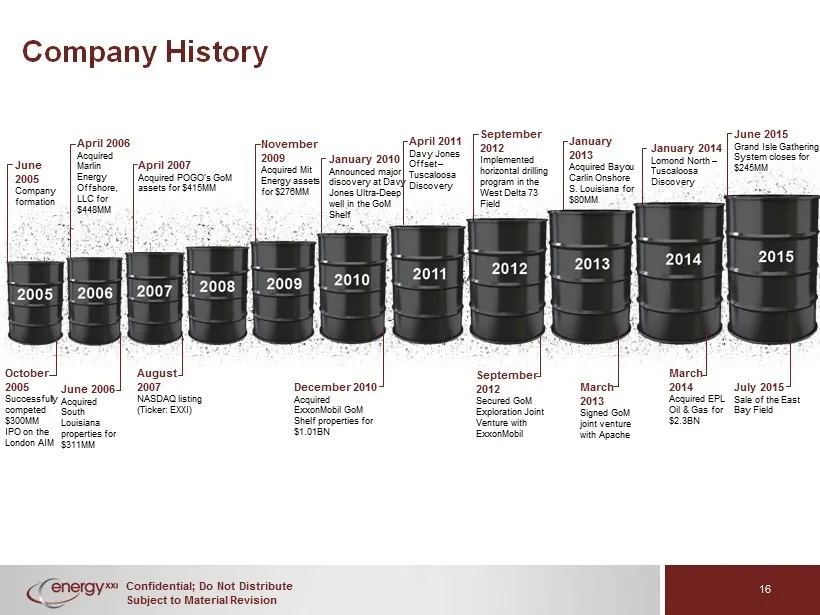
Confidential; Do Not Distribute Subject to Material Revision 16 Company History October 2005 Successfully competed $300MM IPO on the London AIM June 2005 Company formation April 2006 Acquired Marlin Energy Offshore, LLC for $448MM June 2006 Acquired South Louisiana properties for $311MM April 2007 A
Slide 17: EXXI Operates Largest GoM Shelf Oil Fields
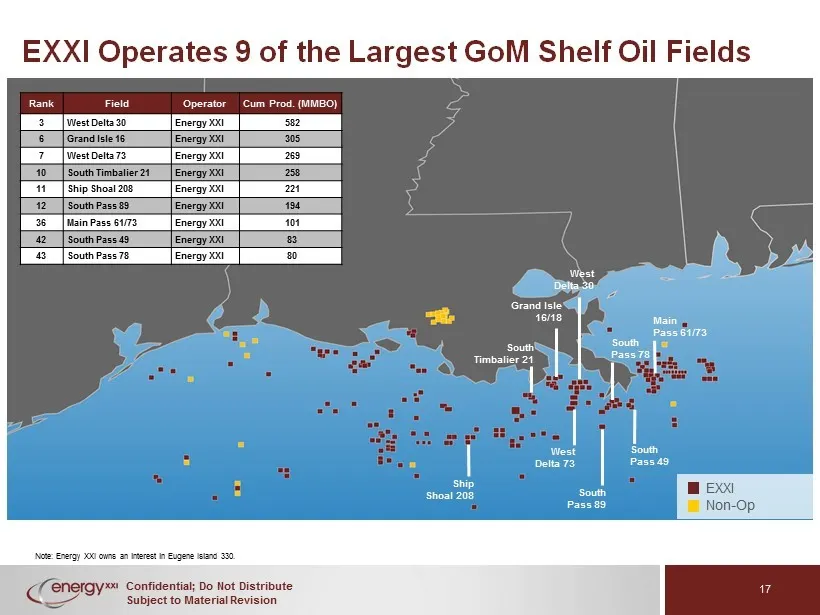
Confidential; Do Not Distribute Subject to Material Revision 17 EXXI Operates 9 of the Largest GoM Shelf Oil Fields Note: Energy XXI owns an interest in Eugene Island 330 . Grand Isle 16/18 West Delta 30 South Timbalier 21 West Delta 73 South Pass 49 South Pass 78 Ship Shoal 208 South Pass 89 Rank F
Slide 18: Strategic Plan
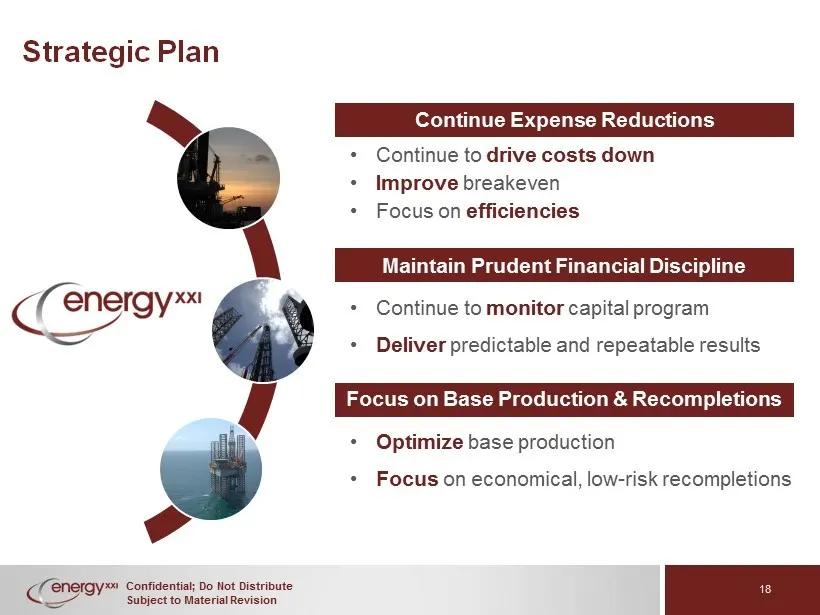
Confidential; Do Not Distribute Subject to Material Revision 18 Strategic Plan • Continue to monitor capital program • Deliver predictable and repeatable results Maintain Prudent Financial Discipline Continue Expense Reductions • Continue to drive costs down • I mprove breakeven • Focus on efficienc
Slide 19: Demonstrating Capital Efficiency in FY16
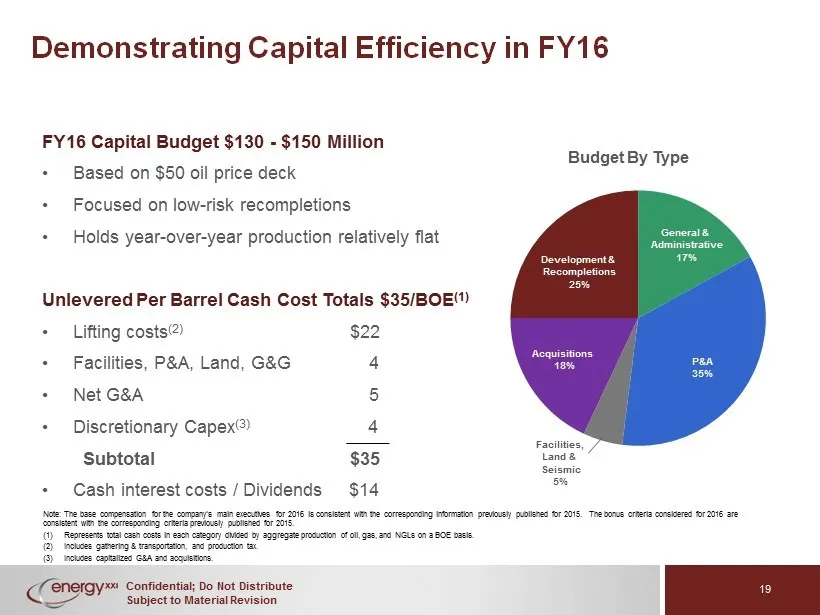
Confidential; Do Not Distribute Subject to Material Revision Demonstrating Capital Efficiency in FY16 FY16 Capital Budget $130 - $150 Million • Based on $50 oil price deck • Focused on low - risk recompletions • Holds year - over - year production relatively flat Unlevered Per Barrel Cash Cost Total
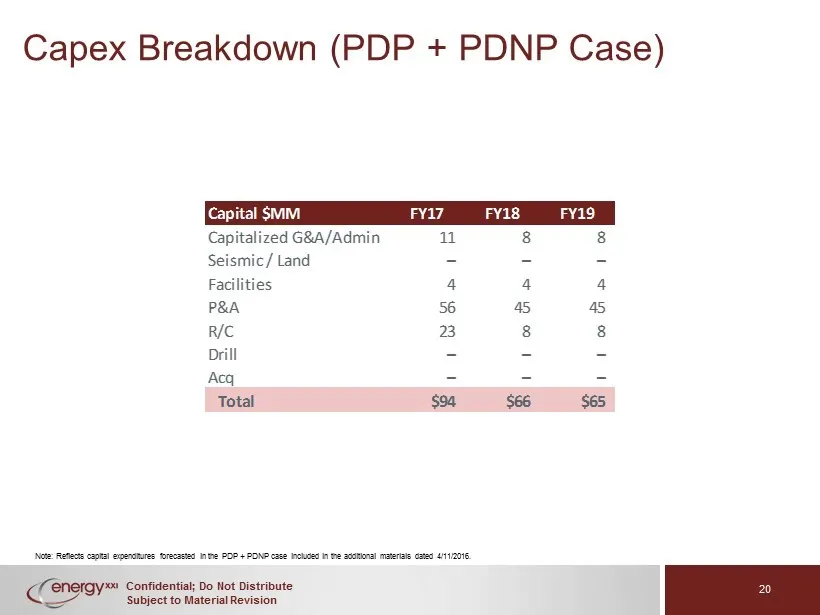
Slide 20: Capex Breakdown (PDP + PDNP Case)
Confidential; Do Not Distribute Subject to Material Revision 20 Capex Breakdown (PDP + PDNP Case) Note: Reflects capital expenditures forecasted in the PDP + PDNP case included in the additional materials dated 4/11/2016. Capital $MM FY17 FY18 FY19 Capitalized G&A/Admin 11 8 8 Seismic / Land – – – F
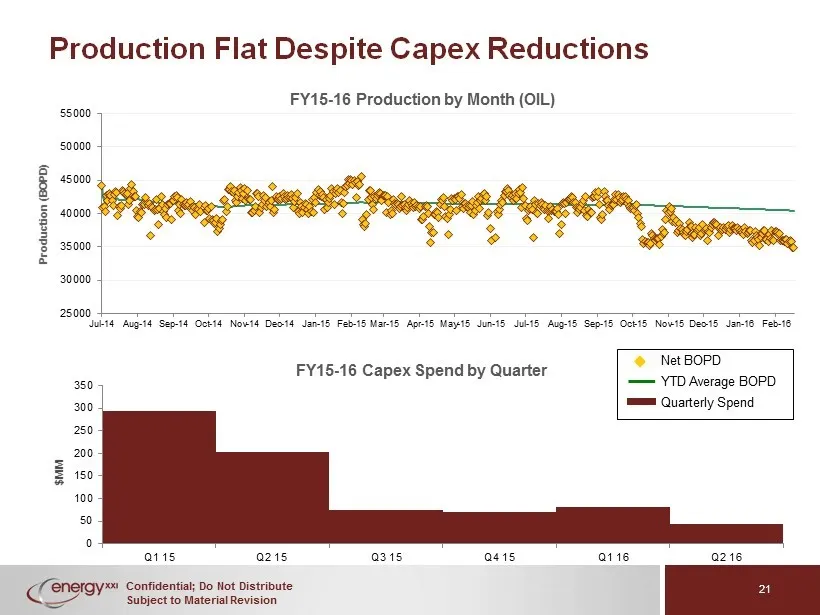
Slide 21: Production Flat Despite Capex Reductions
Confidential; Do Not Distribute Subject to Material Revision Net BOPD YTD Average BOPD Quarterly Spend 0 50 100 150 200 250 300 350 Q1 15 Q2 15 Q3 15 Q4 15 Q1 16 Q2 16 $MM FY15 - 16 Capex Spend by Quarter 25000 30000 35000 40000 45000 50000 55000 Jul-14 Aug-14 Sep-14 Oct-14 Nov-14 Dec-14 Jan-15 Feb-
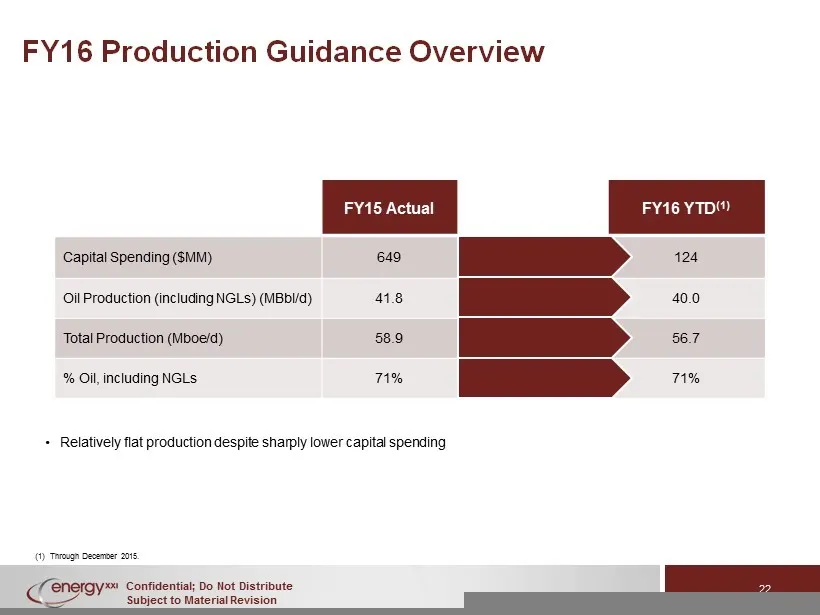
Slide 22: FY16 Production Guidance Overview
Confidential; Do Not Distribute Subject to Material Revision 22 FY16 Production Guidance Overview (1) Through December 2015. FY15 Actual FY16 YTD (1) Capital Spending ($MM) 649 124 Oil Production (including NGLs) ( MBbl /d) 41.8 40.0 Total Production ( Mboe /d) 58.9 56.7 % Oil, including NGLs 71% 71
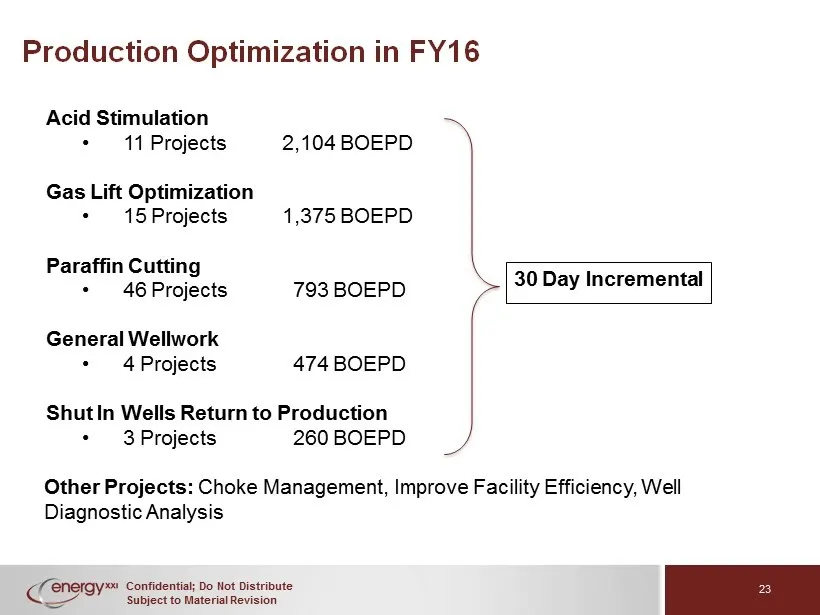
Slide 23: Production Optimization in FY16
Confidential; Do Not Distribute Subject to Material Revision 23 Production Optimization in FY16 Acid Stimulation • 11 Projects 2,104 BOEPD Gas Lift Optimization • 15 Projects 1,375 BOEPD Paraffin Cutting • 46 Projects 793 BOEPD General Wellwork • 4 Projects 474 BOEPD Shut In Wells Return to Producti
Slide 24: Production Optimization Case Studies
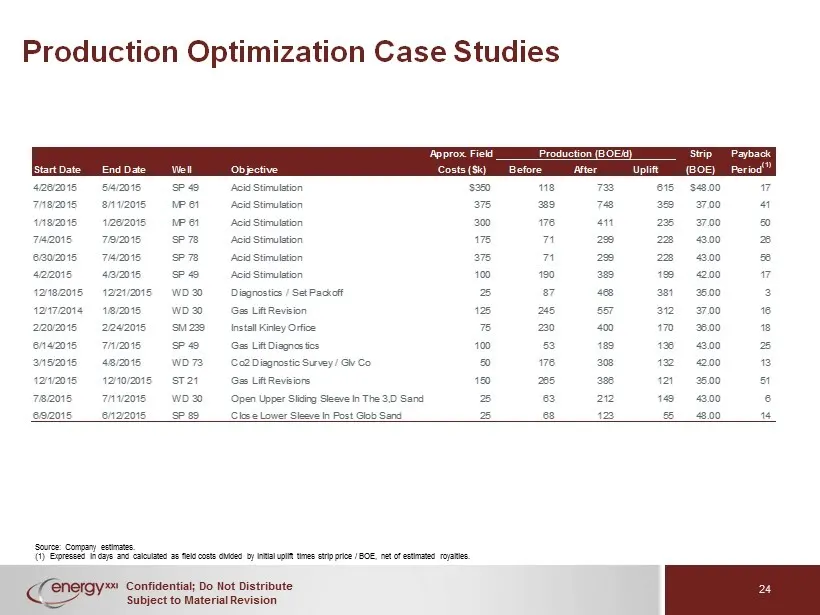
Confidential; Do Not Distribute Subject to Material Revision 24 Production Optimization Case Studies Source: Company estimates. (1) Expressed in days and calculated as field costs divided by initial uplift times strip price / BOE, net of estimated royalties . Approx. Field Production (BOE/d) Strip P
Slide 25: Downtime Analysis
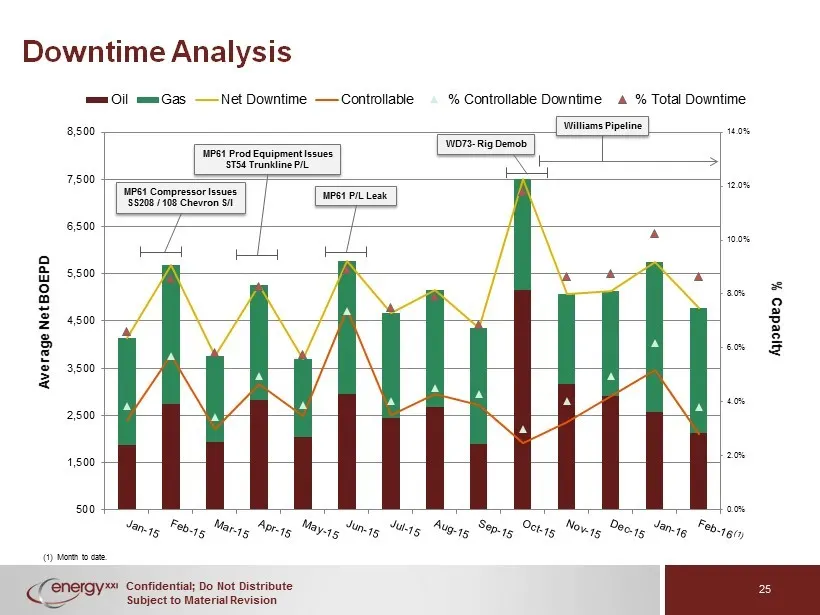
Confidential; Do Not Distribute Subject to Material Revision Downtime Analysis 0.0% 2.0% 4.0% 6.0% 8.0% 10.0% 12.0% 14.0% 500 1,500 2,500 3,500 4,500 5,500 6,500 7,500 8,500 % Capacity Average Net BOEPD Oil Gas Net Downtime Controllable % Controllable Downtime % Total Downtime MP61 Prod Equipment Is
Slide 26: Operating Unit Cost Analysis
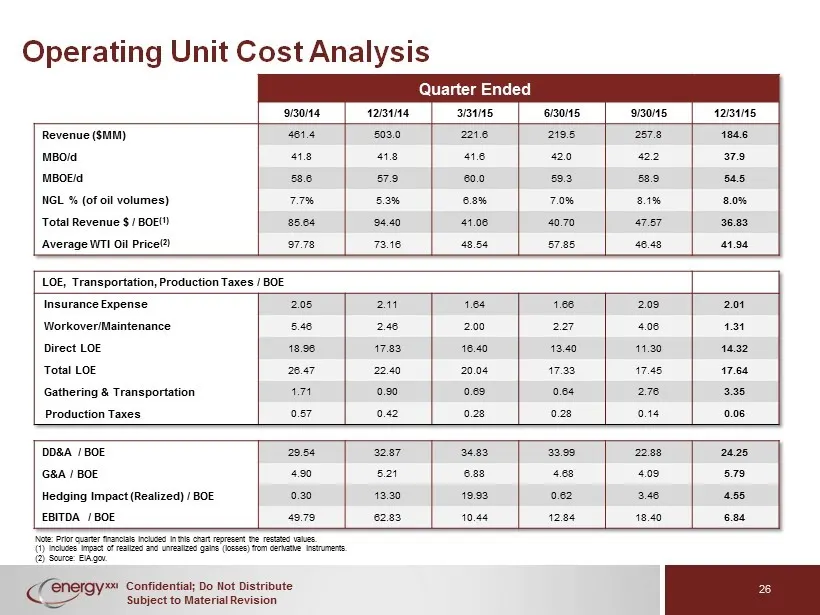
Confidential; Do Not Distribute Subject to Material Revision 26 Operating Unit Cost Analysis Note: Prior quarter financials included in this chart represent the restated values . (1) Includes impact of realized and unrealized gains (losses) from derivative instruments. (2) Source: EIA.gov. Quarter E
Slide 27: LOE Reduction Continues in Q216
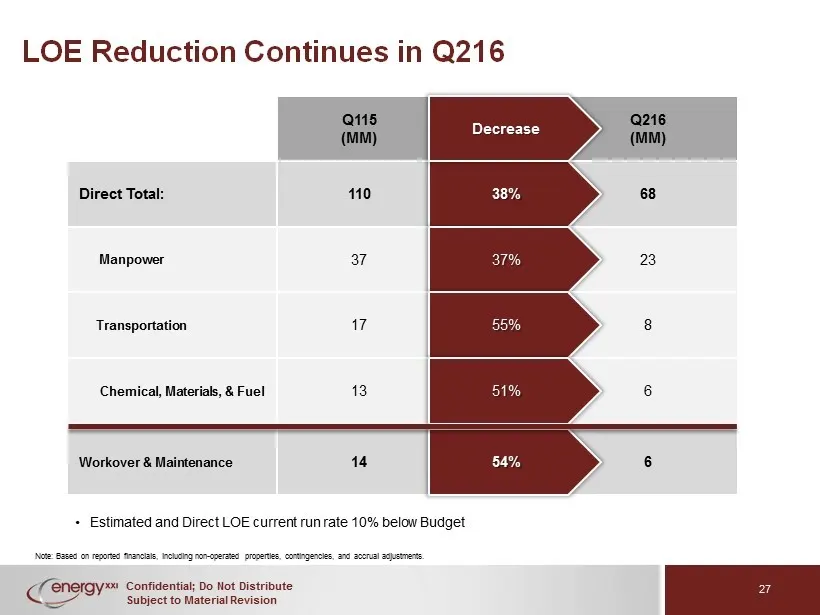
Confidential; Do Not Distribute Subject to Material Revision 27 LOE Reduction Continues in Q216 Note: Based on reported financials, including non - operated properties, contingencies, and accrual adjustments. 68 Direct Total: 110 38% 23 Manpower 37 37% 8 Transportation 17 5 5% Chemical, Materials, &
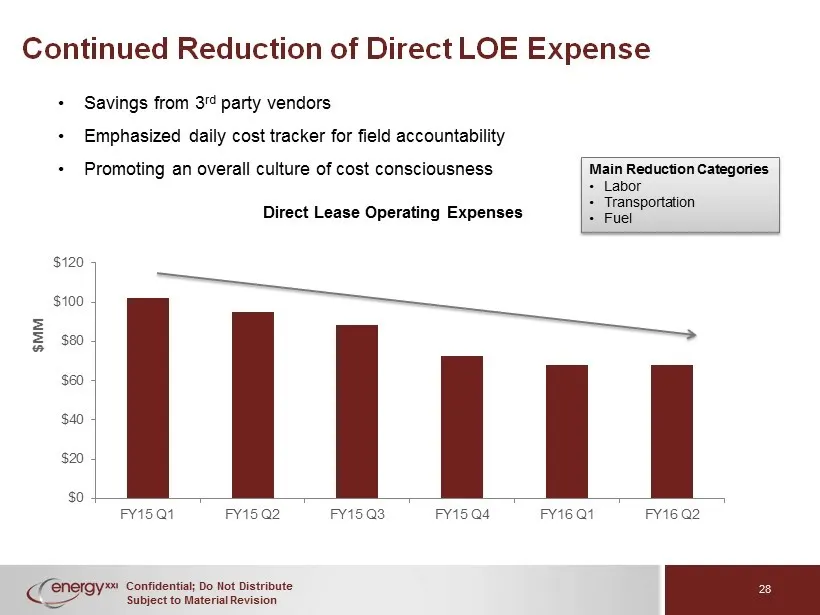
Slide 28: Continued Reduction of Direct LOE Expense
Confidential; Do Not Distribute Subject to Material Revision 28 $0 $20 $40 $60 $80 $100 $120 FY15 Q1 FY15 Q2 FY15 Q3 FY15 Q4 FY16 Q1 FY16 Q2 $MM Direct Lease Operating Expenses • Savings from 3 rd party vendors • Emphasized daily cost tracker for field accountability • Promoting an overall culture o
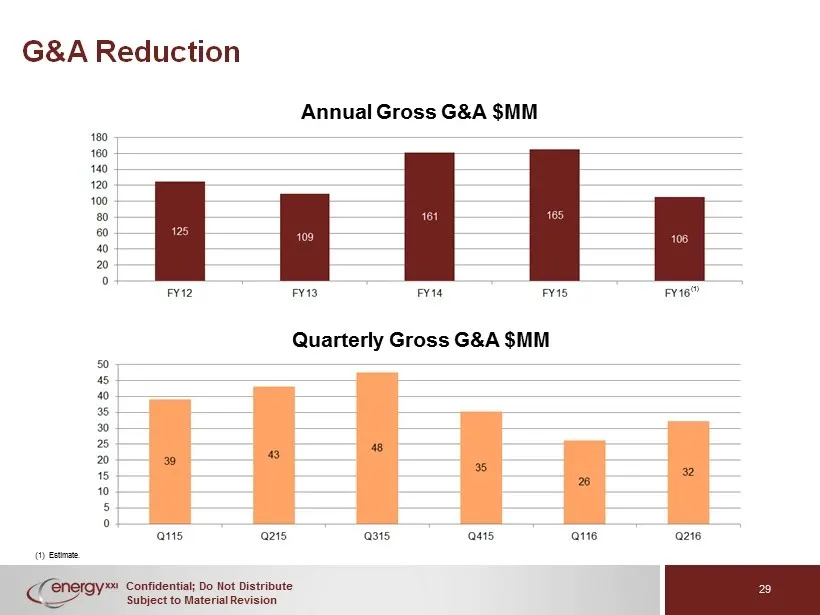
Slide 29: G&A Reduction
Confidential; Do Not Distribute Subject to Material Revision 29 G&A Reduction (1) Estimate. Annual Gross G&A $MM Quarterly Gross G&A $MM (1)
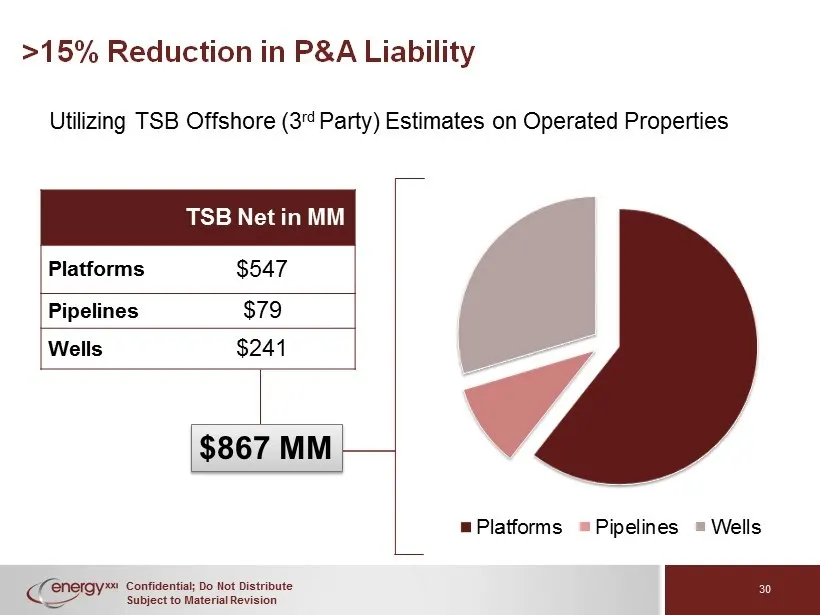
Slide 30: TSB Offshore Estimates on Operated Properties
Confidential; Do Not Distribute Subject to Material Revision Utilizing TSB Offshore (3 rd Party) Estimates on Operated Properties TSB Net in MM Platforms $547 Pipelines $79 Wells $241 Platforms Pipelines Wells $867 MM >15% Reduction in P&A Liability 30
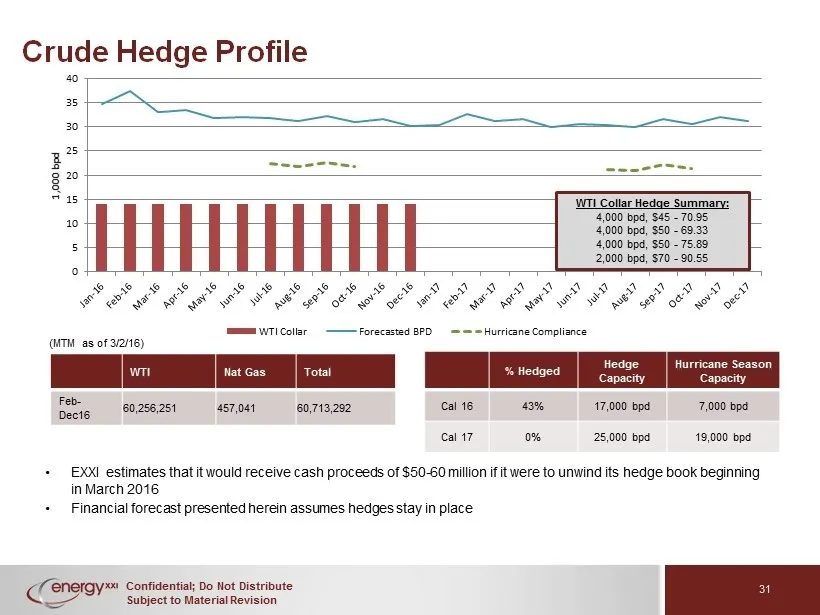
Slide 31: Crude Hedge Profile
Confidential; Do Not Distribute Subject to Material Revision 31 Crude Hedge Profile • EXXI estimates that it would receive cash proceeds of $50 - 60 million if it were to unwind its hedge book beginning in March 2016 • Financial forecast presented herein assumes hedges stay in place 0 5 10 15 20 25
Slide 32: Historical Financials
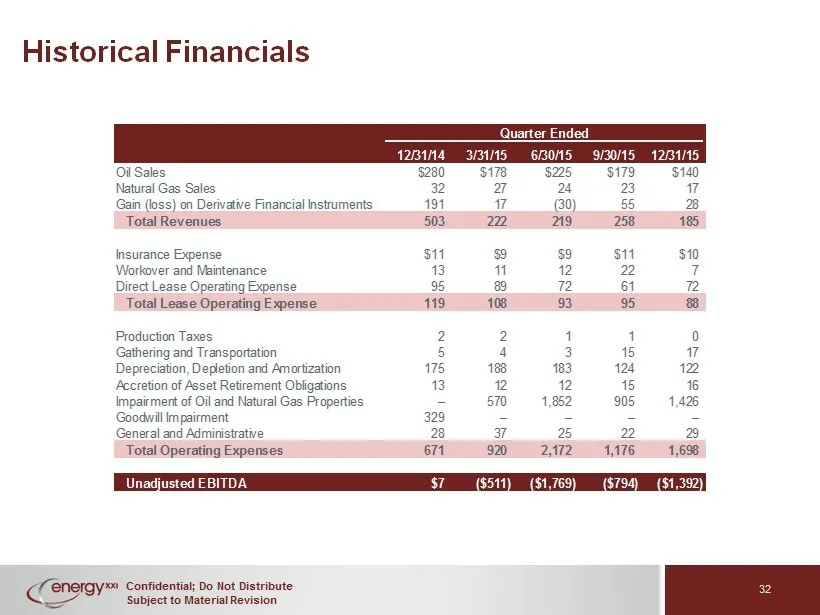
Confidential; Do Not Distribute Subject to Material Revision Historical Financials 32 Quarter Ended 12/31/14 3/31/15 6/30/15 9/30/15 12/31/15 Oil Sales $280 $178 $225 $179 $140 Natural Gas Sales 32 27 24 23 17 Gain (loss) on Derivative Financial Instruments 191 17 (30) 55 28 Total Revenues 503 222 2
Slide 33: IV. BOEM
Confidential; Do Not Distribute Subject to Material Revision IV. BOEM 33
Slide 34: BOEM Timeline
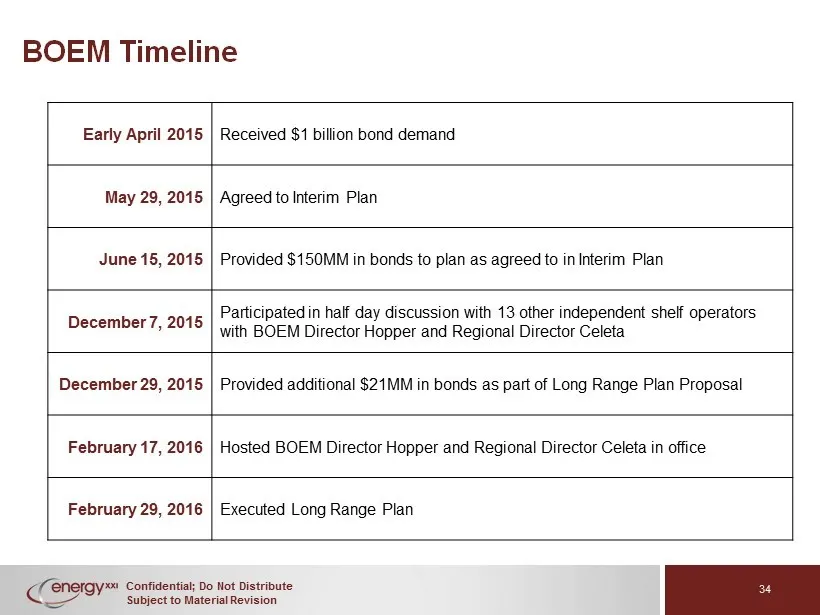
Confidential; Do Not Distribute Subject to Material Revision BOEM Timeline Early April 2015 Received $1 billion bond demand May 29, 2015 Agreed to Interim Plan June 15, 2015 Provided $150MM in bonds to plan as agreed to in Interim Plan December 7, 2015 Participated in half day discussion with 13 oth
Slide 35: Current NTL
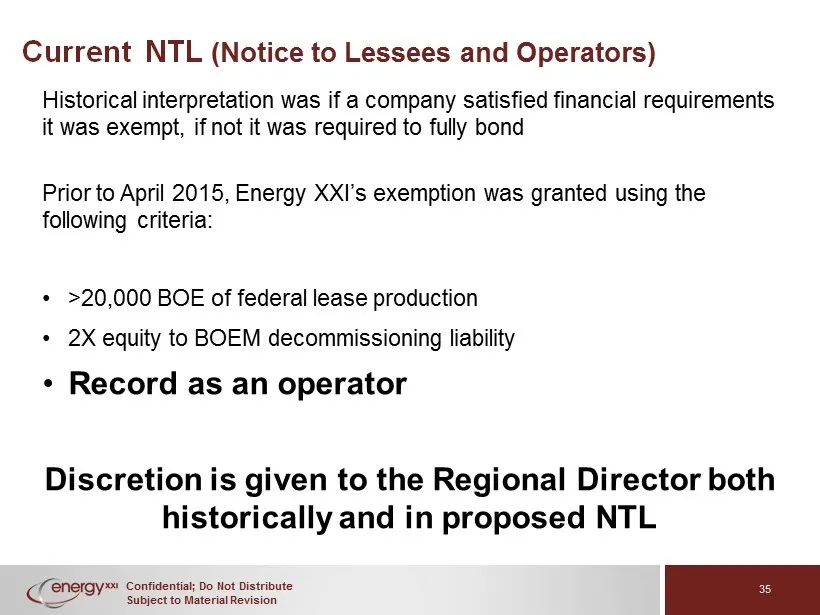
Confidential; Do Not Distribute Subject to Material Revision Current NTL (Notice to Lessees and Operators) Historical interpretation was if a company satisfied financial requirements it was exempt, if not it was required to fully bond Prior to April 2015, Energy XXI’s exemption was granted using the
Slide 36: Years Outperforming HSE Industry Average
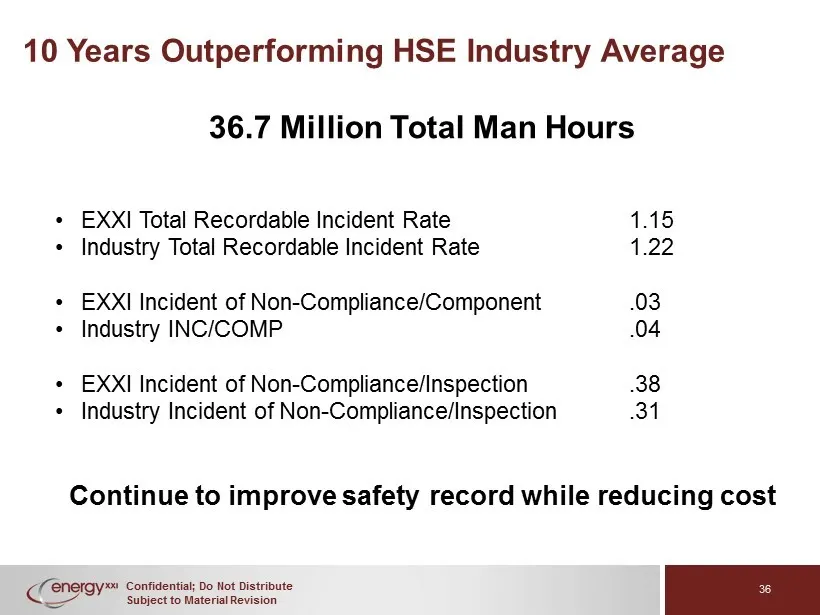
Confidential; Do Not Distribute Subject to Material Revision 10 Years Outperforming HSE Industry Average 36.7 Million Total Man Hours • EXXI Total Recordable Incident Rate 1.15 • Industry Total Recordable Incident Rate 1.22 • EXXI Incident of Non - Compliance/Component .03 • Industry INC/COMP .04 •
Slide 37: Idle Iron
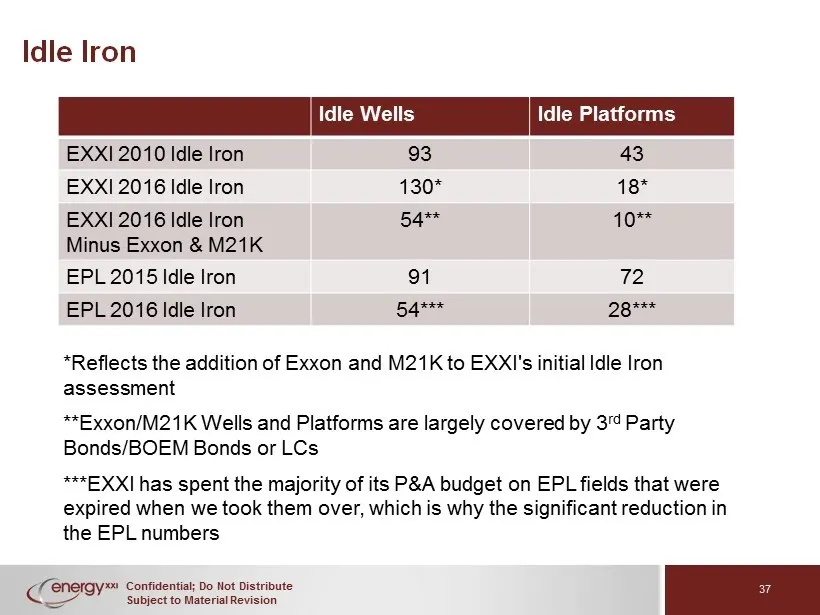
Confidential; Do Not Distribute Subject to Material Revision Idle Iron Idle Wells Idle Platforms EXXI 2010 Idle Iron 93 43 EXXI 2016 Idle Iron 130* 18* EXXI 2016 Idle Iron Minus Exxon & M21K 54** 10** EPL 2015 Idle Iron 91 72 EPL 2016 Idle Iron 54*** 28*** * Reflects the addition of Exxon and M21K t
Slide 38: Historical P&A Expense
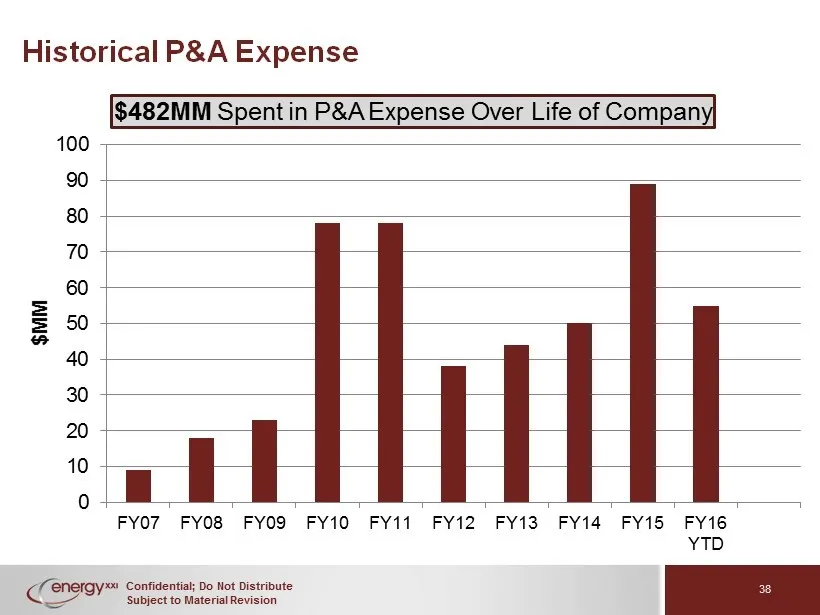
Confidential; Do Not Distribute Subject to Material Revision Historical P&A Expense 0 10 20 30 40 50 60 70 80 90 100 FY07 FY08 FY09 FY10 FY11 FY12 FY13 FY14 FY15 FY16 YTD $MM $482MM Spent in P&A Expense Over Life of Company 38
Slide 39: Five Years of Minimal P&A
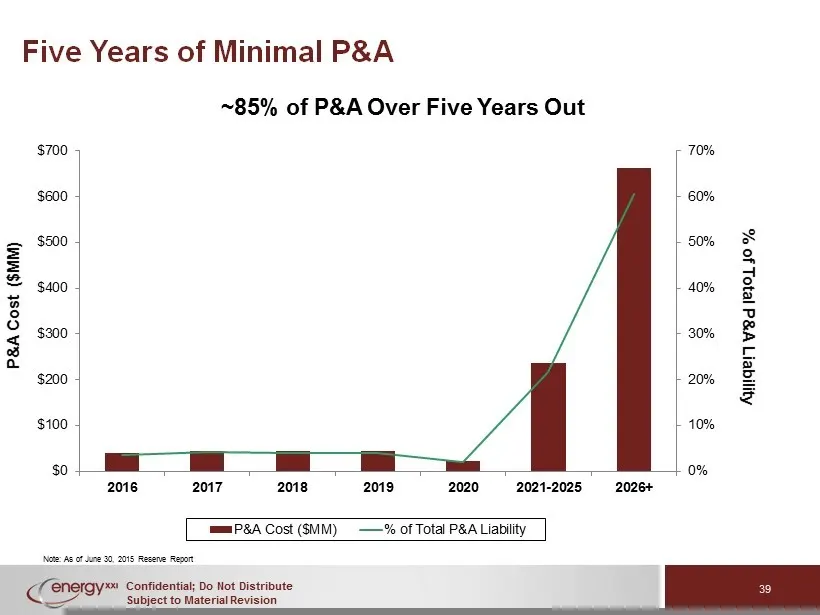
Confidential; Do Not Distribute Subject to Material Revision Five Years of Minimal P&A 0% 10% 20% 30% 40% 50% 60% 70% $0 $100 $200 $300 $400 $500 $600 $700 2016 2017 2018 2019 2020 2021-2025 2026+ % of Total P&A Liability P&A Cost ($MM) P&A Cost ($MM) % of Total P&A Liability ~85% of P&A Over Five Y
Slide 40: New NTL Slides from BOEM Forum
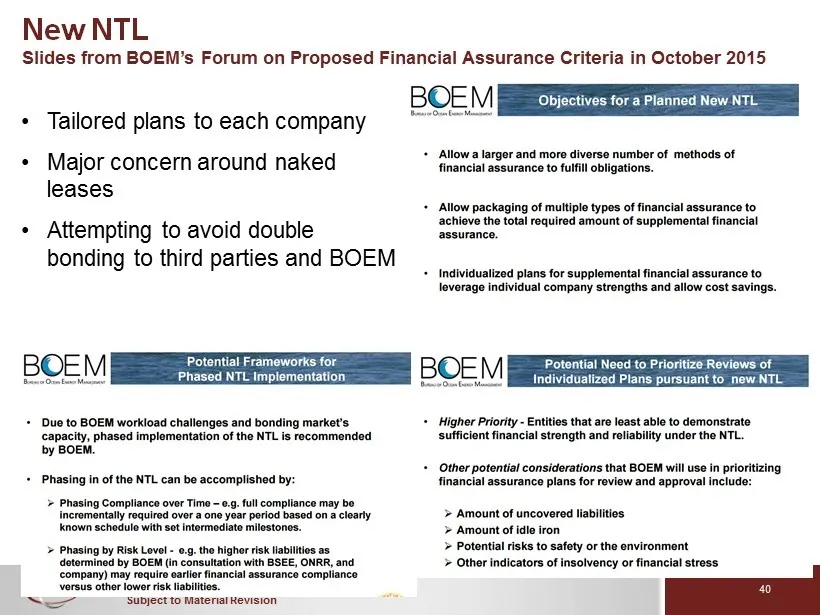
Confidential; Do Not Distribute Subject to Material Revision New NTL Slides from BOEM’s Forum on Proposed Financial Assurance Criteria in October 2015 • Tailored plans to each company • Major concern around naked leases • Attempting to avoid double bonding to third parties and BOEM 40
Slide 41: BOEM's Biggest Concern: Naked Leases
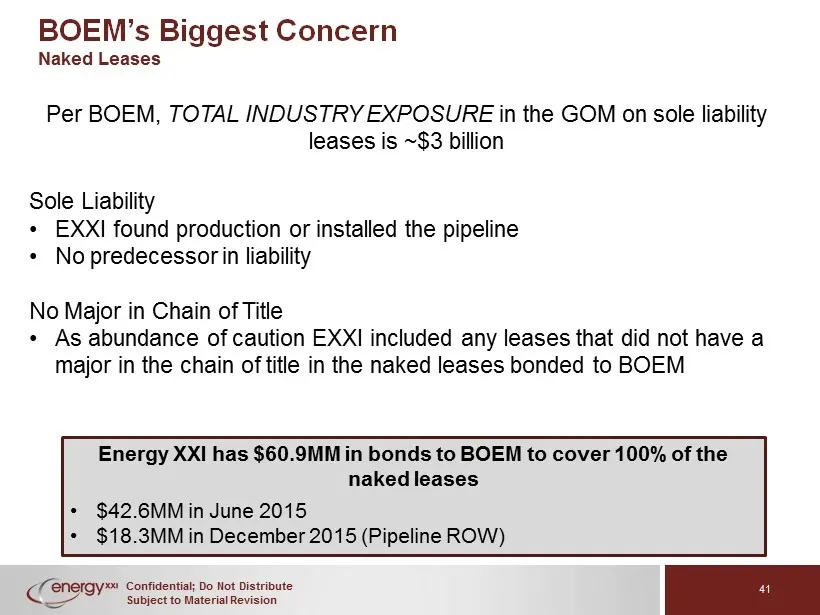
Confidential; Do Not Distribute Subject to Material Revision BOEM’s Biggest Concern Naked Leases Per BOEM, TOTAL INDUSTRY EXPOSURE in the GOM on sole liability leases is ~$3 billion Sole Liability • EXXI found production or installed the pipeline • No predecessor in liability No Major in Chain of Ti
Slide 42: BOEM's Other Concern: Third Party Bonding
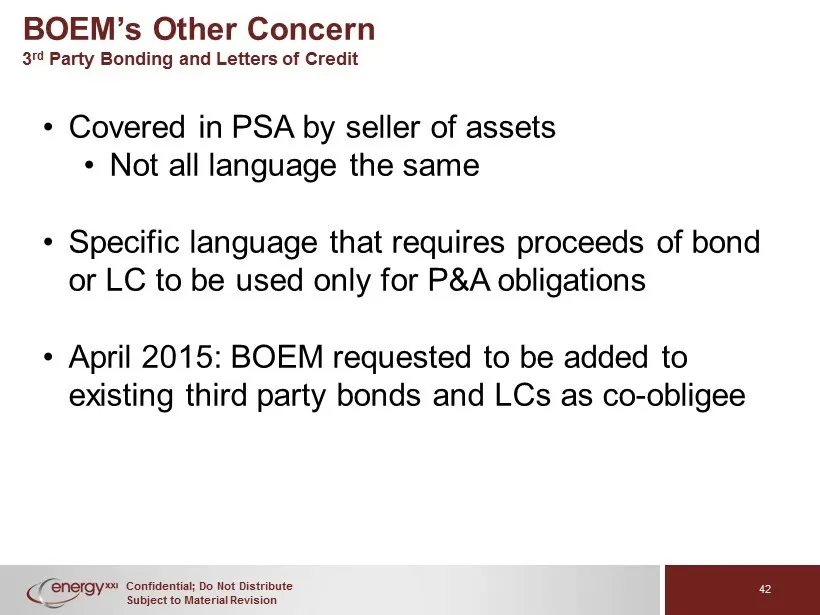
Confidential; Do Not Distribute Subject to Material Revision BOEM’s Other Concern 3 rd Party Bonding and Letters of Credit • Covered in PSA by seller of assets • Not all language the same • Specific language that requires proceeds of bond or LC to be used only for P&A obligations • April 2015: BOEM
Slide 43: BOEM Detail
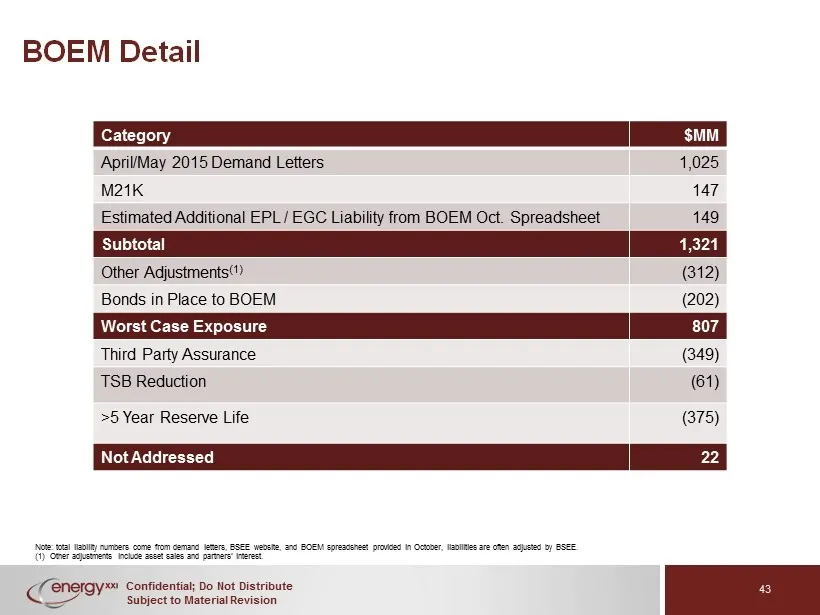
Confidential; Do Not Distribute Subject to Material Revision BOEM Detail Category $MM April/May 2015 Demand Letters 1,025 M21K 147 Estimated Additional EPL / EGC Liability from BOEM Oct. Spreadsheet 149 Subtotal 1,321 Other Adjustments (1) (312) Bonds in Place to BOEM (202) Worst Case Exposure 807 T
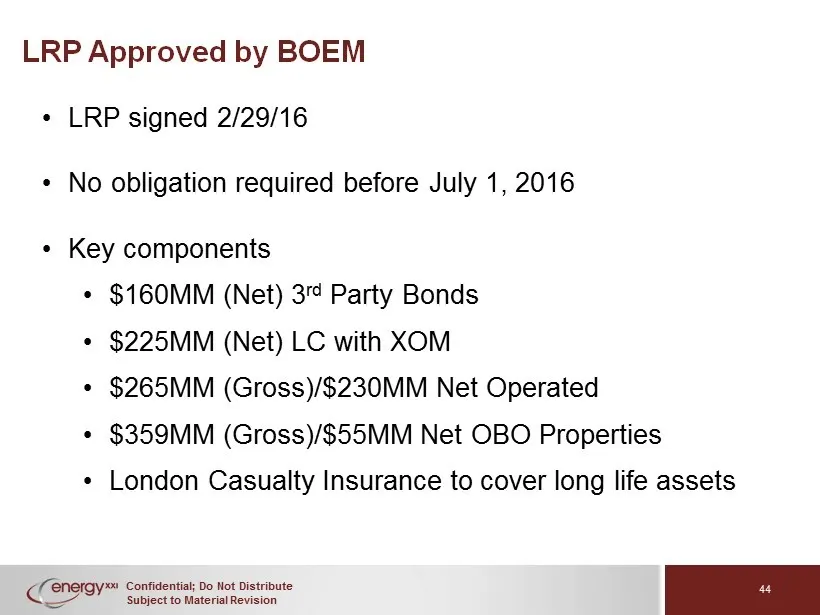
Slide 44: LRP Approved by BOEM
Confidential; Do Not Distribute Subject to Material Revision LRP Approved by BOEM • LRP signed 2/29/16 • No obligation required before July 1, 2016 • Key components • $160MM (Net) 3 rd Party Bonds • $225MM (Net) LC with XOM • $265MM (Gross)/$230MM Net Operated • $359MM (Gross)/$55MM Net OBO Properti
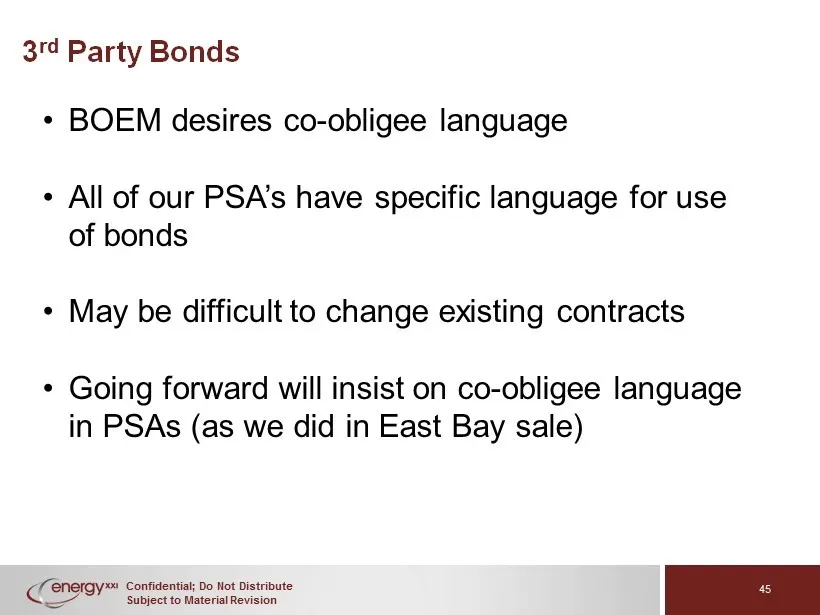
Slide 45: Third Party Bonds
Confidential; Do Not Distribute Subject to Material Revision 3 rd Party Bonds • BOEM desires co - obligee language • All of our PSA’s have specific language for use of bonds • May be difficult to change existing contracts • Going forward will insist on co - obligee language in PSAs (as we did in Eas
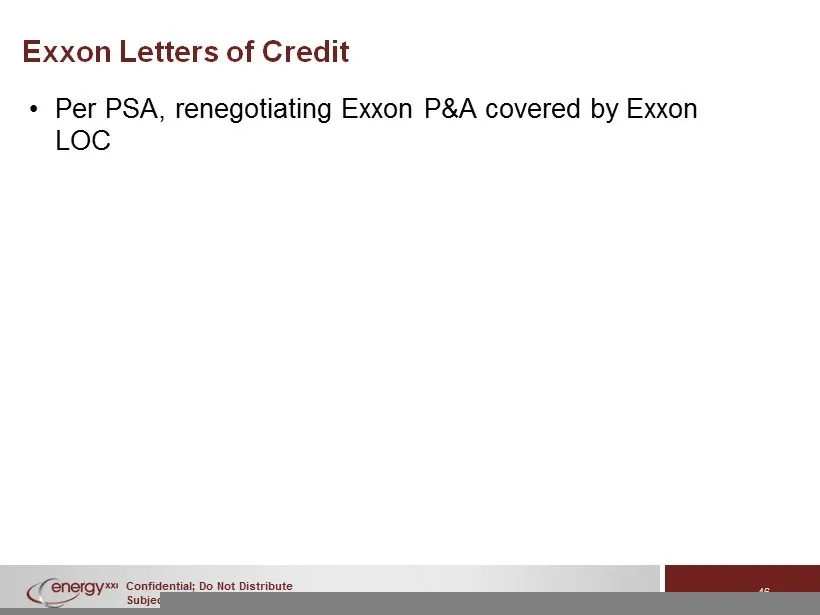
Slide 46: Exxon Letters of Credit
Confidential; Do Not Distribute Subject to Material Revision 46 Exxon Letters of Credit • Per PSA, renegotiating Exxon P&A covered by Exxon LOC
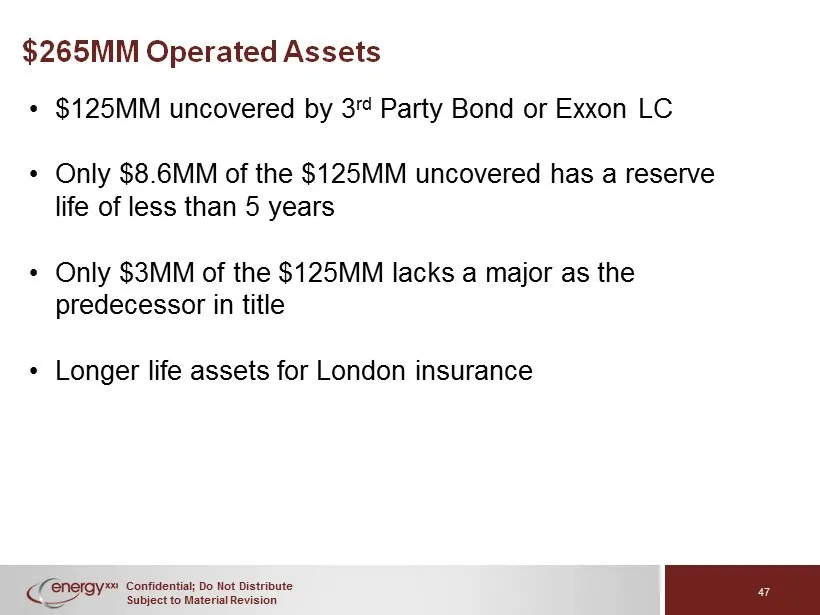
Slide 47: $265MM Operated Assets
Confidential; Do Not Distribute Subject to Material Revision 47 $265MM Operated Assets • $125MM uncovered by 3 rd Party Bond or Exxon LC • Only $8.6MM of the $125MM u ncovered has a reserve life of less than 5 years • Only $3MM of the $125MM lacks a major as the predecessor in title • Longer life as
Slide 48: $359MM OBO Properties
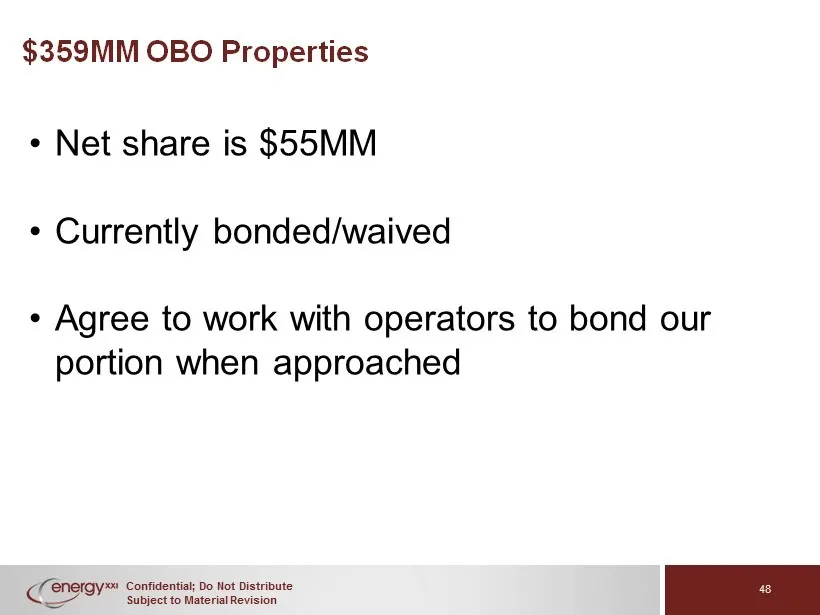
Confidential; Do Not Distribute Subject to Material Revision $359MM OBO Properties • Net share is $55MM • Currently bonded/waived • Agree to work with operators to bond our portion when approached 48
Slide 49: Surety Bonds
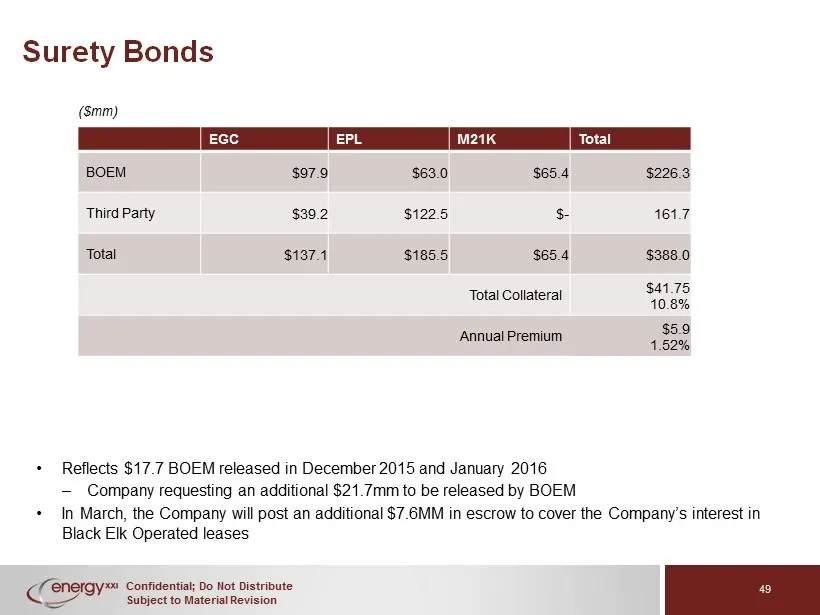
Confidential; Do Not Distribute Subject to Material Revision Surety Bonds • Reflects $17.7 BOEM released in December 2015 and January 2016 – Company requesting an additional $21.7mm to be released by BOEM • In March, the Company will post an additional $7.6MM in escrow to cover the Company’s interes
Slide 50: LRP Status
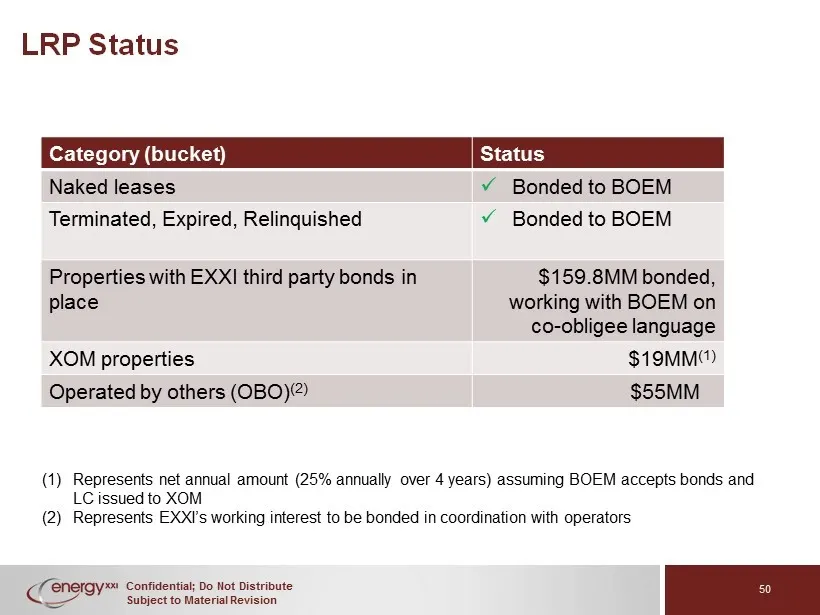
Confidential; Do Not Distribute Subject to Material Revision LRP Status Category (bucket) Status Naked leases x Bonded to BOEM Terminated, Expired, Relinquished x Bonded to BOEM Properties with EXXI third party bonds in place $159.8MM bonded, working with BOEM on co - obligee language XOM properties
Slide 51: V. Reserve Overview
Confidential; Do Not Distribute Subject to Material Revision V. RESERVE OVERVIEW 51
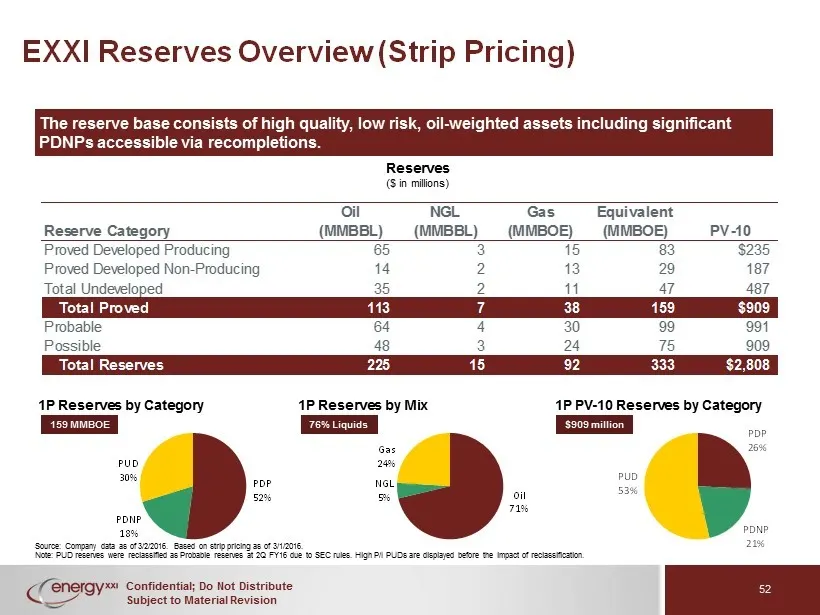
Slide 52: EXXI Reserves Overview (Strip Pricing)
Confidential; Do Not Distribute Subject to Material Revision 52 EXXI Reserves Overview (Strip Pricing) The reserve base consists of high quality, low risk, oil - weighted assets including significant PDNPs accessible via recompletions . Source: Company data as of 3/2/2016 . Based on strip pricing as
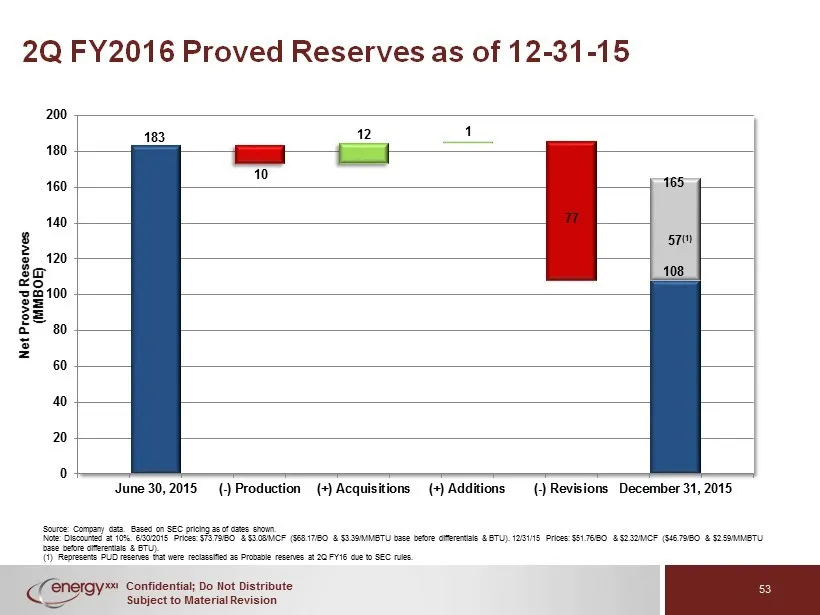
Slide 53: Net Proved Reserves Reconciliation
Confidential; Do Not Distribute Subject to Material Revision 183 108 10 12 1 77 0 20 40 60 80 100 120 140 160 180 200 June 30, 2015 (-) Production (+) Acquisitions (+) Additions (-) Revisions December 31, 2015 Net Proved Reserves (MMBOE) 2Q FY2016 Proved Reserves as of 12 - 31 - 15 53 Source: Compan
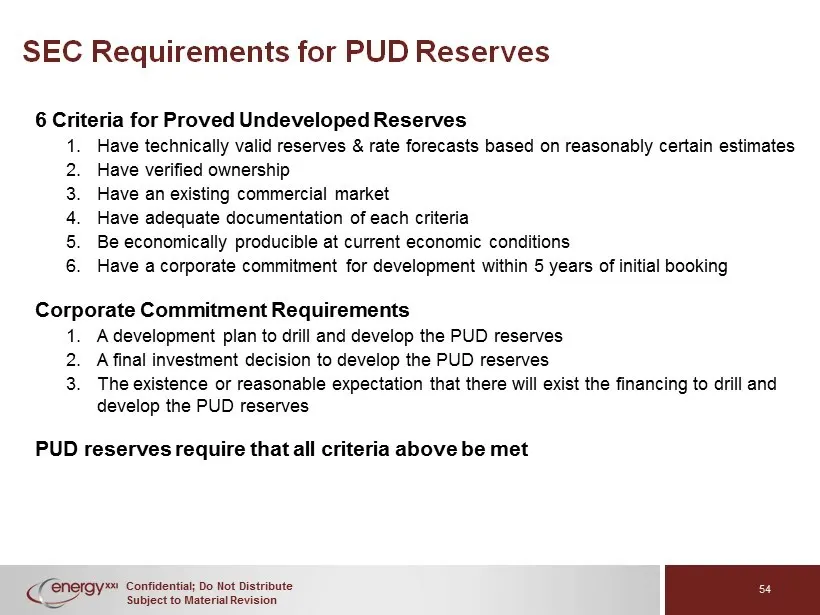
Slide 54: SEC Requirements for PUD Reserves
Confidential; Do Not Distribute Subject to Material Revision SEC Requirements for PUD Reserves 6 Criteria for Proved U ndeveloped R eserves 1. Have technically valid reserves & rate forecasts based on reasonably certain estimates 2. Have verified ownership 3. Have an existing commercial market 4. Ha
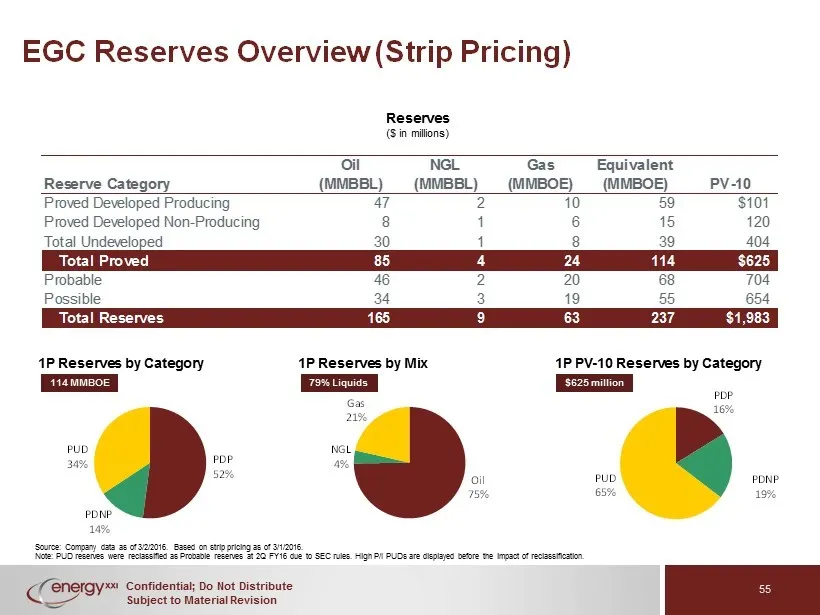
Slide 55: EGC Reserves Overview (Strip Pricing)
Confidential; Do Not Distribute Subject to Material Revision 55 EGC Reserves Overview ( Strip Pricing) PDP 52% PDNP 14% PUD 34% Oil 75% NGL 4% Gas 21% PDP 16% PDNP 19% PUD 65% 1P Reserves by Mix 1P PV - 10 Reserves by Category $625 million 1P Reserves by Category Reserves ($ in millions) 79% Liquids
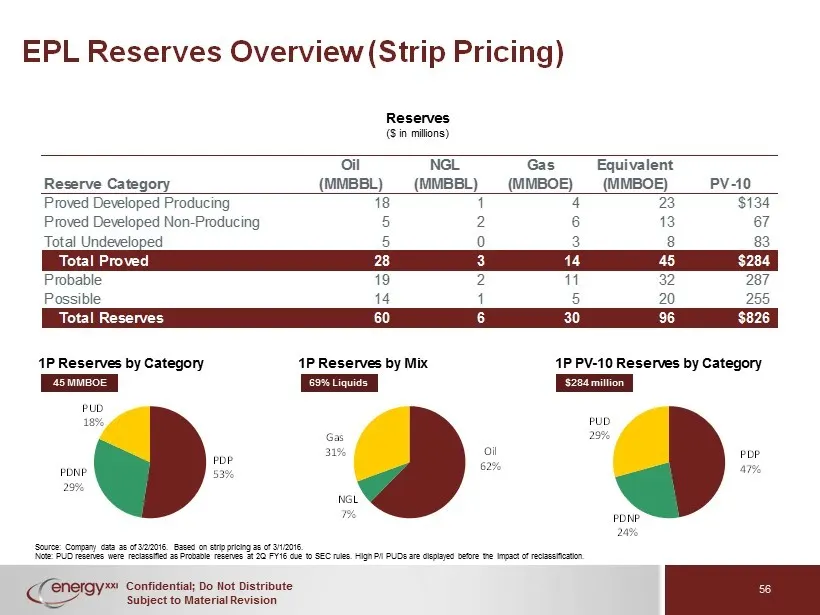
Slide 56: EPL Reserves Overview (Strip Pricing)
Confidential; Do Not Distribute Subject to Material Revision PDP 47% PDNP 24% PUD 29% 56 EPL Reserves Overview (Strip Pricing) PDP 53% PDNP 29% PUD 18% Oil 62% NGL 7% Gas 31% Reserves ($ in millions) 69% Liquids 45 MMBOE 1P Reserves by Mix 1P PV - 10 Reserves by Category $284 million 1P Reserves by
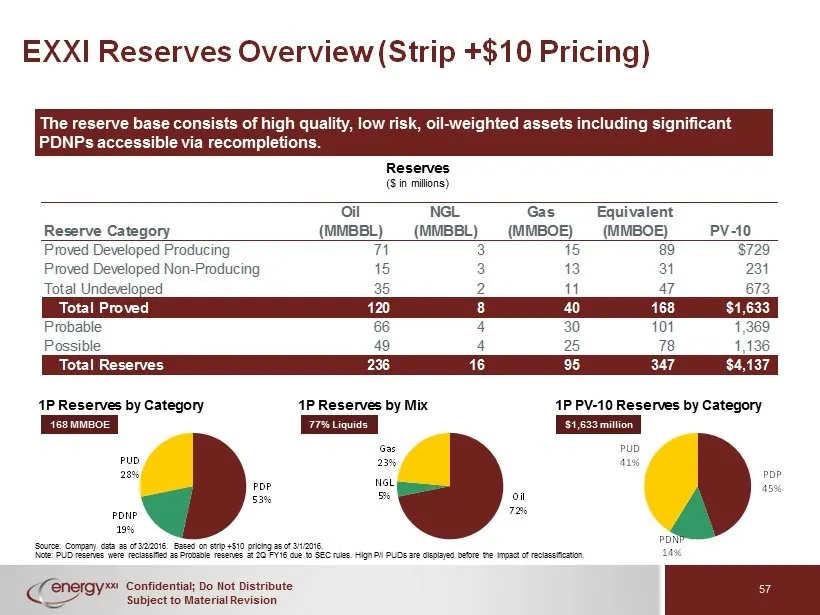
Slide 57: EXXI Reserves Overview (Strip +$10 Pricing)
Confidential; Do Not Distribute Subject to Material Revision 57 EXXI Reserves Overview (Strip +$10 Pricing) The reserve base consists of high quality, low risk, oil - weighted assets including significant PDNPs accessible via recompletions . Source: Company data as of 3/2/2016 . Based on strip +$10
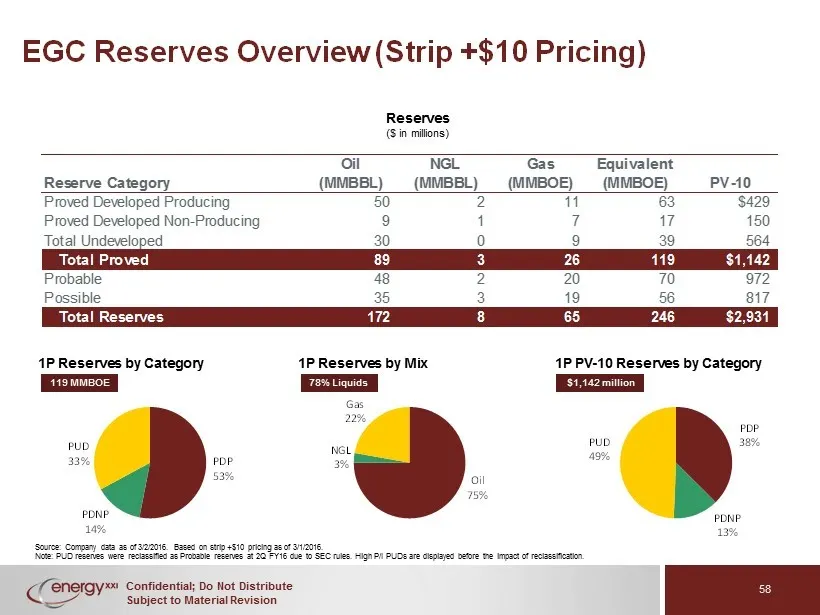
Slide 58: EGC Reserves Overview (Strip +$10 Pricing)
Confidential; Do Not Distribute Subject to Material Revision 58 EGC Reserves Overview (Strip +$10 Pricing) PDP 53% PDNP 14% PUD 33% Oil 75% NGL 3% Gas 22% PDP 38% PDNP 13% PUD 49% 1P Reserves by Mix 1P PV - 10 Reserves by Category $1,142 million 1P Reserves by Category Reserves ($ in millions) 78% L
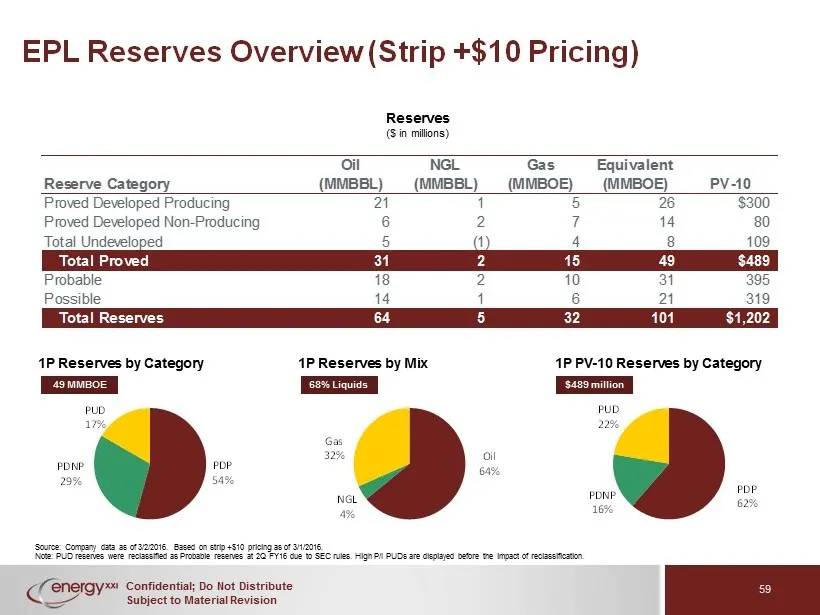
Slide 59: EPL Reserves Overview (Strip +$10 Pricing)
Confidential; Do Not Distribute Subject to Material Revision PDP 62% PDNP 16% PUD 22% 59 EPL Reserves Overview (Strip +$10 Pricing) PDP 54% PDNP 29% PUD 17% Oil 64% NGL 4% Gas 32% Reserves ($ in millions) 68% Liquids 49 MMBOE 1P Reserves by Mix 1P PV - 10 Reserves by Category $489 million 1P Reserve
Slide 60: Recompletion Opportunities Identified
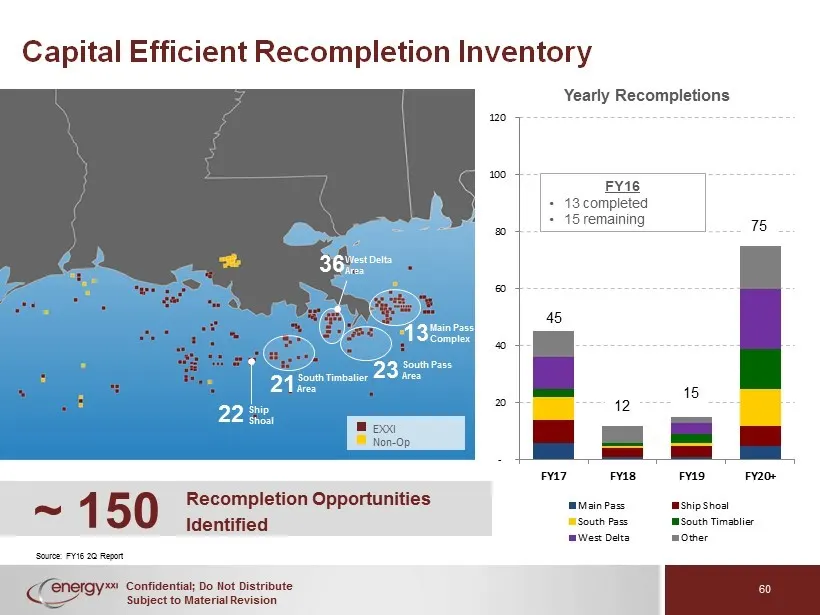
Confidential; Do Not Distribute Subject to Material Revision 60 ~ 150 Recompletion Opportunities Identified Yearly Recompletions West Delta Area South Pass Area South Timbalier Area EXXI Non - Op Main Pass Complex 13 23 36 21 22 Ship Shoal Capital Efficient Recompletion Inventory - 20 40 60 80 100 1
Slide 61: FY16 Recompletions Generate Uplift
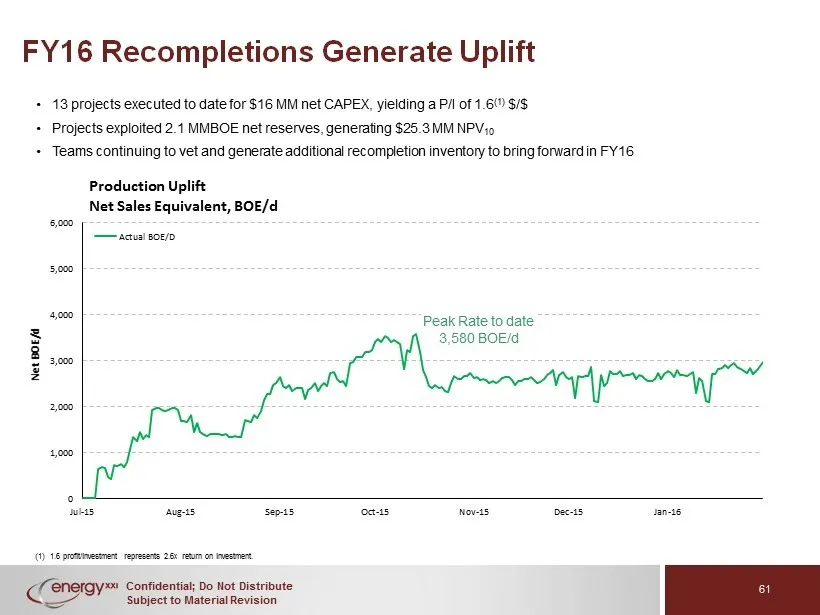
Confidential; Do Not Distribute Subject to Material Revision 61 FY16 Recompletions Generate Uplift • 13 projects executed to date for $16 MM net CAPEX, yielding a P/I of 1.6 (1) $/$ • Projects exploited 2.1 MMBOE net reserves, generating $25.3 MM NPV 10 • Teams continuing to vet and generate additio
Slide 62: Recompletions Deliver Record Production
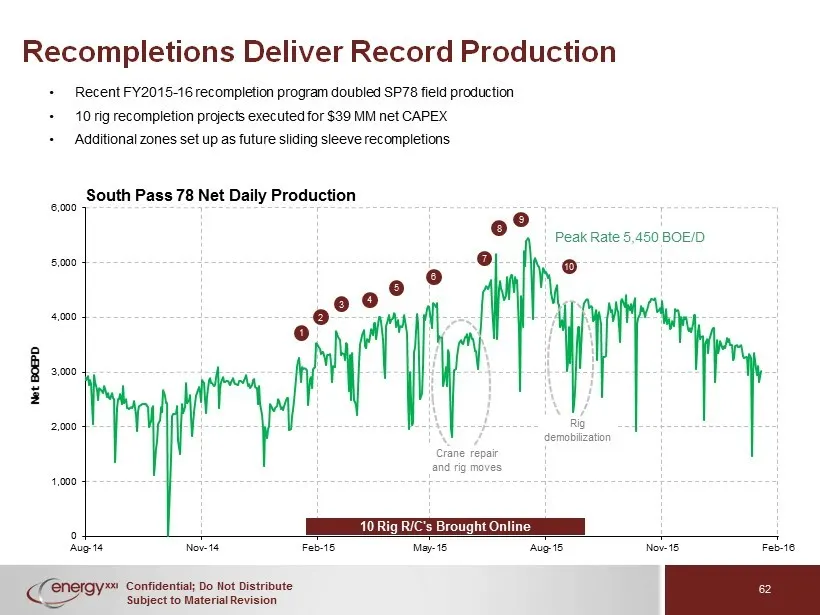
Confidential; Do Not Distribute Subject to Material Revision Recompletions Deliver Record Production • Recent FY2015 - 16 recompletion program doubled SP78 field production • 10 rig recompletion projects executed for $39 MM net CAPEX • Additional zones set up as future sliding sleeve recompletions 6
Slide 63: EXXI Drilling Inventory
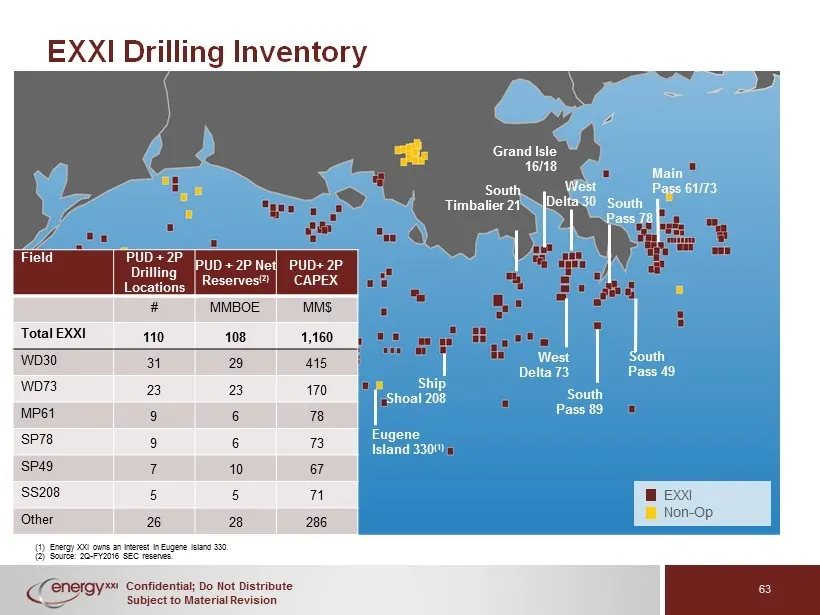
Confidential; Do Not Distribute Subject to Material Revision Grand Isle 16/18 West Delta 30 South Timbalier 21 West Delta 73 South Pass 49 South Pass 78 Ship Shoal 208 Eugene Island 330 (1) South Pass 89 Main Pass 61/73 63 EXXI Drilling Inventory (1) Energy XXI owns an interest in Eugene Island 330.
Slide 64: VI. Major Fields Overview
Confidential; Do Not Distribute Subject to Material Revision VI. MAJOR FIELDS OVERVIEW 64
Slide 65: EXXI Asset Overview
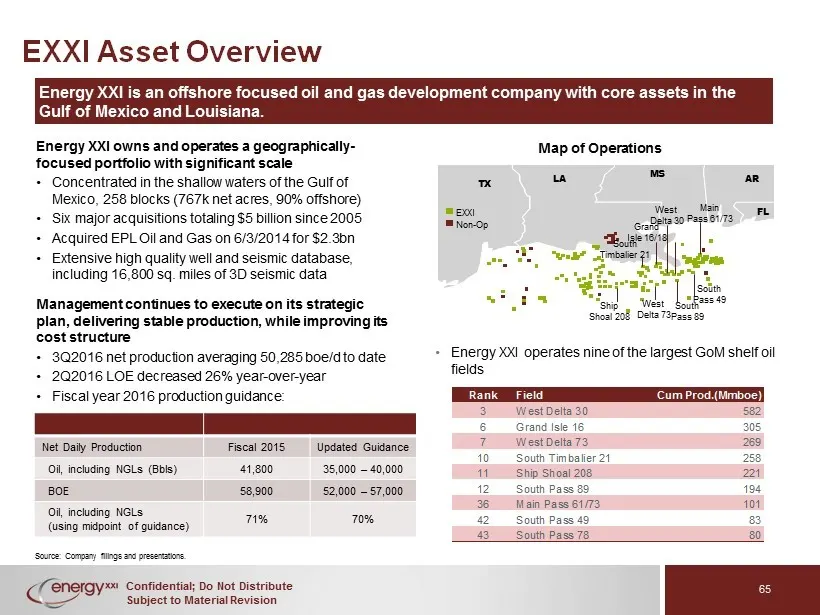
Confidential; Do Not Distribute Subject to Material Revision 65 EXXI Asset Overview Energy XXI is an offshore focused oil and gas development company with core assets in the Gulf of Mexico and Louisiana. Energy XXI owns and operates a geographically - focused portfolio with significant scale • Conce
Slide 66: West Delta 30 Overview
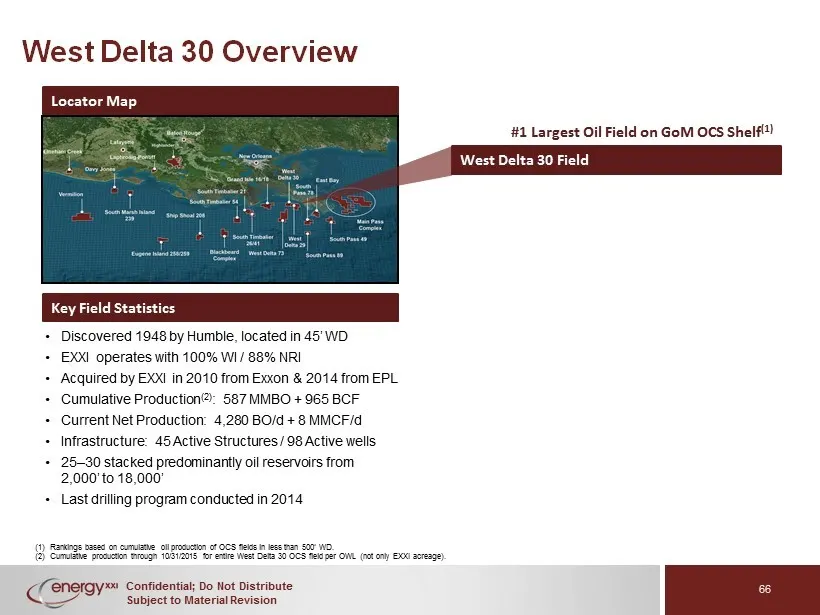
Confidential; Do Not Distribute Subject to Material Revision 66 West Delta 30 Overview (1) Rankings based on cumulative oil production of OCS fields in less than 500’ WD. (2) Cumulative production through 10/31/2015 for entire West Delta 30 OCS field per OWL (not only EXXI acreage). • Discovered 194
Slide 67: WD 30: Field Production
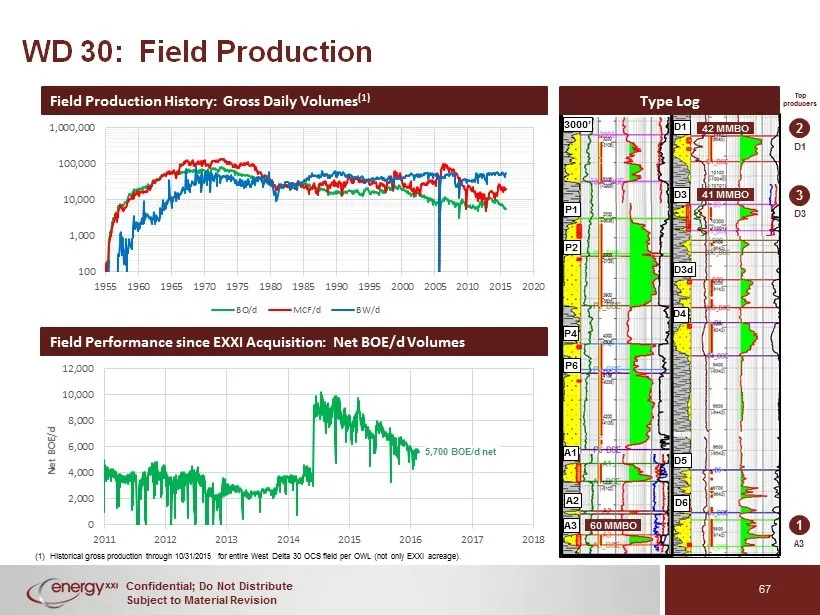
Confidential; Do Not Distribute Subject to Material Revision 0 2,000 4,000 6,000 8,000 10,000 12,000 2011 2012 2013 2014 2015 2016 2017 2018 Net BOE/d 67 WD 30: Field Production (1) Historical gross production through 10/31/2015 for entire West Delta 30 OCS field per OWL (not only EXXI acreage ). Fi
Slide 68: West Delta 73 Overview
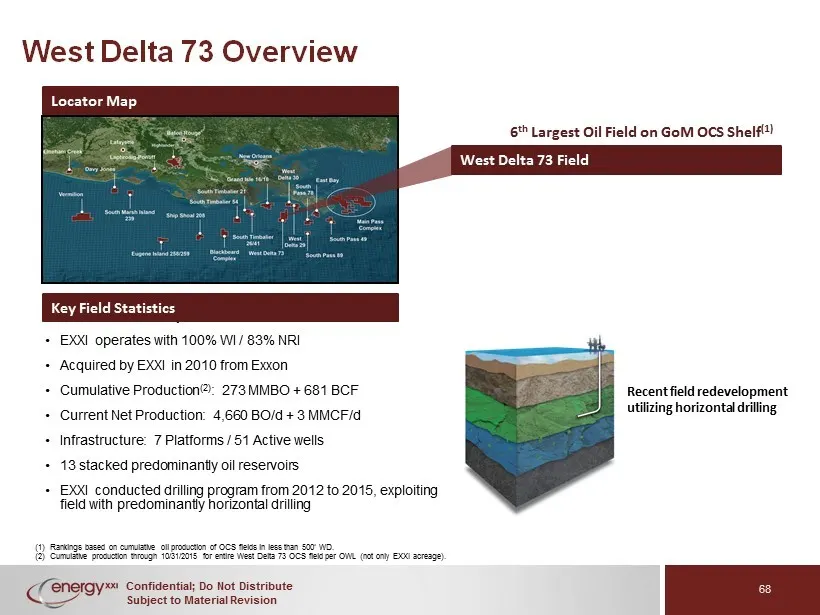
Confidential; Do Not Distribute Subject to Material Revision 68 West Delta 73 Overview (1) Rankings based on cumulative oil production of OCS fields in less than 500’ WD. (2) Cumulative production through 10/31/2015 for entire West Delta 73 OCS field per OWL (not only EXXI acreage ). • Discovered 19
Slide 69: WD 73: Field Production
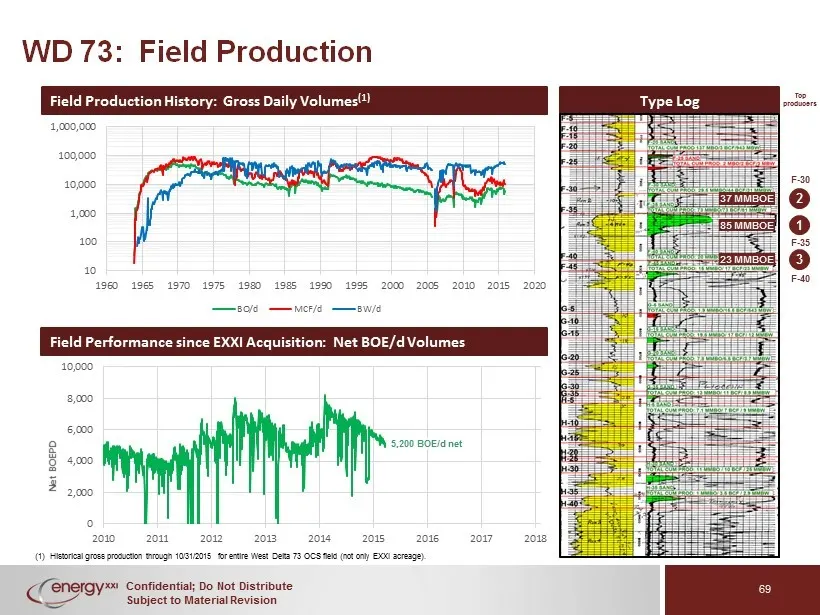
Confidential; Do Not Distribute Subject to Material Revision 0 2,000 4,000 6,000 8,000 10,000 2010 2011 2012 2013 2014 2015 2016 2017 2018 Net BOEPD 69 WD 73: Field Production (1) Historical gross production through 10/31/2015 for entire West Delta 73 OCS field ( not only EXXI acreage ). Field Produ
Slide 70: Main Pass Area Overview
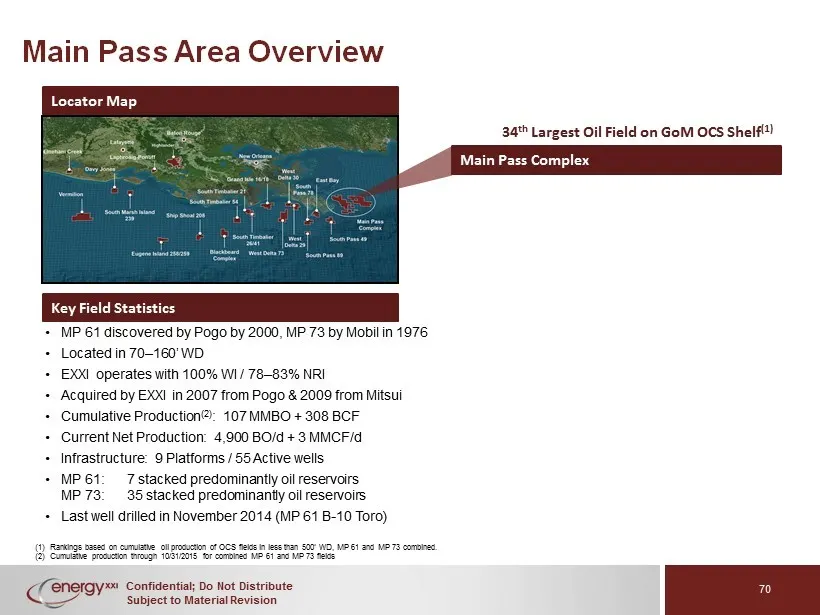
Confidential; Do Not Distribute Subject to Material Revision 70 Main Pass Area Overview (1) Rankings based on cumulative oil production of OCS fields in less than 500’ WD, MP 61 and MP 73 combined. (2) Cumulative production through 10/31/2015 for combined MP 61 and MP 73 fields • MP 61 discovered by
Slide 71: Main Pass Area: Field Production
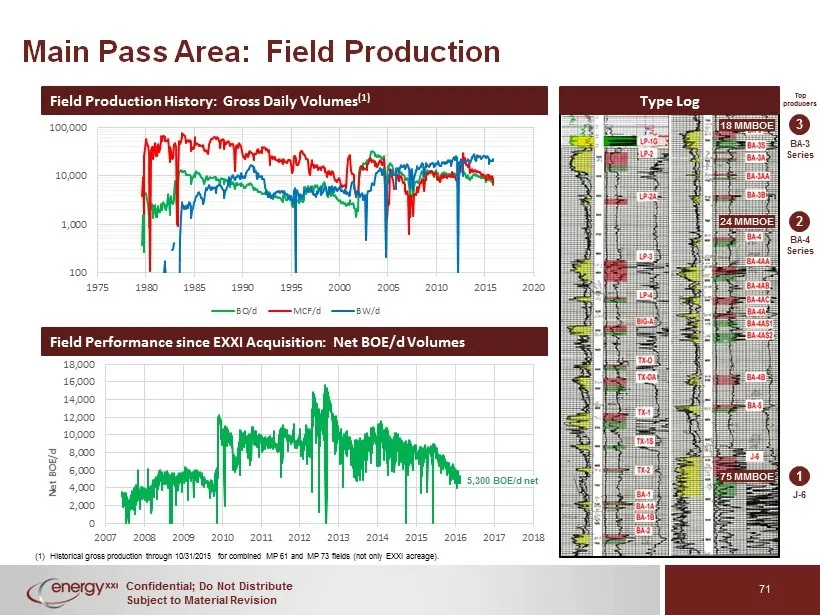
Confidential; Do Not Distribute Subject to Material Revision 0 2,000 4,000 6,000 8,000 10,000 12,000 14,000 16,000 18,000 2007 2008 2009 2010 2011 2012 2013 2014 2015 2016 2017 2018 Net BOE/d 71 Main Pass Area: Field Production (1) Historical gross production through 10/31/2015 for combined MP 61 an
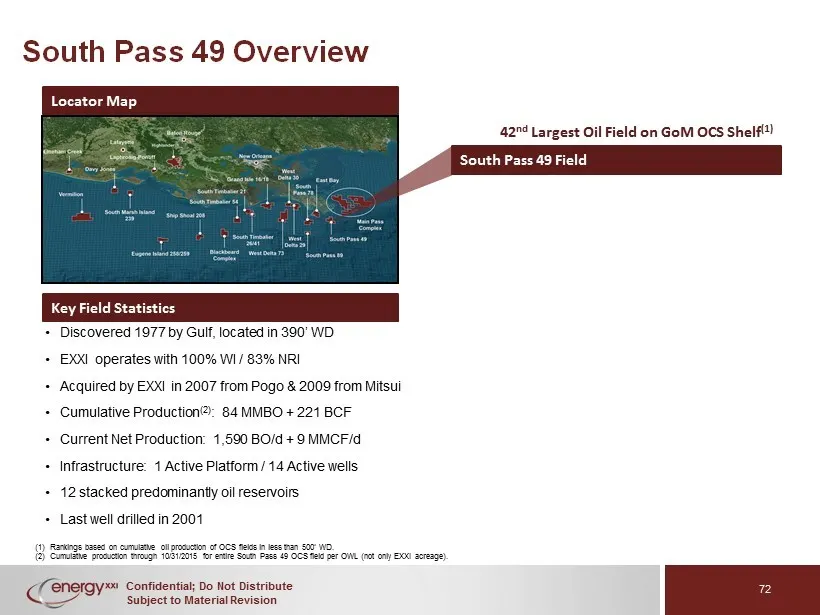
Slide 72: South Pass Overview
Confidential; Do Not Distribute Subject to Material Revision 72 South Pass 49 Overview (1) Rankings based on cumulative oil production of OCS fields in less than 500’ WD. (2) Cumulative production through 10/31/2015 for entire South Pass 49 OCS field per OWL (not only EXXI acreage ). • Discovered 19
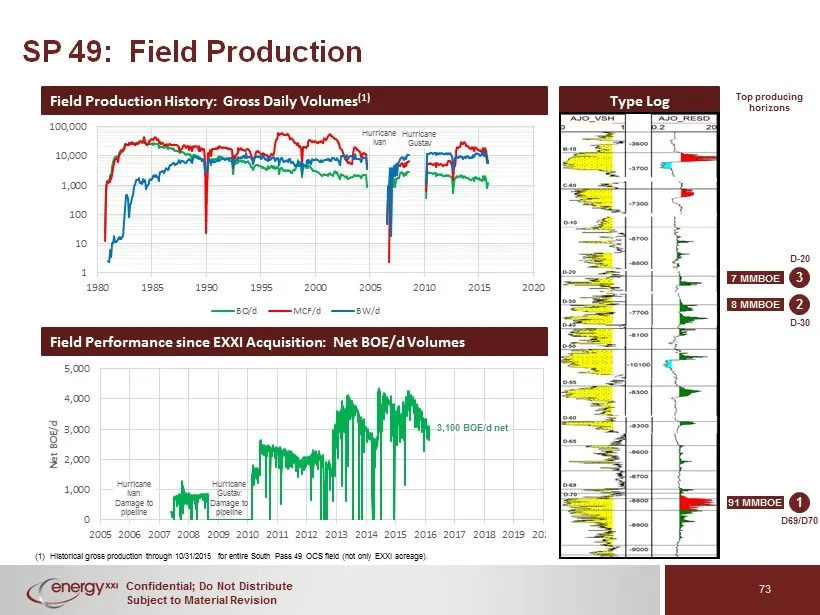
Slide 73: SP 49: Field Production
Confidential; Do Not Distribute Subject to Material Revision 0 1,000 2,000 3,000 4,000 5,000 2005 2006 2007 2008 2009 2010 2011 2012 2013 2014 2015 2016 2017 2018 2019 2020 Net BOE/d 1 10 100 1,000 10,000 100,000 1980 1985 1990 1995 2000 2005 2010 2015 2020 BO/d MCF/d BW/d 73 SP 49: Field Production
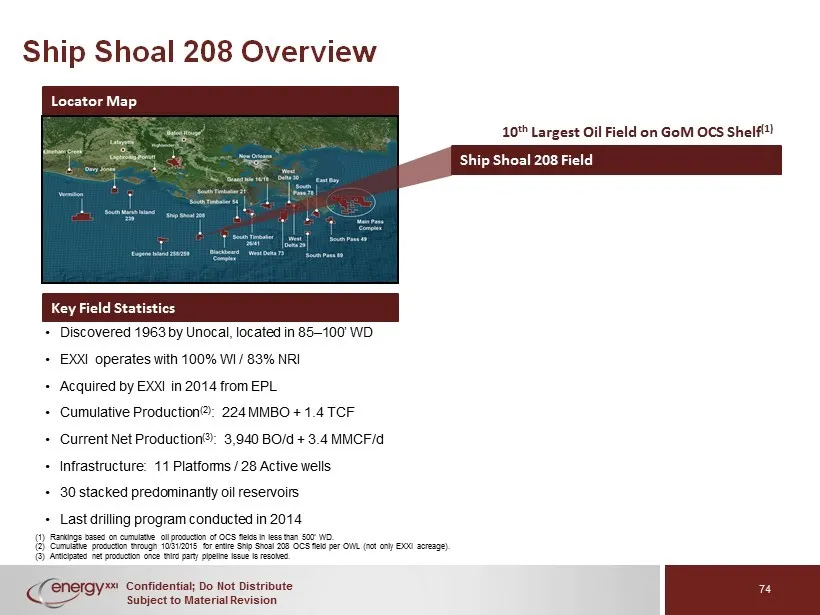
Slide 74: Ship Shoal Overview
Confidential; Do Not Distribute Subject to Material Revision 74 Ship Shoal 208 Overview (1) Rankings based on cumulative oil production of OCS fields in less than 500’ WD. (2) Cumulative production through 10/31/2015 for entire Ship Shoal 208 OCS field per OWL (not only EXXI acreage ). (3) Anticipat
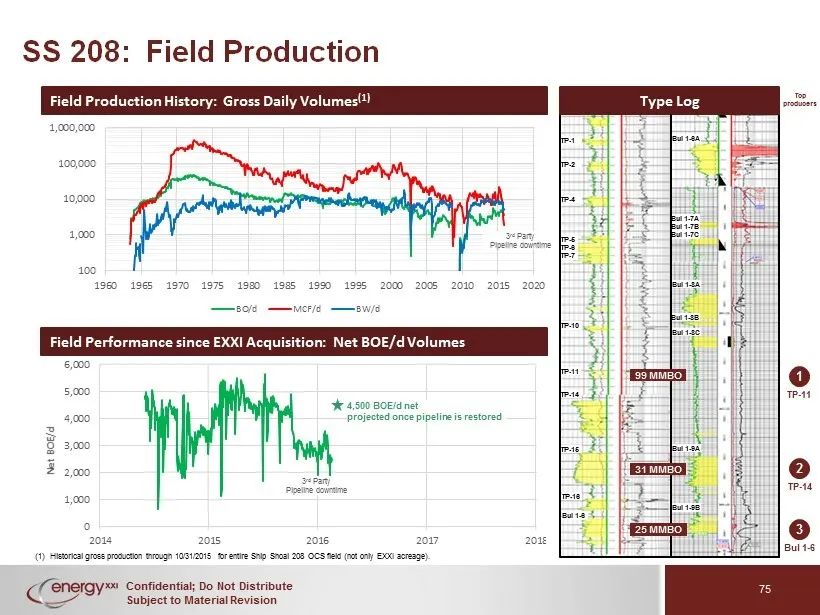
Slide 75: SS 208: Field Production
Confidential; Do Not Distribute Subject to Material Revision 0 1,000 2,000 3,000 4,000 5,000 6,000 2014 2015 2016 2017 2018 Net BOE/d 75 SS 208: Field Production (1) Historical gross production through 10/31/2015 for entire Ship Shoal 208 OCS field ( not only EXXI acreage ). Field Production History
Slide 76: South Timbalier Overview
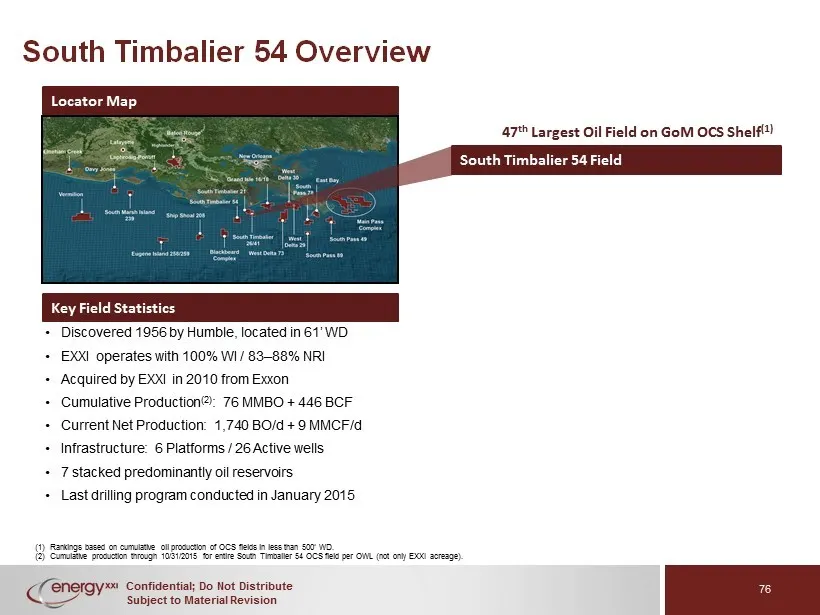
Confidential; Do Not Distribute Subject to Material Revision 76 South Timbalier 54 Overview (1) Rankings based on cumulative oil production of OCS fields in less than 500’ WD. (2) Cumulative production through 10/31/2015 for entire South Timbalier 54 OCS field per OWL (not only EXXI acreage). • Disc
Slide 77: ST 54: Field Production
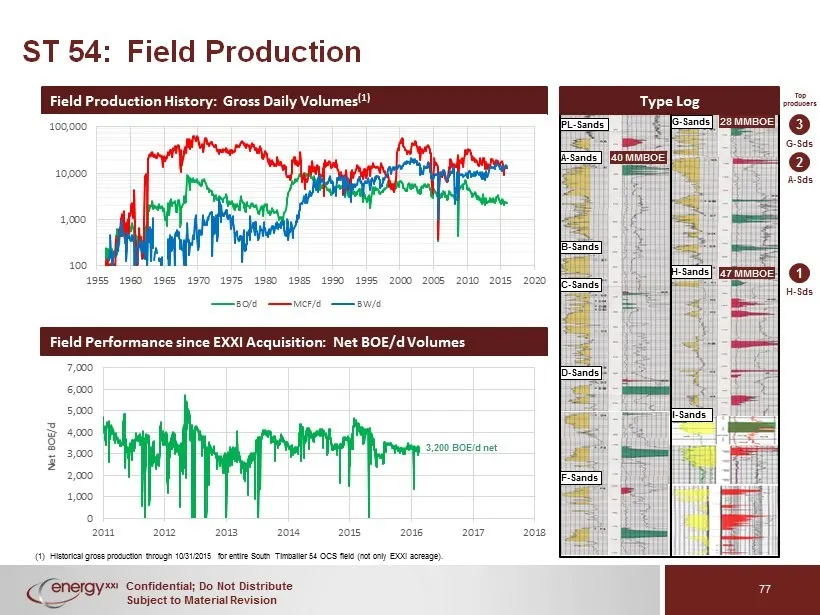
Confidential; Do Not Distribute Subject to Material Revision 0 1,000 2,000 3,000 4,000 5,000 6,000 7,000 2011 2012 2013 2014 2015 2016 2017 2018 Net BOE/d 77 ST 54: Field Production (1) Historical gross production through 10/31/2015 for entire South Timbalier 54 OCS field (not only EXXI acreage ). F
Slide 78: VII. Exploration Potential
Confidential; Do Not Distribute Subject to Material Revision VII . EXPLORATION POTENTIAL 78
Slide 79: Exploration Portfolio
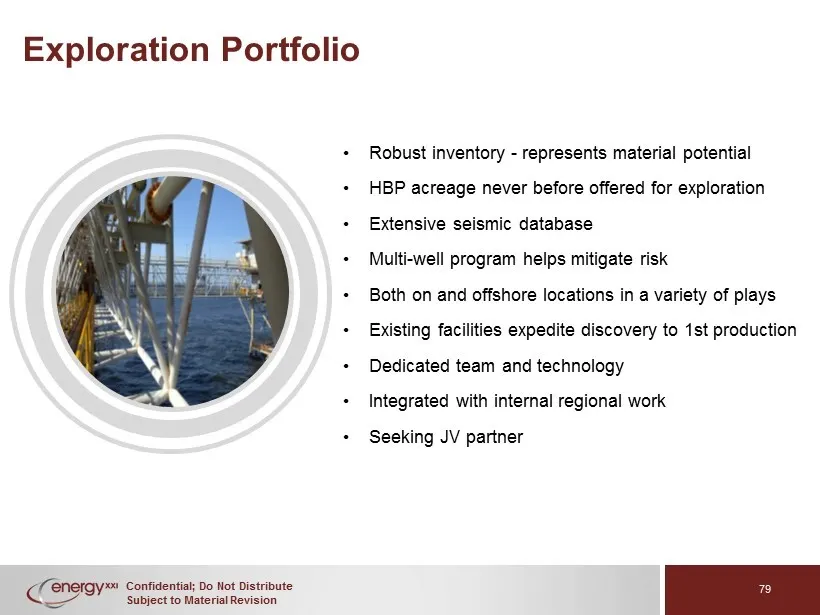
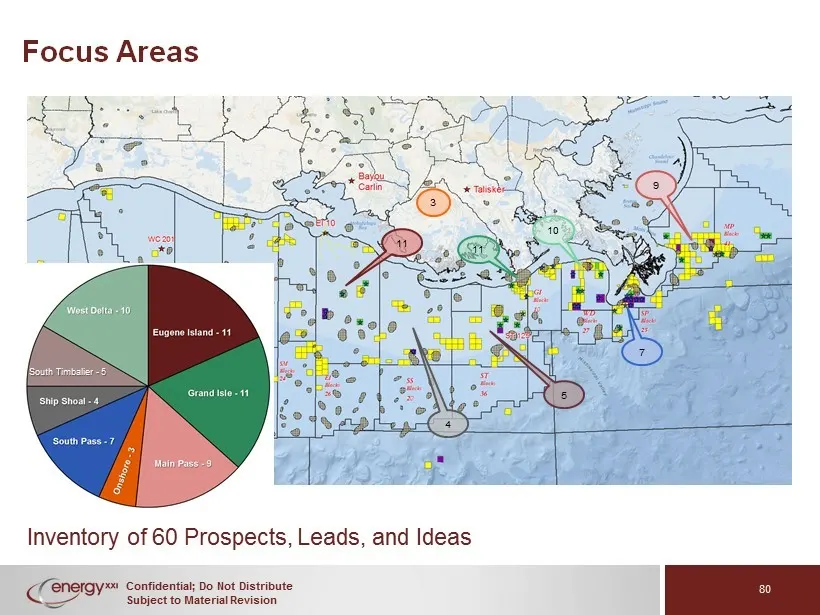
Confidential; Do Not Distribute Subject to Material Revision 79 Exploration Portfolio • Robust inventory - represents material potential • HBP acreage never before offered for exploration • Extensive seismic database • Multi - well program helps mitigate risk • Both on and offshore locations in a va
Slide 80: Focus Areas
Confidential; Do Not Distribute Subject to Material Revision 11 80 Focus Areas 10 11 3 9 7 5 4 Inventory of 60 Prospects, Leads, and Ideas South Timbalier - 5
Slide 81: Appendix
Confidential; Do Not Distribute Subject to Material Revision APPENDIX 81
Slide 82: Detailed Organizational Structure
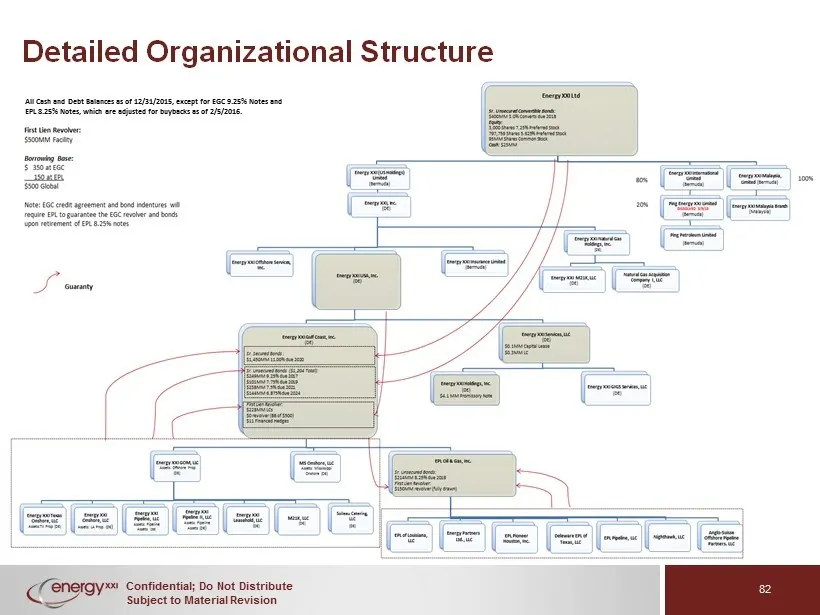
Confidential; Do Not Distribute Subject to Material Revision 82 Detailed Organizational Structure All Cash and Debt Balances as of 12/31/2015, except for EGC 9.25% Notes and EPL 8.25% Notes, which are adjusted for buybacks as of 2/5/2016.
Slide 83: Midstream: Central Operations Map
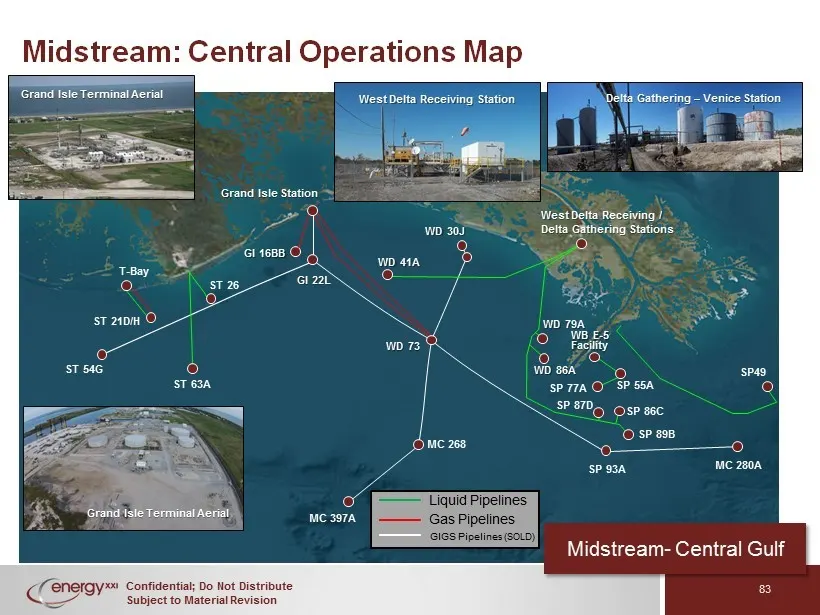
Confidential; Do Not Distribute Subject to Material Revision Midstream: Central Operations Map 83 Grand Isle Station GI 22L ST 54G WB E - 5 Facility WD 73 MC 268 MC 397A SP 77A SP 93A MC 280A WD 30J ST 21D/H ST 63A WD 41A West Delta Receiving / Delta Gathering Stations WD 79A WD 86A SP 89B SP 86C SP
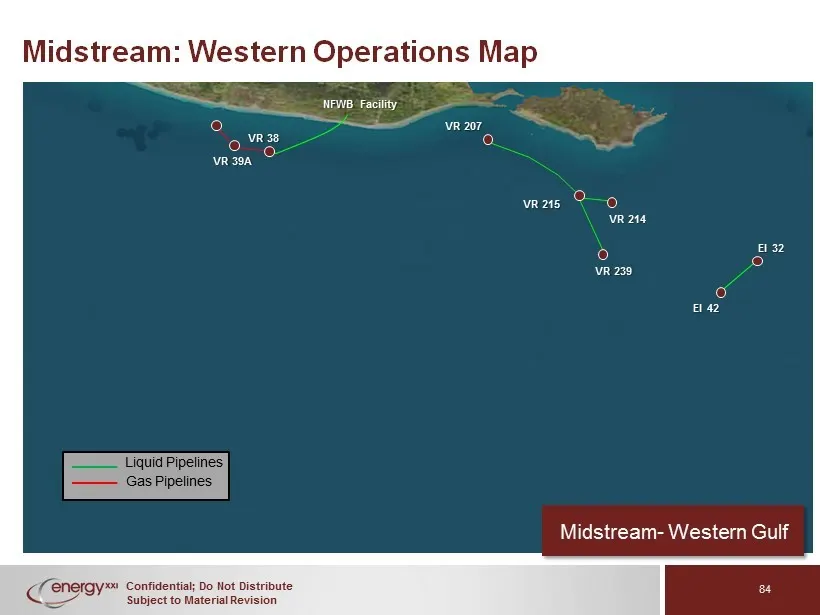
Slide 84: Midstream: Western Operations Map
Confidential; Do Not Distribute Subject to Material Revision Midstream: Western Operations Map 84 VR 22 NFWB Facility VR 38 VR 207 VR 214 VR 239 VR 215 VR 39A EI 42 EI 32 Liquid Pipelines Gas Pipelines Midstream - Western Gulf
Slide 85: Project Bluewater Additional Cleansing Materials
Privileged & Confidential Attorney Work Product Subject to FRE 408 Project Bluewater ADDITIONAL CLEANSING MATERIALS April 13, 2016
Slide 86: Cleansing Materials Contents
Privileged & Confidential Attorney Work Product Subject to FRE 408 2 2016 Forecast 3 I PDP + PDNP Case 6 II Drilling Case 9 III Unmortgaged Reserves 12 IV ARO Summary 14 V LOE Summary 16 VI
Slide 87: I. 2016 Forecast
Privileged & Confidential Attorney Work Product Subject to FRE 408 I. 2016 Forecast 3
Slide 88: Capex Assumptions – Calendar 2016
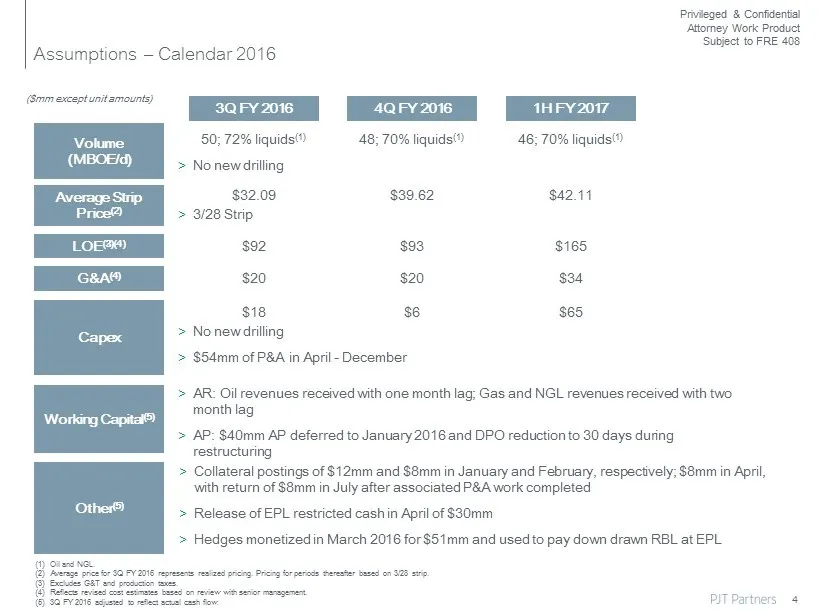
Privileged & Confidential Attorney Work Product Subject to FRE 408 Capex Assumptions – Calendar 2016 ($mm except unit amounts) > AR: Oil revenues received with one month lag; Gas and NGL revenues received with two month lag > AP: $40mm AP deferred to January 2016 and DPO reduction to 30 days during
Slide 89: 2016 Monthly Forecast
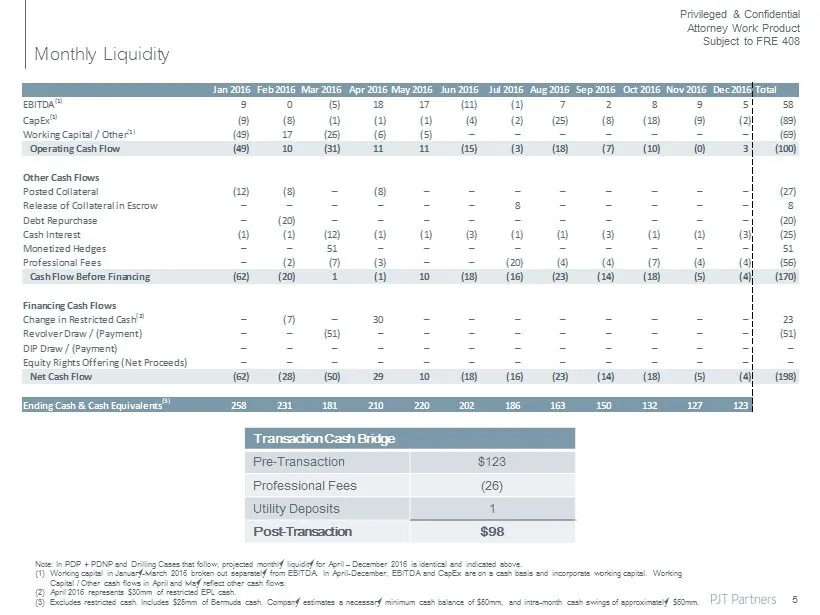
Privileged & Confidential Attorney Work Product Subject to FRE 408 Jan 2016 Feb 2016Mar 2016 Apr 2016May 2016 Jun 2016 Jul 2016 Aug 2016 Sep 2016 Oct 2016Nov 2016 Dec 2016Total EBITDA (1) 9 0 (5) 18 17 (11) (1) 7 2 8 9 5 58 CapEx (1) (9) (8) (1) (1) (1) (4) (2) (25) (8) (18) (9) (2) (89) Working Cap
Slide 90: II. PDP + PDNP Case
Privileged & Confidential Attorney Work Product Subject to FRE 408 II. PDP + PDNP Case 6
Slide 91: Capex Assumptions
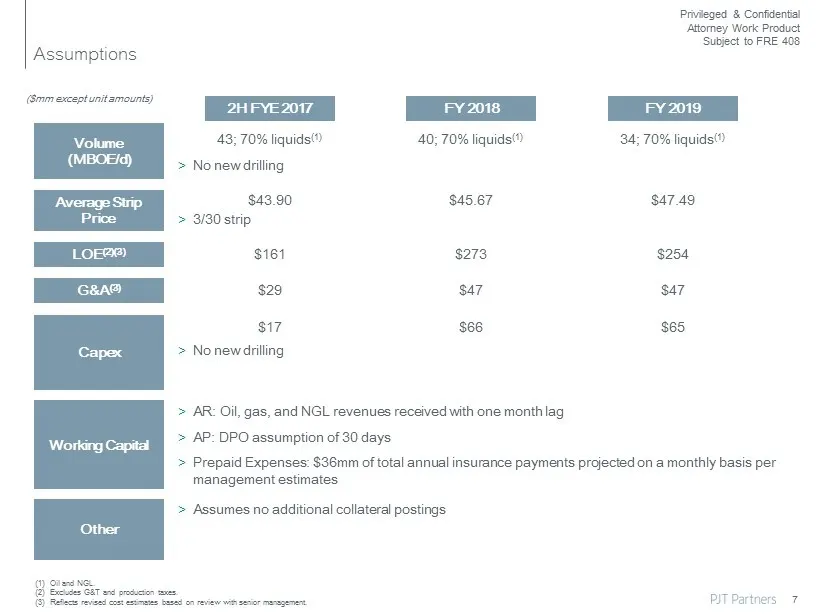
Privileged & Confidential Attorney Work Product Subject to FRE 408 Capex Assumptions 40; 70% liquids (1) 34; 70% liquids (1) $43.90 $45.67 $47.49 $29 $47 $47 $17 $66 $65 $161 $273 $254 ($mm except unit amounts) > AR: Oil, gas, and NGL revenues received with one month lag > AP: DPO assumption of 30 d
Slide 92: PDP + PDNP Free Cash Flow
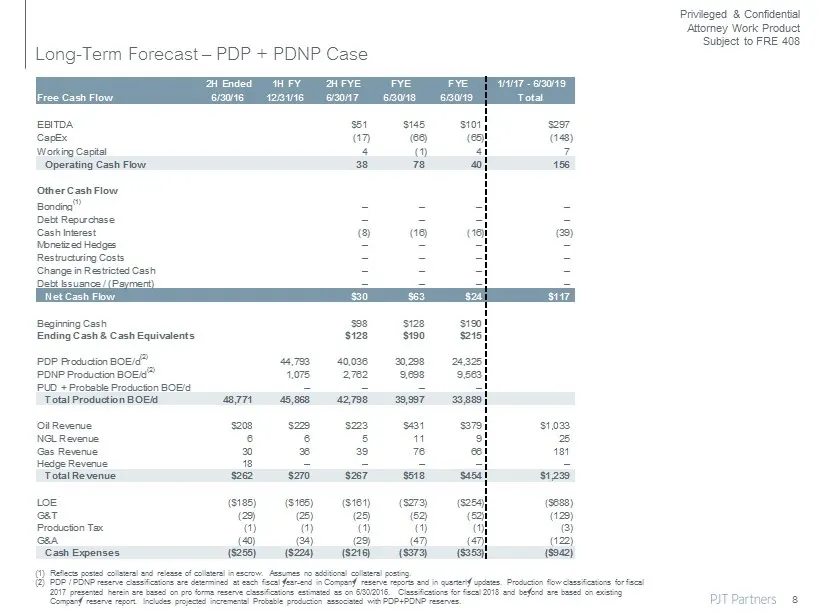
Privileged & Confidential Attorney Work Product Subject to FRE 408 2H Ended 1H FY 2H FYE FYE FYE 1/1/17 - 6/30/19 Free Cash Flow 6/30/16 12/31/16 6/30/17 6/30/18 6/30/19 Total EBITDA $51 $145 $101 $297 CapEx (17) (66) (65) (148) Working Capital 4 (1) 4 7 Operating Cash Flow 38 78 40 156 Other Cash F
Slide 93: III. Drilling Case
Privileged & Confidential Attorney Work Product Subject to FRE 408 III. Drilling Case 9
Slide 94: Capex Assumptions
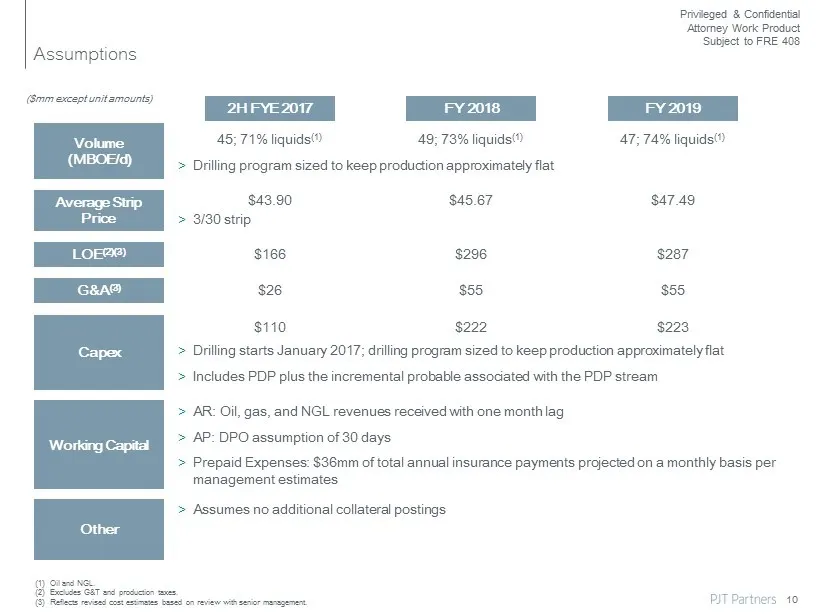
Privileged & Confidential Attorney Work Product Subject to FRE 408 Capex Assumptions ($mm except unit amounts) Average Strip Price LOE (2)(3) G&A (3) Volume (MBOE/d) > Drilling program sized to keep production approximately flat (1) Oil and NGL. (2) Excludes G&T and production taxes . (3) Reflects r
Slide 95: Drilling Case Free Cash Flow
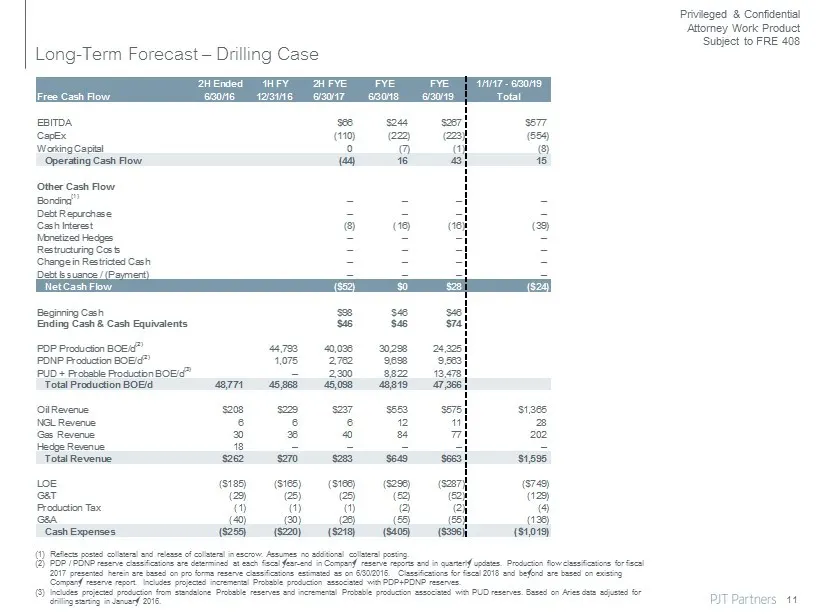
Privileged & Confidential Attorney Work Product Subject to FRE 408 2H Ended 1H FY 2H FYE FYE FYE 1/1/17 - 6/30/19 Free Cash Flow 6/30/16 12/31/16 6/30/17 6/30/18 6/30/19 Total EBITDA $66 $244 $267 $577 CapEx (110) (222) (223) (554) Working Capital 0 (7) (1) (8) Operating Cash Flow (44) 16 43 15 Othe
Slide 96: IV. Unmortgaged Reserves
Privileged & Confidential Attorney Work Product Subject to FRE 408 IV. Unmortgaged Reserves 12
Slide 97: Unmortgaged Reserves
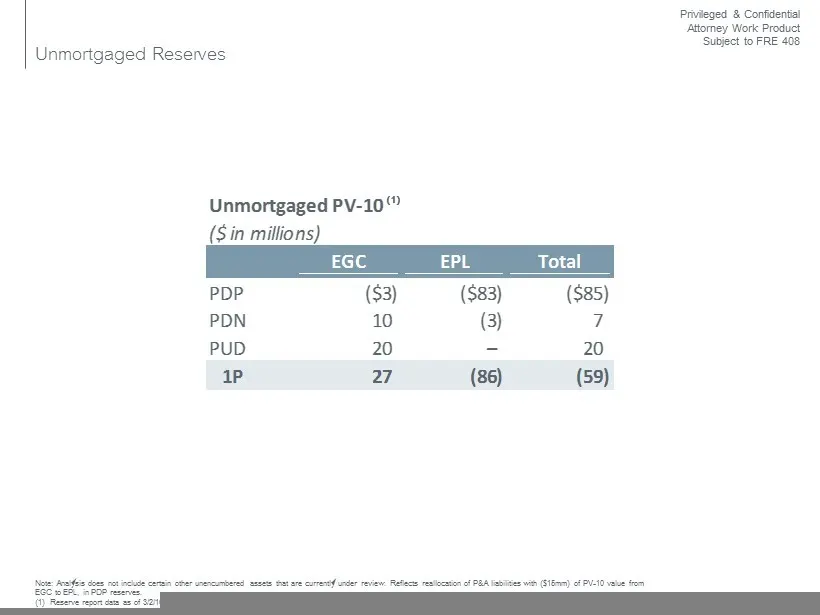
Privileged & Confidential Attorney Work Product Subject to FRE 408 Unmortgaged Reserves Note: Analysis does not include certain other unencumbered assets that are currently under review. Reflects reallocation of P&A liabilities with ($15mm) of PV - 10 value from EGC to EPL, in PDP reserves. (1) Rese
Slide 98: V. ARO Summary
Privileged & Confidential Attorney Work Product Subject to FRE 408 V. ARO Summary 14
Slide 99: ARO Summary by Reserve Category
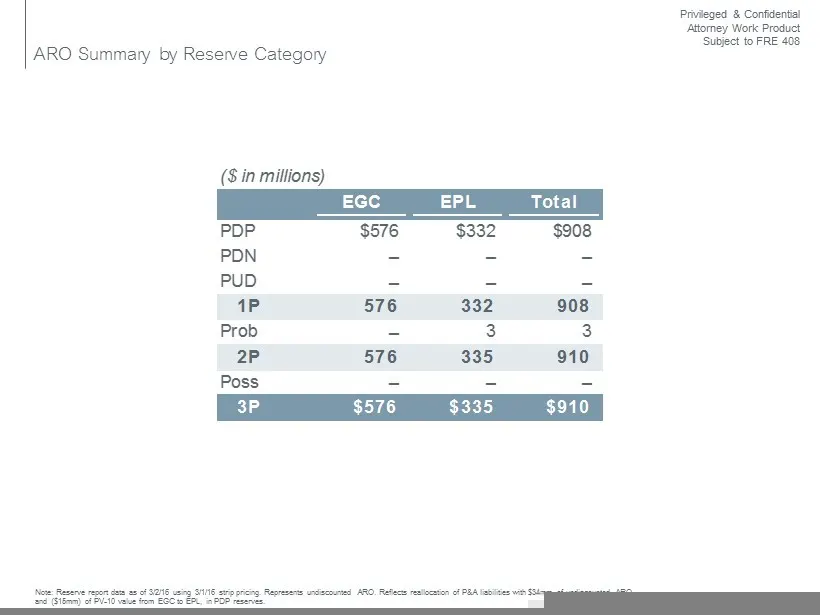
Privileged & Confidential Attorney Work Product Subject to FRE 408 ARO Summary by Reserve Category 15 ($ in millions) EGC EPL Total PDP $576 $332 $908 PDN – – – PUD – – – 1P 576 332 908 Prob – 3 3 2P 576 335 910 Poss – – – 3P $576 $335 $910 Note: Reserve report data as of 3/2/16 using 3/1/16 strip p
Slide 100: VI. LOE Summary
Privileged & Confidential Attorney Work Product Subject to FRE 408 VI. LOE Summary 16
Slide 101: LOE Summary by Reserve Category
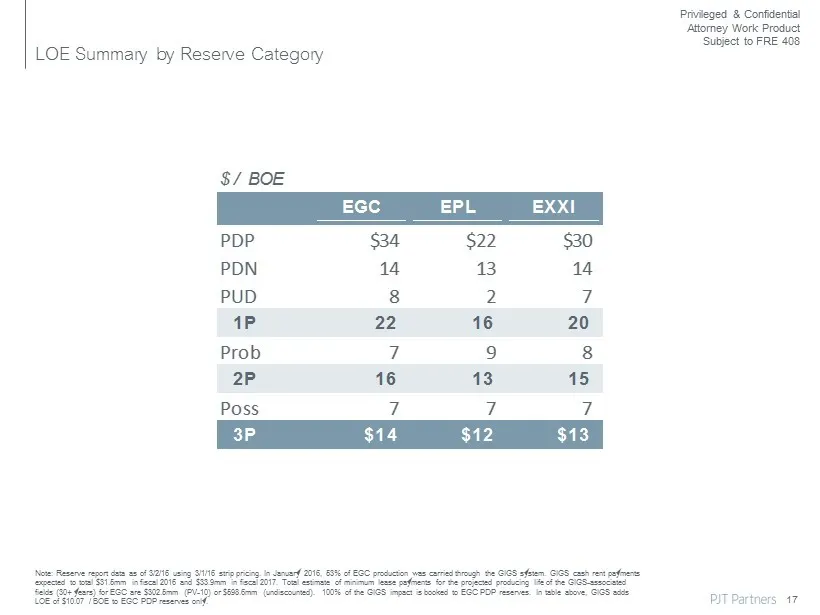
Privileged & Confidential Attorney Work Product Subject to FRE 408 LOE Summary by Reserve Category 17 Note: Reserve report data as of 3/2/16 using 3/1/16 strip pricing. In January 2016, 53% of EGC production was carried through the GIGS system. GIGS cash rent payments expected to total $31.5mm in fi

Slide 102: Appendix
Privileged & Confidential Attorney Work Product Subject to FRE 408 Appendix 18
Slide 103: Supplemental Material
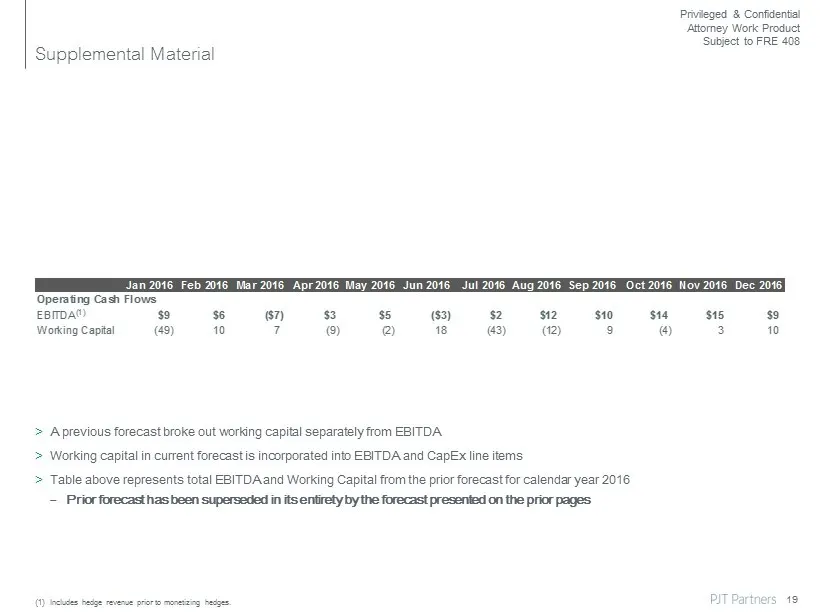
Privileged & Confidential Attorney Work Product Subject to FRE 408 Supplemental Material > A previous forecast broke out working capital separately from EBITDA > Working capital in current forecast is incorporated into EBITDA and CapEx line items > Table above represents total EBITDA and Working Cap
Source: SEC EDGAR · 8-K filed Apr 14, 2016