Williams Industrial Services Group Inc
Williams Industrial Services — Global Power Equipment Group — Investor Presentation (September 2010)
41 slides from Williams Industrial Services's investor presentation, Sep 13, 2010
Slide 1: Investor Presentation
Exhibit 99.1 Investor Presentation

Slide 2: Forward-Looking Statements
This presentation contains "forward-looking statements" within the meaning of that term set forth in the Private Securities Litigation Reform Act of 1995. These statements reflect our current views of future events and financial performance and are subject to a number of risks and uncertainties. Our
Slide 3: Mission Statement and Market Overview
Mission Statement We will safely provide superior engineered products and services that exceed customer standards while affording employees opportunities for career growth and earning our investors a superior rate of return on their investment . Market Overview Market Overview 1. Power Generation eq
Slide 4: What we do
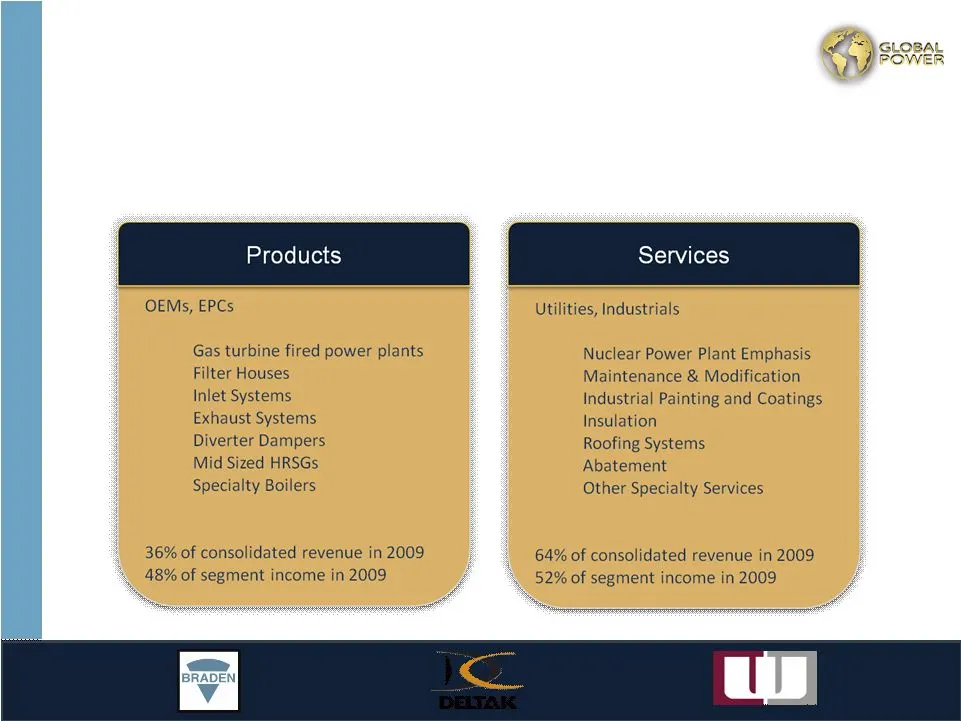
Global Power What we do Global Power Equipment Group Inc. is a comprehensive provider of power generation equipment and maintenance services for customers in the domestic and international energy, power infrastructure and service industries.
Slide 5: Executive management
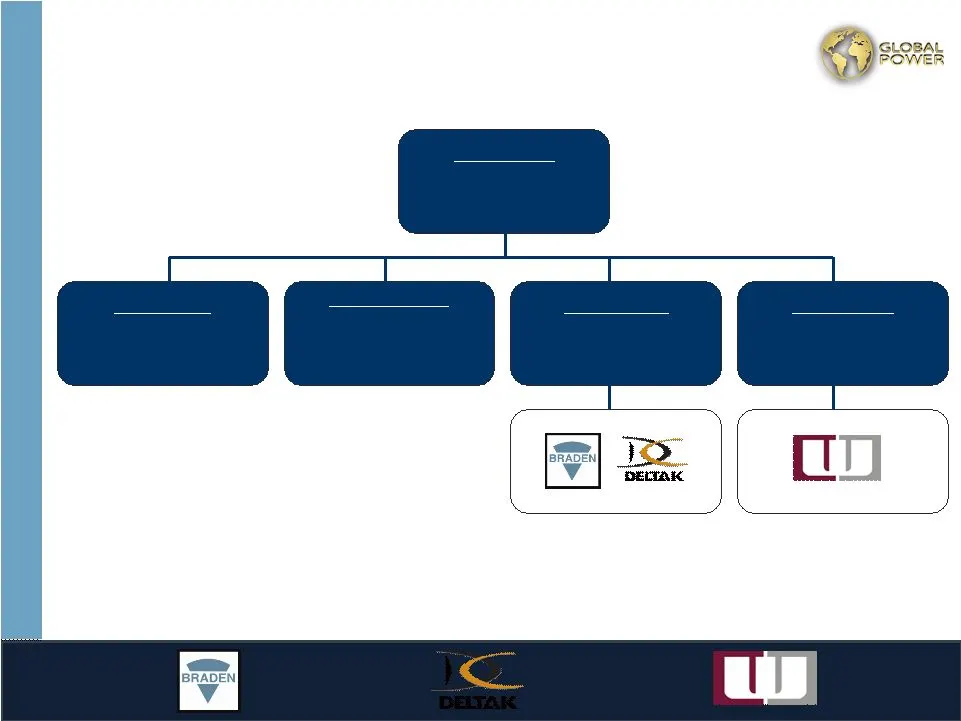
Tracy Pagliara General Counsel, Secretary & VP Business Development 25 yrs experience David Willis CFO & SVP 17 yrs experience Ken Robuck SVP & President of Services 28 yrs experience Dean Glover SVP & President of Products 20 yrs experience David Keller President & CEO 30 yrs experience Global Powe
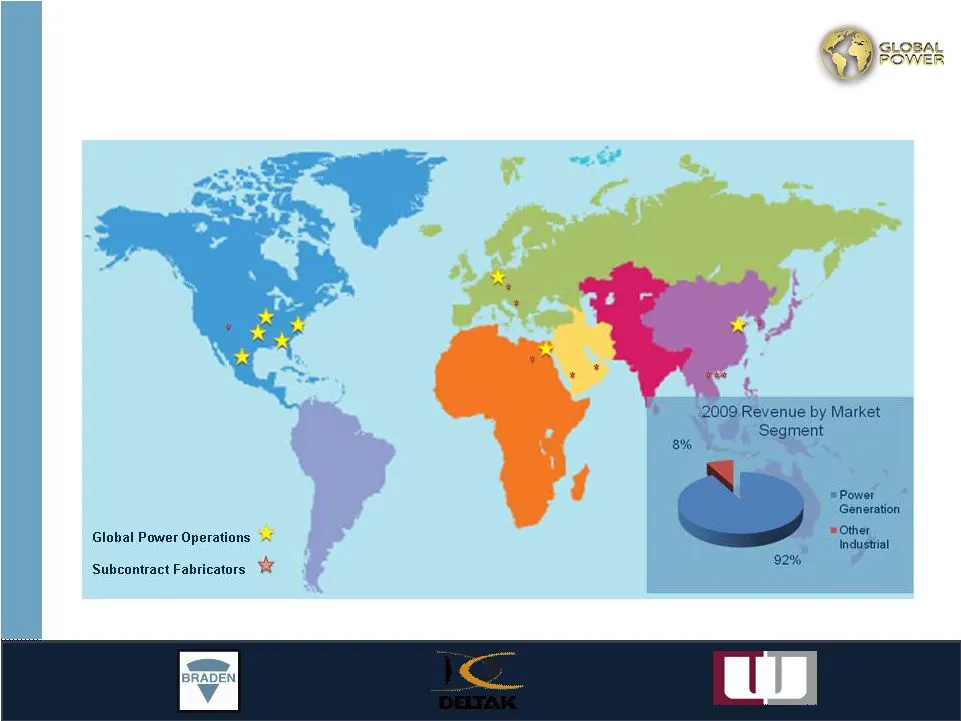
Slide 6: A Global Presence
A Global Presence Cost effective / low risk OEM model takes us worldwide
Slide 7: Financial Overview: 6/30/10 Snapshot
Market cap (9/9/10): $232 million Total unrestricted cash: $66 million Cash position net of term loan: $42 million Total backlog: $298 million Fully diluted shares: 16.2 million Operating revenues: $282 million Net income: $22 million Earnings per fully diluted share: $1.35 Consolidated operating EB
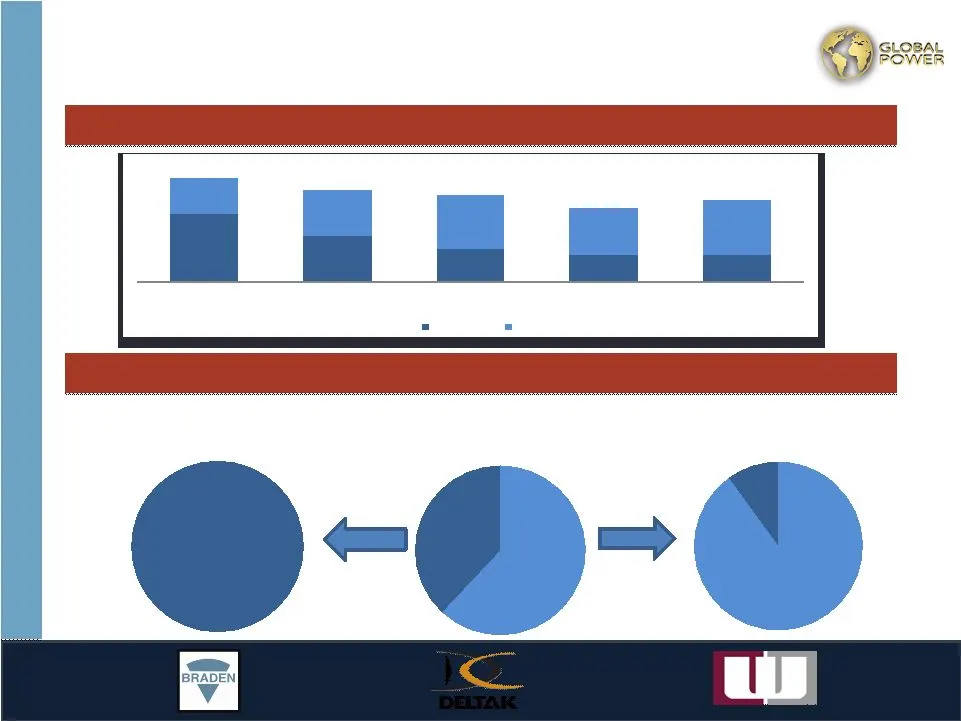
Slide 8: Snapshot of Backlog
66% 51% 38% 37% 33% 34% 49% 62% 63% 67% Historical Backlog Services 62% Products 38% Cost Plus 90% Fixed Price 10% Fixed Price 100% Backlog (6/30/10) Snapshot of Backlog 1Q10 2Q10 Products Services Historical Backlog $ 377 $332 $314 $267 $298 Segment Contract Type Services (Williams) Contract Type P
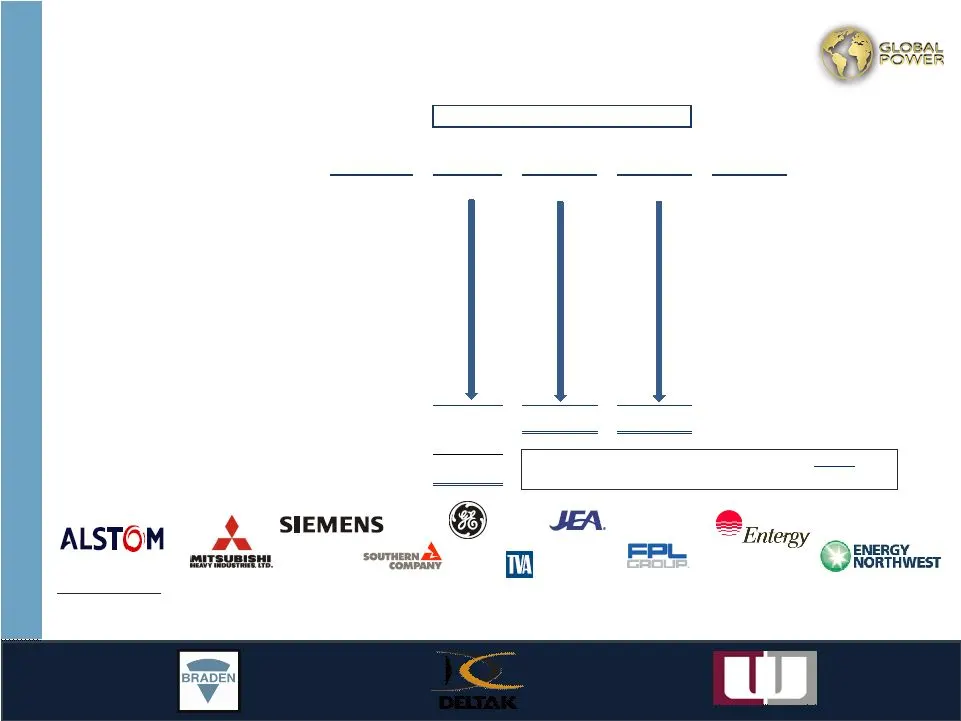
Slide 9: Blue Chip Customer Base
Blue Chip Customer Base Bad debt expense and warranty claims represent 0.166% of revenues from top 10 customers from 2007 – 2009. 1) As of August 2010 2) Bond issue rating Credit % of GPEG Bad Debt Warranty Relationship Rating ¹ Revenue Exp Claims Tenure ($ in 000's) ($ in 000's) 1. General Electric
Slide 10: Strategic Overview: Where we have been
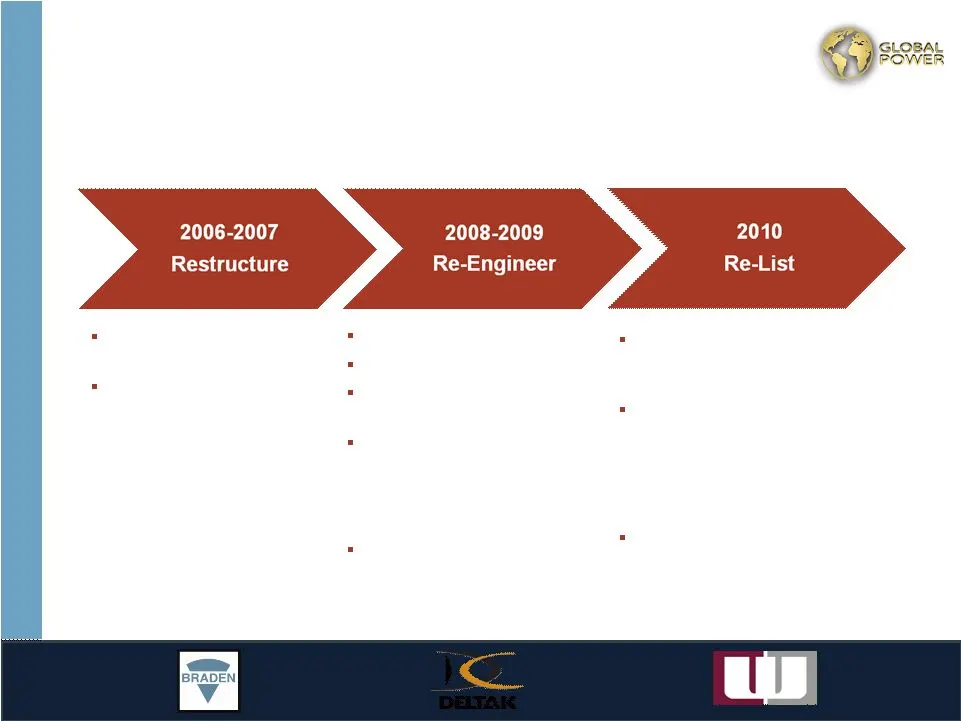
Strategic Overview Where we have been Global Power has strengthened and repositioned itself over the last four years Exited large-scale HRSG product line Divested foreign subsidiary Successfully exited Chapter 11 Additional equity capital Commenced trading under “GLPW” on Pink Sheets Entered into $1
Slide 11: Strategic Overview: Where we are going
Strategic Overview Where we are going Organic Outlook Organic Outlook Products OEM market expected to stabilize in 2011 with industry consensus view of recovery in 2012 of gas turbine power projects - 2011 revenues: potential growth range of mid-single digits compared to 2010 - 2011 gross margins an
Slide 12: Strategic Overview: Acquisition Prospects
Strategic Overview Where we are going (cont’d) Acquisition Prospects Acquisition Prospects Products acquisition targets include: - Bolt-on product lines - Product offerings that complement existing markets or broaden exposure beyond OEM gas turbine cycle Services acquisitions targets include: - Spec
Slide 13: Strong fundamental structure for a growing industry
Global Power Strong fundamental structure for a growing industry Strong commercial risk / reward profile Flexible manufacturing model Geographic and end-market diversity Long-standing relationships with a blue-chip customer base Strong free cash flow generation Favorable end-market dynamics Acquisit

Slide 14: Industry
Industry
Slide 15: Poised For Growth
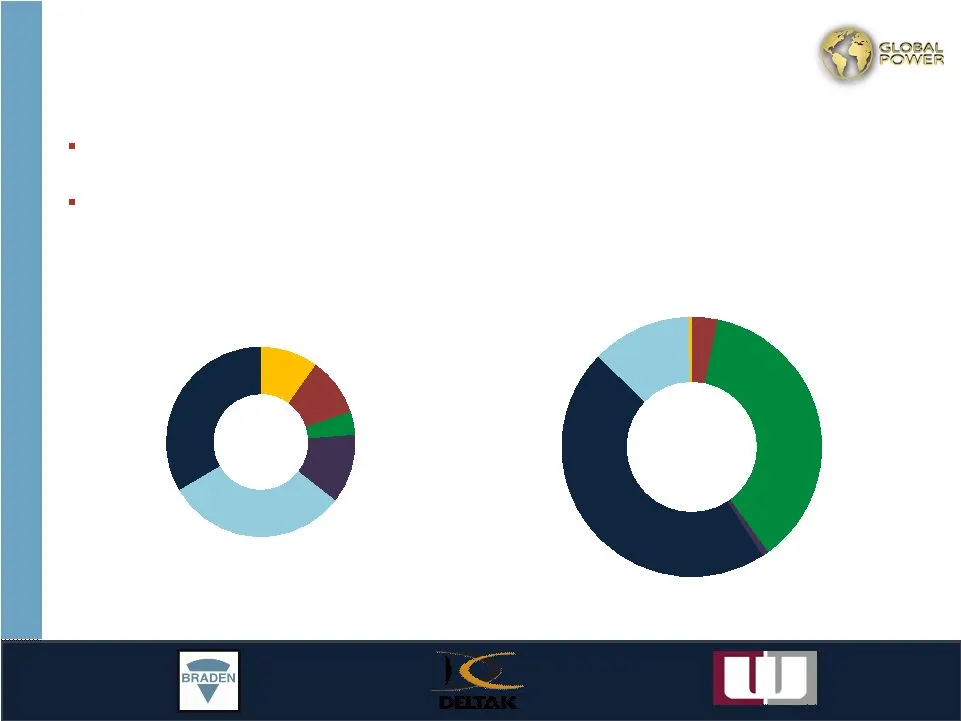
Poised For Growth In a changing industry Source: DOE Annual Energy Outlook, December, 2009 Hydropower* 10% Nuclear 10% Other Renewables 4% Other 12% Coal 31% Natural Gas 33% 2008 Capacity Nuclear 3% Other Renewables 37% Other 1% Natural Gas 46% Coal 13% Hydropower* 0.4% Capacity Additions 2008 to 20
Slide 16: Comparative Economics
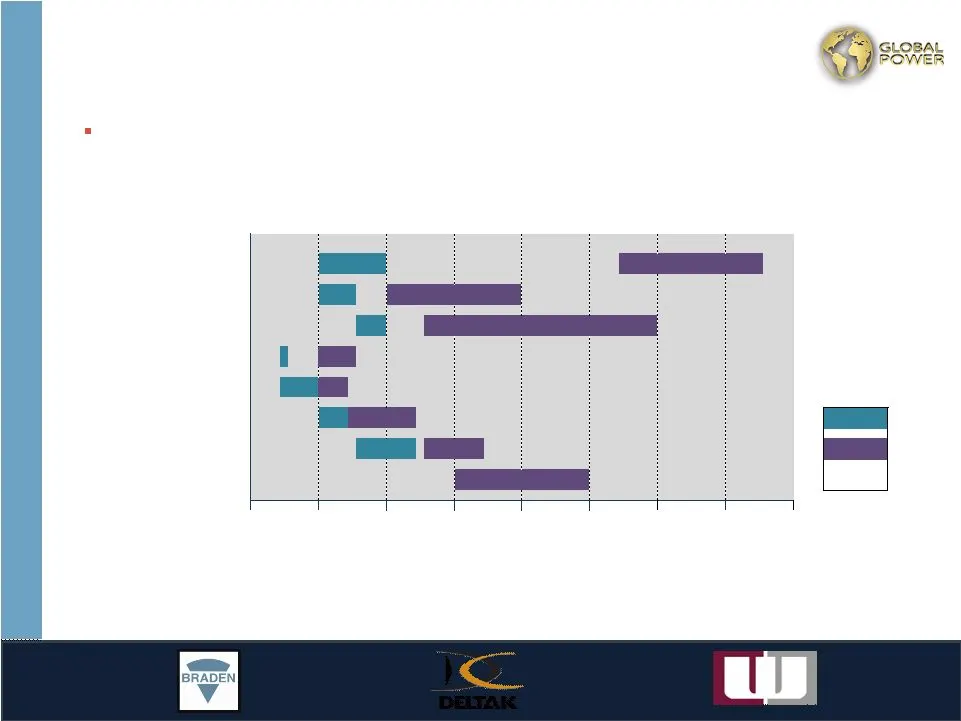
Comparative Economics Source: Compiled by FERC staff from various sources FERC forecast data demonstrates gas is expected to be a compelling fuel source for power generation capacity additions Nuclear Conventional Coal IGCC Coal Combined Cycle (Gas) Combustion Turbine (Gas) Wind 2003-04 Geothermal C
Slide 17: Aging nuclear fleet that requires extensive ongoing services
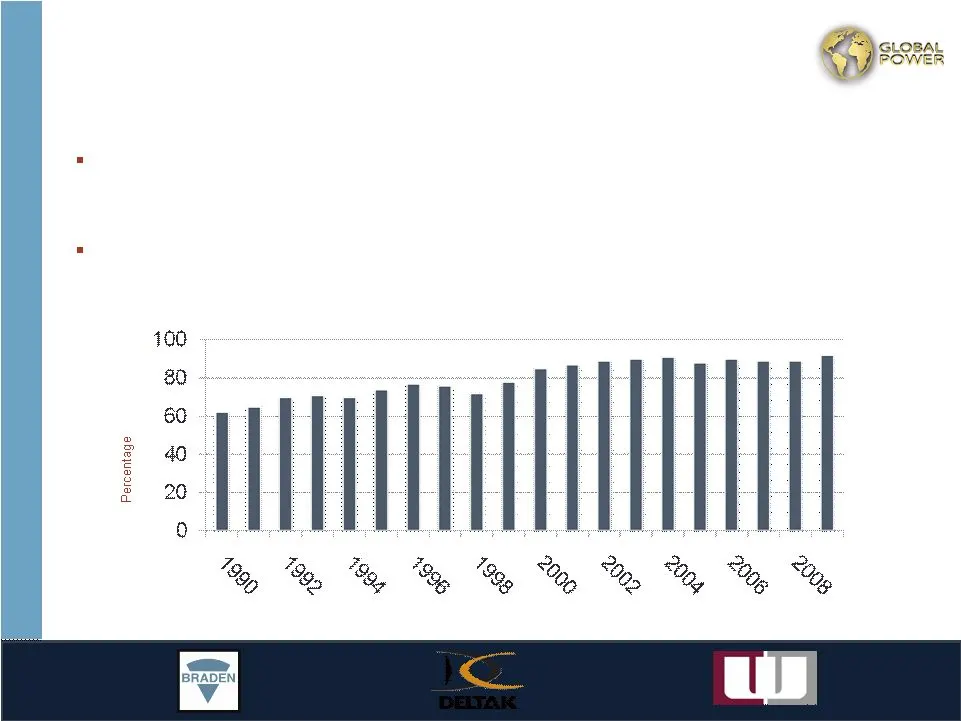
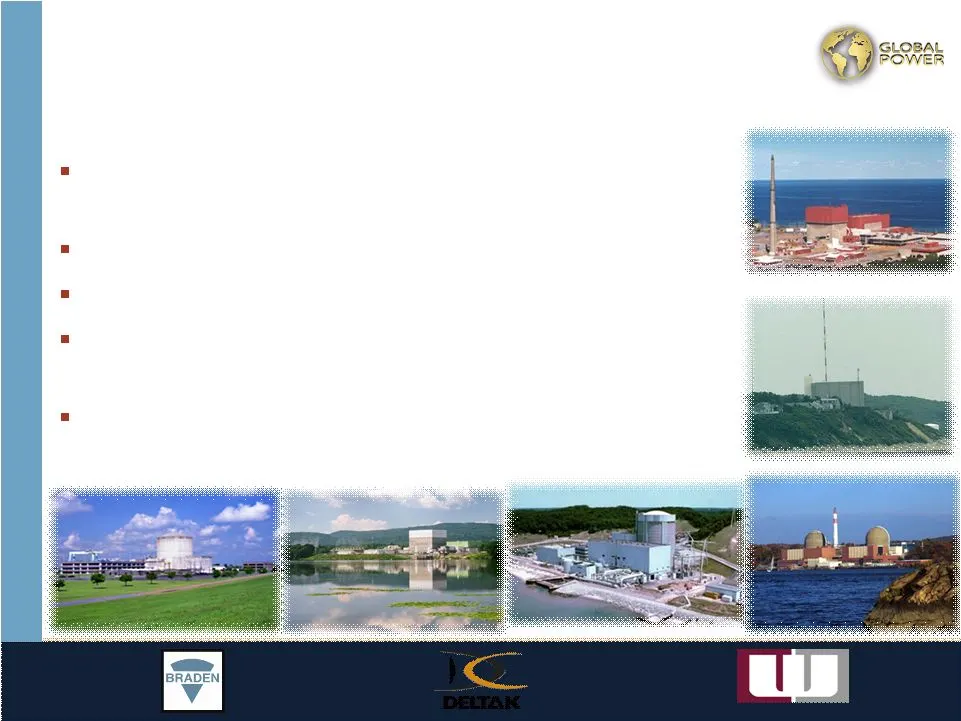
United States currently has operating nuclear reactors at plant sites that generate about 20% of electricity used in the US. These plants have been in operation for an average of 30 years and are operating at close to 90% capacity. In 2000, the NRC issued the first license renewal to a nuclear power
Slide 18: Services Spectrum 2010
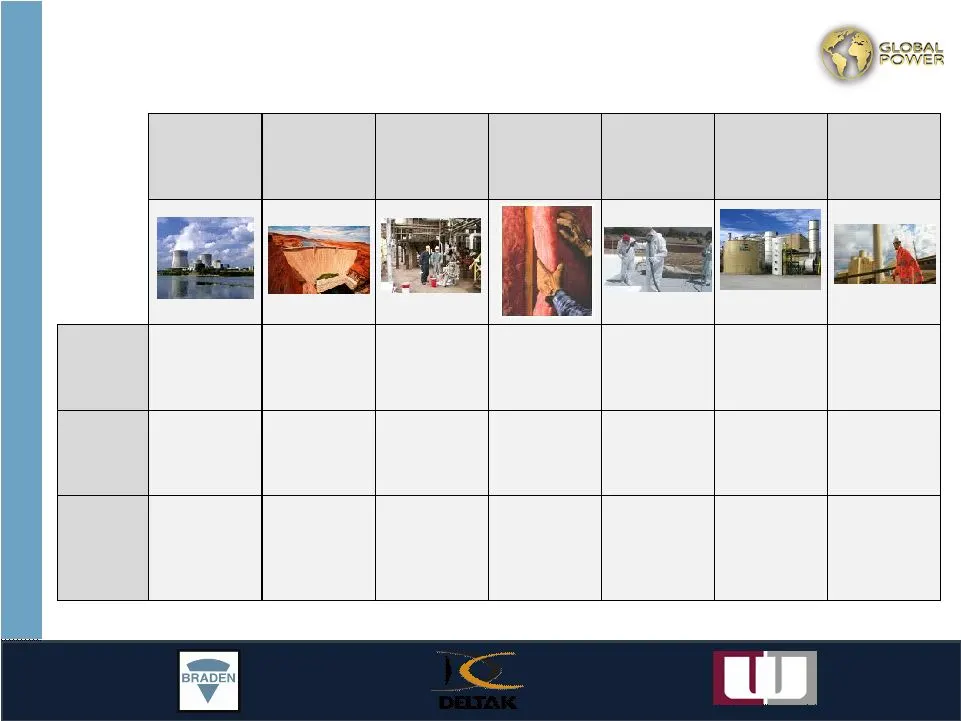
Services Spectrum 2010 Nuclear Power Plant Maintenance Fossil Fuel, Hydroelectric Power Plant Maintenance Industrial Painting and Coatings Insulation Roofing Systems Abatement Valve Services What it is Performed during outages, decommissioning services Routine maintenance, repair and capital project
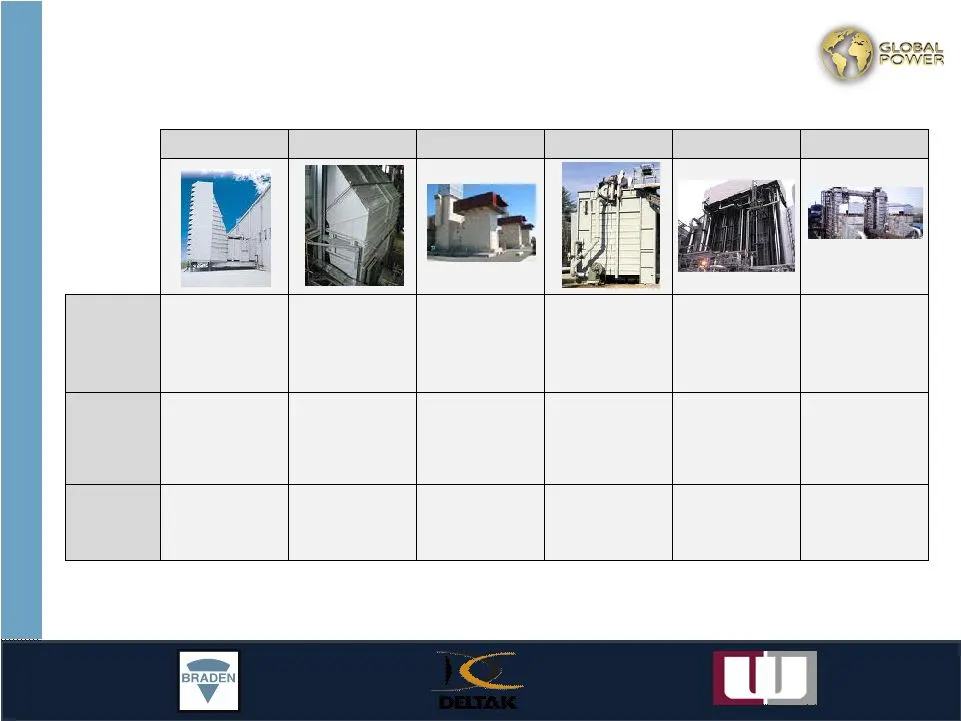
Slide 19: Products Spectrum 2010
Products Spectrum 2010 Filter Houses Inlet Systems Exhaust Systems Diverter Dampers HRSGs Specialty Boilers What it is Cleans debris and dirt from air that enters gas turbine Connects the filter house to gas turbine and provides noise control Directs hot exhaust from the turbine to the atmosphere Di

Slide 20: Operating Divisions
Operating Divisions
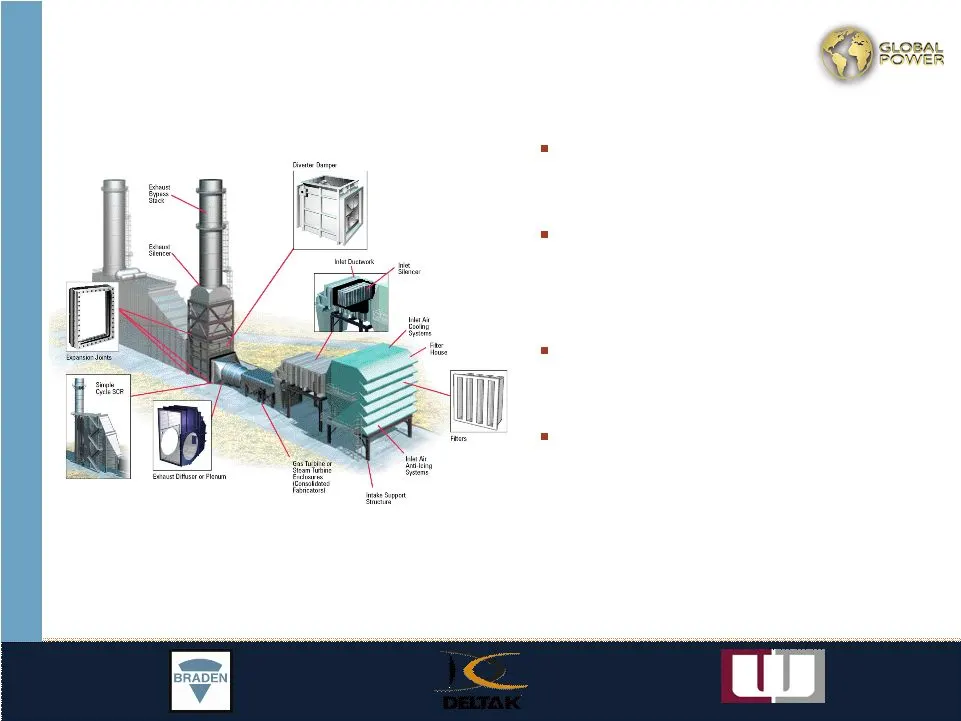
Slide 21: Braden
Braden Headquarters in Tulsa, OK and Herleen, The Netherlands Global sales representatives located in the US, The Netherlands, Egypt, Korea and China Braden engineers work exclusively on gas turbine plan designs Highly flexible outsourced manufacturing model - 25-30% In-house - 70-75% Outsourced
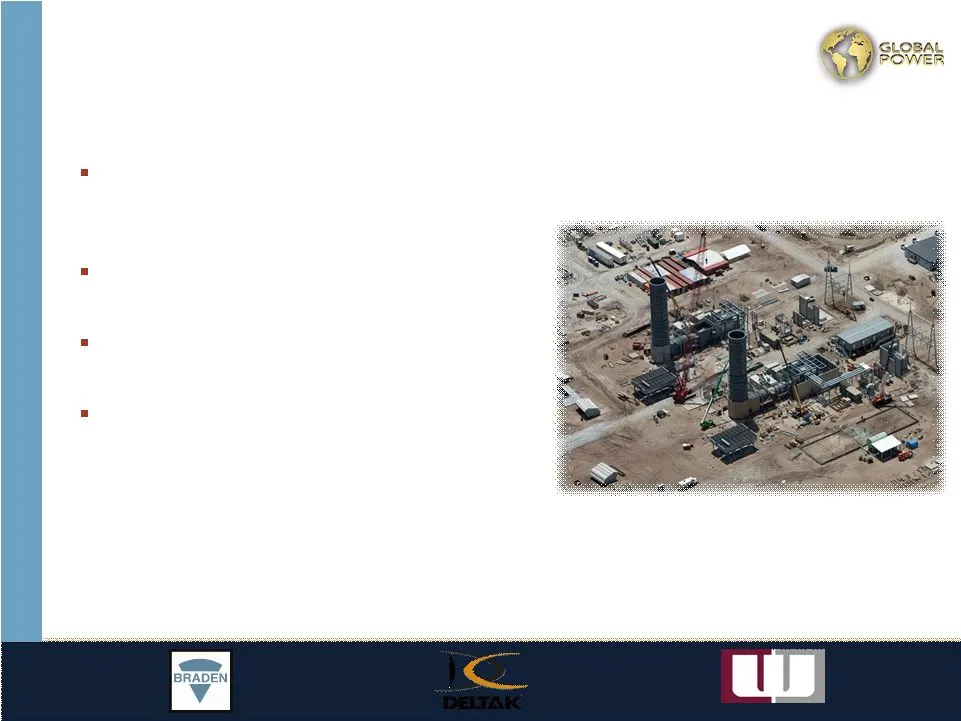
Slide 22: Braden: Greenland Energy Center Project - Florida
Supplied Filter Houses and Exhaust Systems for 2 X 7FA Gas Turbine Power Plant in Florida All fabrication completed in house by Braden Mexico Very stringent low noise acoustical requirements Two Customers: Braden Greenland Energy Center Project - Florida - Filter Houses Supplied to Turbine OEM - Exh
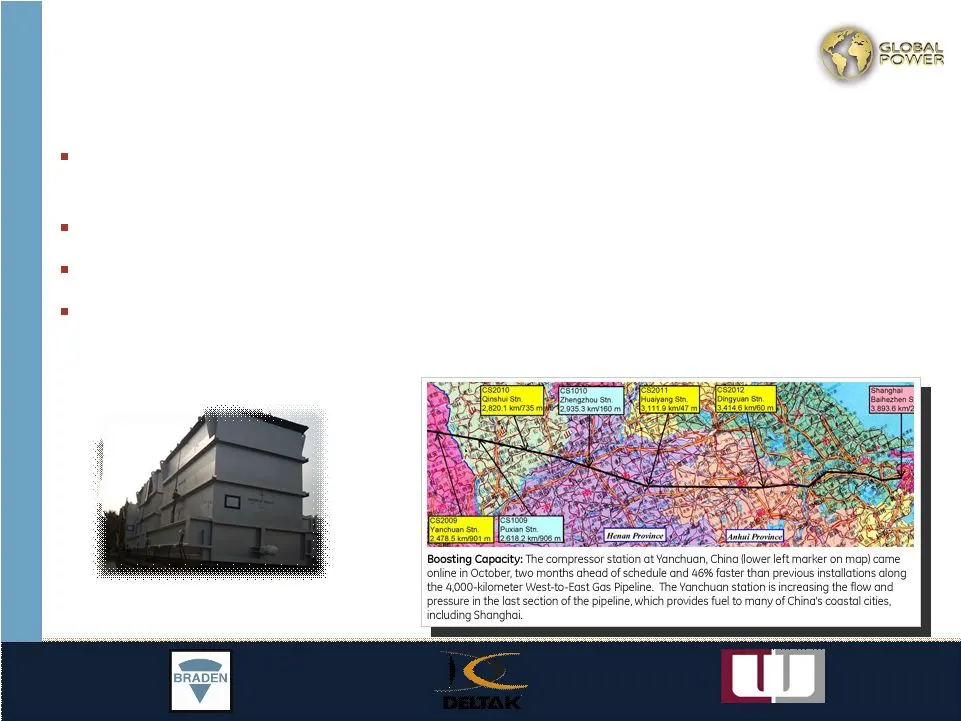
Slide 23: Braden: West to East Gas Pipeline Project - China
One of the world’s largest natural gas transmission projects; 12,000 miles across China 71 gas turbine exhaust systems; 100% market share Order executed in local currency using Braden Shanghai Office Fabricated In China using local fabrication partners and locally available material, 100% on time Br
Slide 24
Slide 25: Braden: Industry
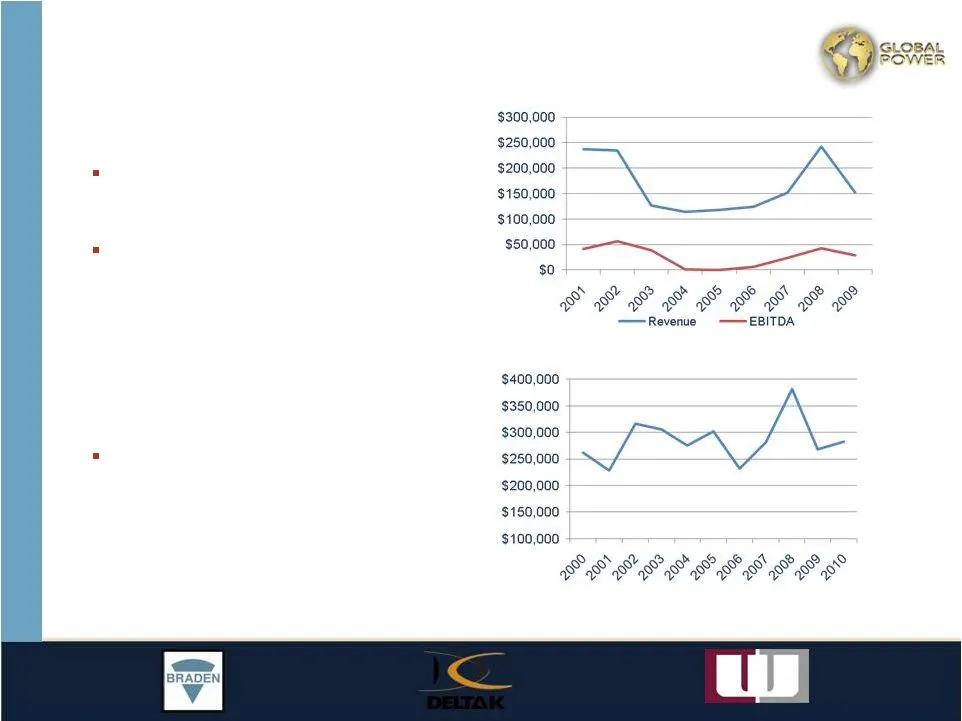
Braden Industry Braden primarily serves the worldwide gas turbine market Natural gas-fired plants expected to account for 46% of capacity additions, as compared with 37% for renewables, 12% for coal-fired power plants and 3% for nuclear through 2035 Upwards trend on average revenue per new unit ship
Slide 26: Williams
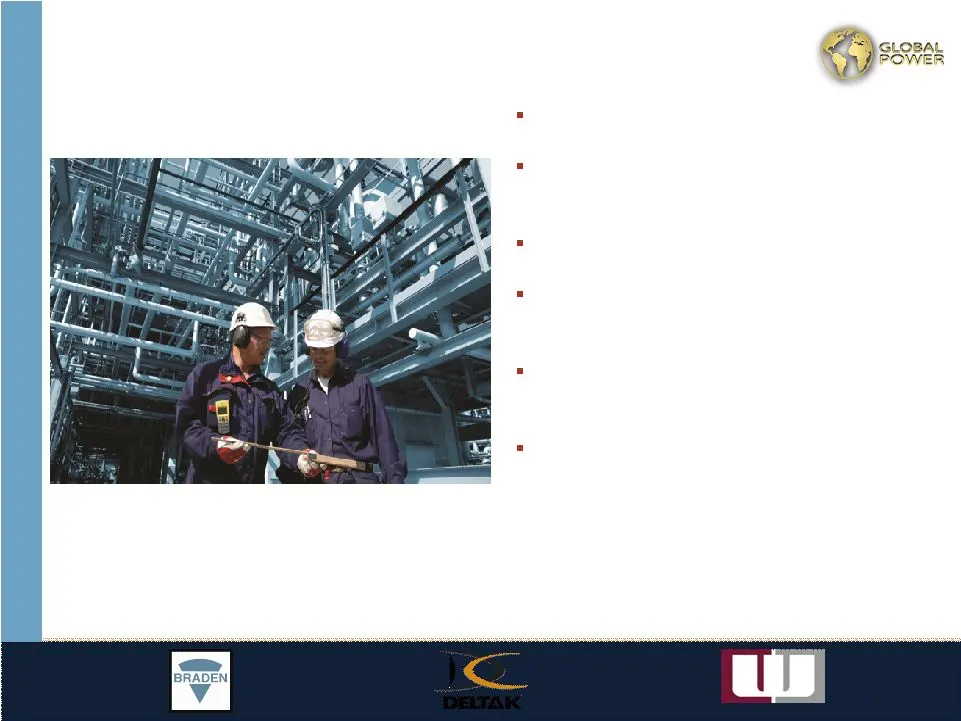
Williams Headquarters in Tucker, GA Seasoned Management/Project Supervisory Staff Top 5% in Industrial Safety Performance Primarily Services US Nuclear Power Plants Multi-year Contracts for Nuclear Outage Maintenance and Modification Work Provider of Specialty Services at Nuclear and Industrial Site
Slide 27: Williams: Value proposition
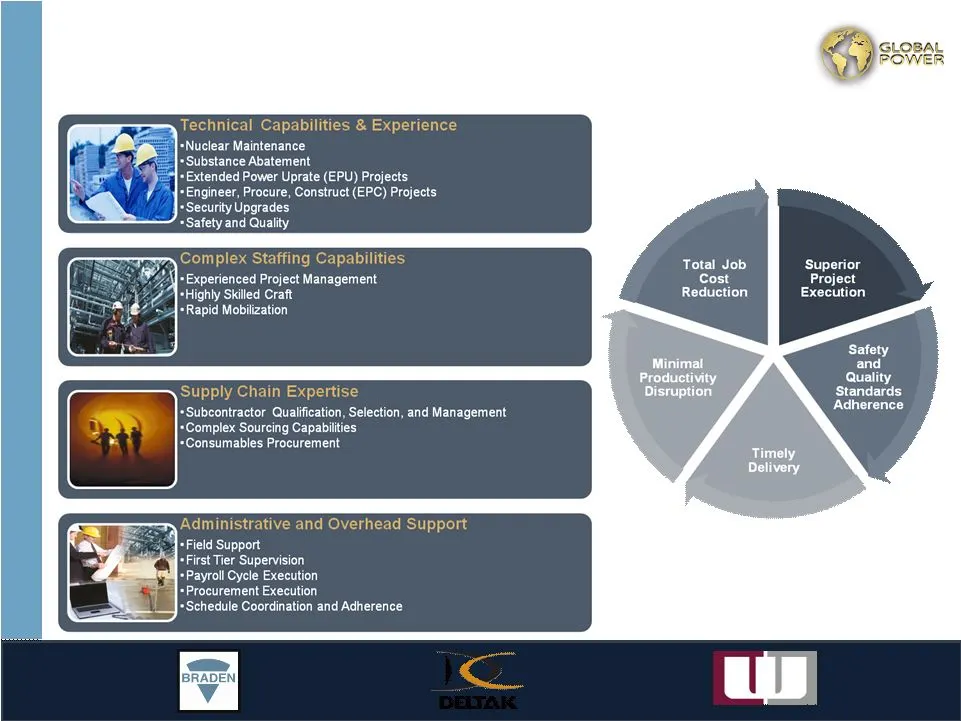
Williams Value proposition Client Benefits
Slide 28: Williams: Industry
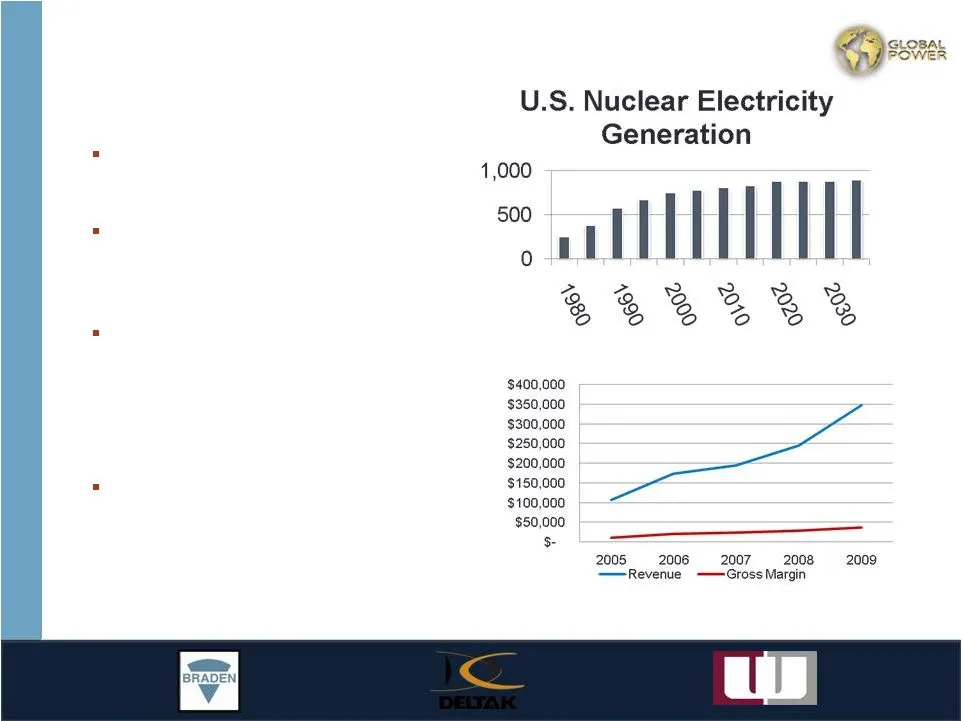
Williams Industry Williams primarily services U.S. nuclear power plants Nuclear power is a significant component of the U.S. power supply Electricity generation from nuclear power plants is expected to grow from 806 billion kilowatt- hours in 2008 to 898 billion kilowatt-hours in 2035 The mix of fut
Slide 29: Williams/ENERCON Alliance for nuclear capital project
Security upgrades for entire nuclear fleet – North and South Integrated design / build contract ENERCON has design scope Williams has construction, purchasing, and subcontracts Cameras, fencing, observation towers and other security upgrades Williams/ENERCON Alliance for nuclear capital project
Slide 30: Williams: Energy Northwest reactor siding project
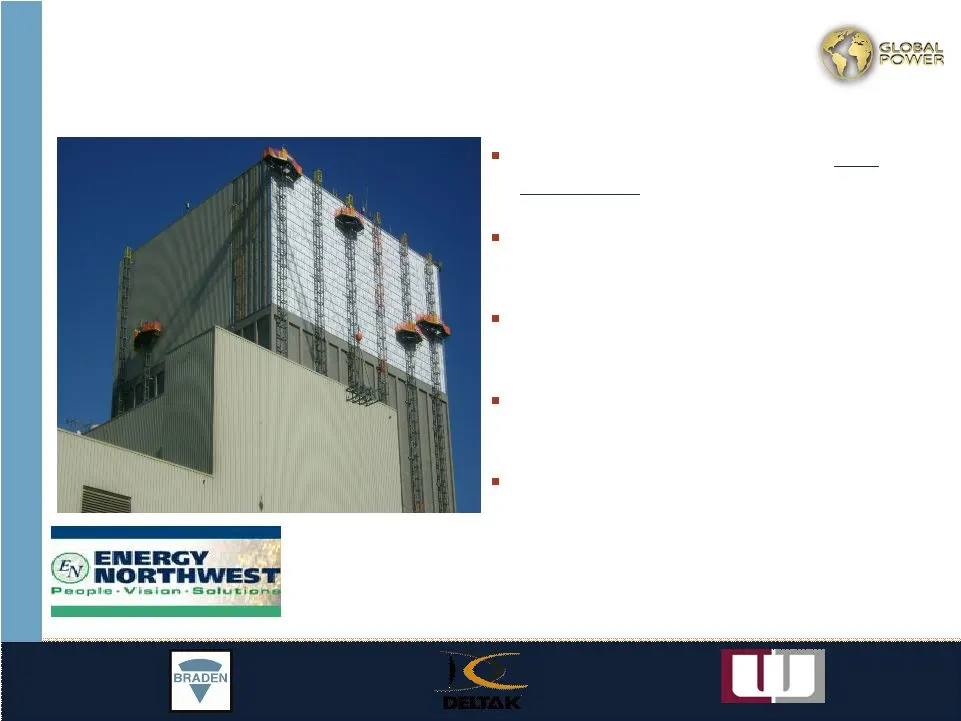
Williams Energy Northwest reactor siding project An excellent safety record with zero recordables while working 200’ in the air Only re-siding project in the world that was performed while the station was on-line Provided the client with specialized methods for accessing the work area Delivered the
Slide 31: Williams: Company information
Williams Company information Employees - Approximately 250 FT - Up to 6,000 Craft - (Average 3,000) Work Type - 60% maintenance - 30% capital projects - 10% new construction Double-breasted - Union labor - Non-union labor Customers - 70% private sector - 65% repeat business
Slide 32: Deltak
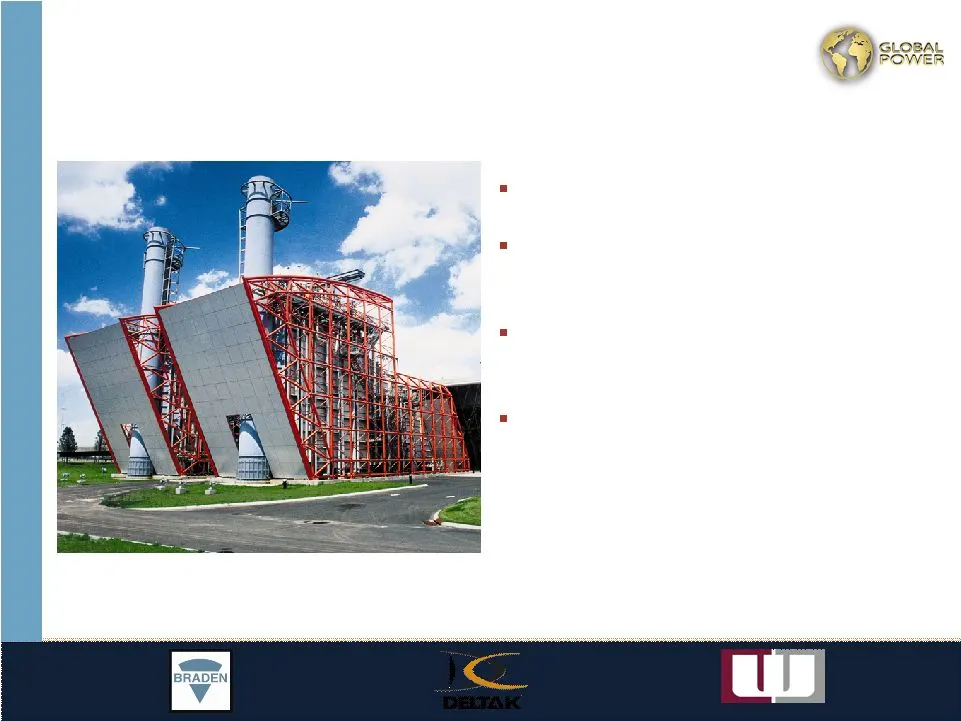
Deltak Headquarters in Plymouth, MN Majority of manufacturing is completed in-house for domestic projects Specialty boiler systems for municipal waste incinerators and chemical processes Mid-sized HRSGs (<85MW) for power applications, industrial process and enhanced oil recovery

Slide 33: Deltak: Industry
Deltak Industry Industrial and utility markets which include refineries, petrochemical, pharmaceutical, paper and pulp and steel companies, in addition to utilities, account for the bulk of the market for cogeneration equipment Deltak anticipates growth in the mid-sized HRSG and CHP markets General
Slide 34: Strong fundamental structure for a growing industry
Global Power Strong fundamental structure for a growing industry Strong commercial risk / reward profile Flexible manufacturing model Geographic and end-market diversity Long-standing relationships with a blue-chip customer base Strong free cash flow generation Favorable end-market dynamics Acquisit
Slide 35: David L. Keller
• David L. Keller President and Chief Executive Officer David L. Keller served as the President and Chief Operating Officer of The Babcock & Wilcox Company (B&W), a wholly owned subsidiary of McDermott International, Inc., from March until his retirement in June 2007. B&W, a company with approximate
Slide 36: Tracy D. Pagliara
• • • Tracy D. Pagliara General Counsel, Secretary and VP of Business Development Tracy D. Pagliara served as the Chief Legal Officer of Gardner Denver, Inc., a leading global manufacturer of highly engineered compressors, blowers, pumps and other fluid transfer equipment, from August through August
Slide 37: Dean J. Glover
• Dean J. Glover Senior Vice President and President of the Products Division Dean J. Glover joined Braden Manufacturing in December as Chief Operating Officer and was promoted to his positions at Global Power and Deltak in September 2008. Mr. Glover has extensive international experience having liv
Slide 38: Appendix: Company history
Appendix Company history The Braden Group founded as Braden Steel in 1923 in Tulsa Various owners over the next six decades, vast assortment of products spanning several industry sectors: - Metal buildings, air inlet and exhaust systems, large mining trucks, pump jacks, magnetic containment enclosur
Slide 39: Appendix: Balance sheet highlights
Appendix Balance sheet highlights GPEG has strengthened its balance by building cash and paying down debt since the emergence from Chapter 11 in January 2008 . Cumulative 3/31/08 12/31/08 12/31/09 6/30/10 Variances Unrestricted Cash 36,540 $ 57,633 $ 103,220 $ 66,283 $ 29,743 $ Restricted Cash 3,006
Slide 40: Appendix: Operations highlights
Appendix Operations highlights Over this period, GPEG’s Products and Services platforms have balanced one another through the recent cycle in the gas turbine OEM space Actual Actual Six Months Ended 6/30/10 Revenue 556,764 $ 540,610 $ 281,810 $ Cost of Sales 456,784 460,185 232,406 Gross Profit 99,9
Slide 41: Appendix: Reconciliation of EBITDA to net income
Appendix Reconciliation of EBITDA to net income Actual Actual Six Months ended 6/30/10 EBITDA 53,354 $ 37,912 $ 25,728 $ Less: Income tax provision (3,151) (5,282) (1,778) Interest expense (11,667) (9,667) (3,276) Depreciation and amortization (3,792) (4,151) (2,052) Reorganization items (23,574) (1
Source: SEC EDGAR · 8-K filed Sep 13, 2010
More decks from Williams Industrial Services Group Inc
 Q1 2023 Earnings Presentation10 slides · May 17, 2023
 Q4 2022 Earnings Presentation8 slides · Mar 31, 2023
 Q3 2022 Earnings Presentation9 slides · Nov 14, 2022
 Q2 2022 Earnings Presentation12 slides · Aug 11, 2022
 Q1 2022 Earnings Presentation12 slides · May 12, 2022
 Q4 2021 Earnings Presentation11 slides · Mar 16, 2022