Home Loan Servicing Solutions Ltd
Home Loan Servicing Solutions — Investor Presentation (December 2013)
40 slides from Home Loan Servicing Solutions's investor presentation, Dec 3, 2013
Slide 1: HLSS Investor Presentation December 2013
Exhibit 99.1 HOME LOAN HLSS Investor SOLUTIONS SERVICING December Presentation 2013TM
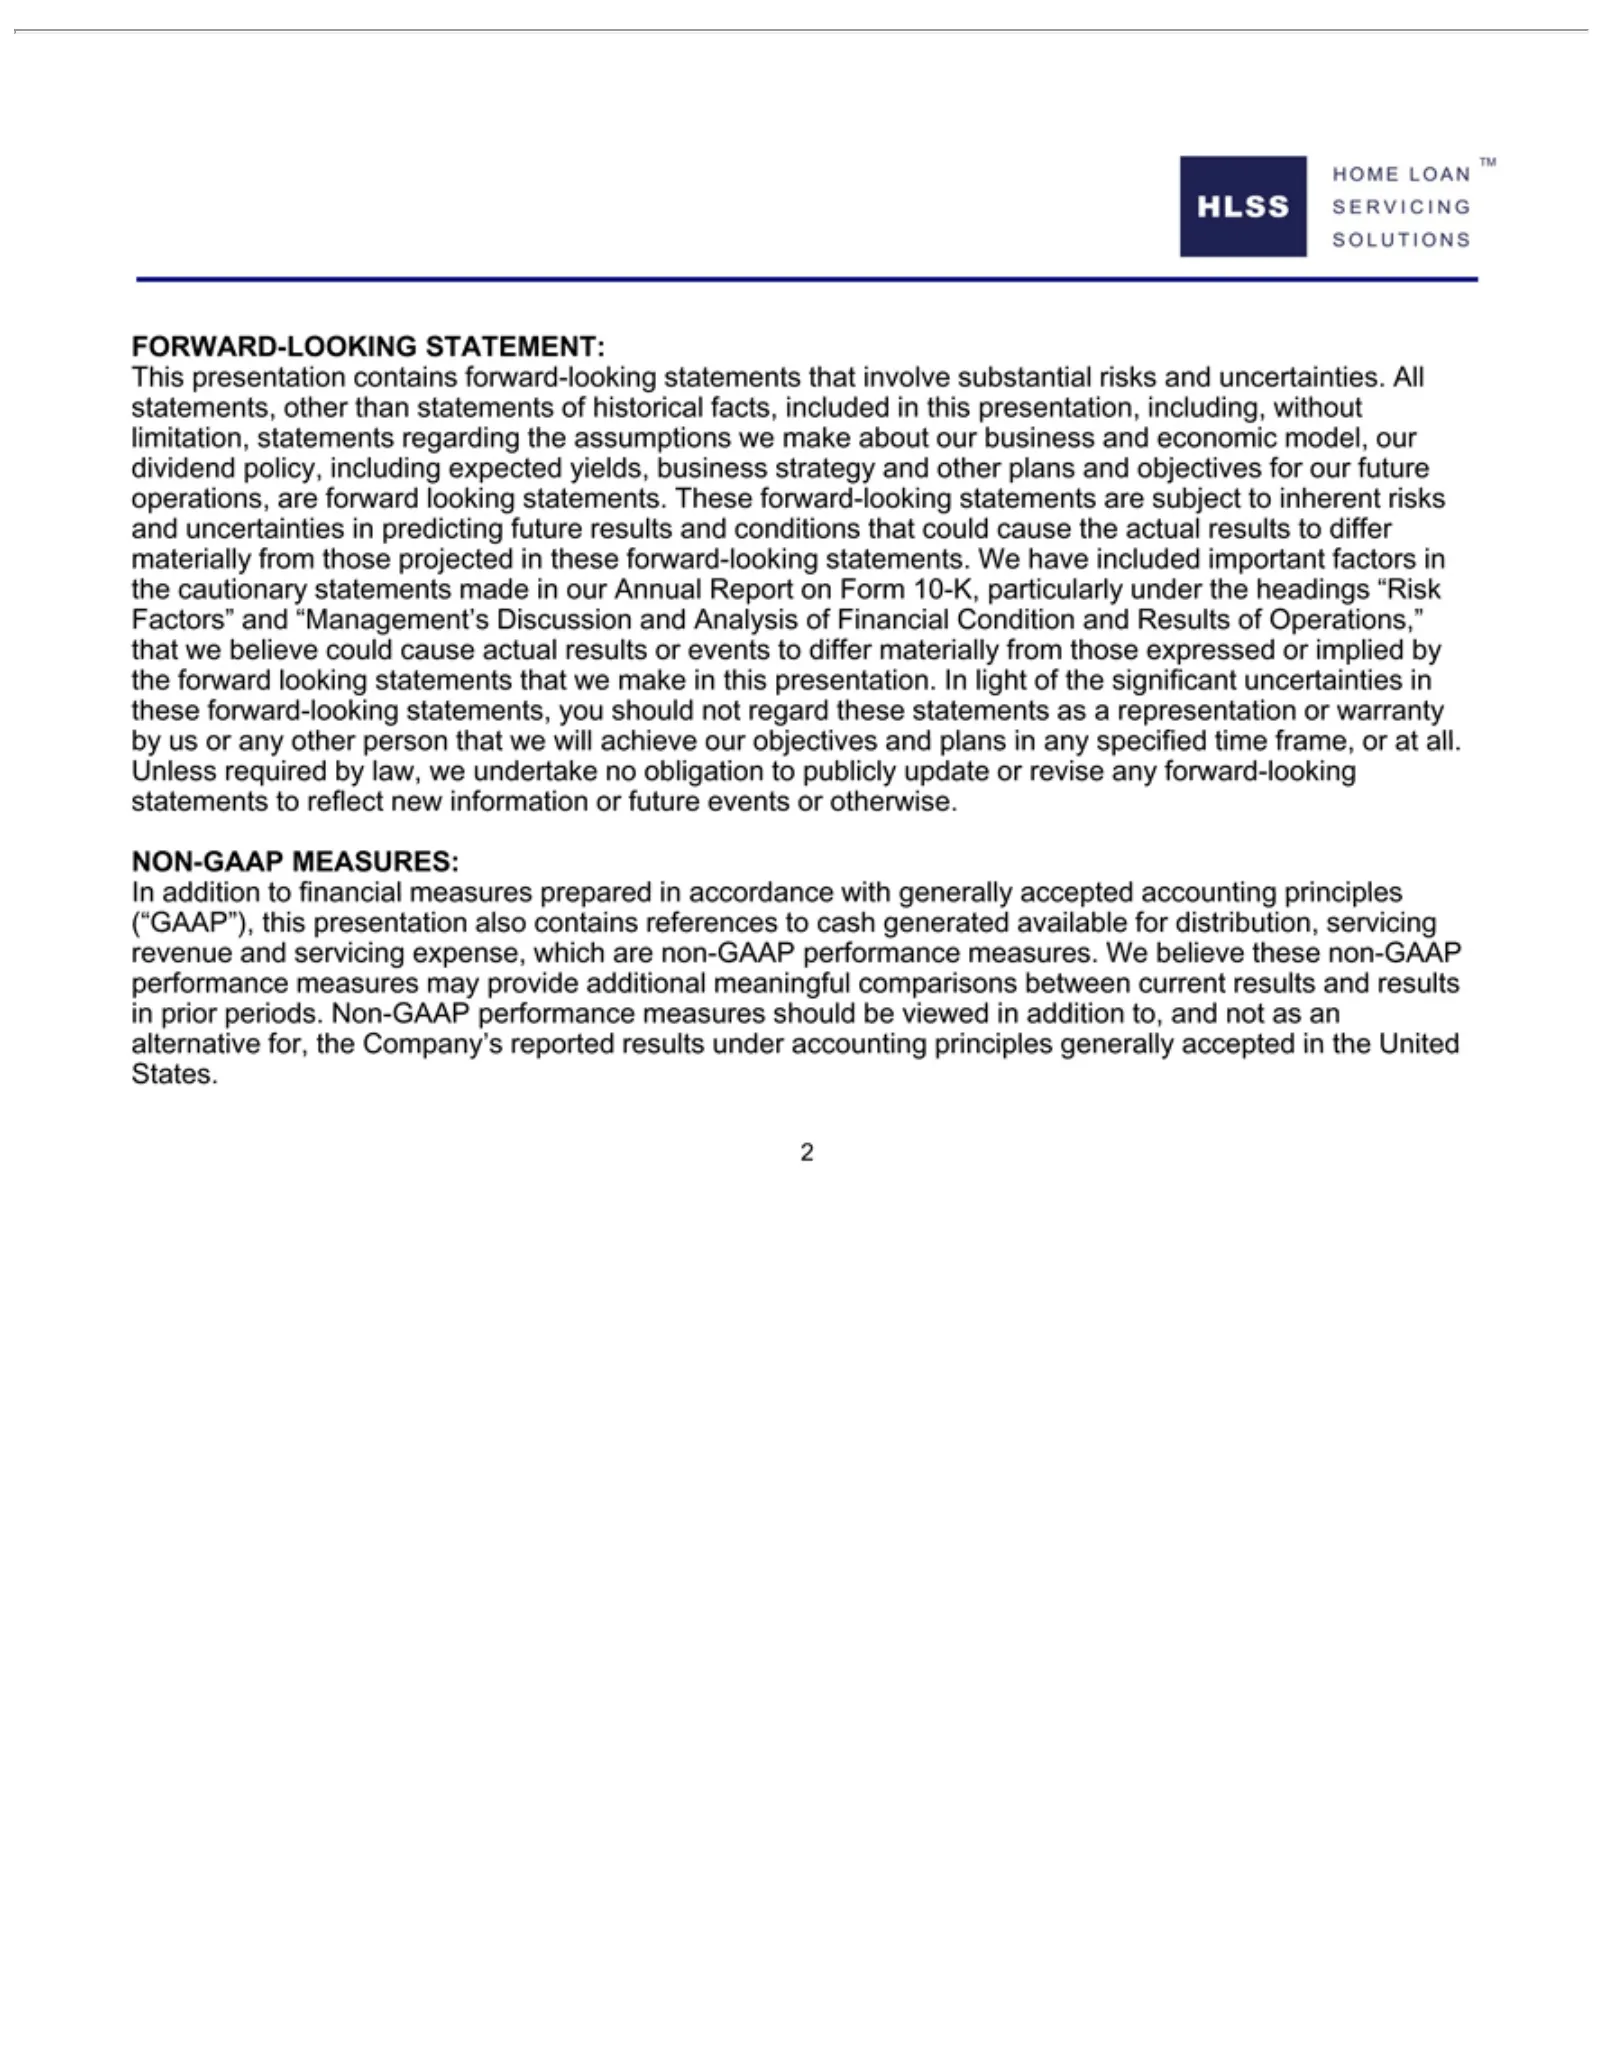
Slide 2: Forward-Looking Statements and Non-GAAP Measures
HOME HLSS FORWARD-LOOKING SOLUTIONS SERVICING This statements forward projected “Management’s looking other new NON-GAAP In revenue 2prior addition information presentation periods. person LOAN statements and looking inregarding tothese servicing that MEASURES: Non-GAAP financial TM Discussion state
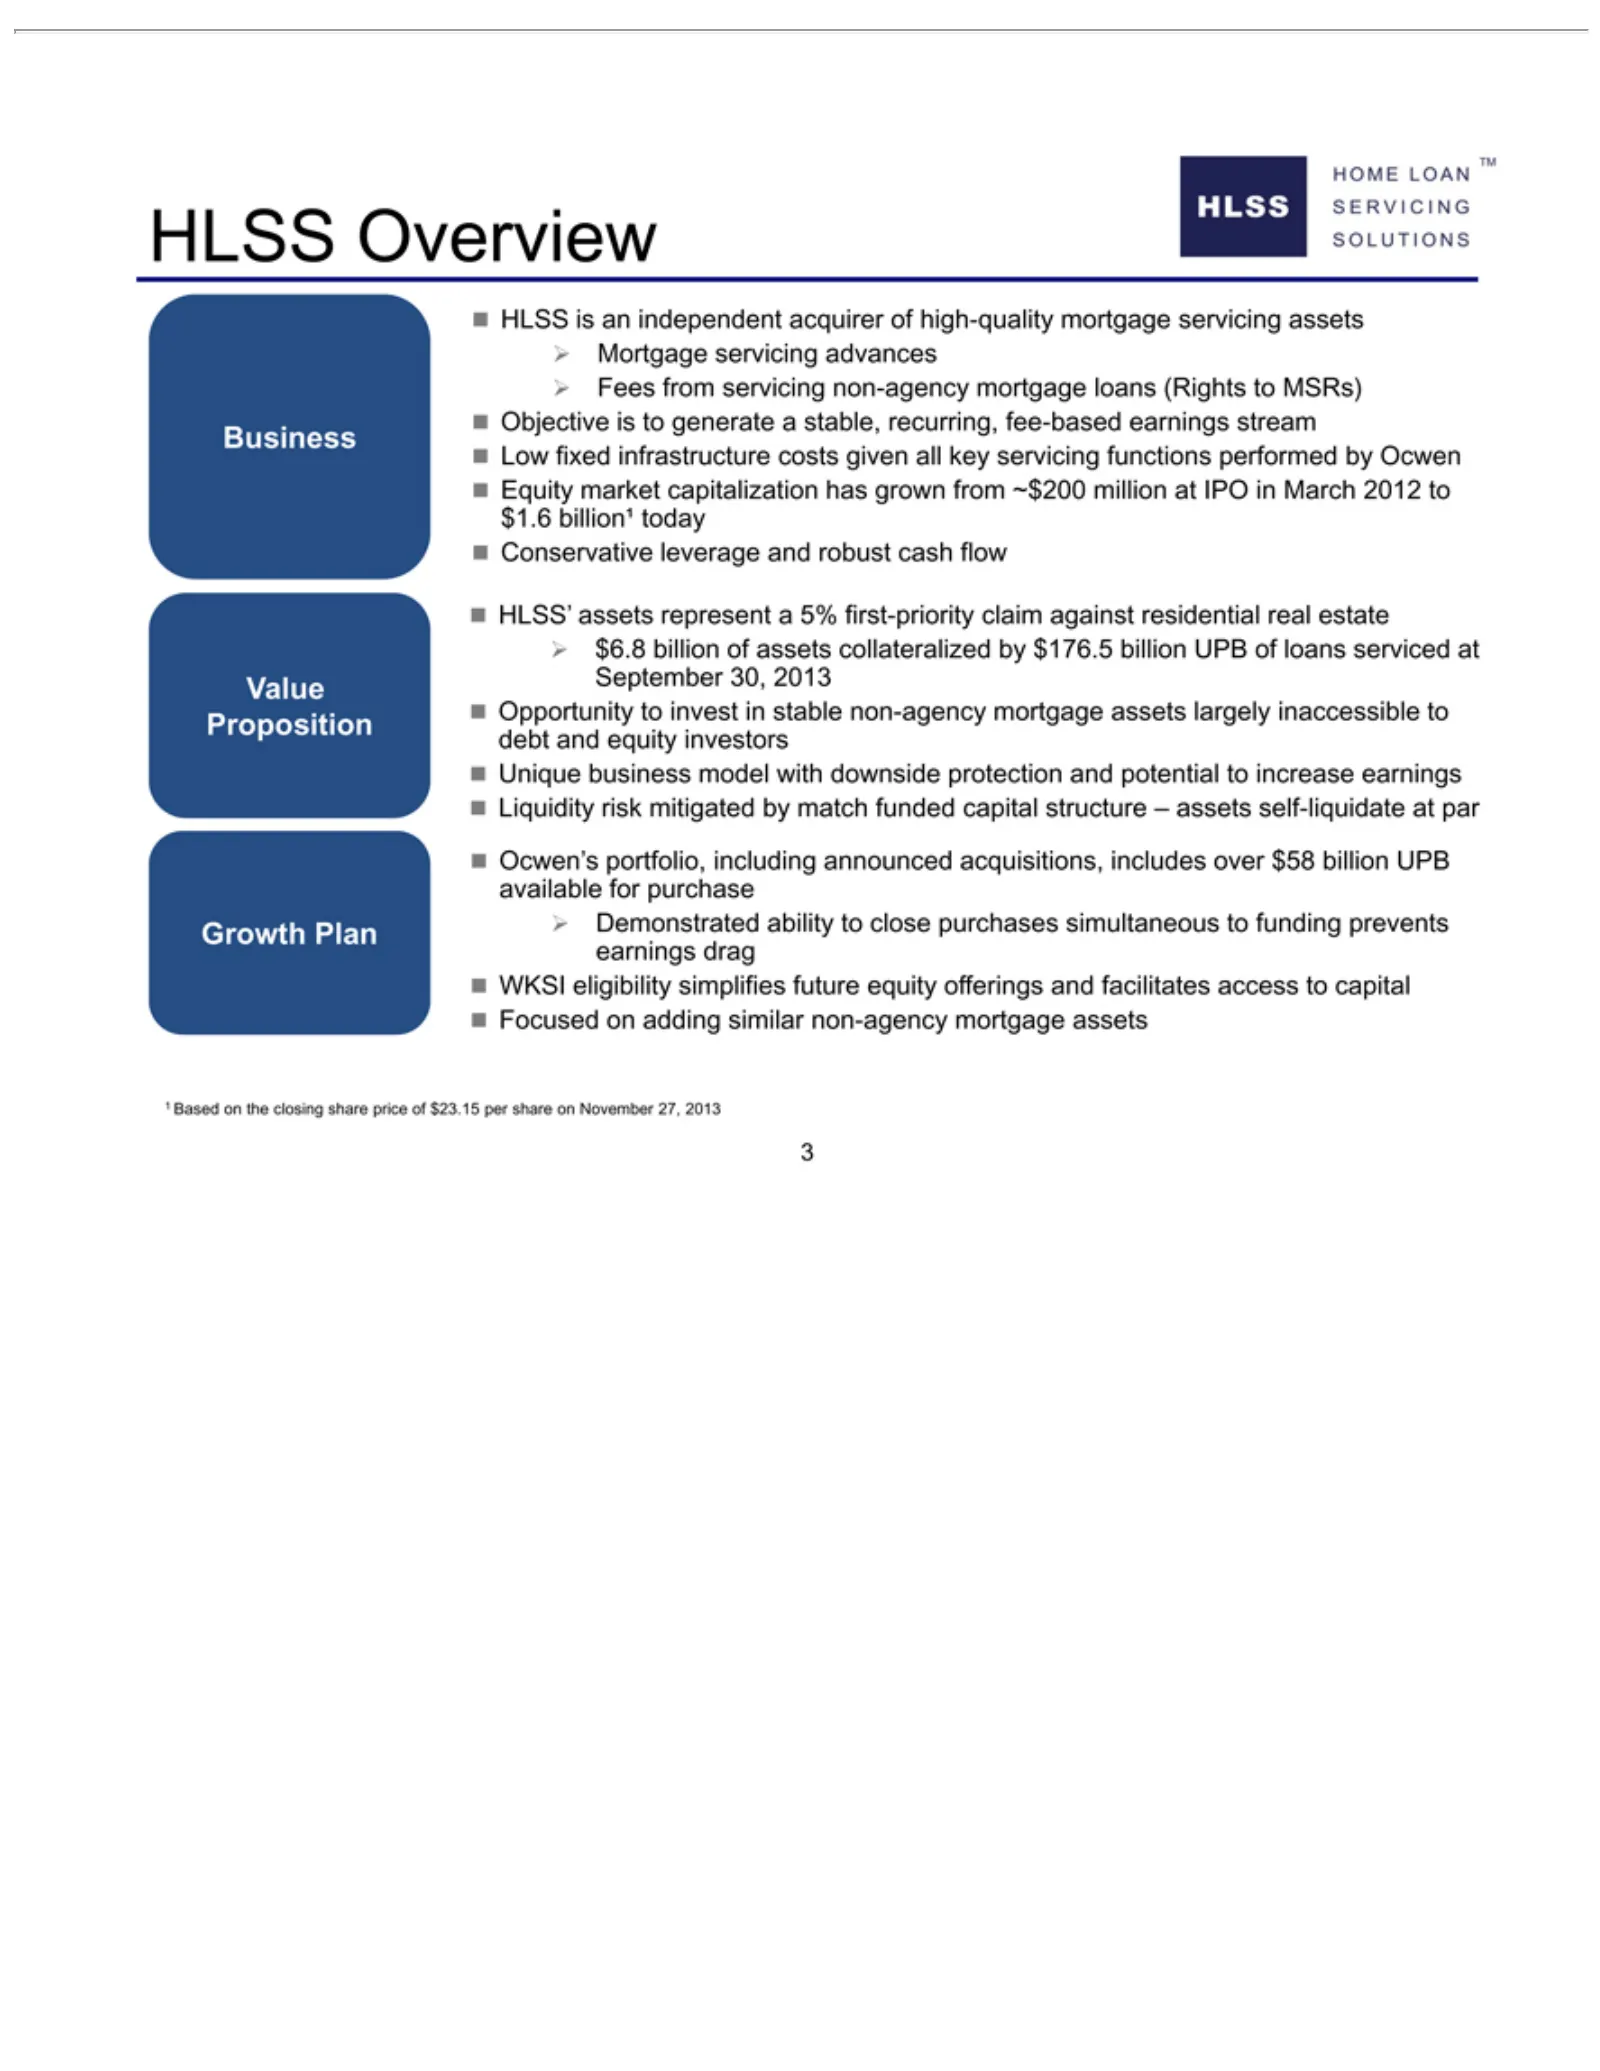
Slide 3: HLSS Business Overview
HOME SOLUTIONS SERVICING Growth Proposition Value Business HLSS Mortgage Fees Objective Low Equity Conservative HLSS’ $6.8 Opportunity Unique Liquidity Ocwen’s Demonstrated WKSI 31Focused Based billion fixed from Overview is eligibility market assets business LOAN Plan on on an portfolio, risk is se
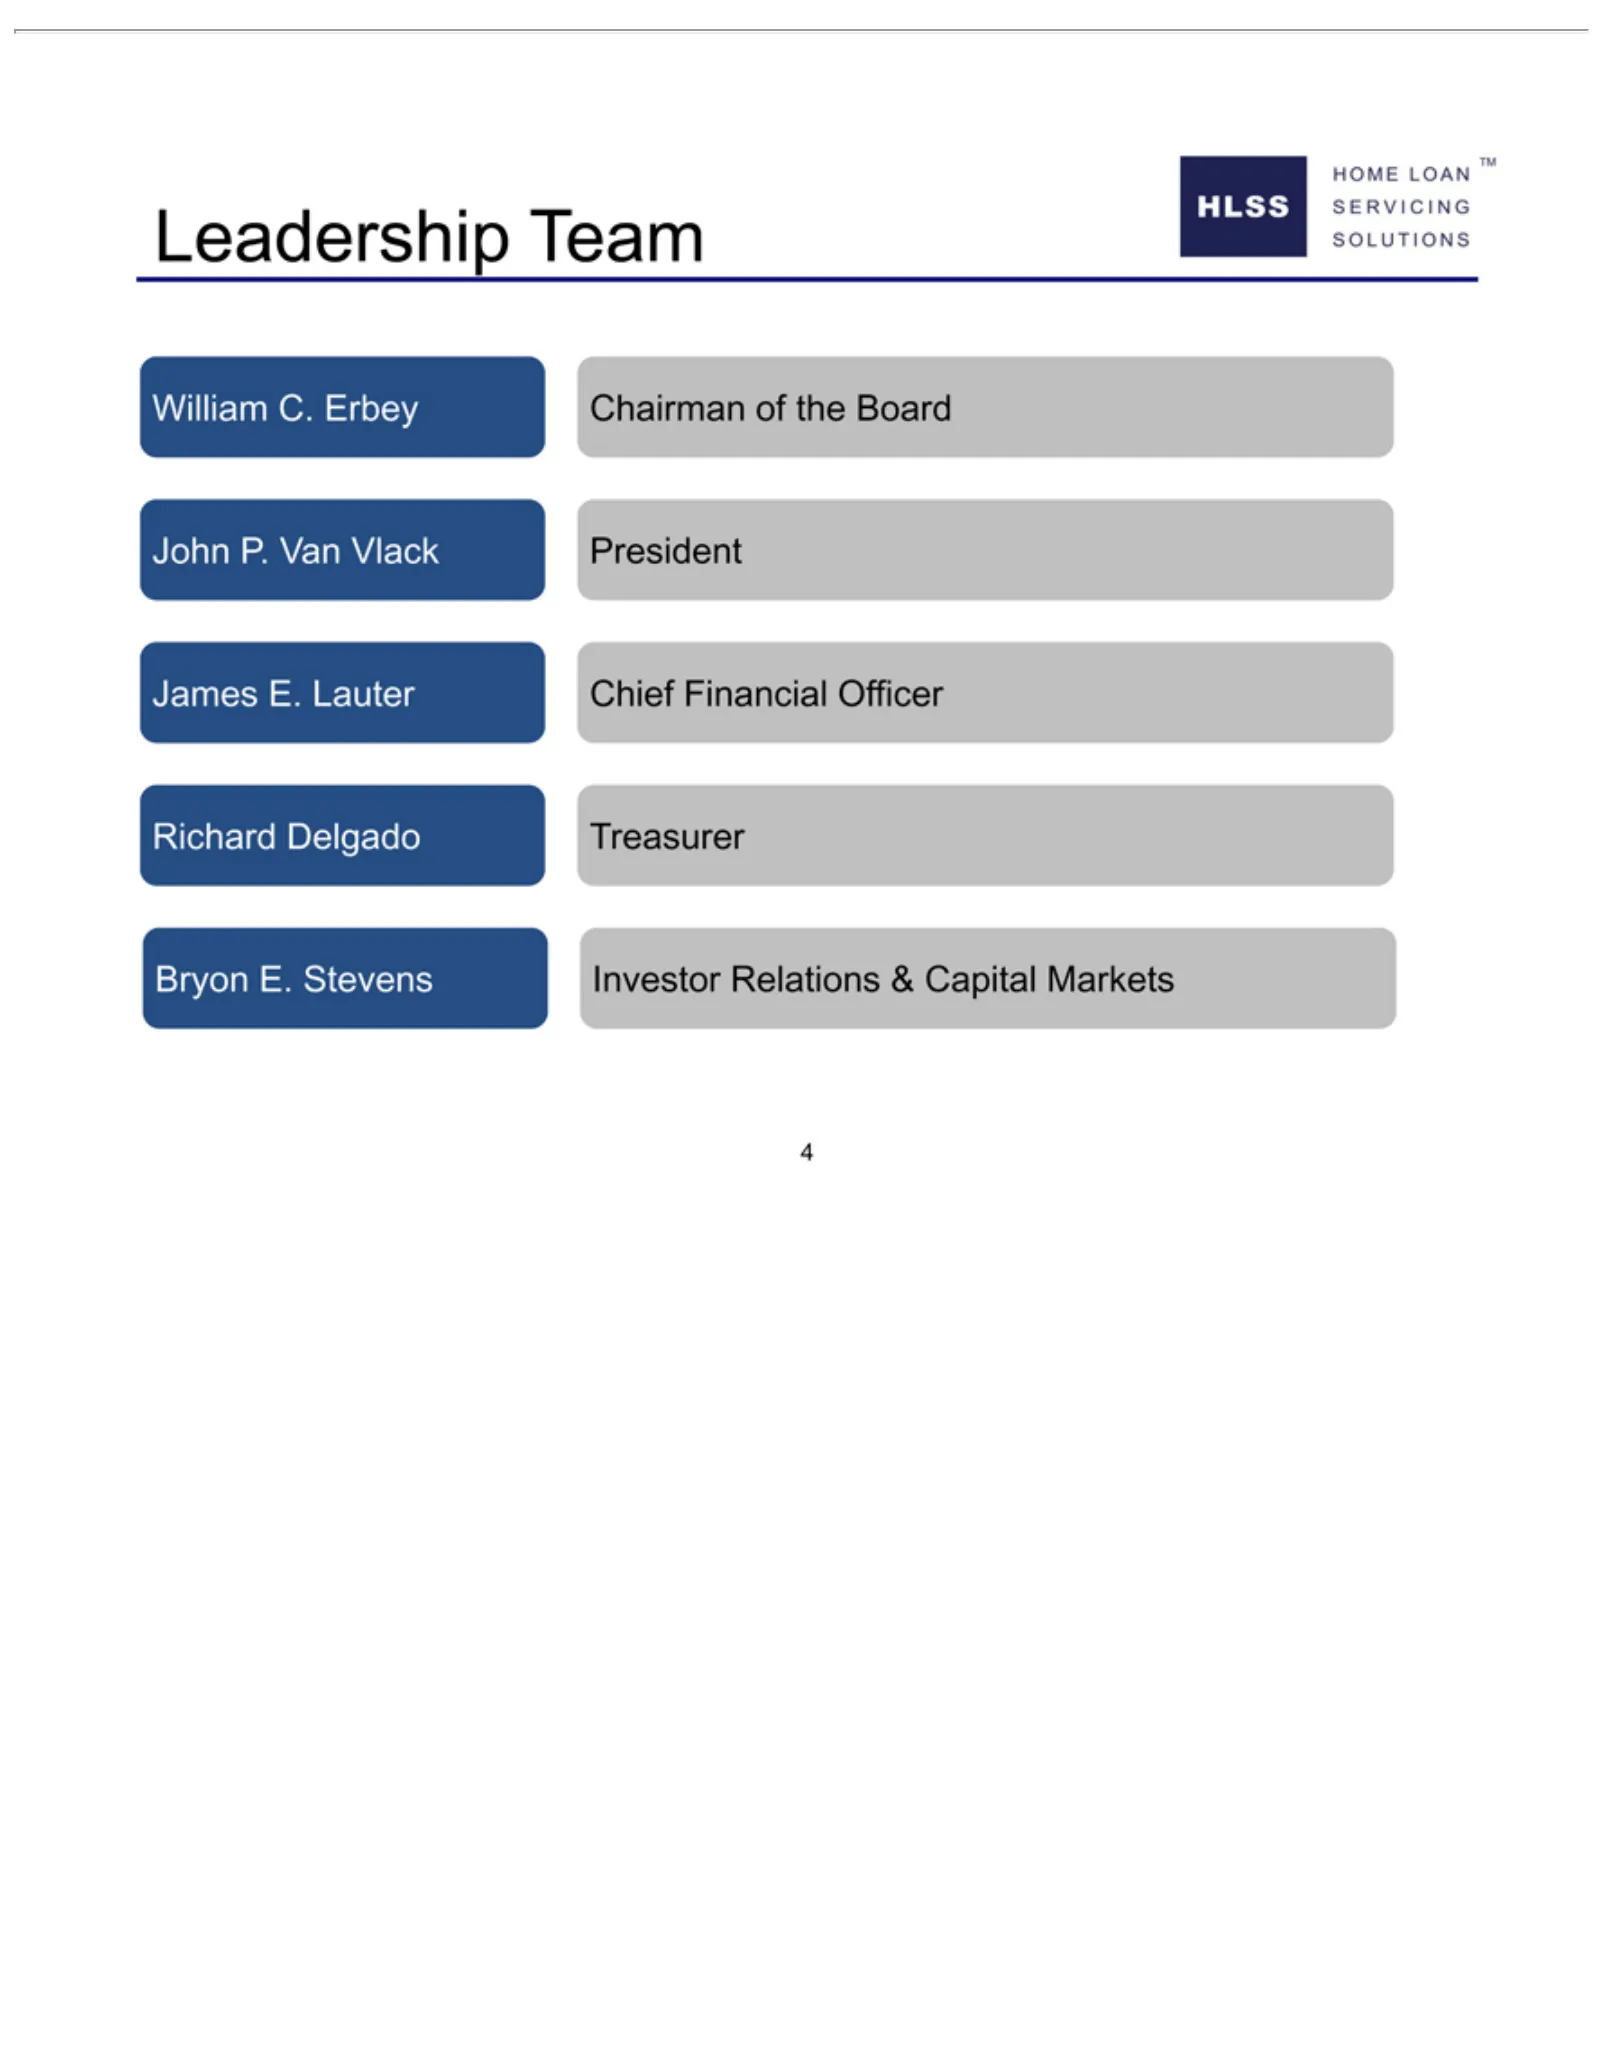
Slide 4: HLSS Leadership Team
HOME HLSS Leadership SOLUTIONS SERVICING William John James Richard 4Bryon P.E.Van LOAN Delgado C. Lauter Stevens Erbey Team Vlack TMChief Treasurer Investor Chairman President Financial Relations of the Officer Board & Capital Markets
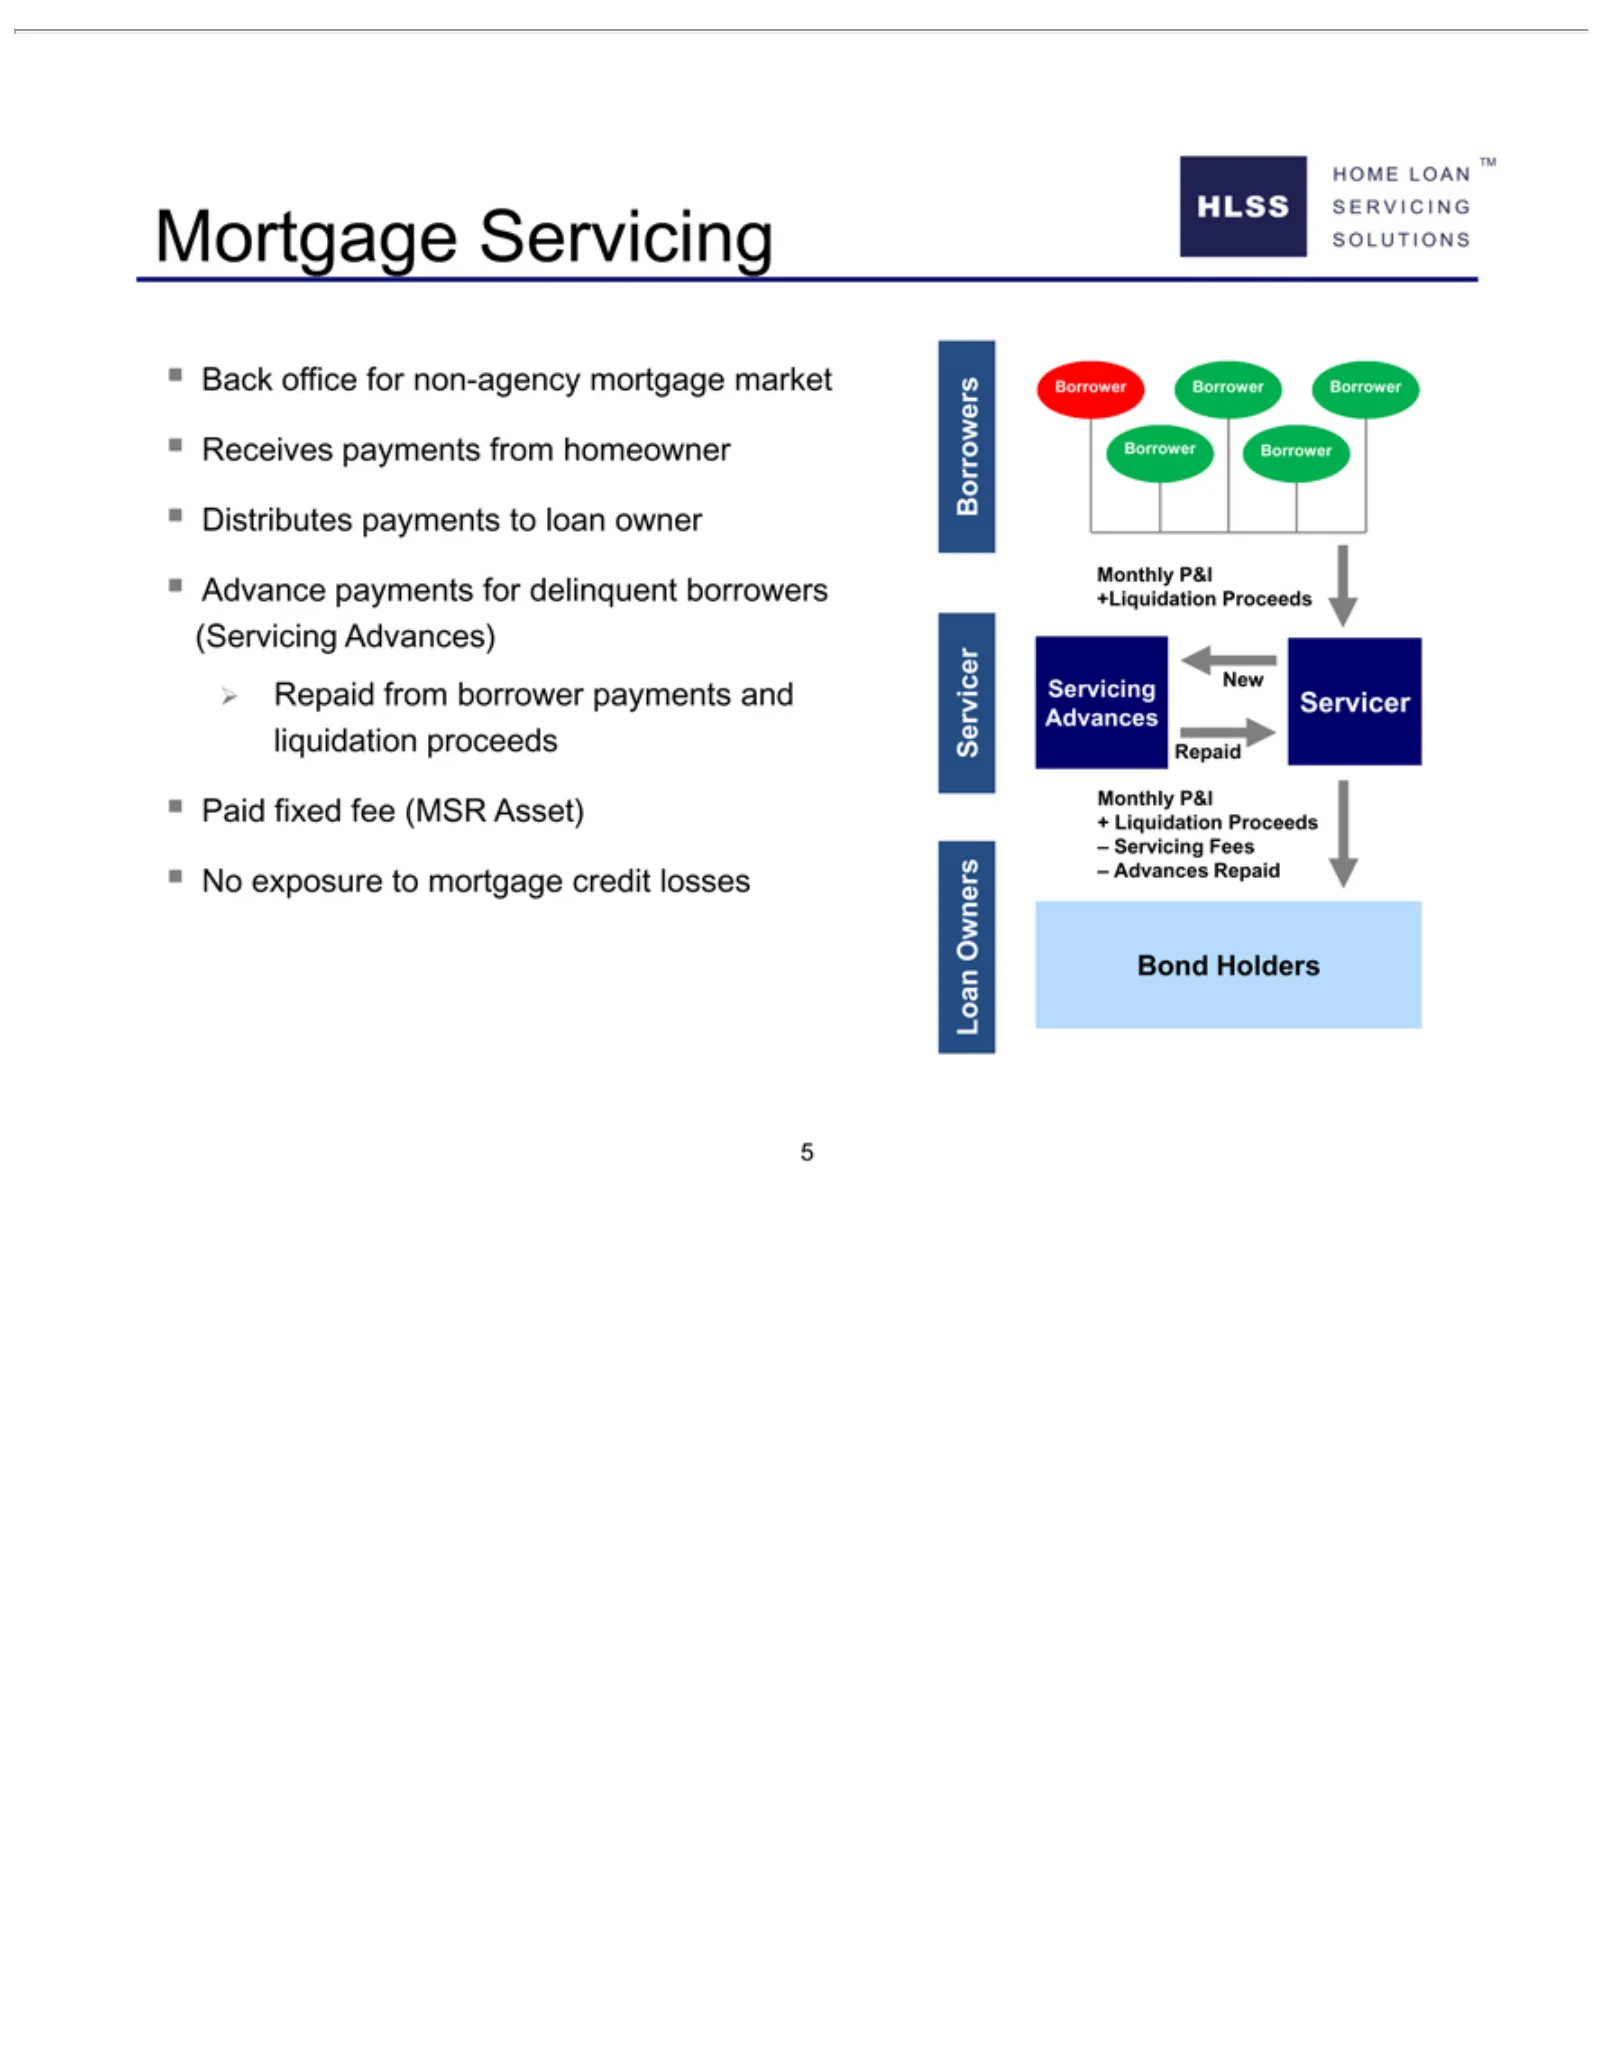
Slide 5: HLSS Mortgage Servicing Cash Flows
HOME HLSS Mortgage SOLUTIONS SERVICING Back Receives Distributes Advance Paid No Borrower Borrowers +Liquidation Servicer Monthly Repaid –+ 5Loan Advances Servicing Liquidation exposure fixed Owners office from LOAN Servicing P&I payments Borrower Servicing fee Borrower payments Fees for Repaid borr
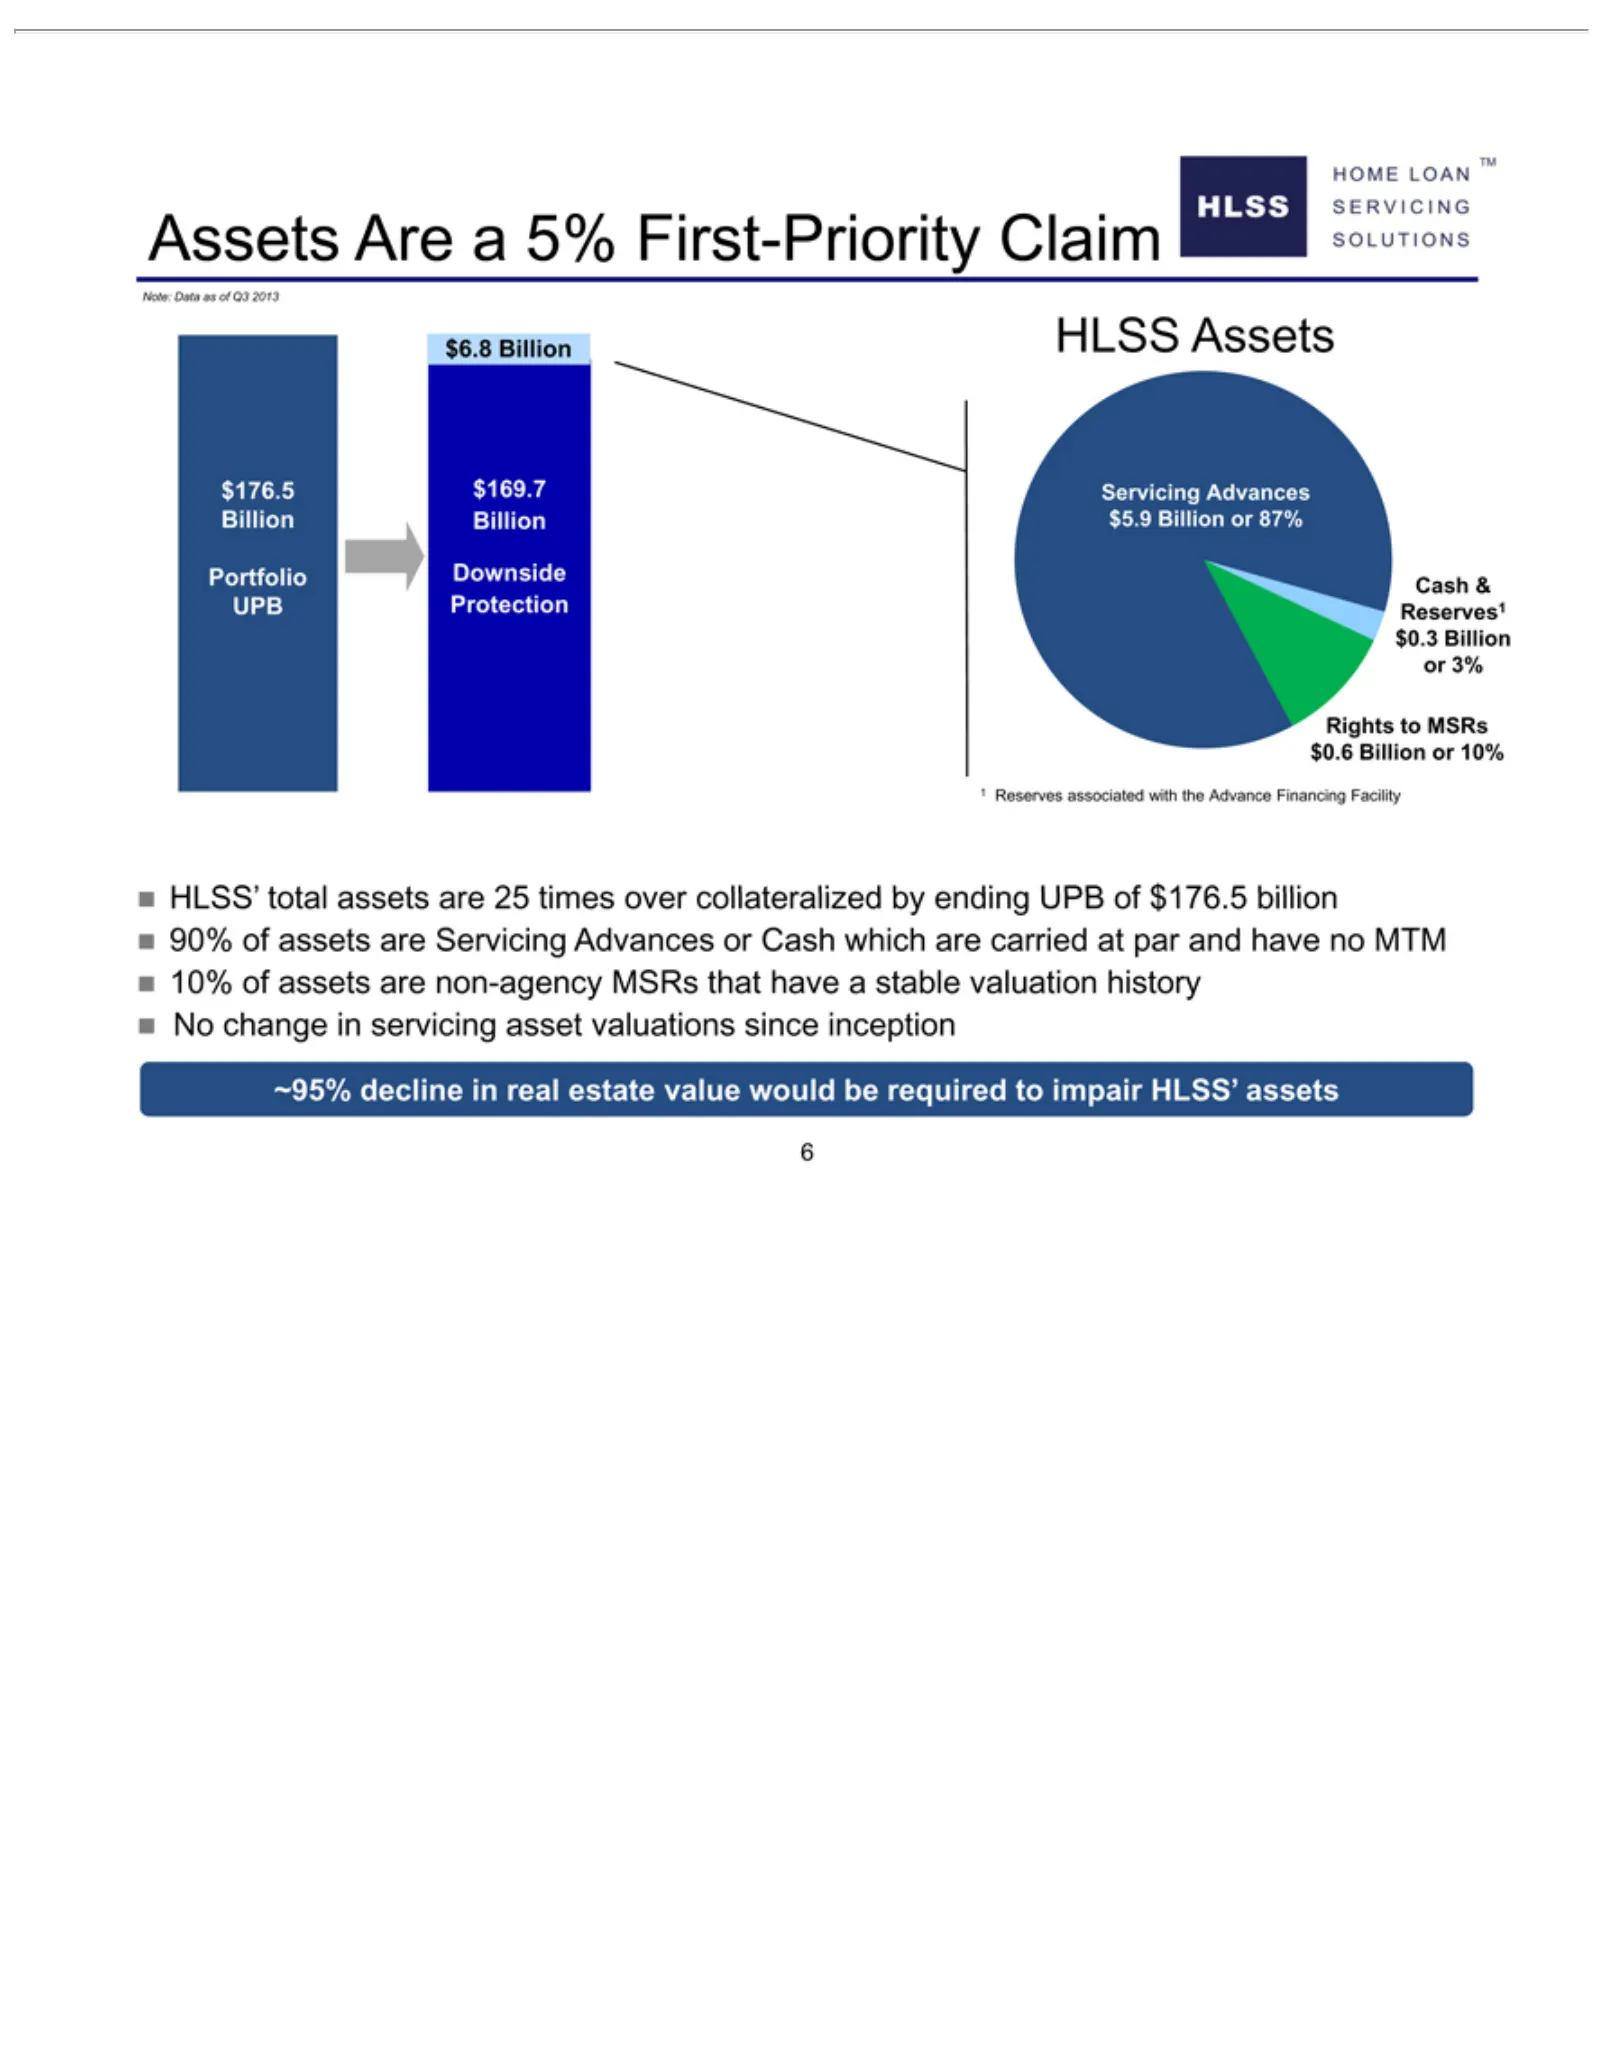
Slide 6: HLSS Assets
HOME Assets SOLUTIONS SERVICING Note: $6.8 $176.5 Portfolio HLSS Servicing Cash 1Rights HLSS’ 90% 10% No 6~95% Reserves change Billion of & Data decline Assets Are to total Billion assets LOAN Reserves1 UPB MSRs Advances in aas associated assets 5% servicing of are in Downside $169.7 TM $0.6 Q3 real
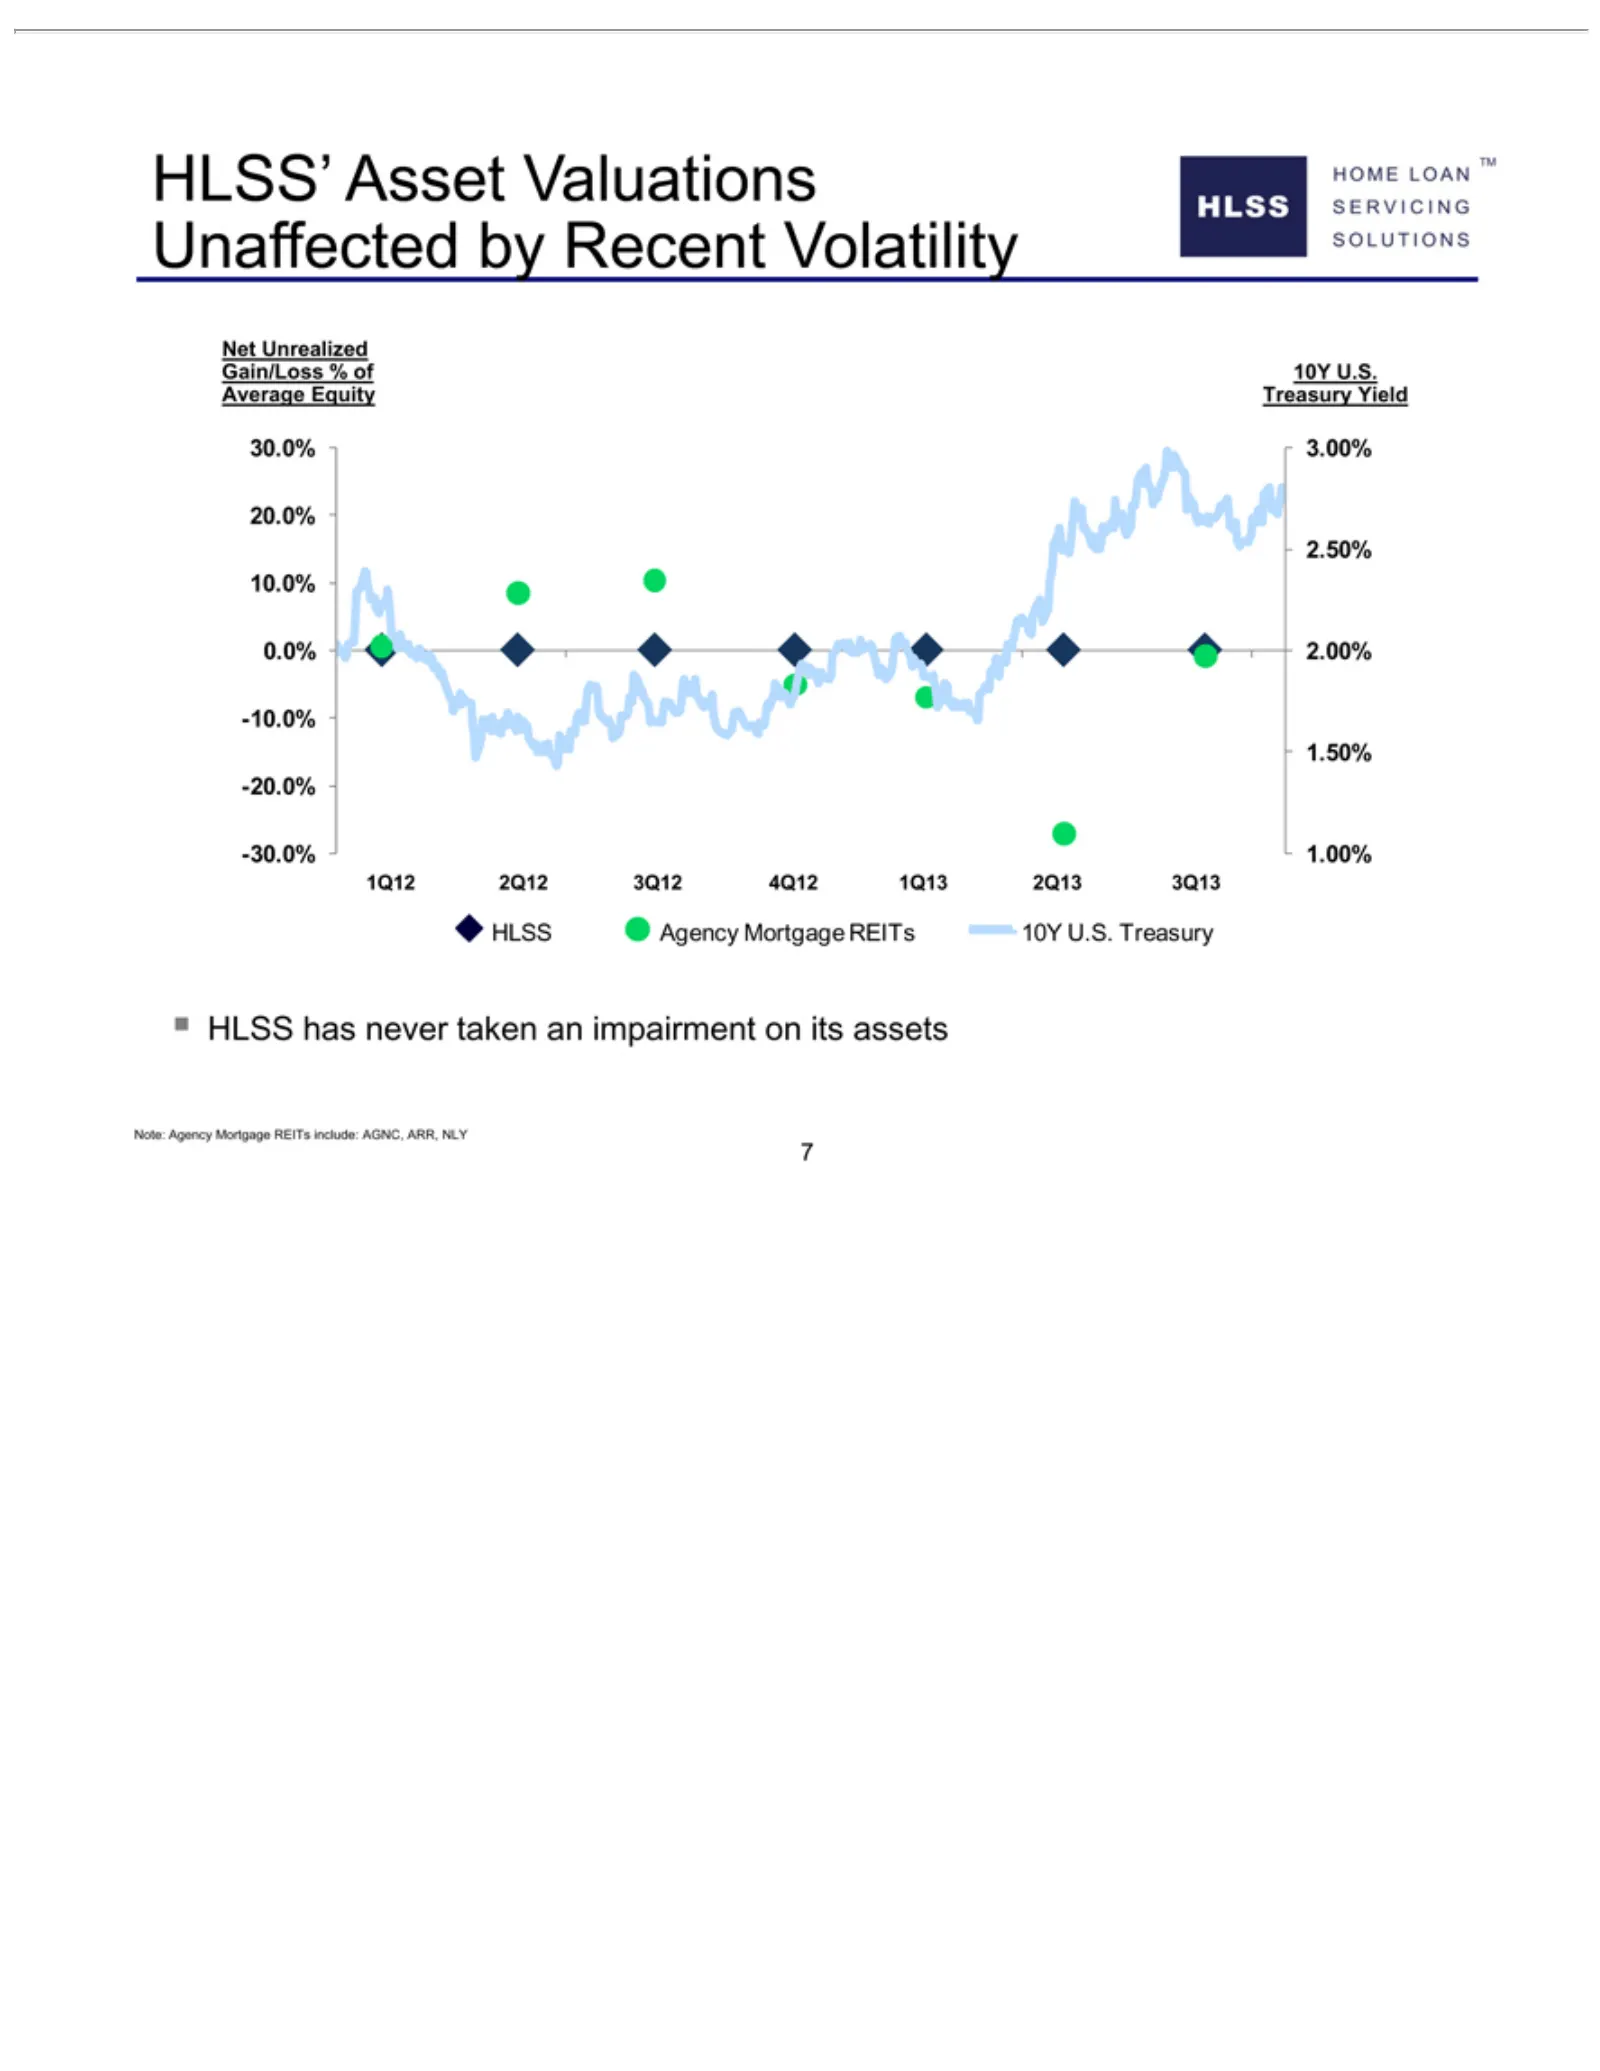
Slide 7: HLSS' Assets Unaffected by Recent Volatility
HOME HLSS’ SOLUTIONS SERVICING Net 30.0% 0.0% 10.0% 2.50% 20.0% -30.0% -20.0% 1.50% -10.0% 1Q12 HLSS 7Note: Unrealized 2.00% Agency 2Q12 Agency has 3.00% Asset 1.00% LOAN never 3Q12 Valuations Mortgage Mortgage TM Gain/Loss taken 4Q12anUnaffected 1Q13 REITs REITs impairment % of2Q13 include: Average
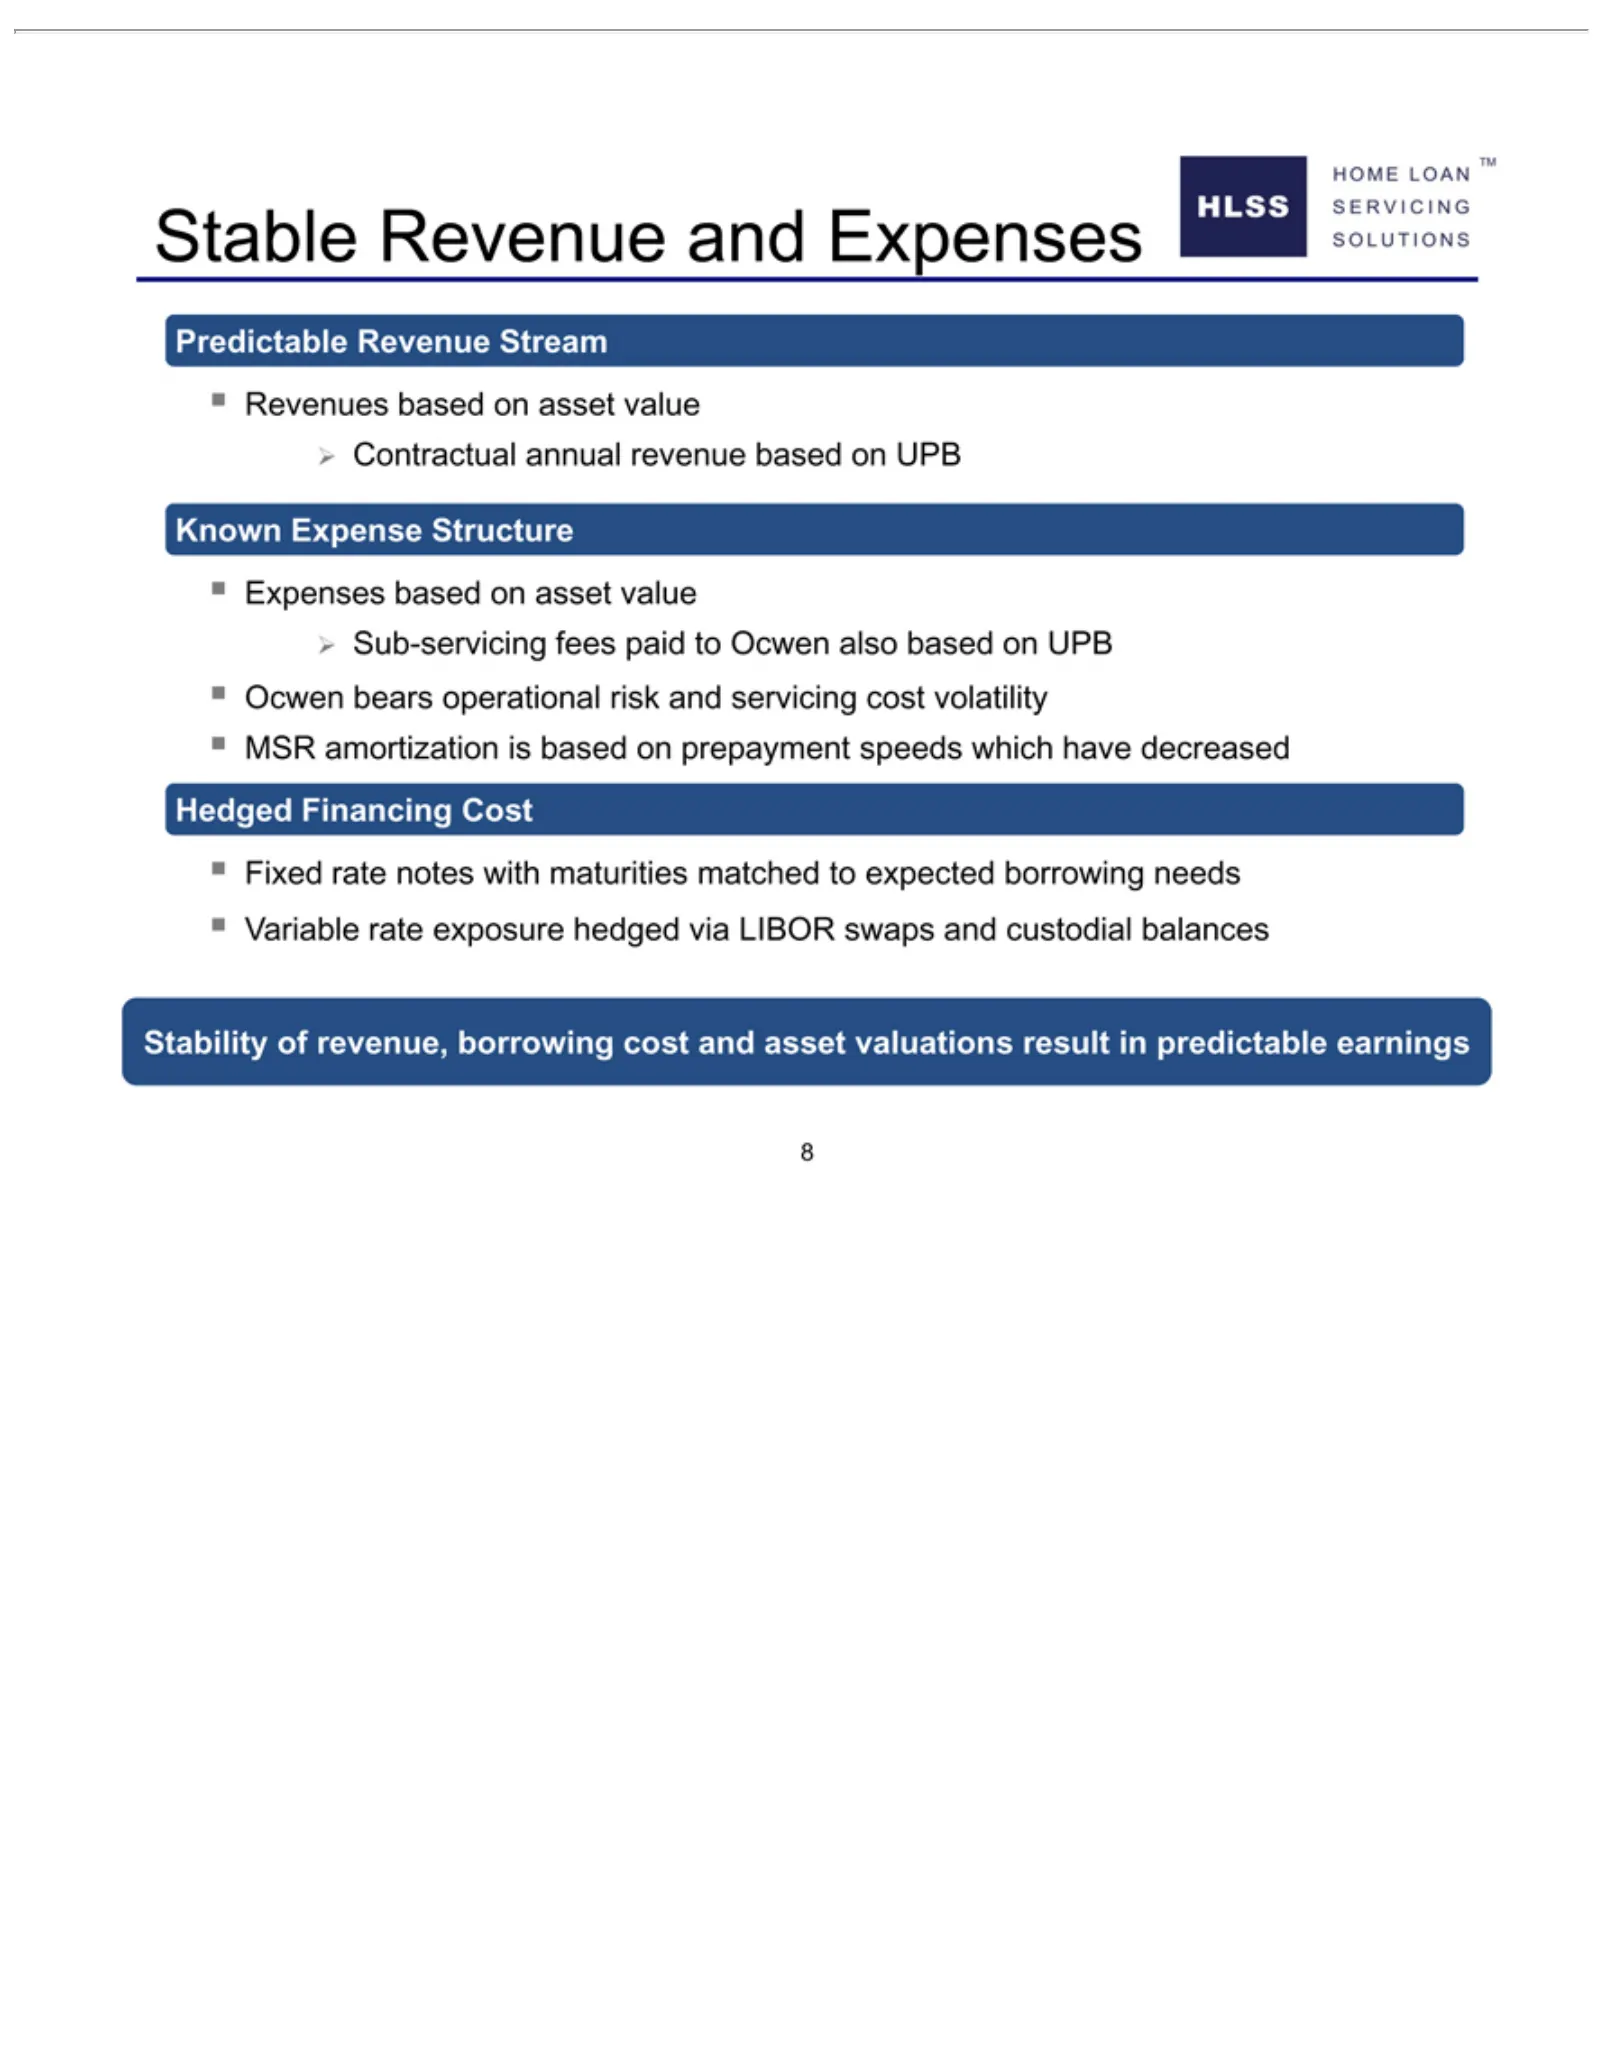
Slide 8: HLSS Stable Revenues and Expenses
HOME HLSS Stable SOLUTIONS SERVICING Predictable Revenues Contractual Known Expenses Sub-servicing Ocwen MSR Hedged Fixed Variable 8Stability amortization rate Revenue bears LOAN Expense Financing rate ofbased based notes revenue, Revenue annual exposure operational fees TM and on with on Structure
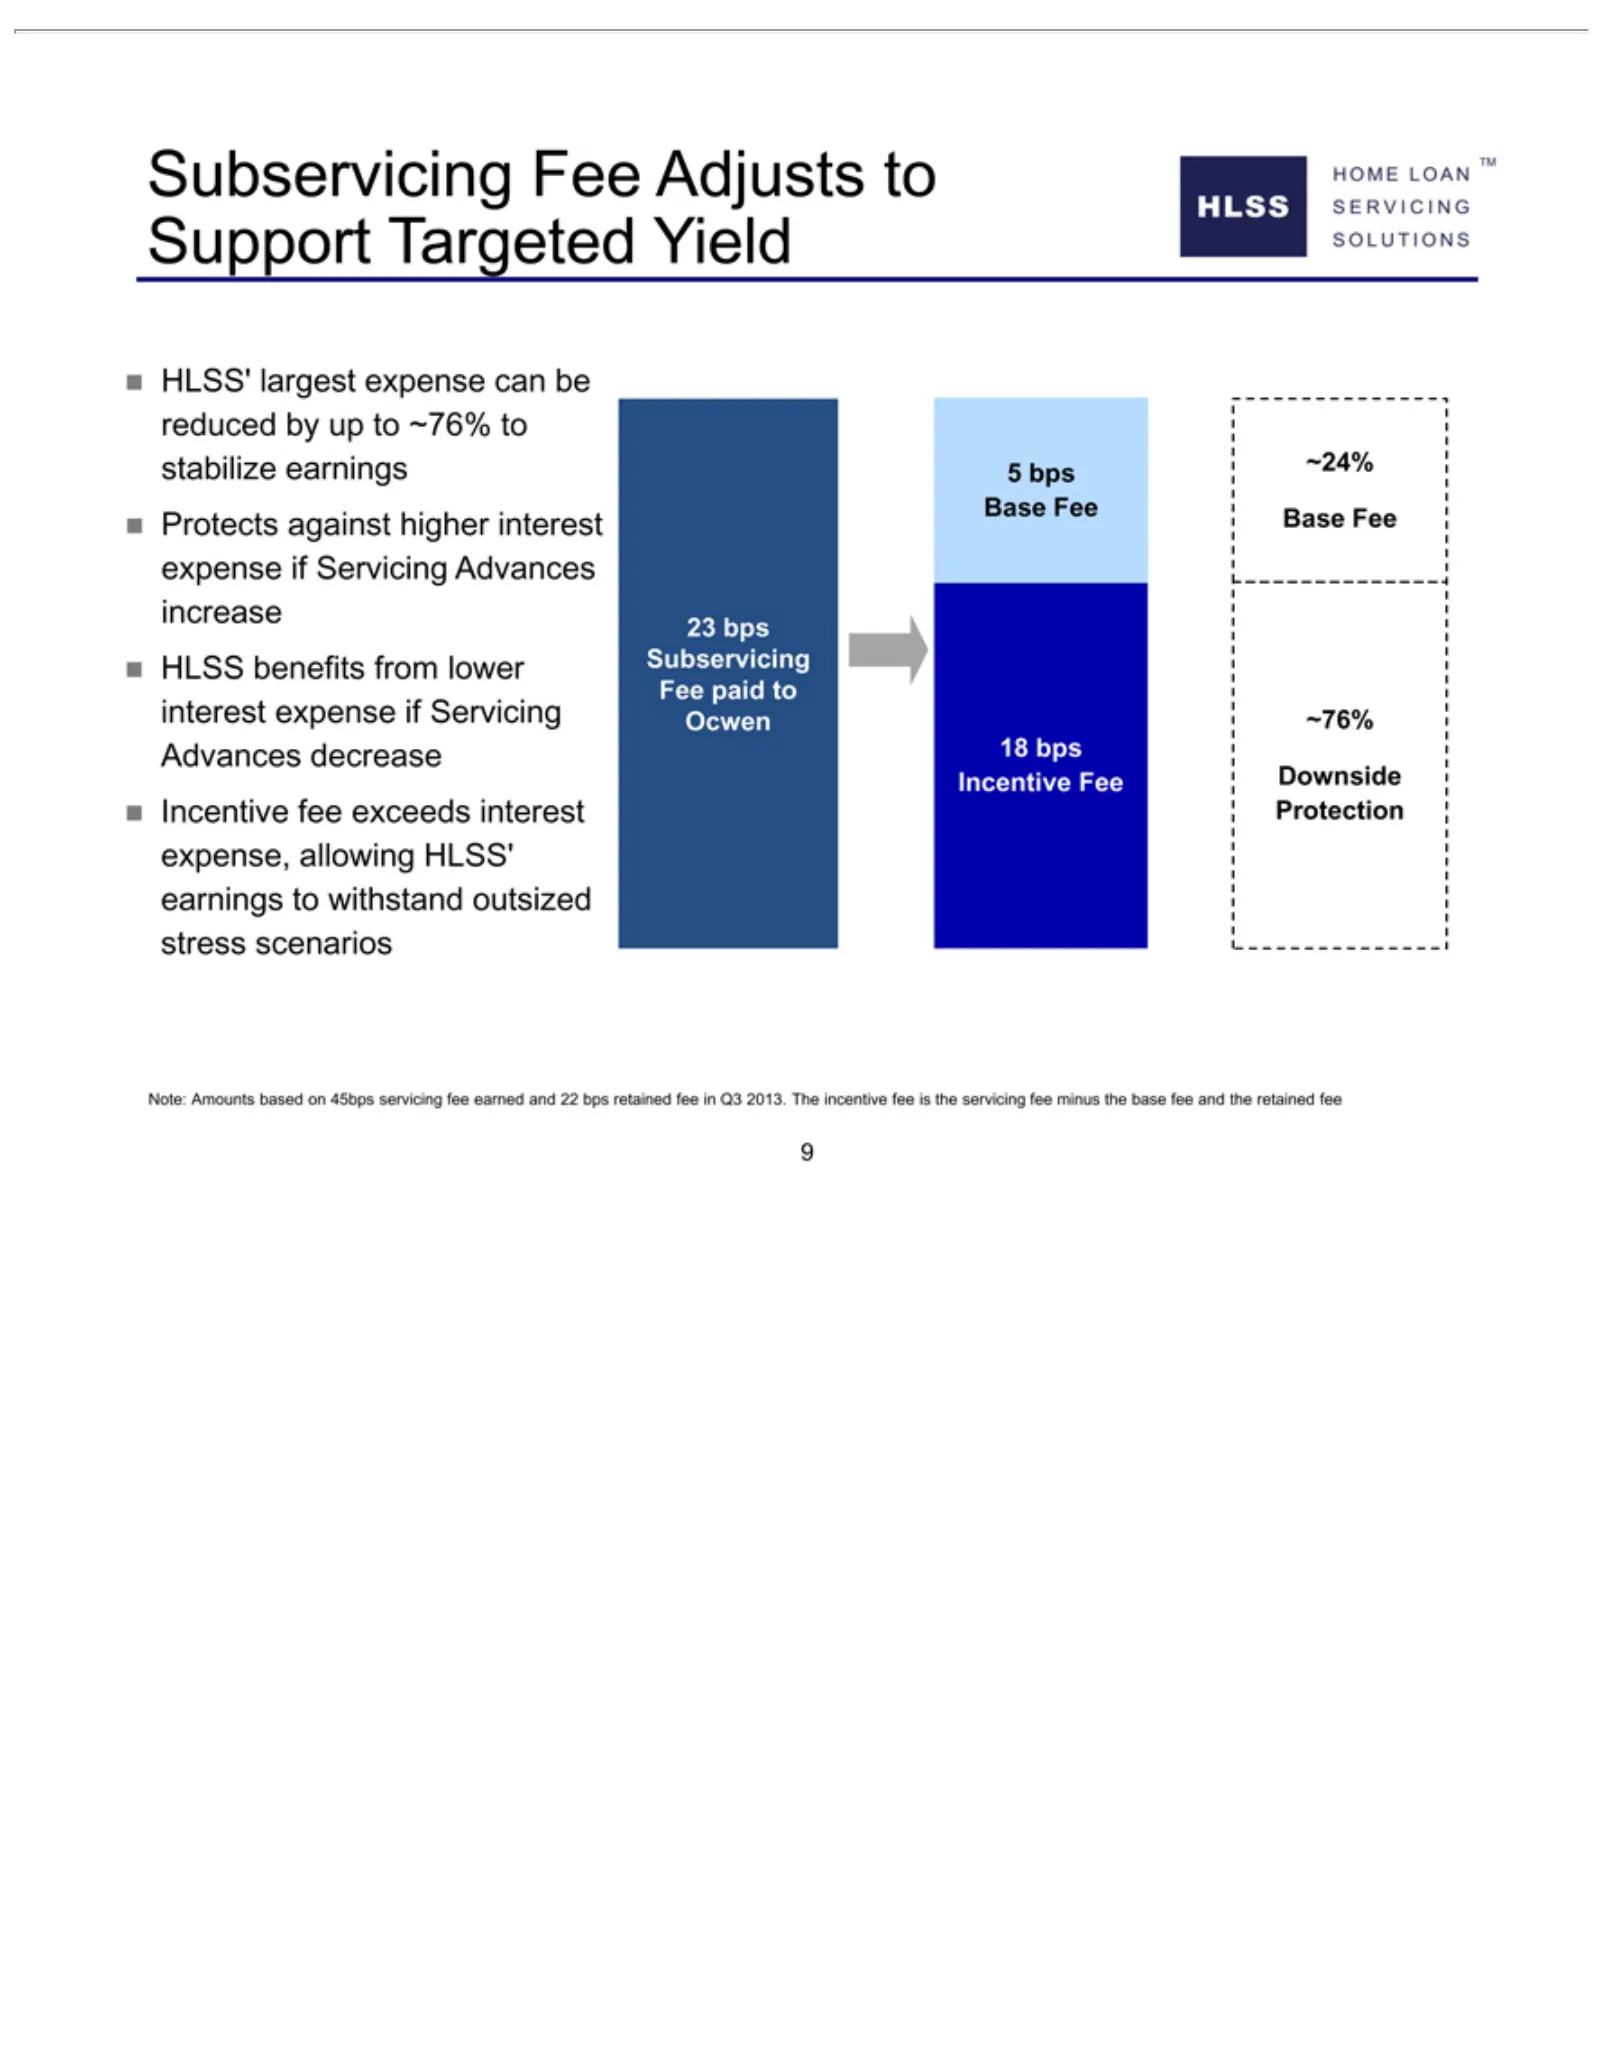
Slide 9: Subservicing Fee Structure
HOME Subservicing SOLUTIONS SERVICING HLSS’ Protects HLSS 5Incentive ~24% 23 18 ~76% 9Note: bps bpsBase Amounts Base Downside benefits Subservicing Incentive largest LOAN against fee Fee Fee exceeds Fee expense from TM based higher Fee Protection Adjusts lower Fee interest on can interest paid 45bps
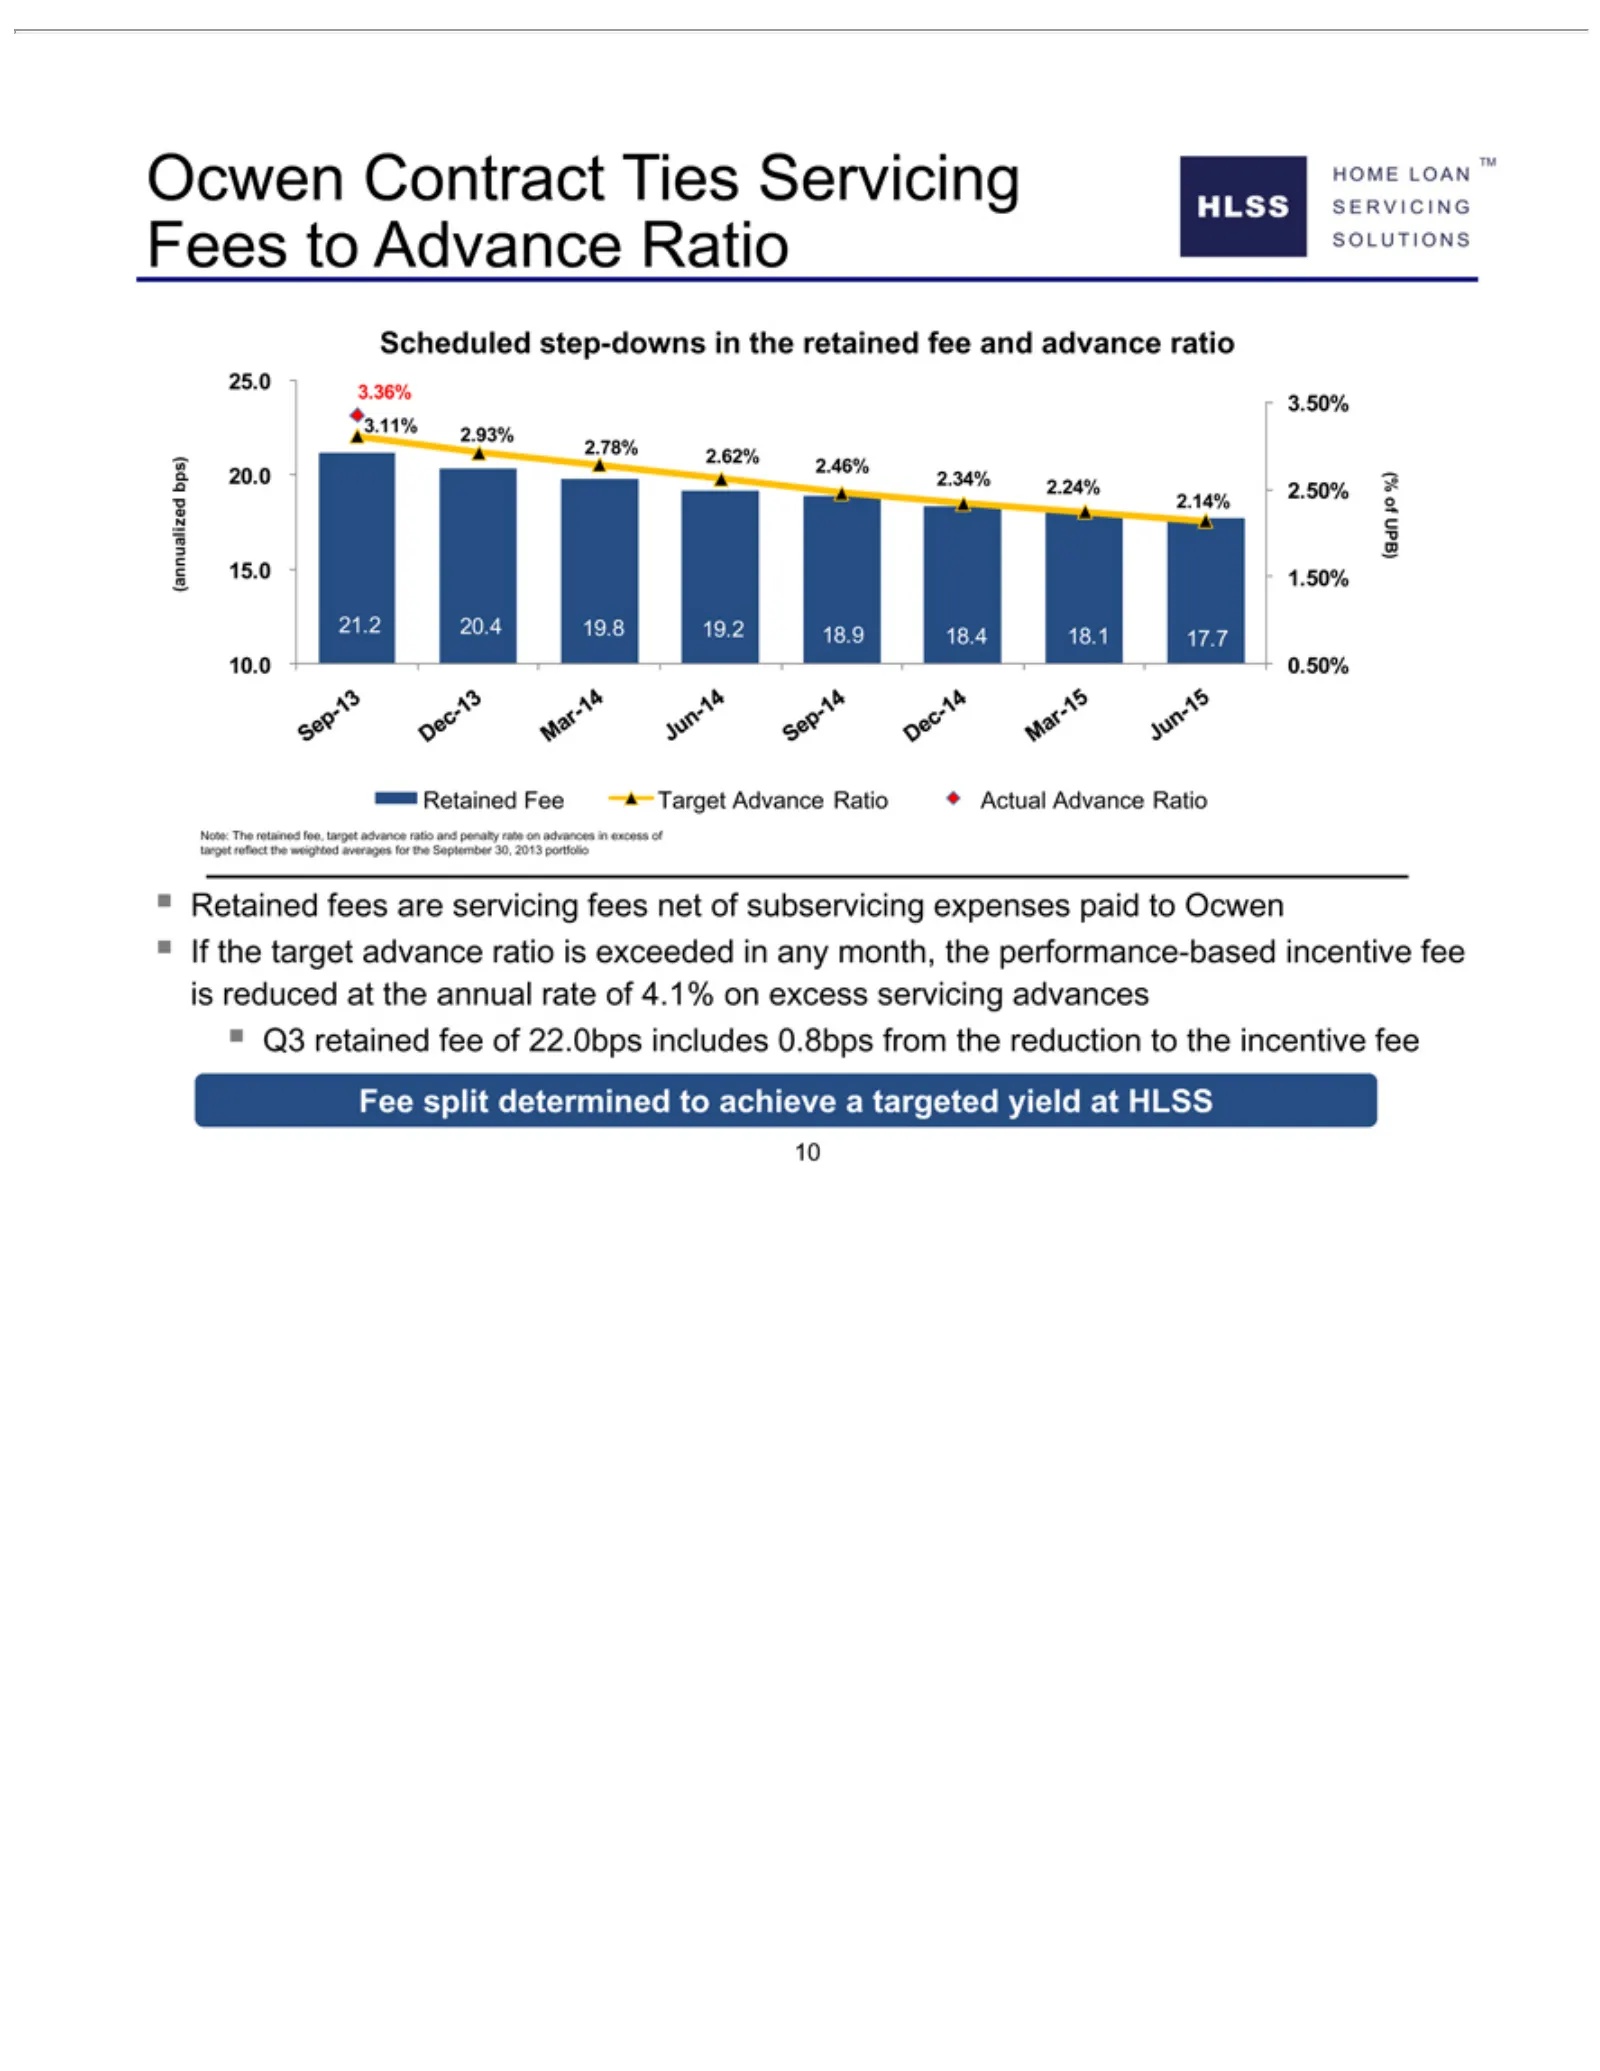
Slide 10: Ocwen Retained Fee and Advance Ratio
HOME HLSS Ocwen SOLUTIONS SERVICING Scheduled (annualized 25.0 3.11% 3.50% 2.78% 20.0 2.24% 15.0 2.14% 21.2 10.0 (% Sep-13 Note: Retained If Q3 Fee 10 the of retained split 3.36% 2.46% 1.50% 20.4 0.50% target The UPB) 2.93% 2.62% 2.50% Contract Dec-13 LOAN determined Fee fees 19.8 retained step-down
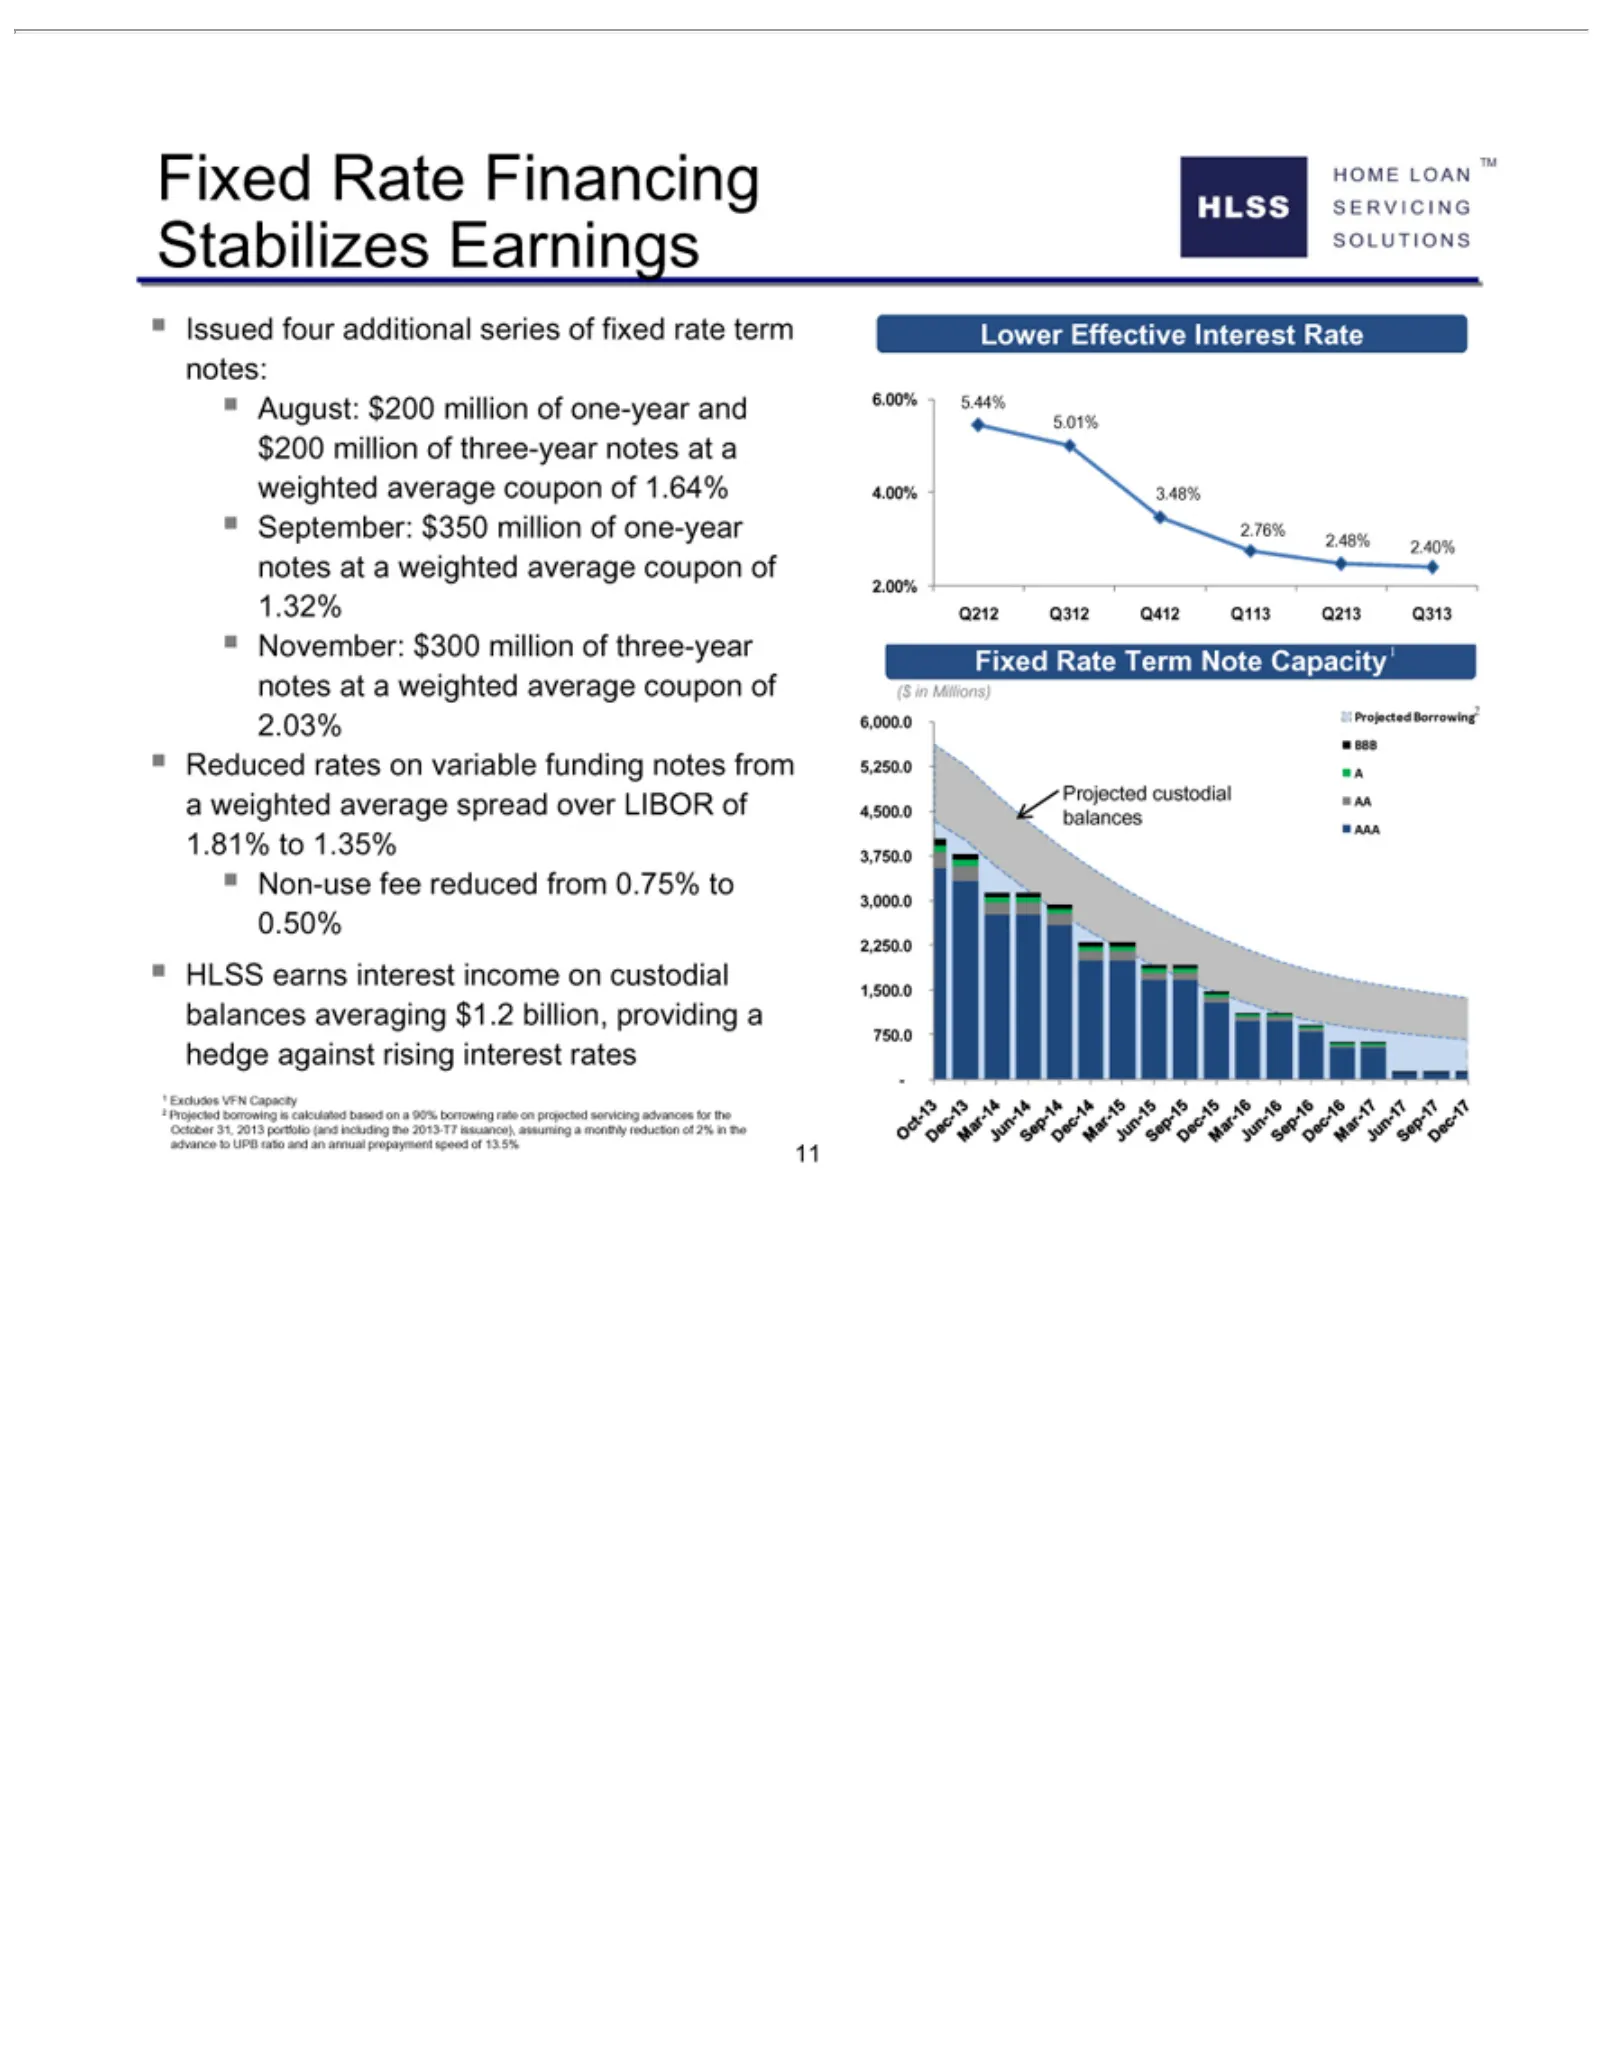
Slide 11: HLSS Financing Structure
HOME SOLUTIONS SERVICING Issued August: September: November: Reduced Non-use 21HLSS advance Lower 6.00% 4.00% 5.01% 2.48% 2.76% Q212 2.00% Fixed ($ 6,000.0 5,250.0 BBB Projected 4,500.0 -O 750.0 1,500.0 2,250.0 3,000.0 3,750.0 AAA 11ct-13 Excludes Projected in Millions) Q312 Rate earns four 5.44% 3.
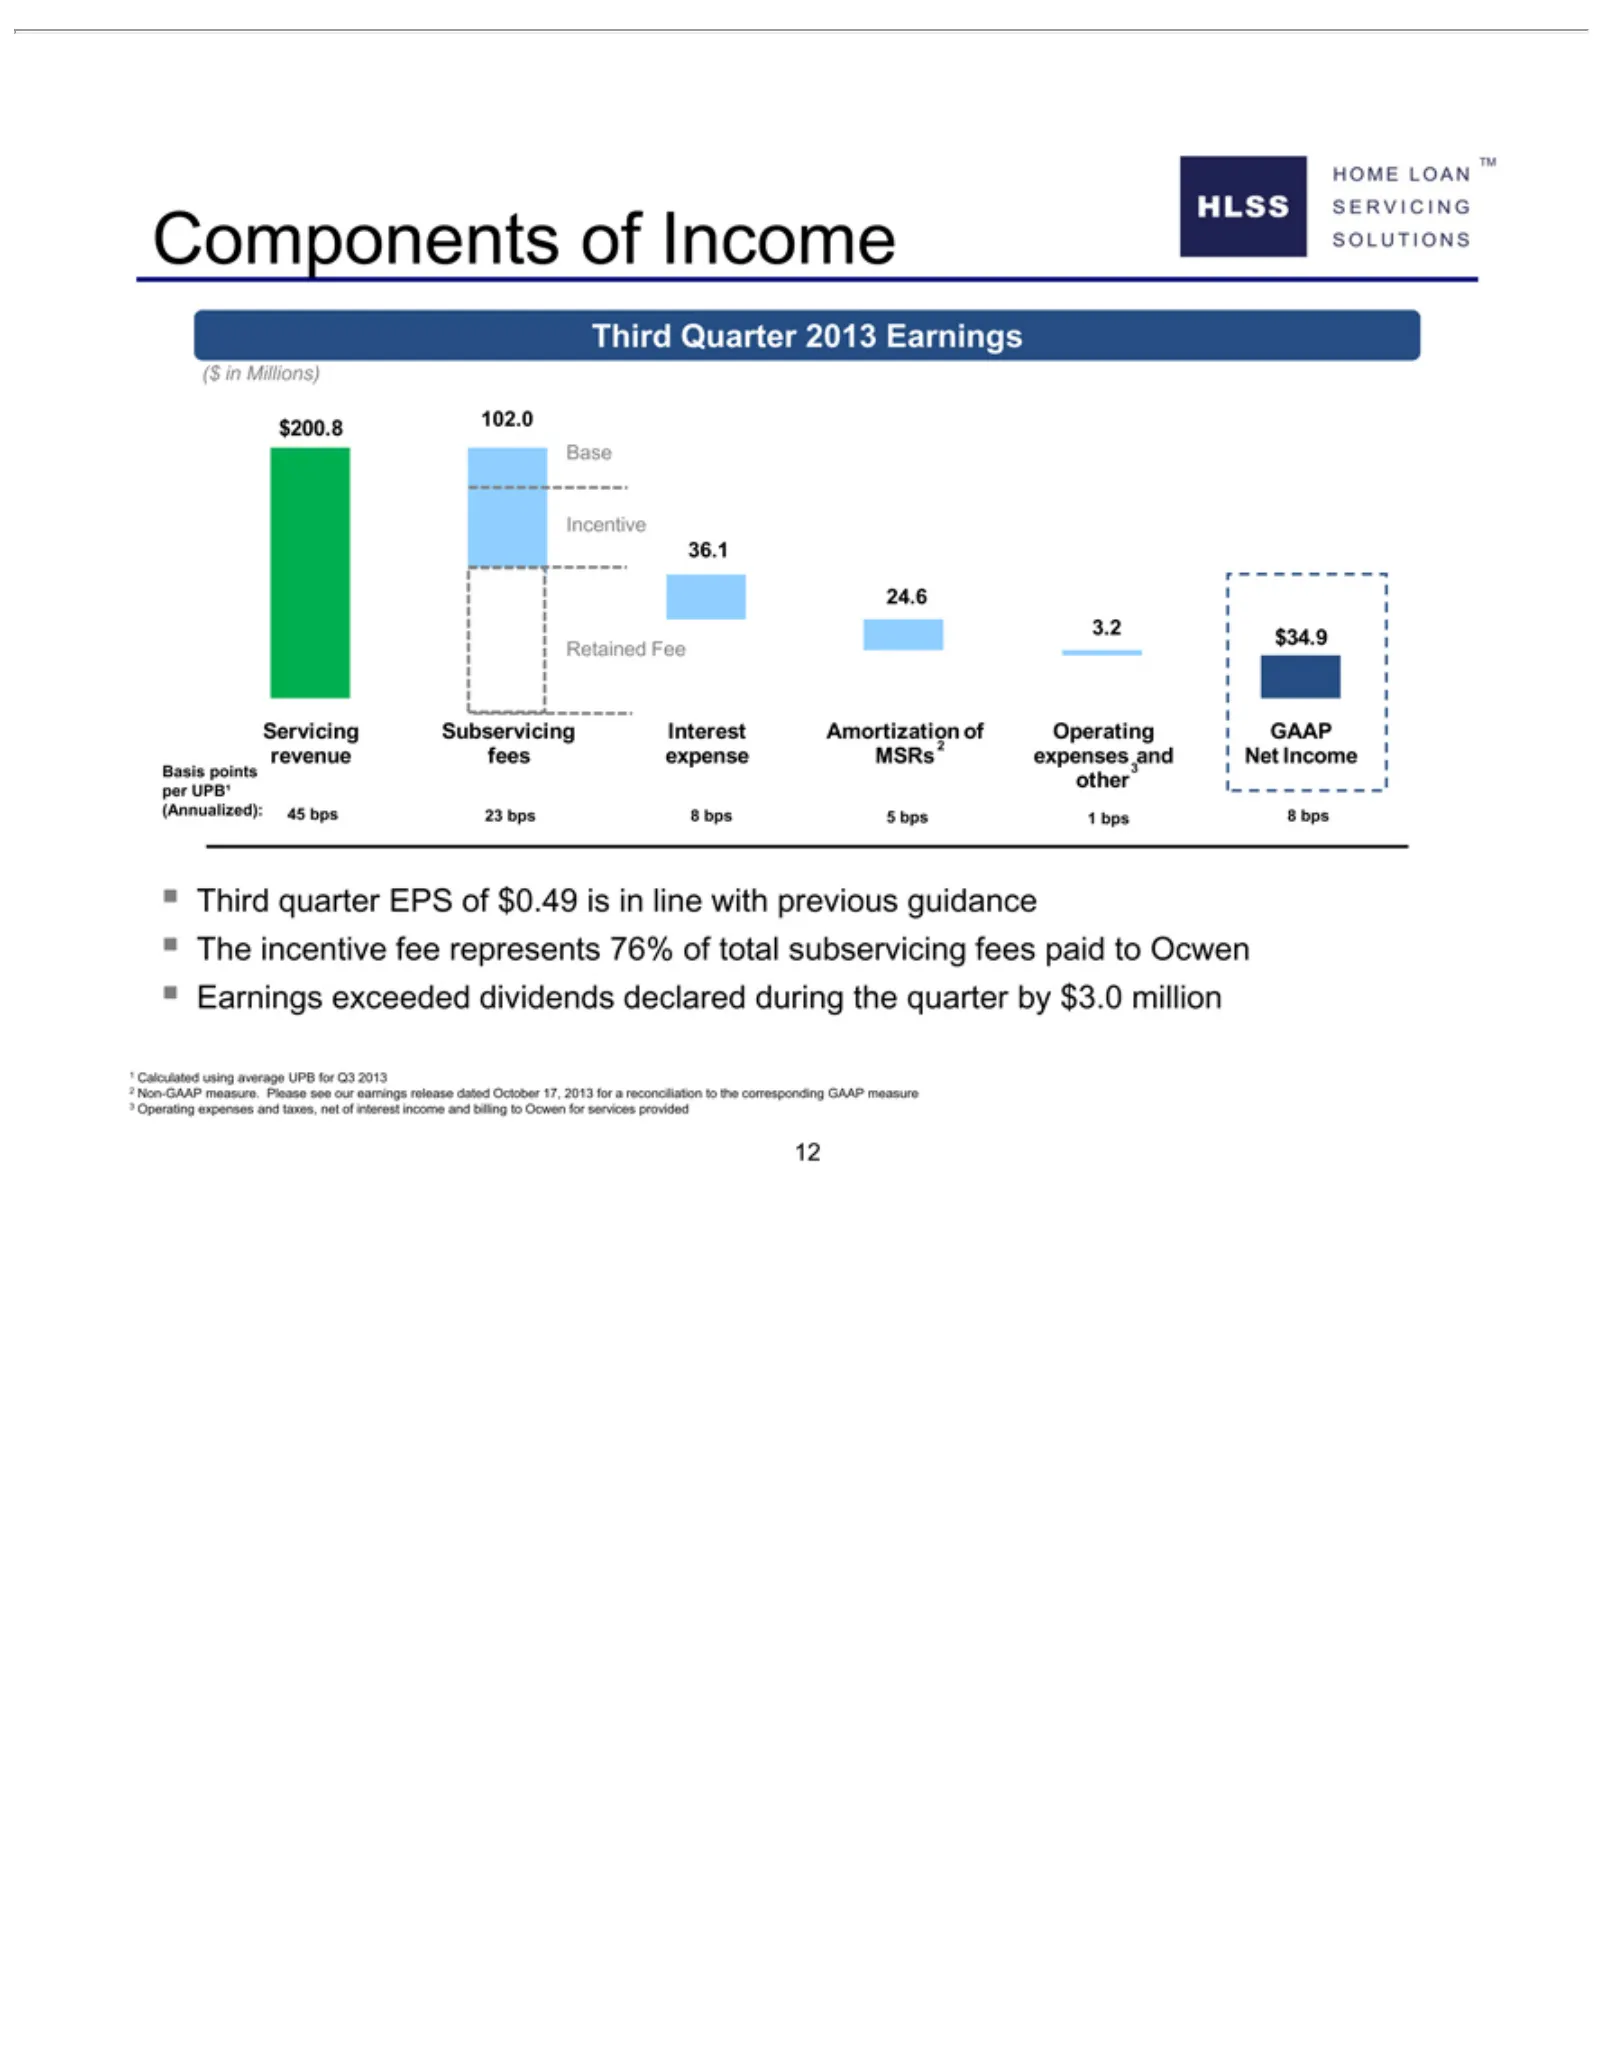
Slide 12: Third Quarter 2013 Earnings Components
HOME HLSS Components SOLUTIONS SERVICING ($ $200.8 3.2 24.6 36.1 Incentive Base Retained Servicing Basis Third The 321Earnings 12Calculated Non-GAAP Operating in$34.9 incentive Millions) points Quarter quarter 102.0 LOAN Fee exceeded revenue expenses per using of EPS fee measure. 2013 TM Income UPB1
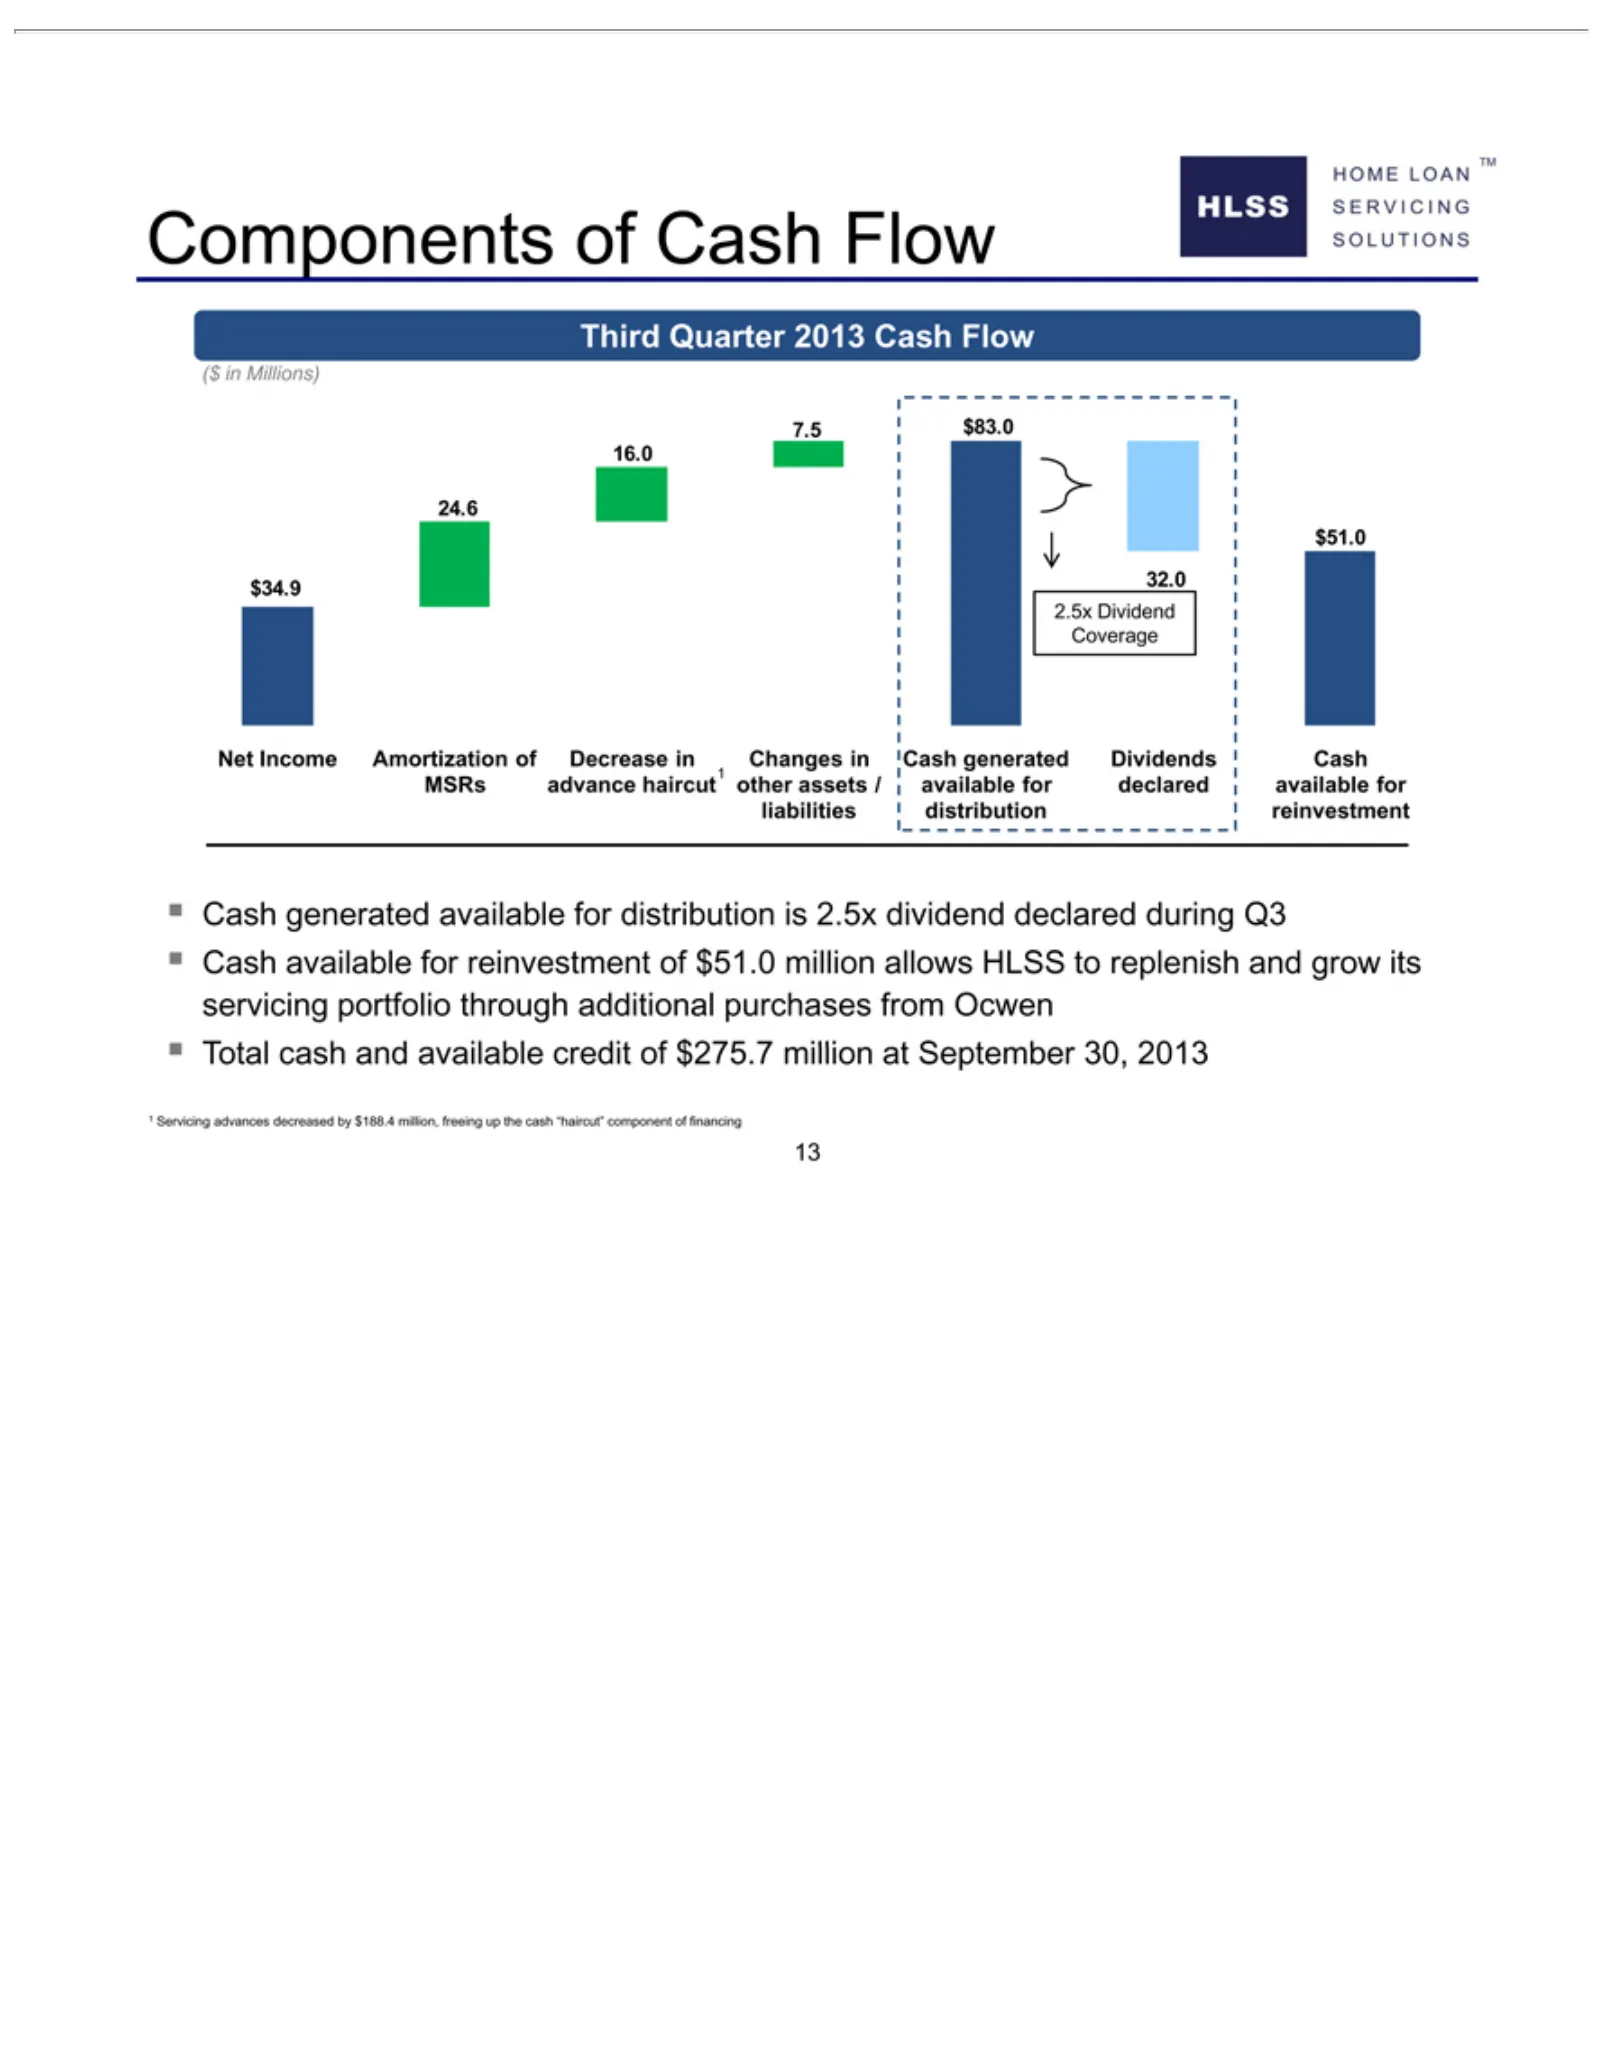
Slide 13: Third Quarter 2013 Cash Flow and Dividend Coverage
HOME HLSS Components SOLUTIONS SERVICING Third ($ $34.9 2.5x Net Amortization Decrease Changes Dividends Cash 1Total 13Servicing inIncome Dividend Millions) generated available cash Quarter 24.6 LOAN in inand declared 16.0 other advances advance of of 2013 Coverage available for TM available Cash 7.
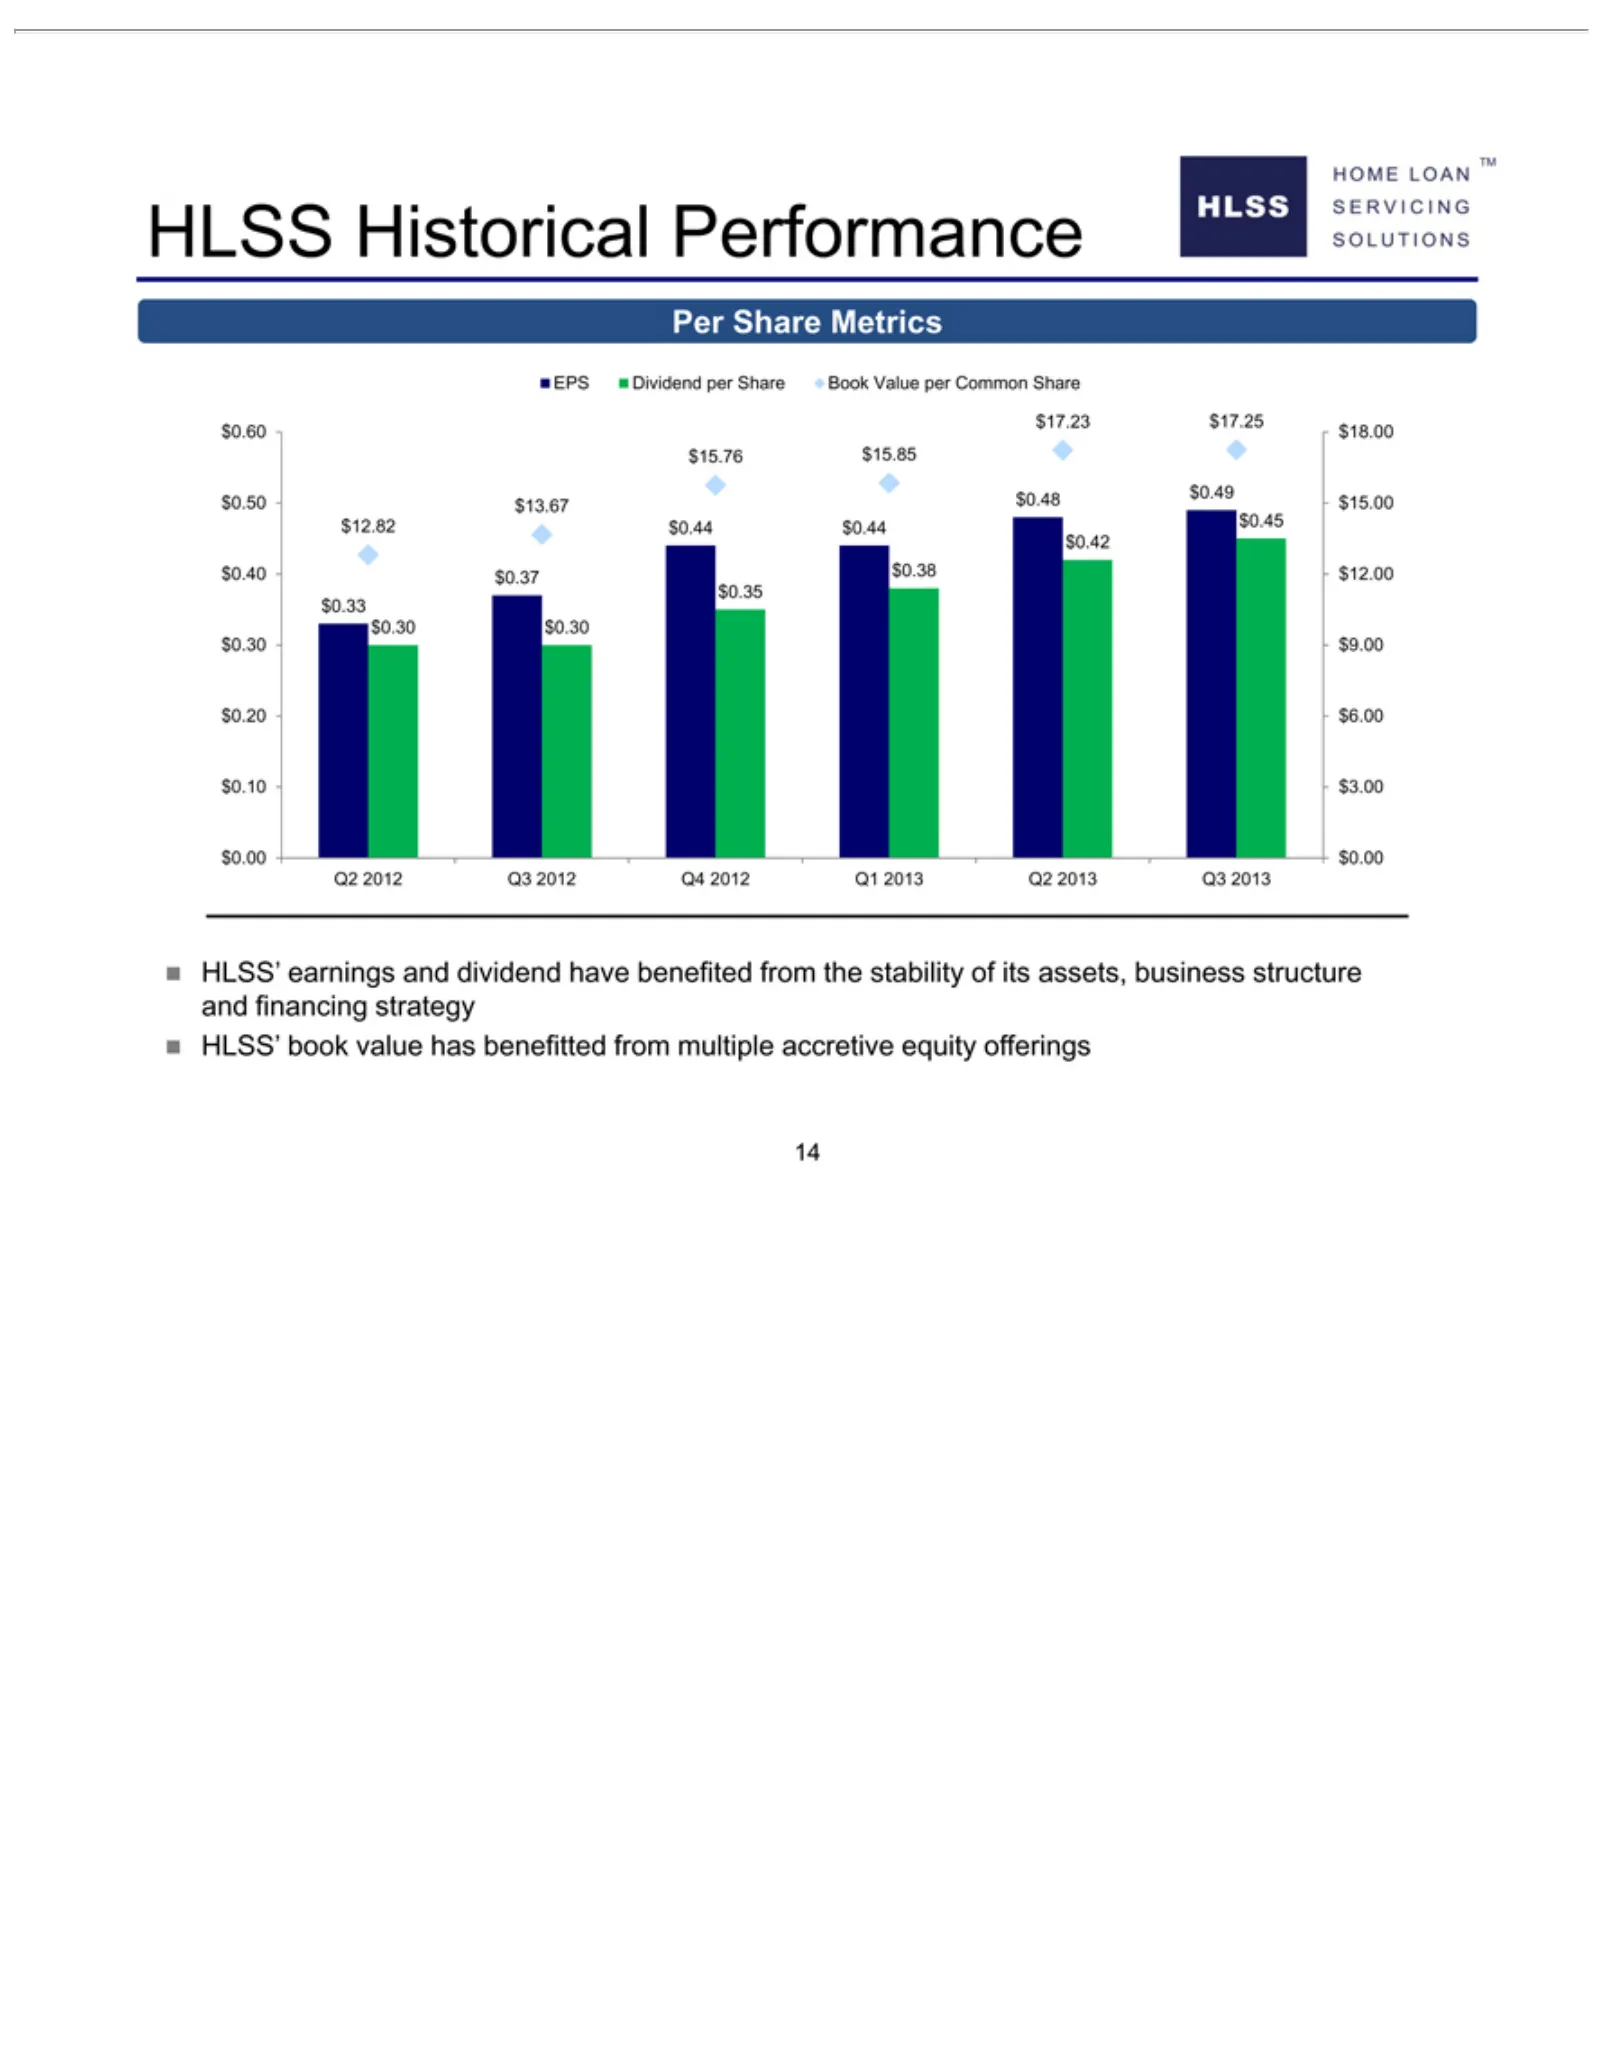
Slide 14: Historical Performance Metrics
HOME HLSS SOLUTIONS SERVICING Per EPS $17.23 $0.60 $15.76 $0.50 $12.82 $13.67 $0.40 $0.42 $0.33 $0.35 $0.30 $0.20 $0.10 $0.00 Q2 HLSS’ 14 2012 Share Dividend $18.00 $0.48 $0.37 $0.30 $9.00 $6.00 $3.00 $0.00 Historical earnings book $17.25 $15.85 $0.44 LOAN Q3 Metrics $0.49 $0.38 2012 value $0.44 per
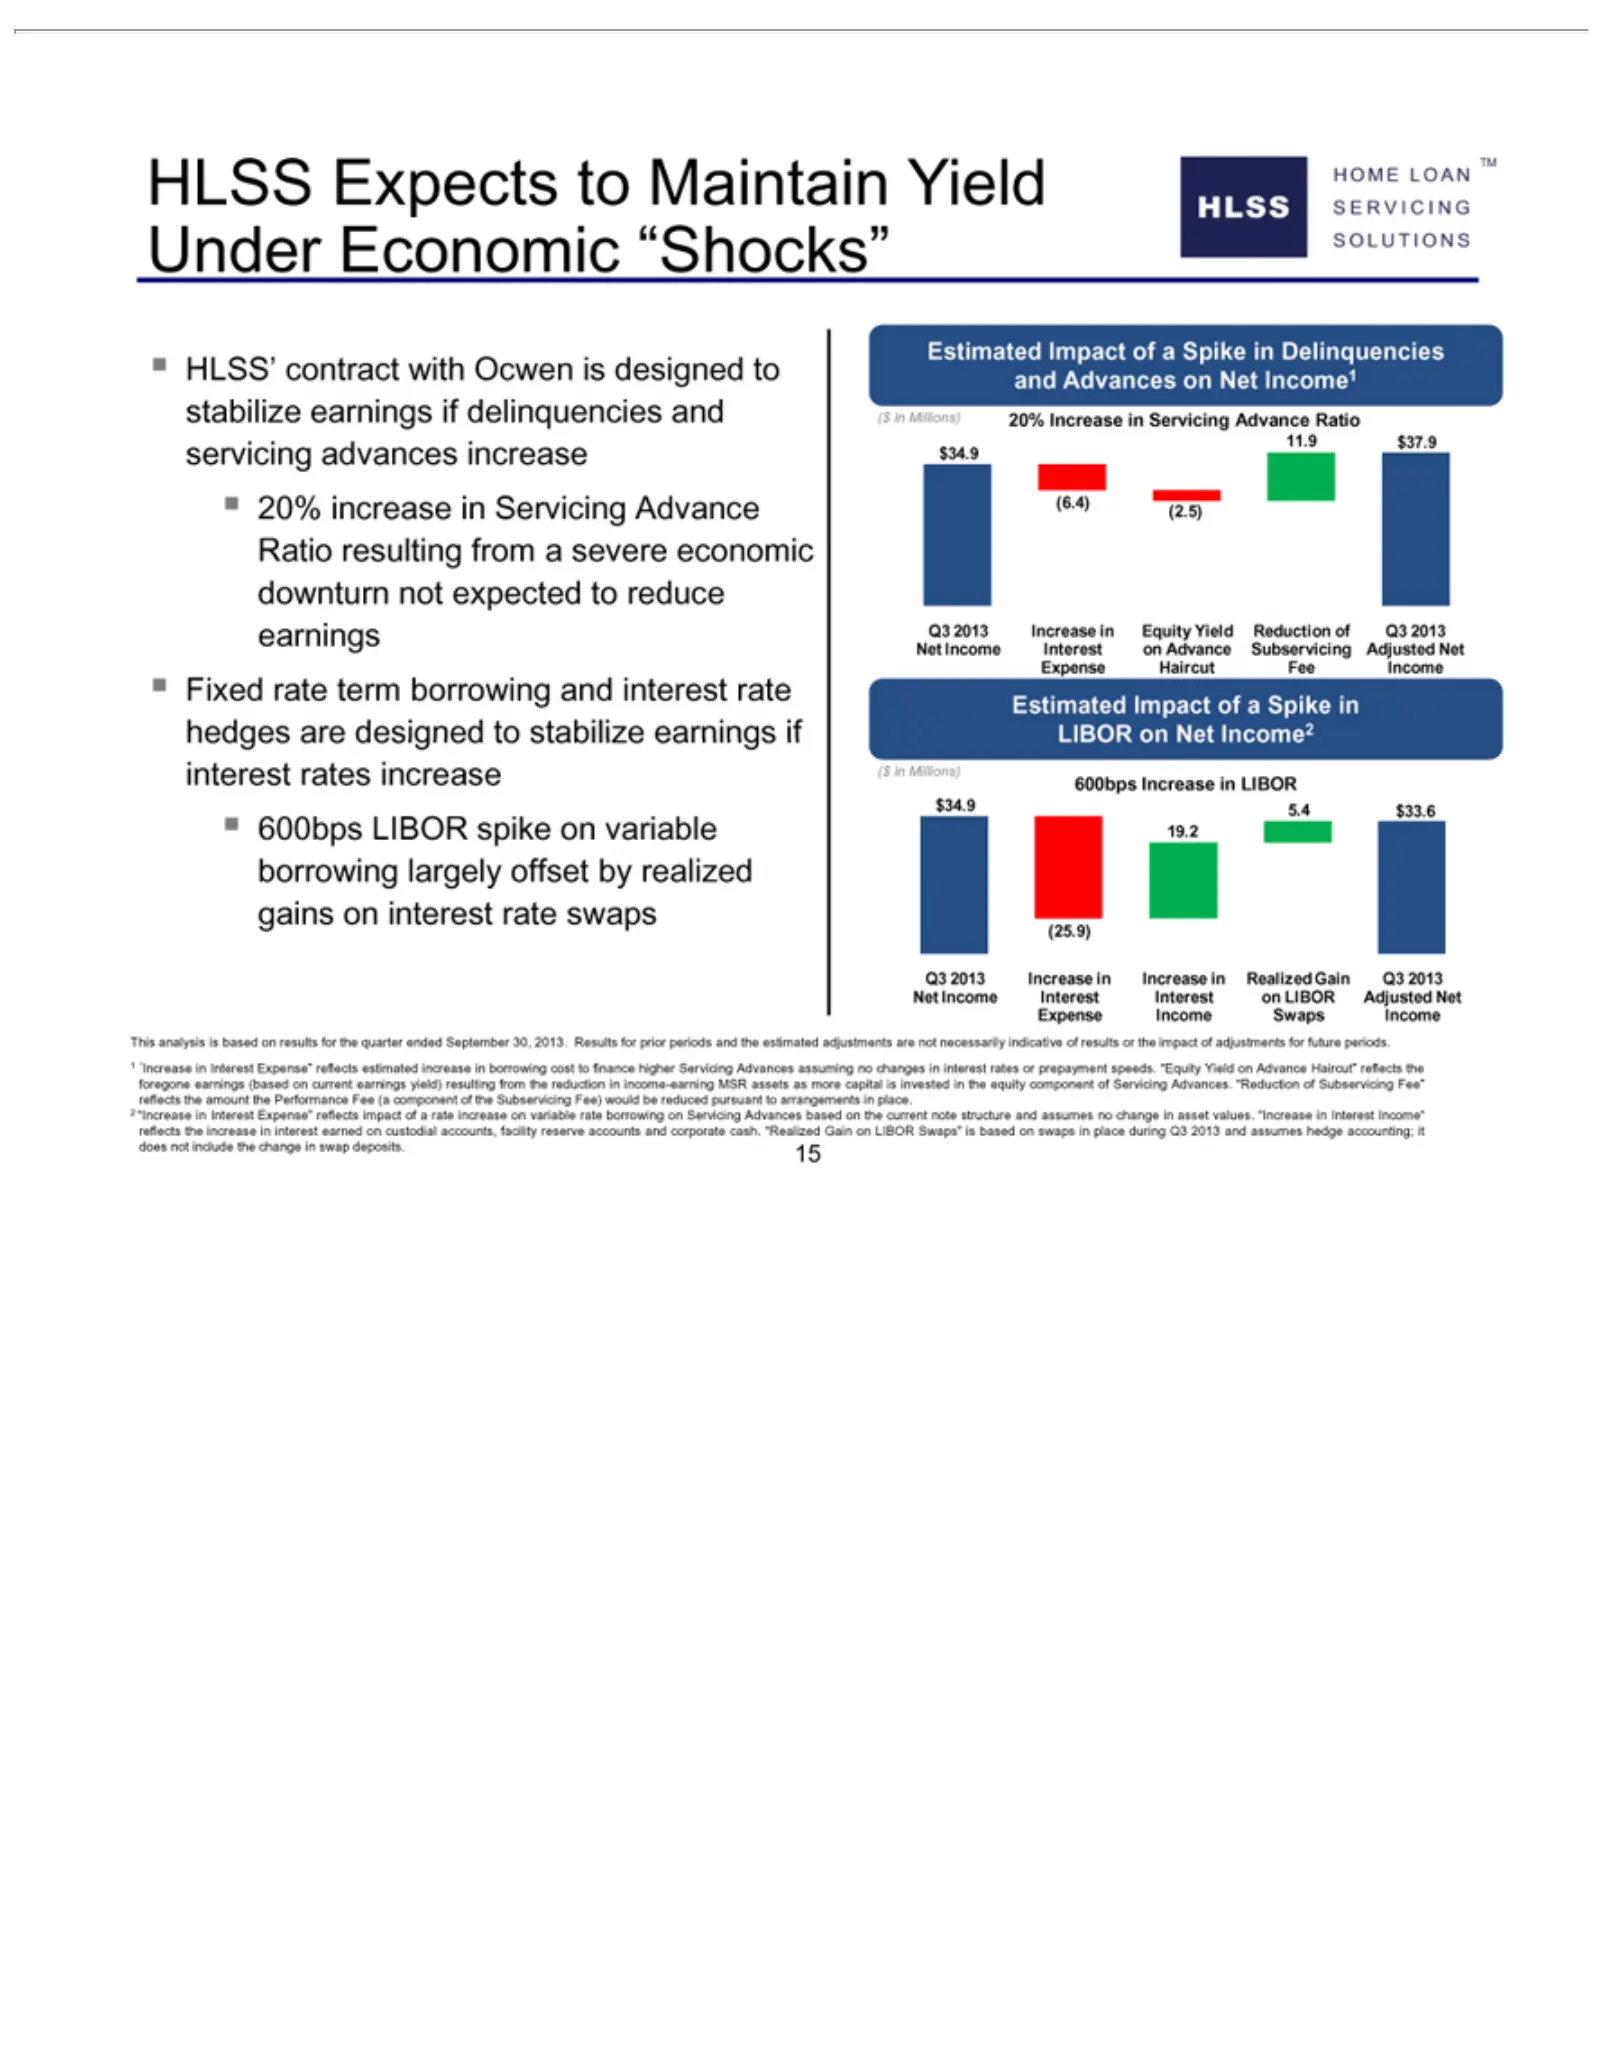
Slide 15: Estimated Impact of LIBOR Spike on Earnings
HOME HLSS SOLUTIONS SERVICING HLSS’ Fixed 20% Yield Reduction Estimated ($ 600bps $34.9 Increase Realized Q3 This 1“Increase reflects 2Subservicing Income” accounting; 15“Increase in2013 analysis increase Increase Millions) on (6.4) (25.9) rate Expects contract LIBOR Increase the LOANTM in Advance A
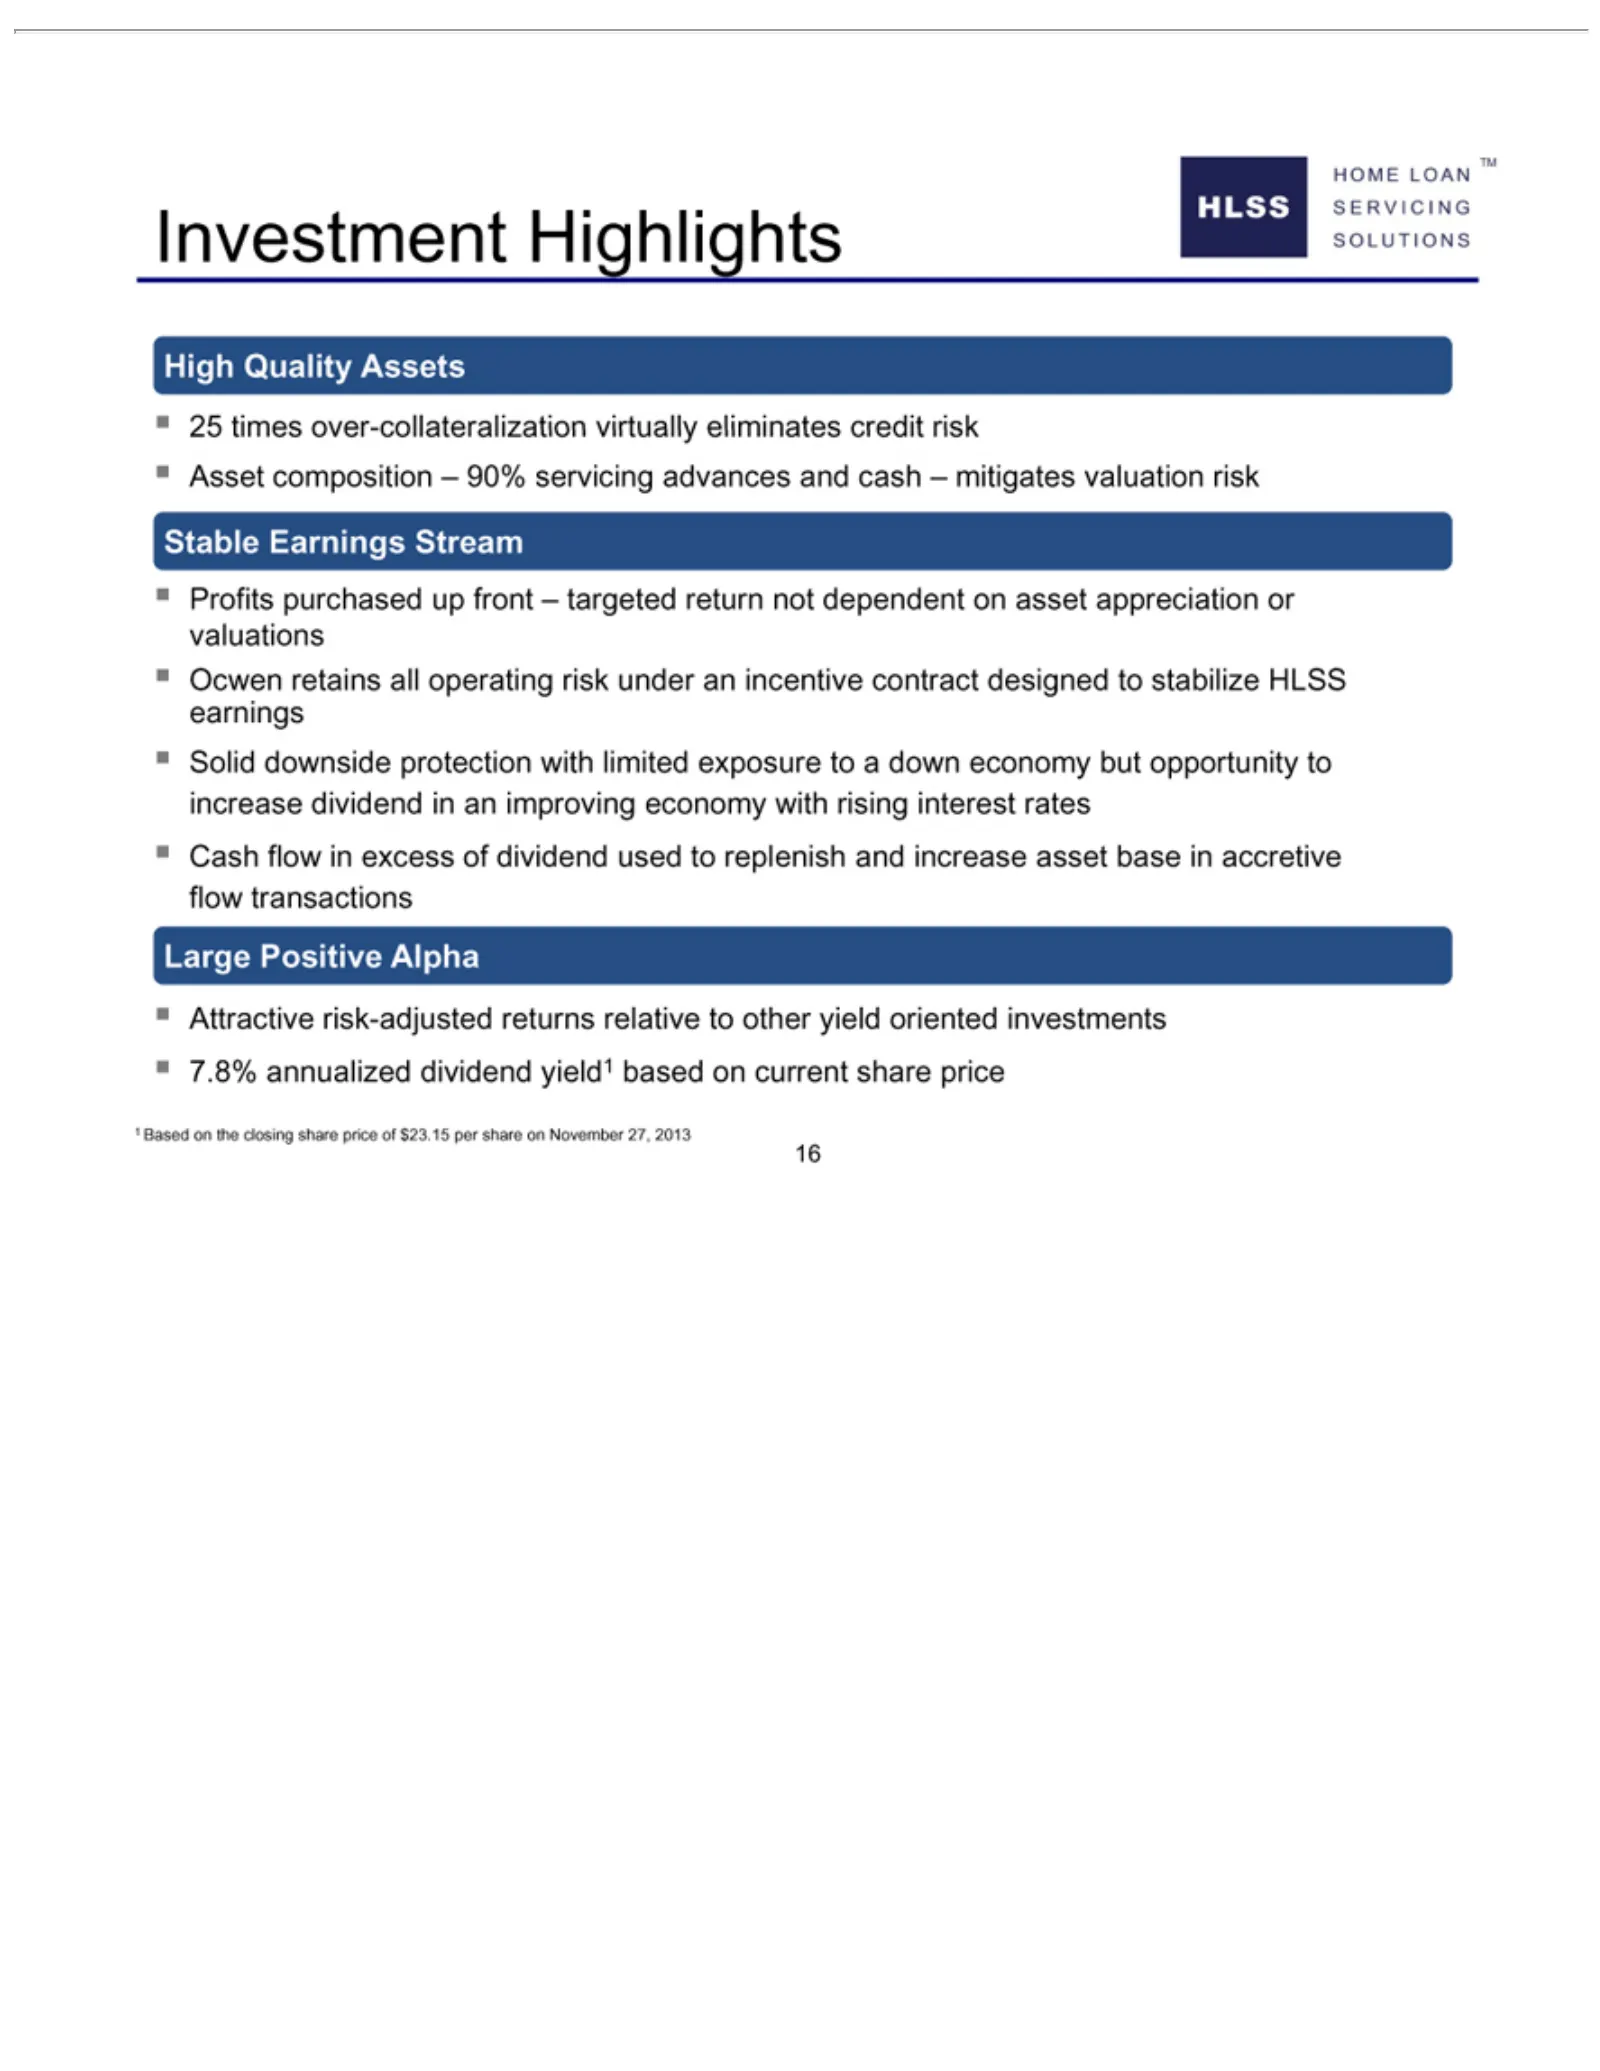
Slide 16: HLSS Investment Highlights
HOME HLSS Investment SOLUTIONS SERVICING High 25 Asset Stable Profits Ocwen Solid Cash Large Attractive 17.8% 16Based times Quality flow annualized downside composition Positive Earnings purchased retains LOAN on over-collateralization risk-adjusted inHighlights the excess Assets Alpha all closing T

Slide 17: Appendix
HOME LOAN TM HLSS 17 Appendix SOLUTIONS SERVICING
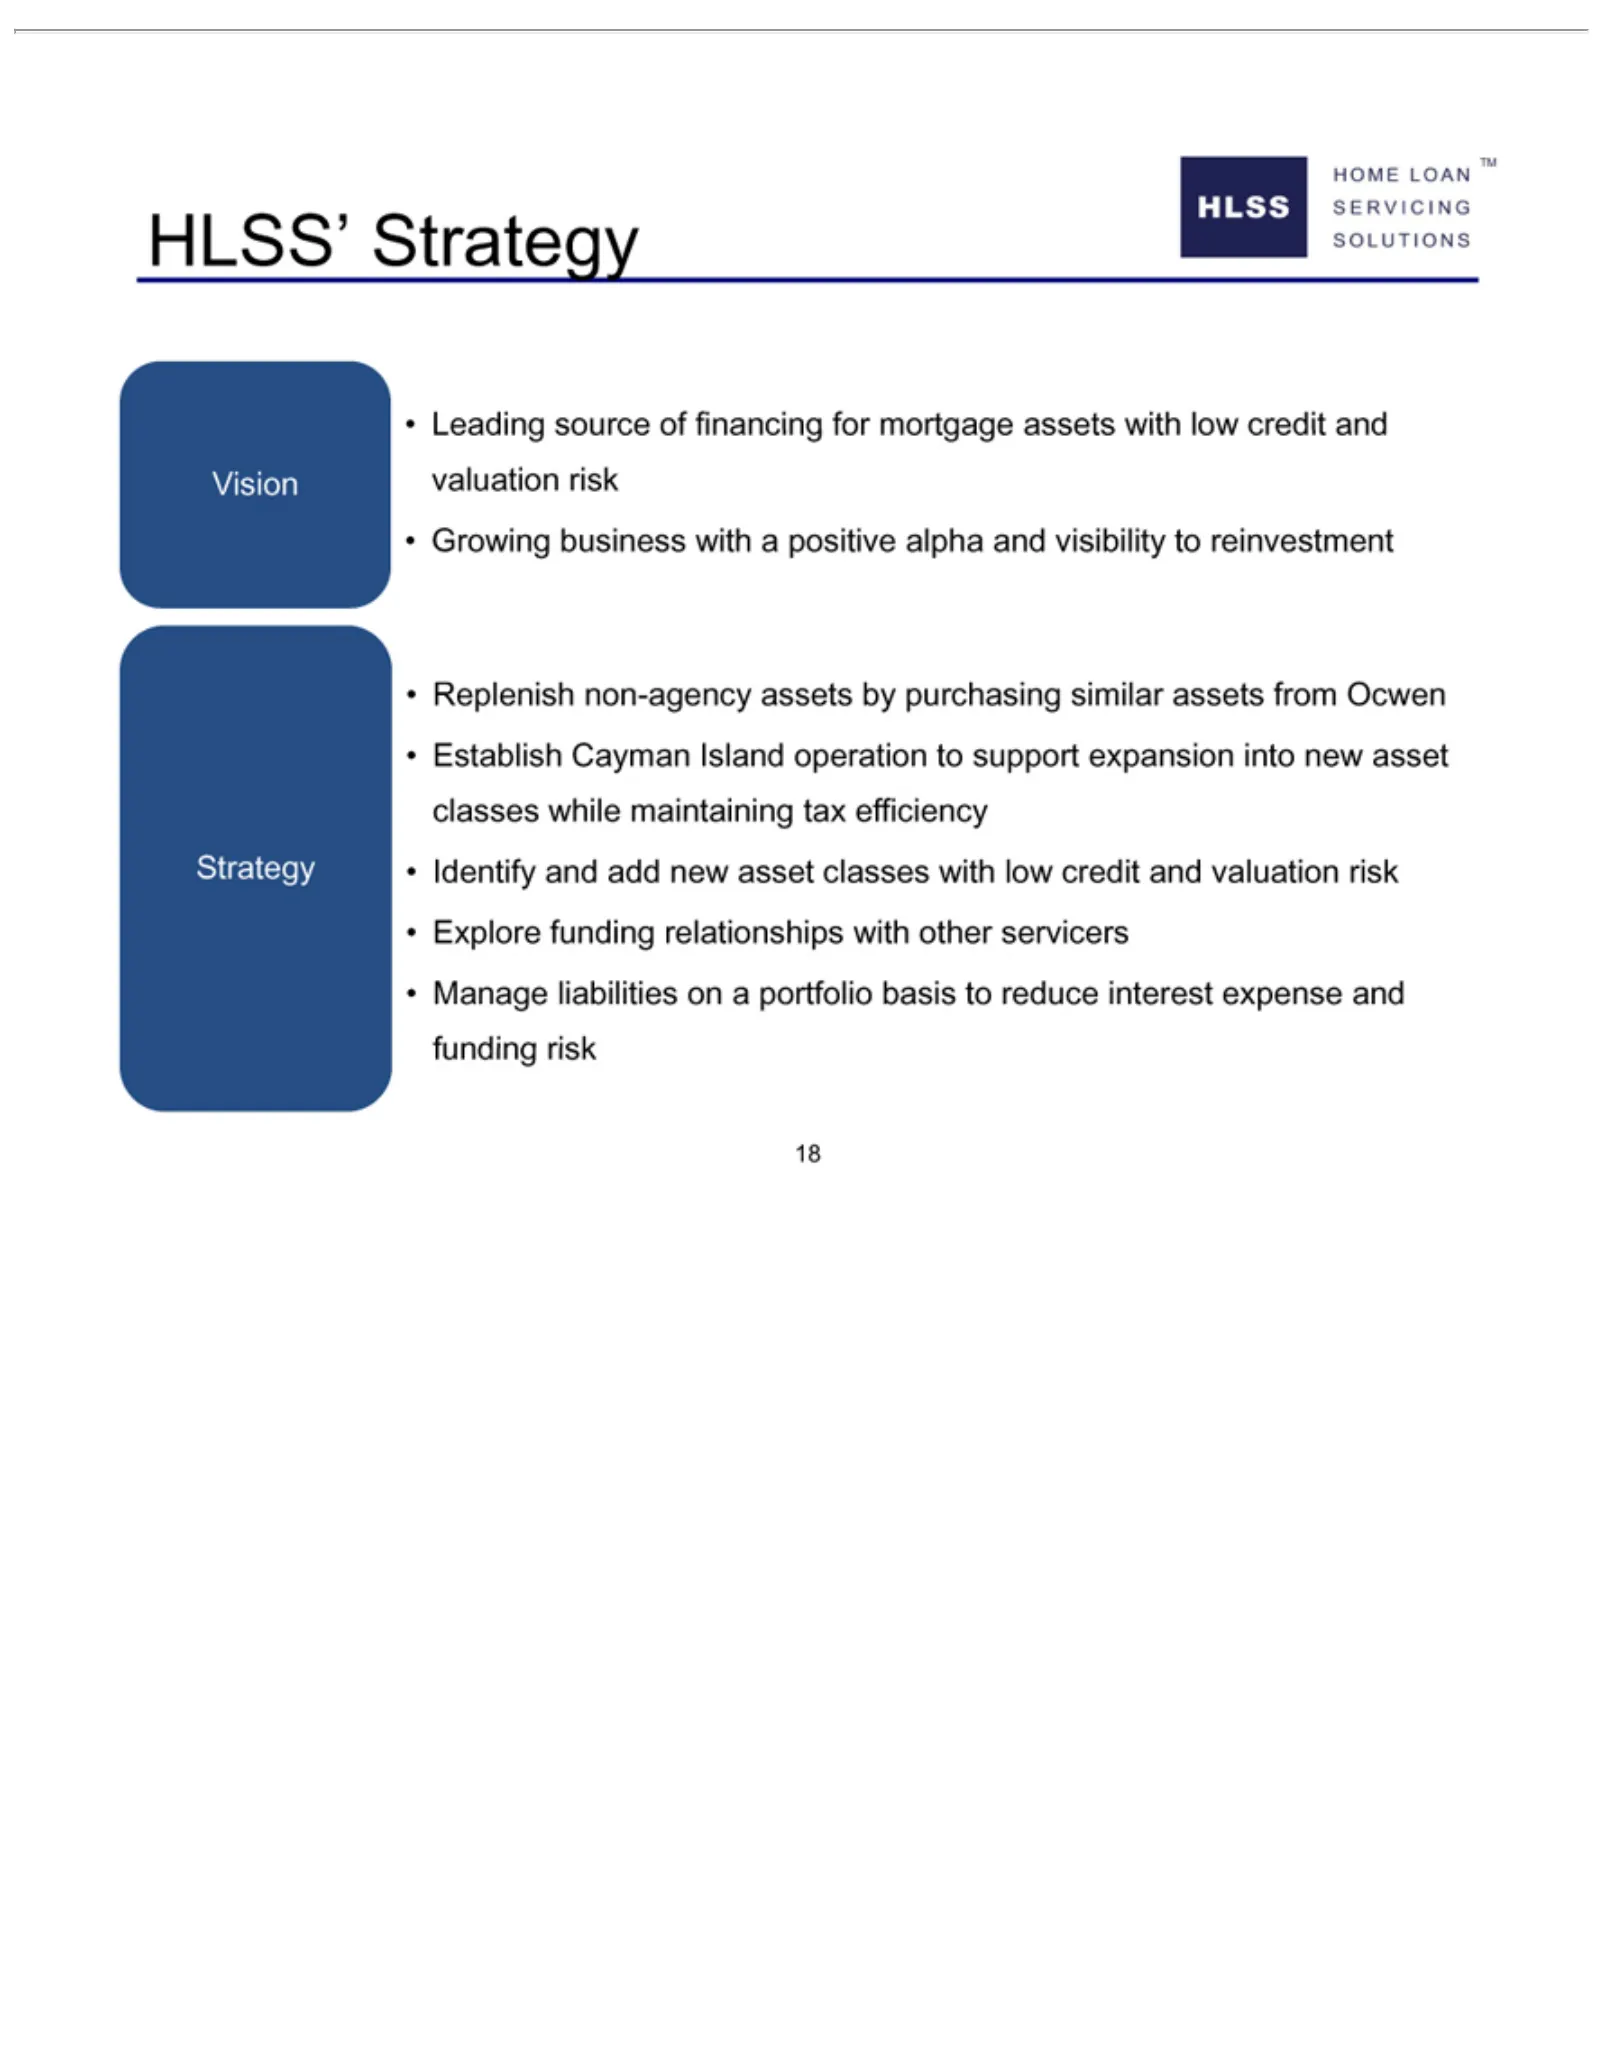
Slide 18: HLSS Strategy
HOMELeading HLSS HLSS’ SOLUTIONS SERVICING Vision Growing Replenish Establish Strategy Explore Manage 18 Strategy LOAN funding liabilities Identify business Cayman non-agency TM source relationships and on with Island add aassets of portfolio a positive operation financing newbywith asset purchasing
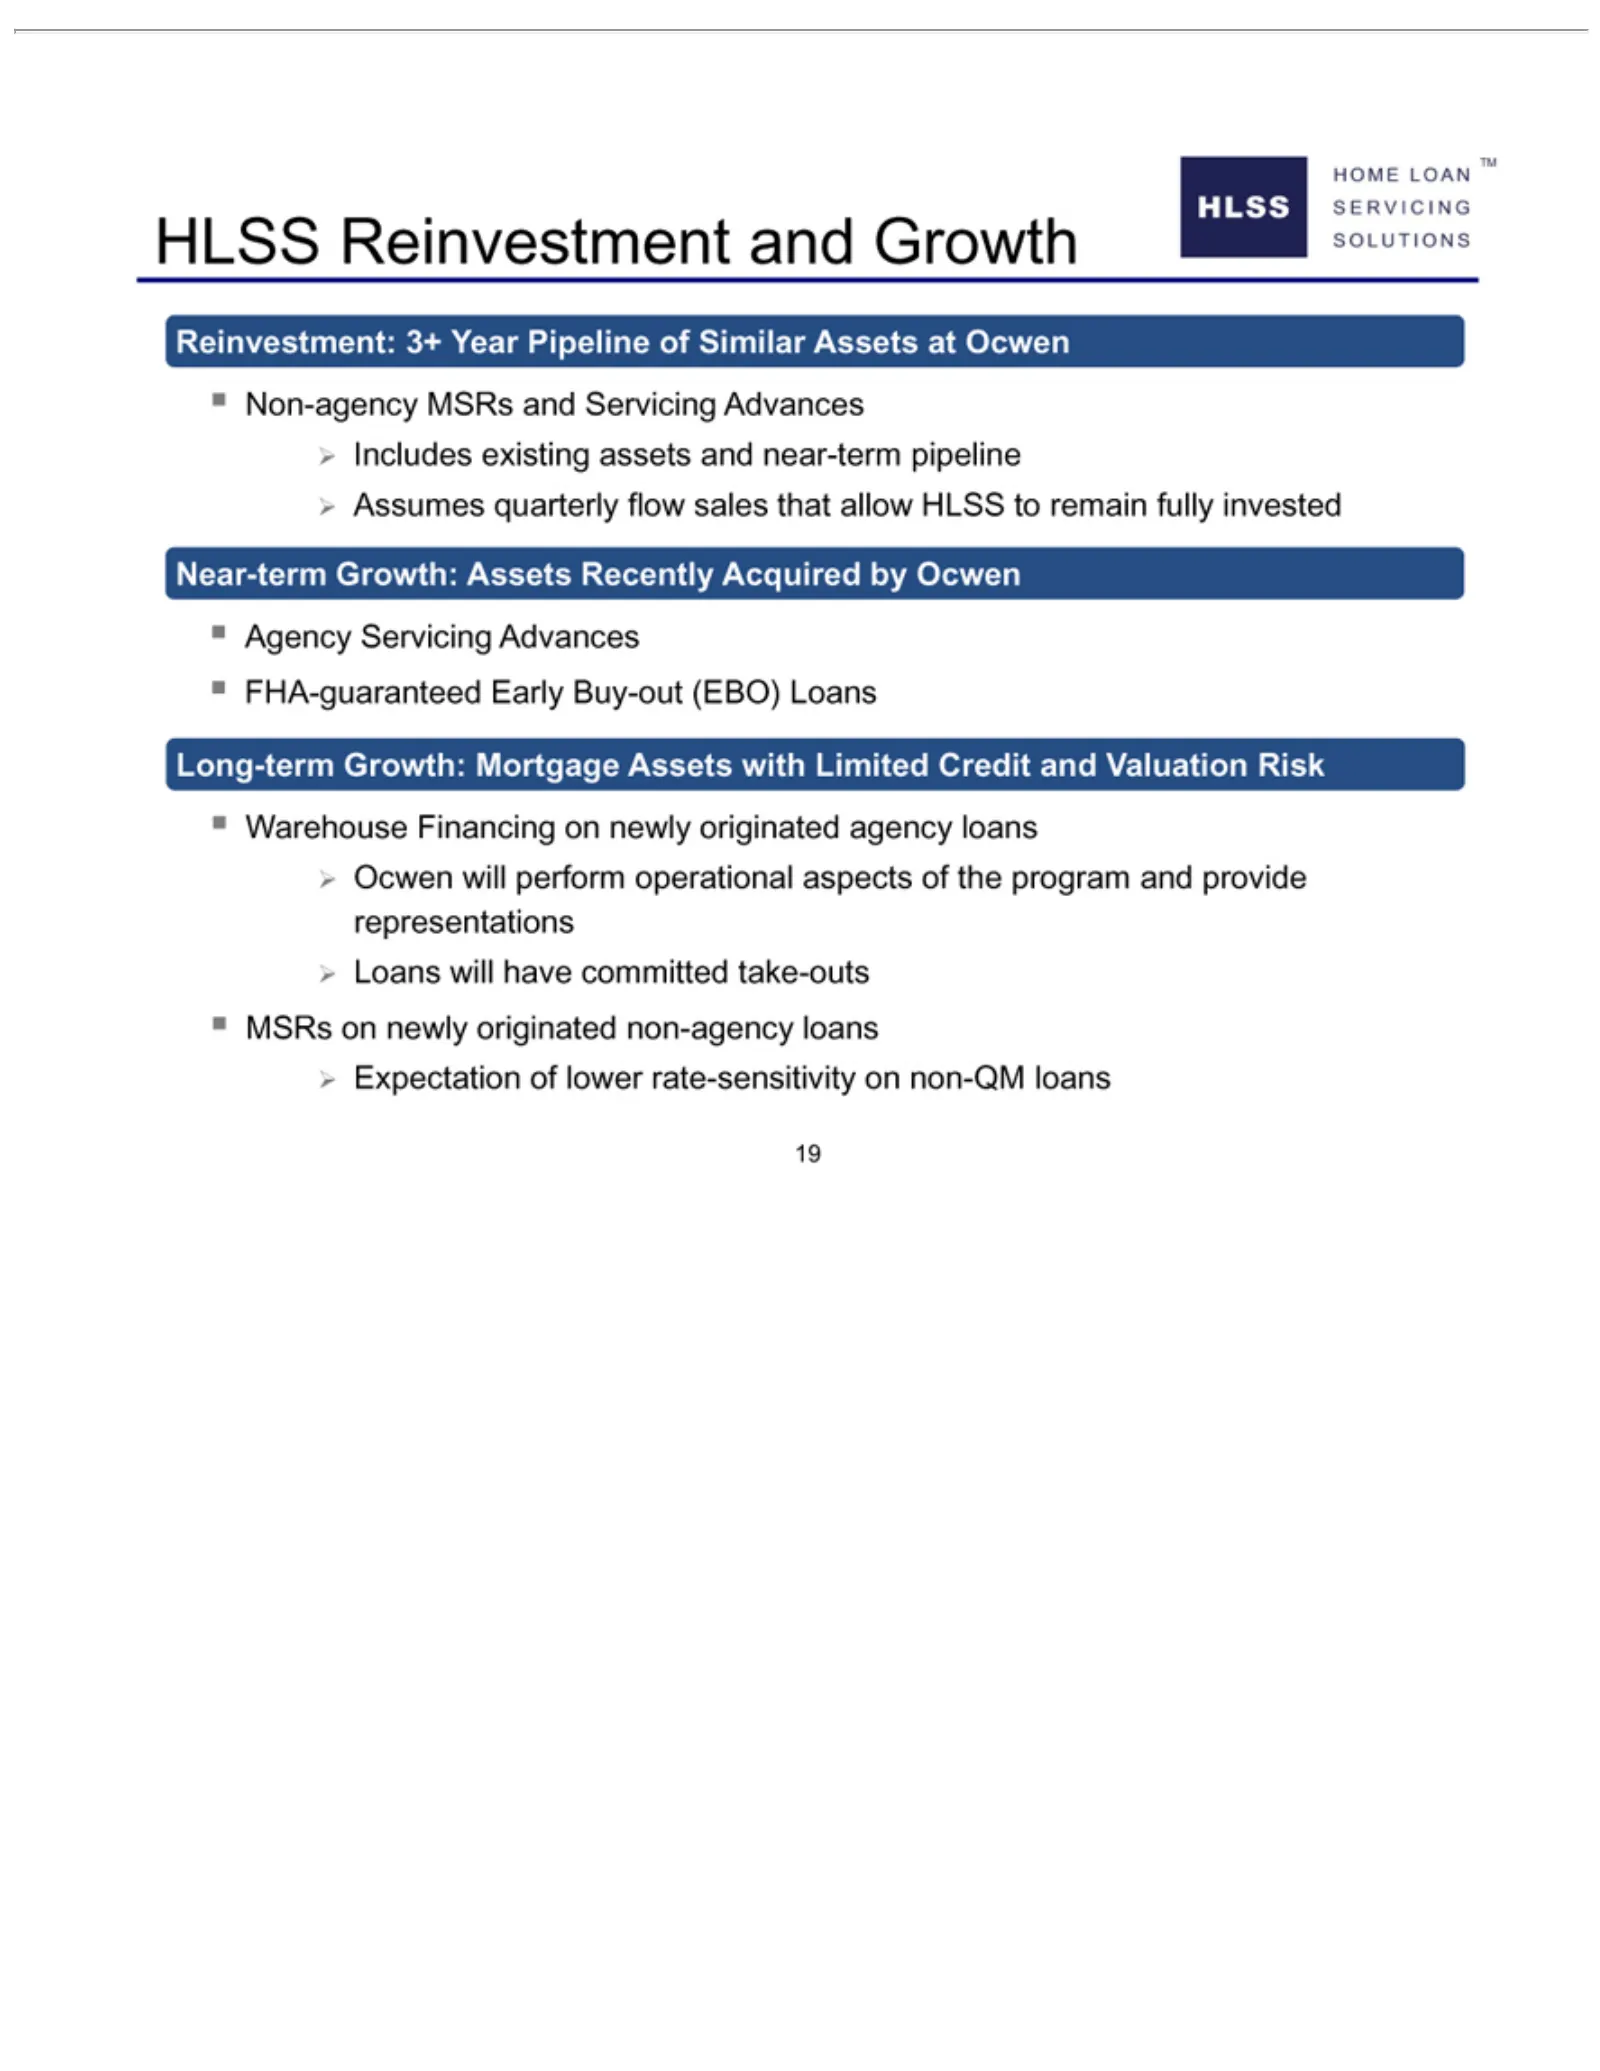
Slide 19: HLSS Reinvestment and Growth
HOMEwill HLSS SOLUTIONS SERVICING Reinvestment: Non-agency Includes Assumes Near-term Agency FHA-guaranteed Long-term Warehouse Ocwen Loans MSRs Expectation 19 Reinvestment on will LOAN Servicing existing quarterly newly Growth: have Growth: Financing perform of MSRs 3+ lower TMcommitted originated
Slide 20: Ocwen, Altisource, HLSS Investor Day Presentation December 2013
OCWEN ® HOME HLSS Altisource® SOLUTIONS SERVICING Residential Altisource Asset Investor December Management LOAN Day 3-4, TM Corporation Presentation 2013 TM
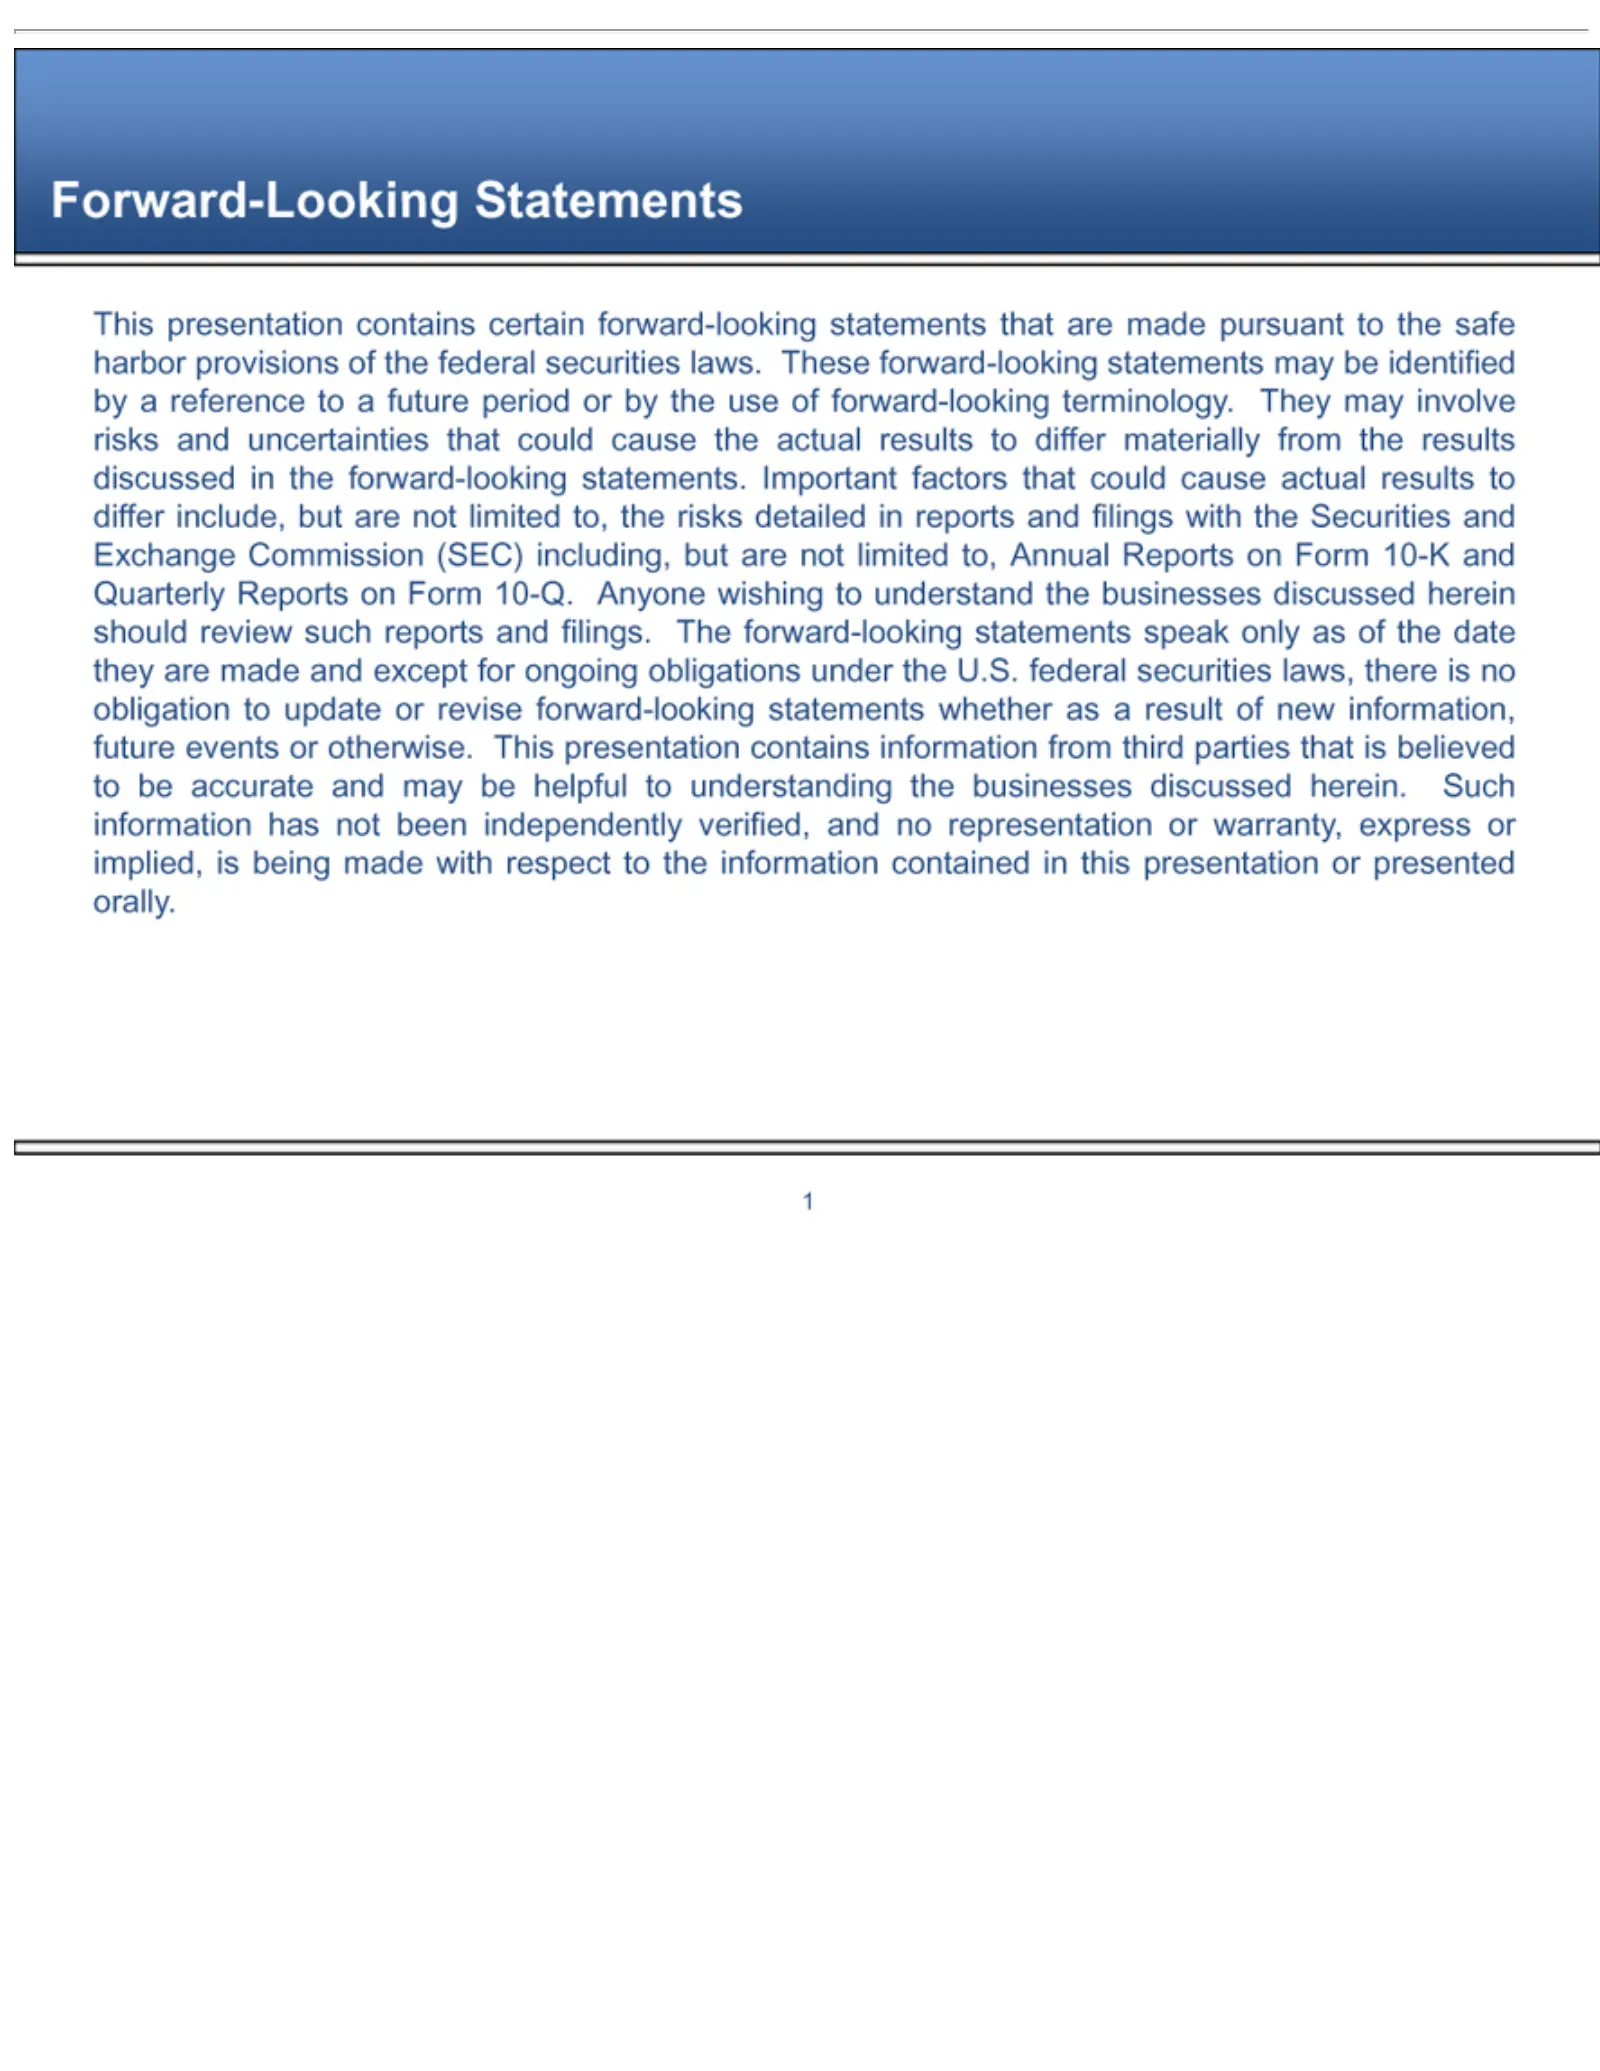
Slide 21: Forward-Looking Statements
Forward-Looking This future Important Annual as events 1independently of presentation the period orReports date otherwise. factors or they verified, by onthat contains Statements are the Form This could made use and 10-K presentation certain ofno cause and forward-looking representation and except f
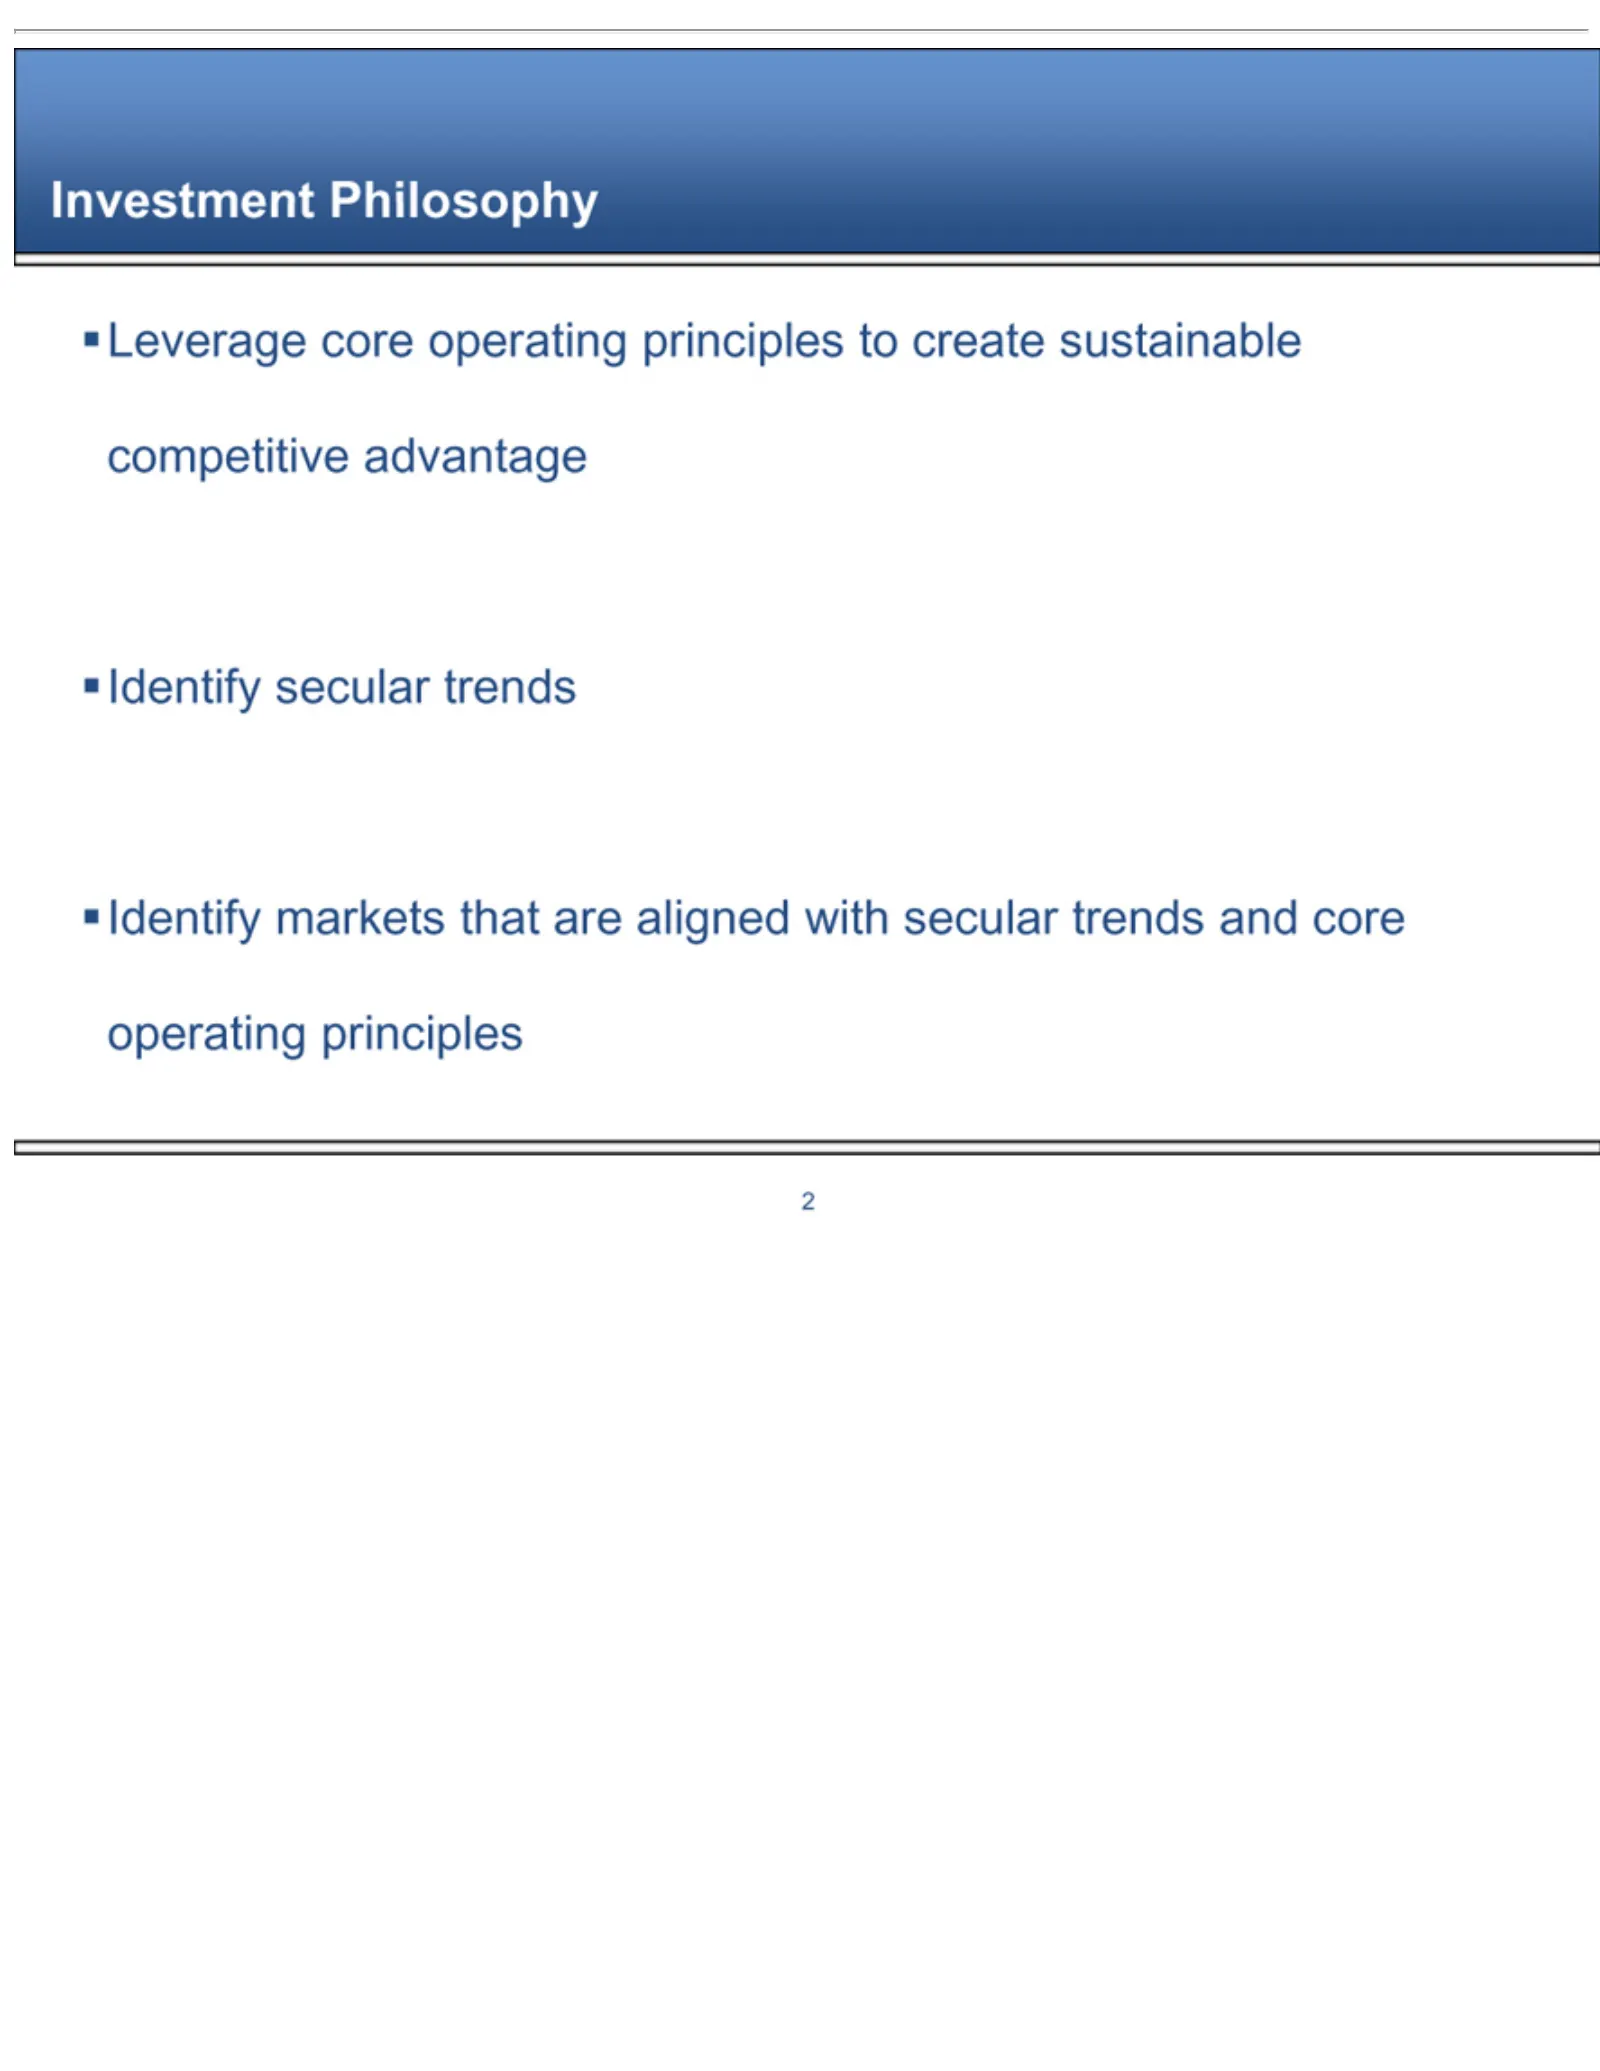
Slide 22: Investment Philosophy
Investment Leverage competitive 2Identify secular markets core Philosophy advantage operating trends that are principles aligned with to create secularsustainable trends and core operating principles
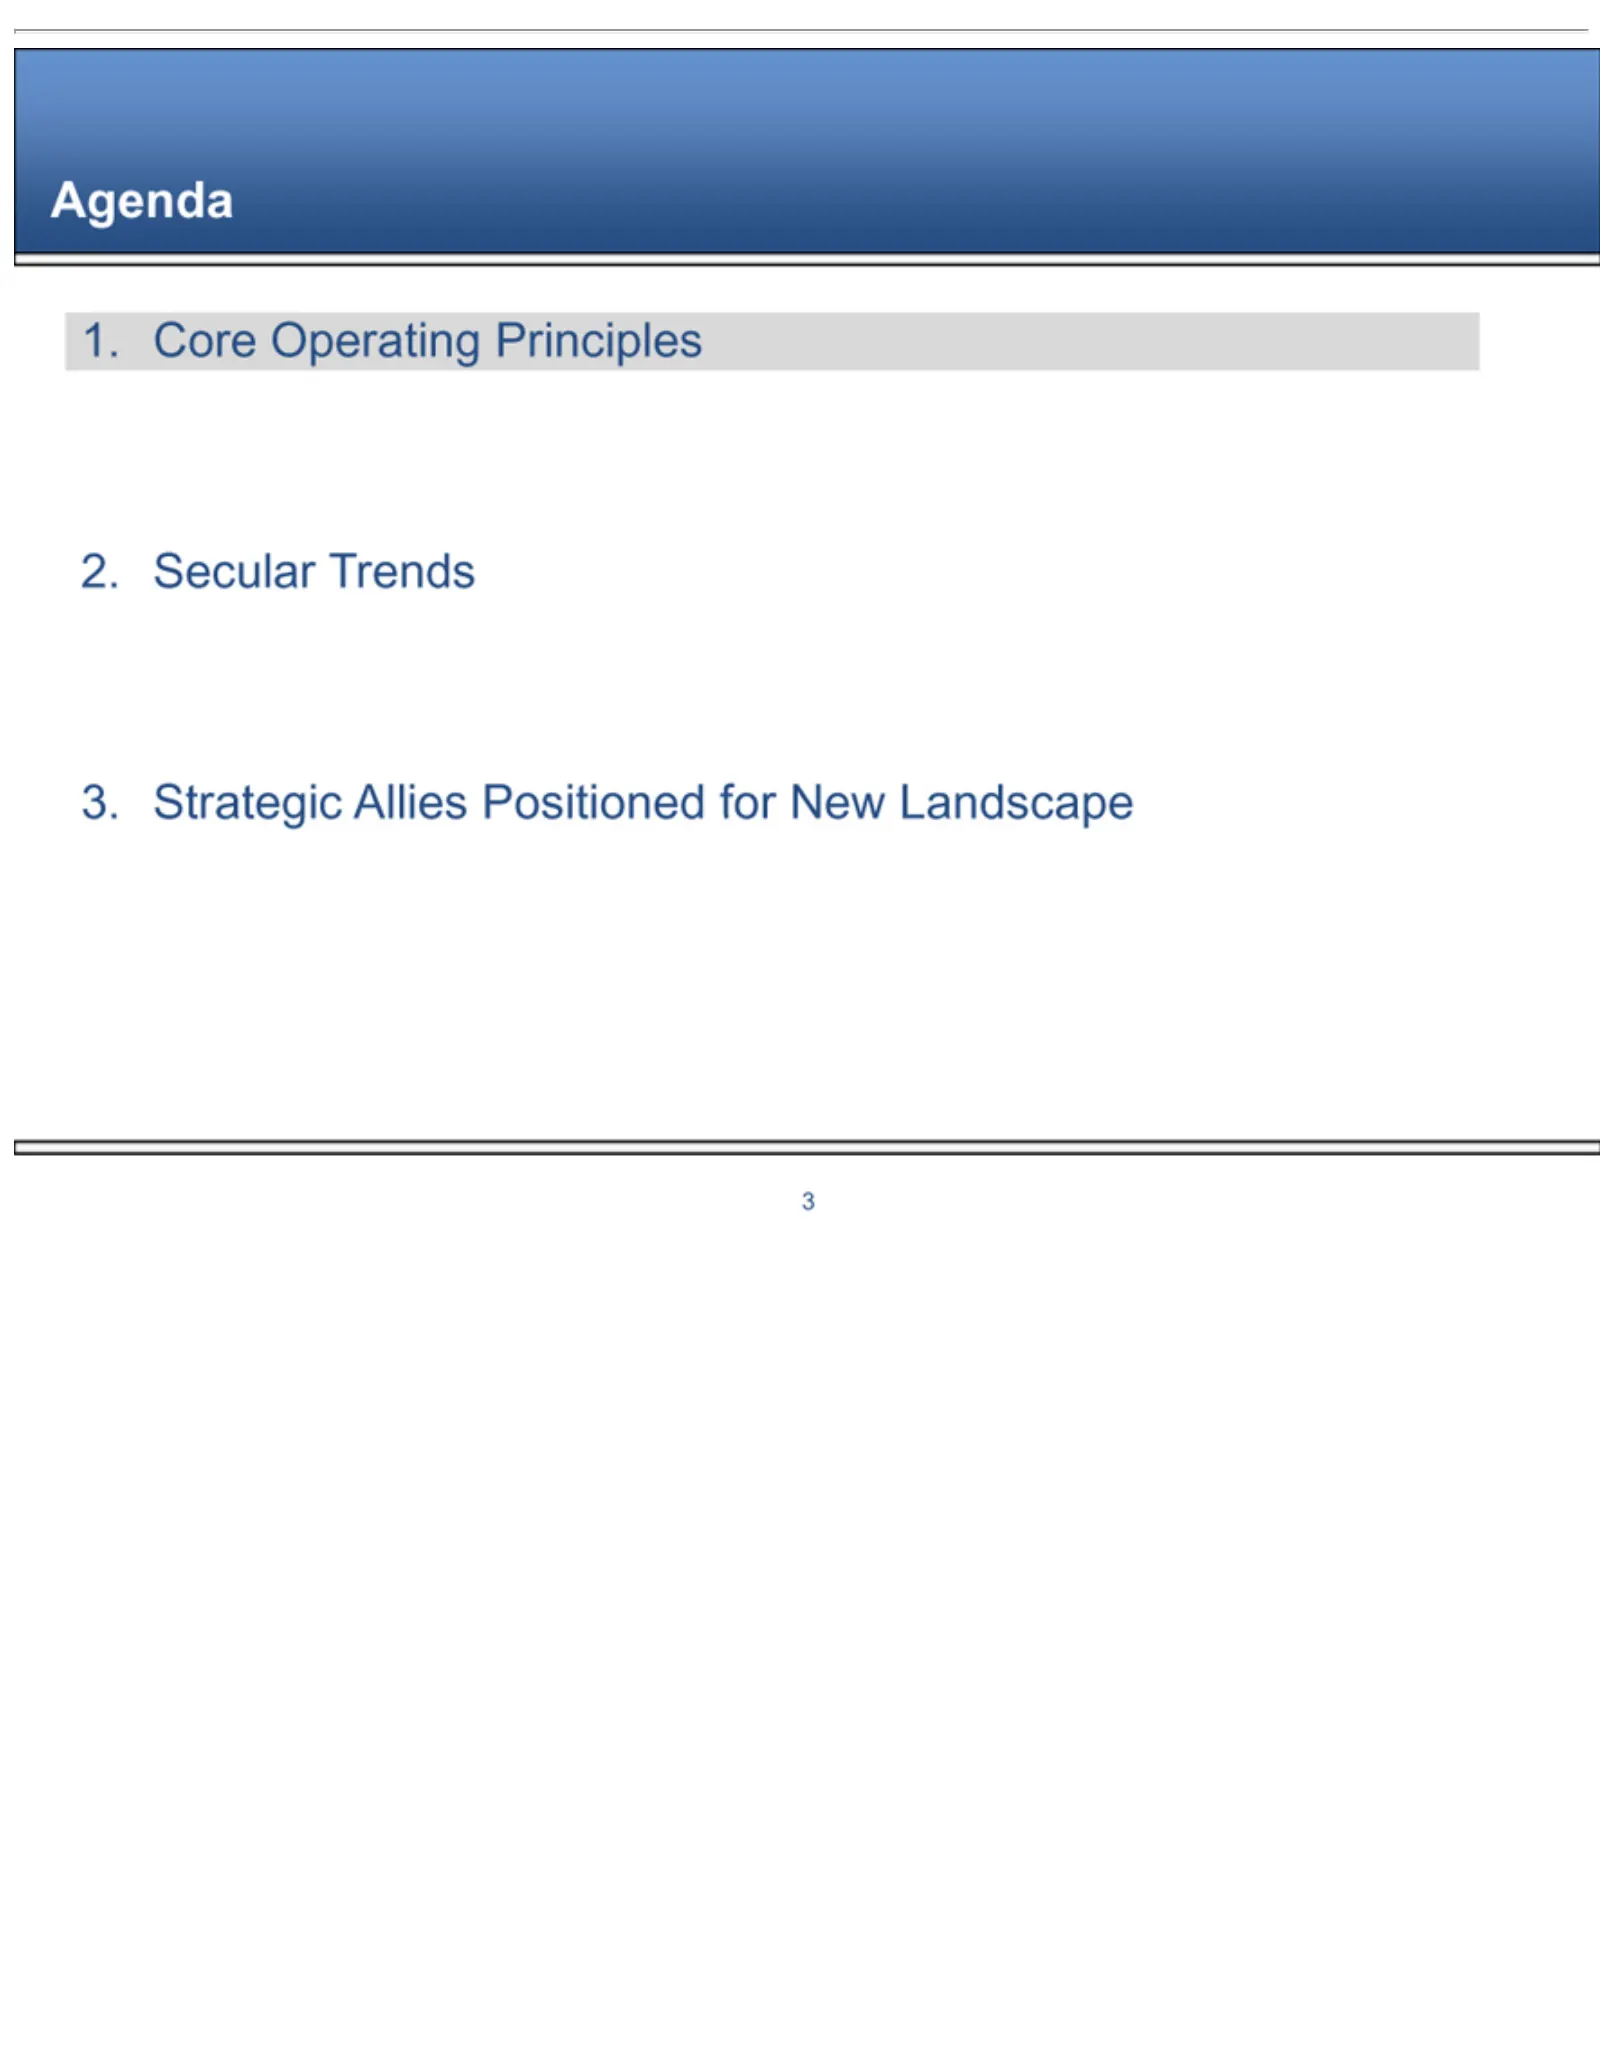
Slide 23: Strategic Allies Agenda
1. Strategic Agenda 2. 33. Core Operating Secular Trends Allies Positioned Principles for New Landscape
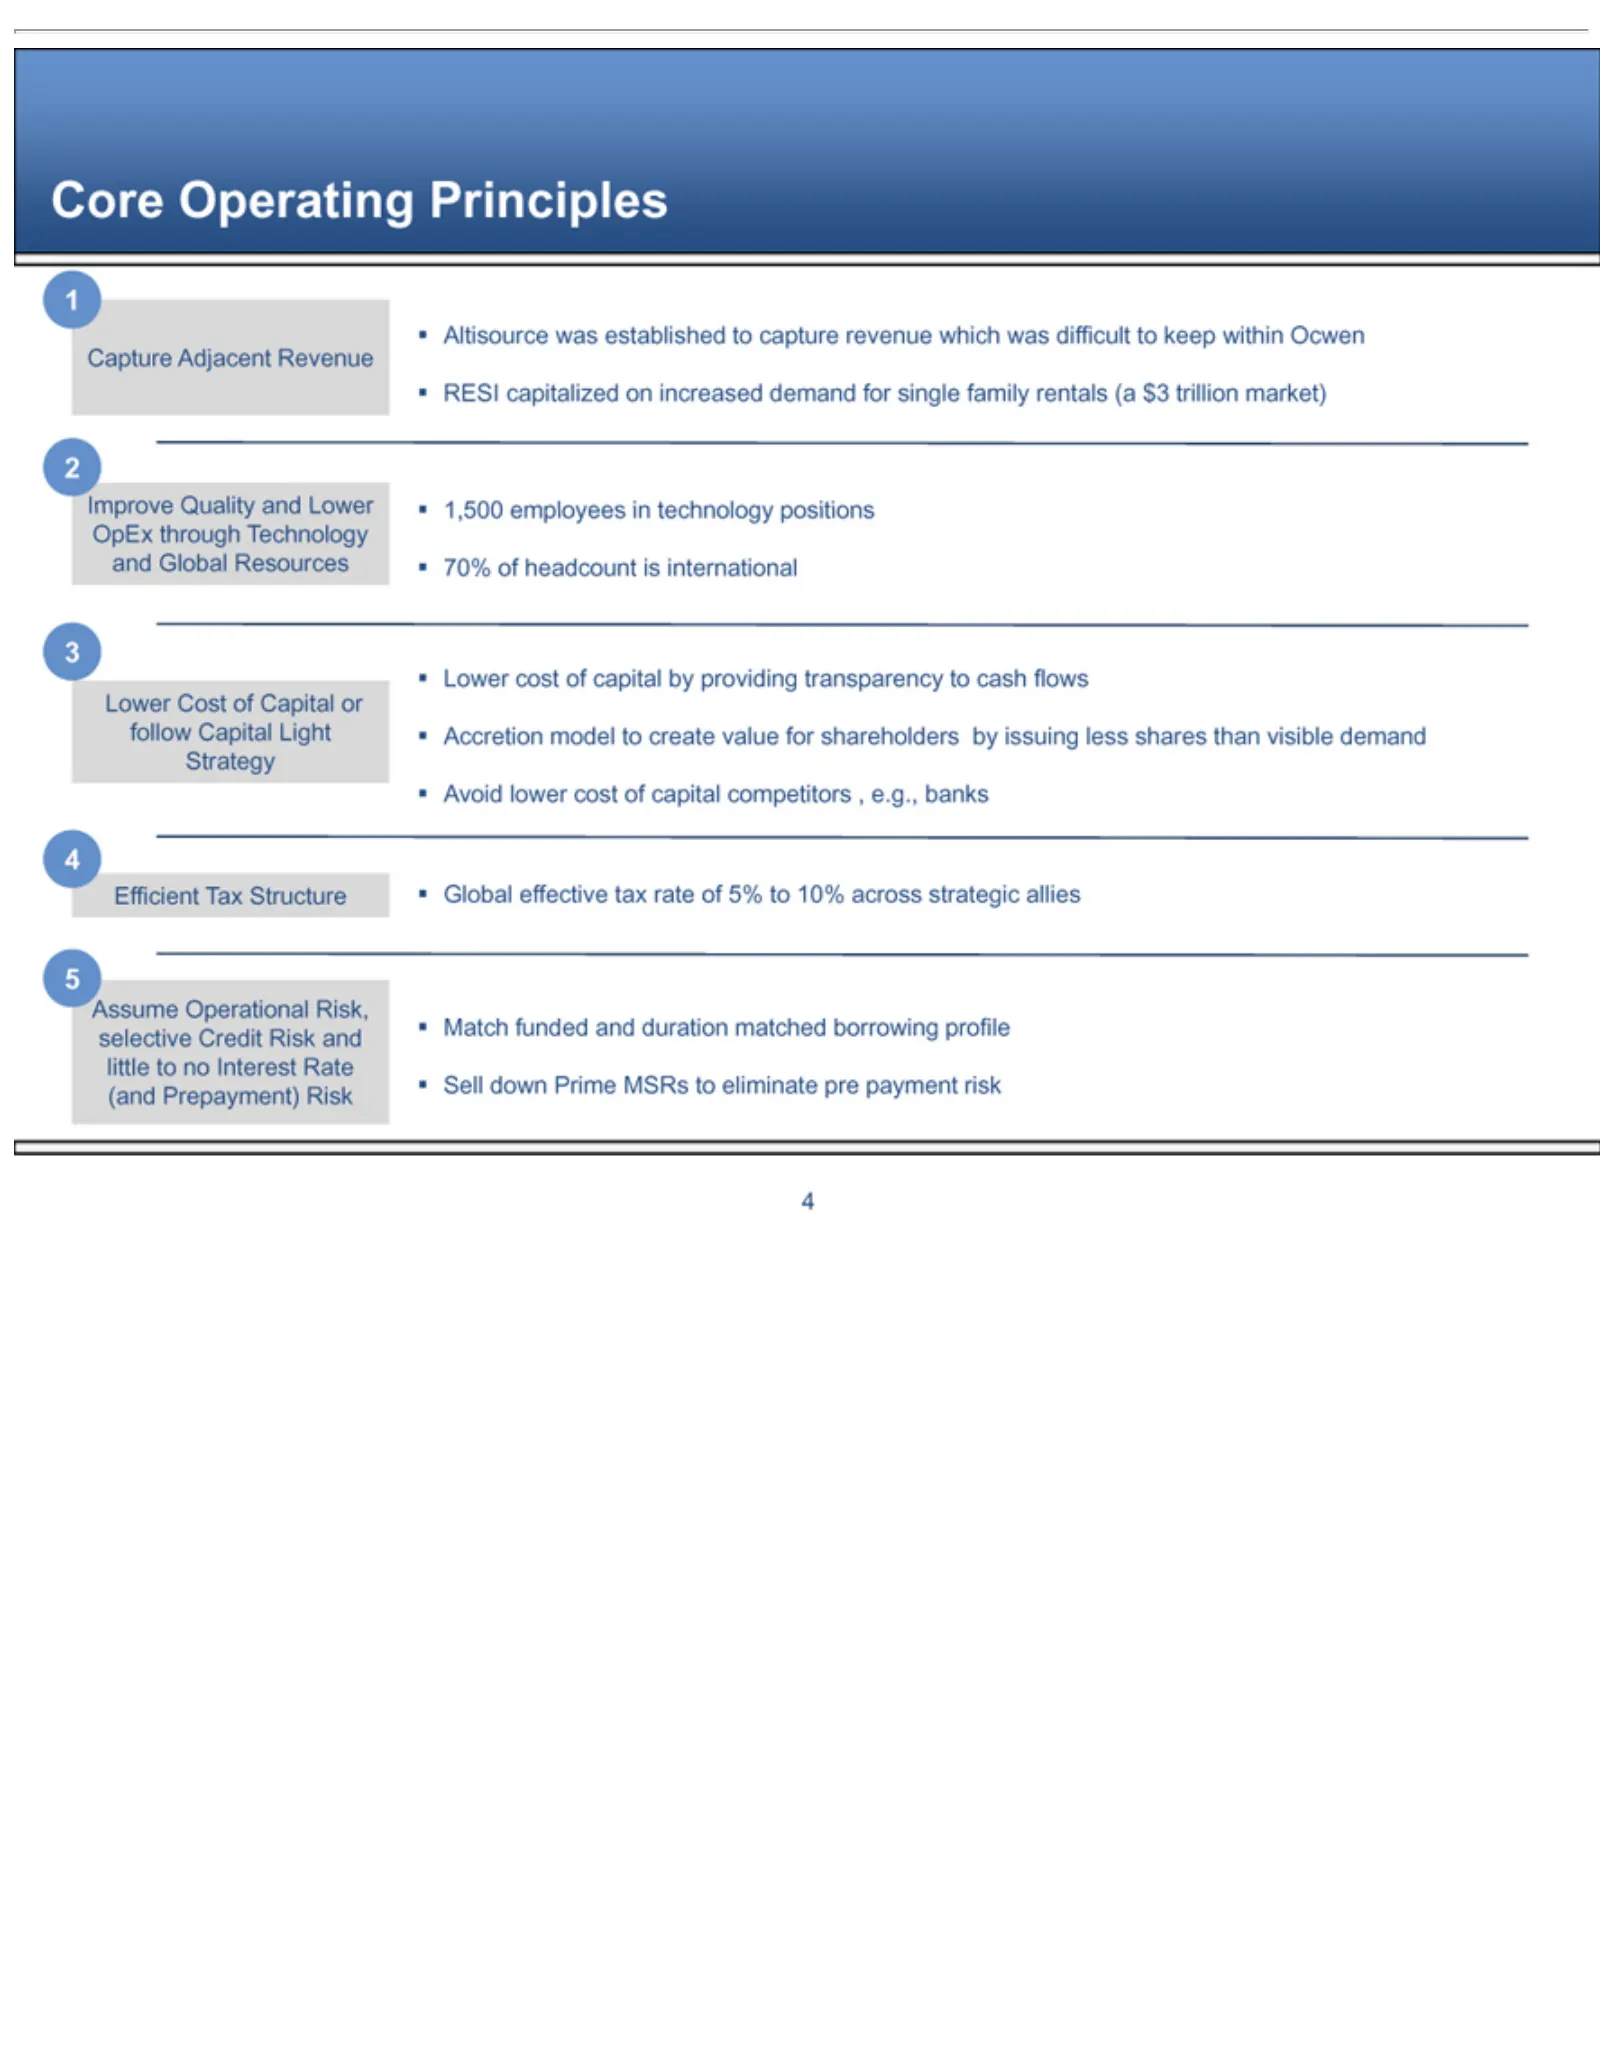
Slide 24: Core Operating Principles and RESI Accretion
1Core 2RESI 370% Accretion 5Avoid 4Sell Assume Capture Improve Lower Efficient down of Operating capitalized lower headcount Cost Adjacent Operational model Prime Quality Tax cost ofStructure Principles Capital MSRs to on ofis and create Revenue capital increased international Risk, Lower to or Glob
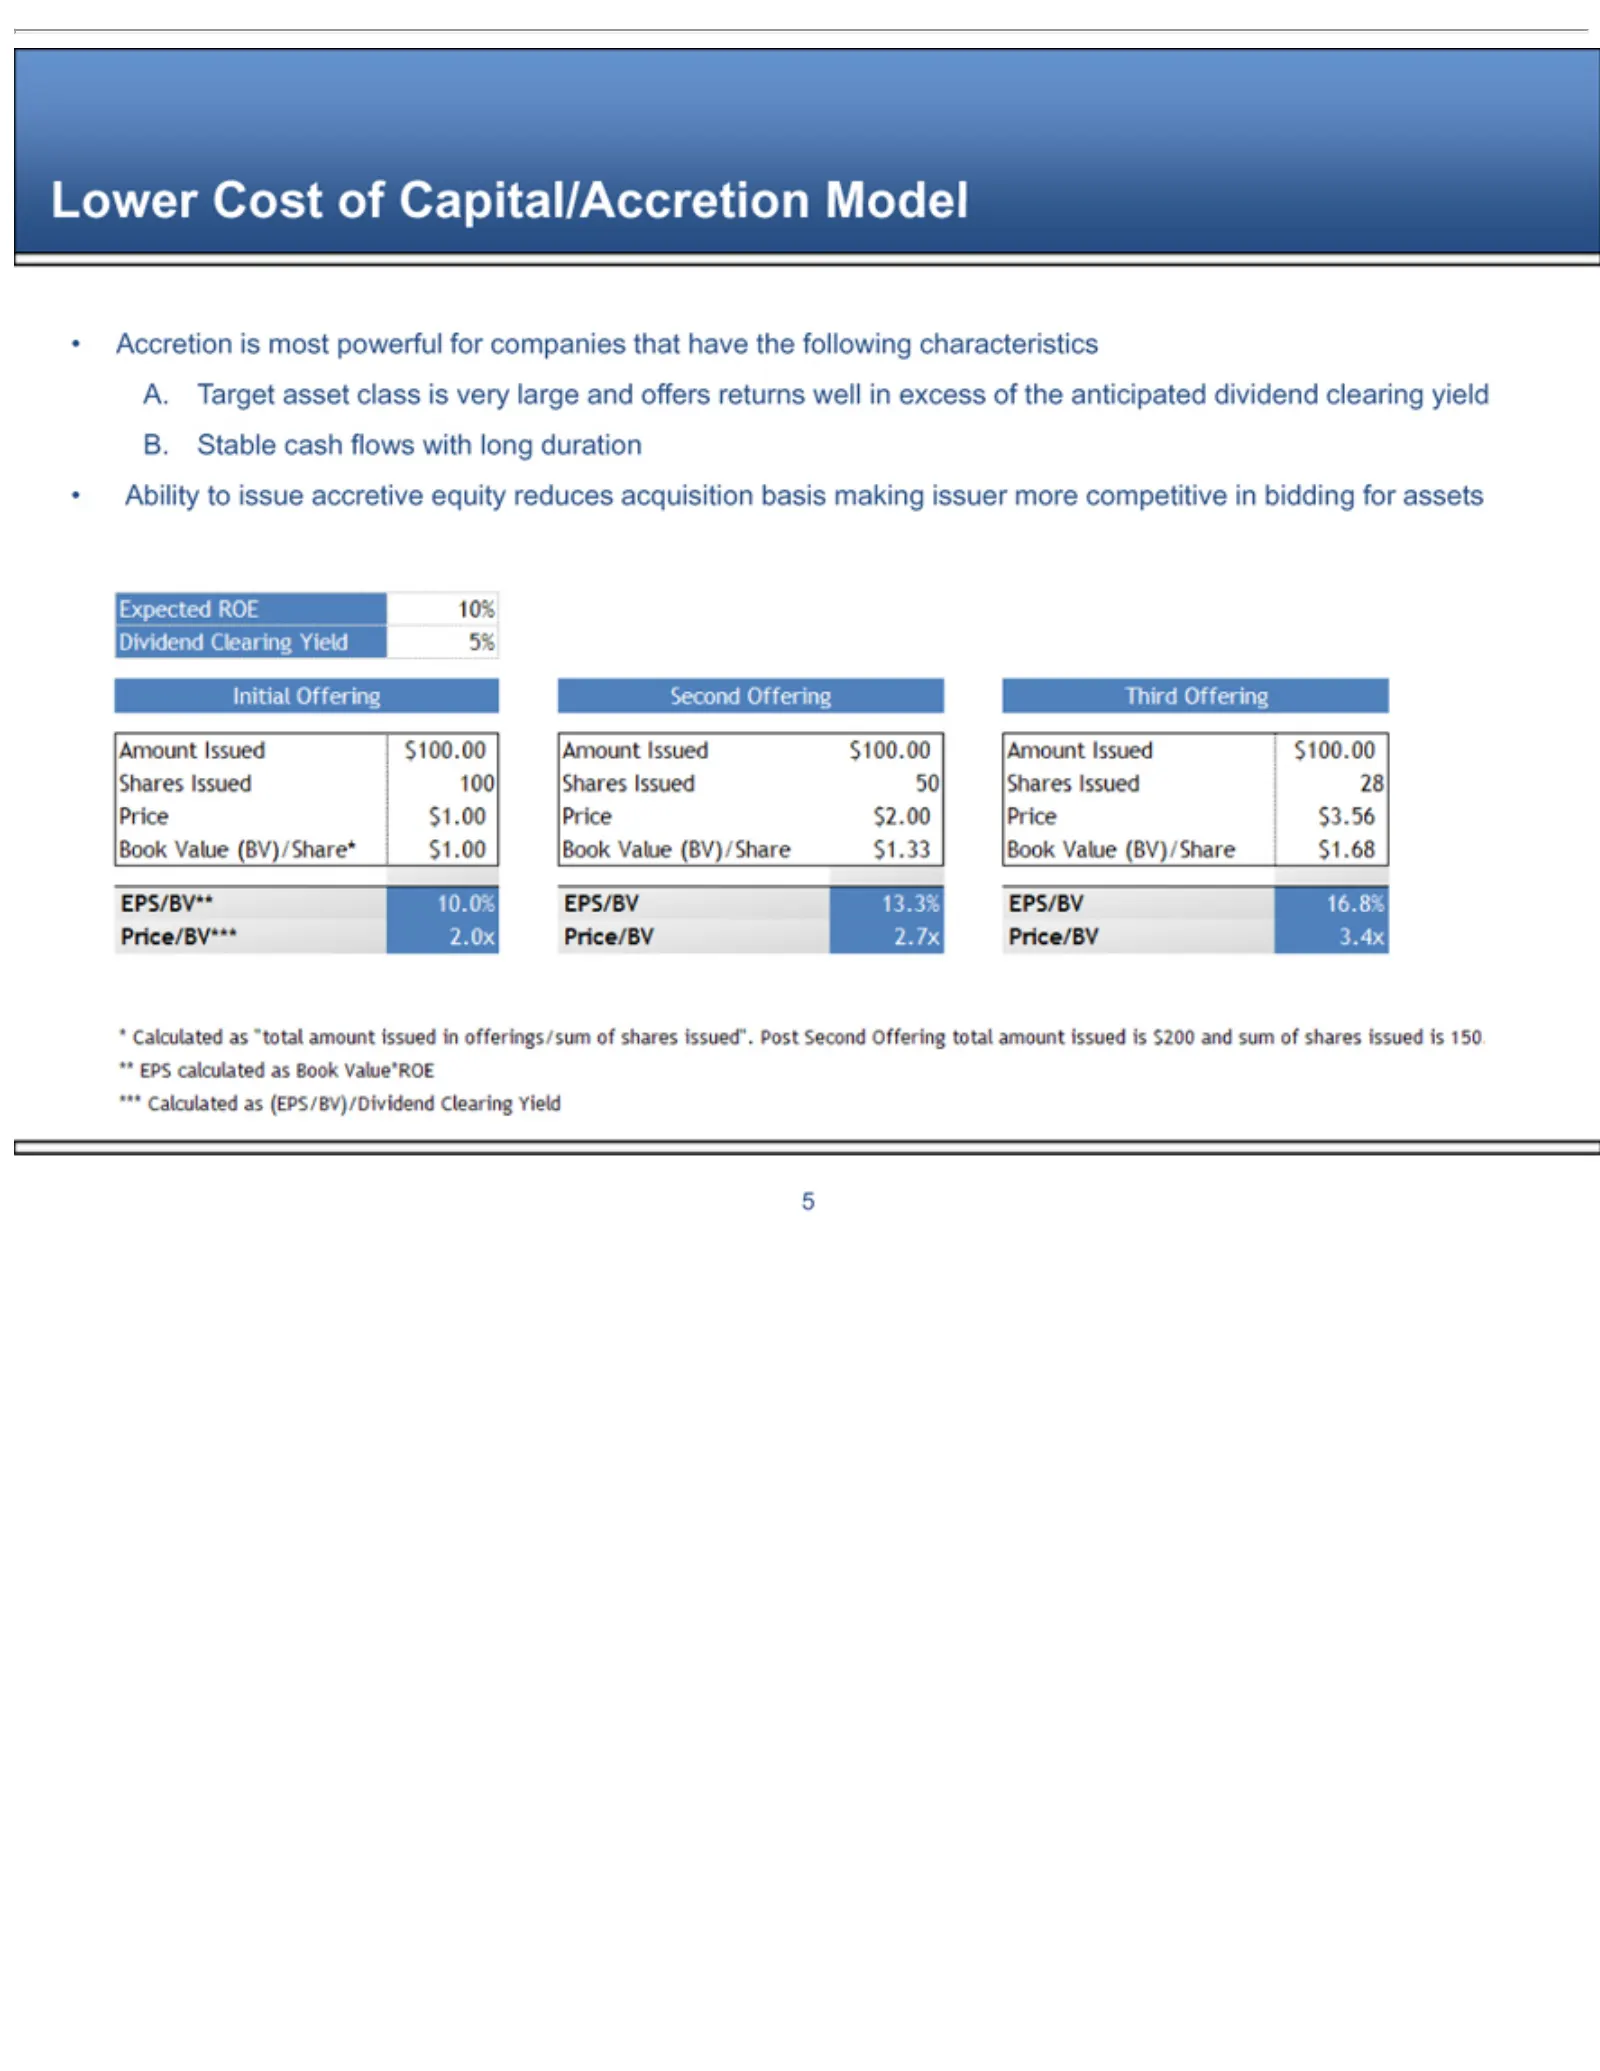
Slide 25: Accretion from Lower Cost of Capital
Lower Accretion A. Ability Expected Dividend Initial EPS/BV** Price/BV*** Second Shares Third Amount Price Book EPS/BV *Price/BV ** *** Calculated Target EPS Calculated $1.00 $2.00 $3.56 Value Offering Offering Cost Issued to Offering calculated Issued 13.3% 16.8% 2.7x. 3.4x ROE Clearing asset issue
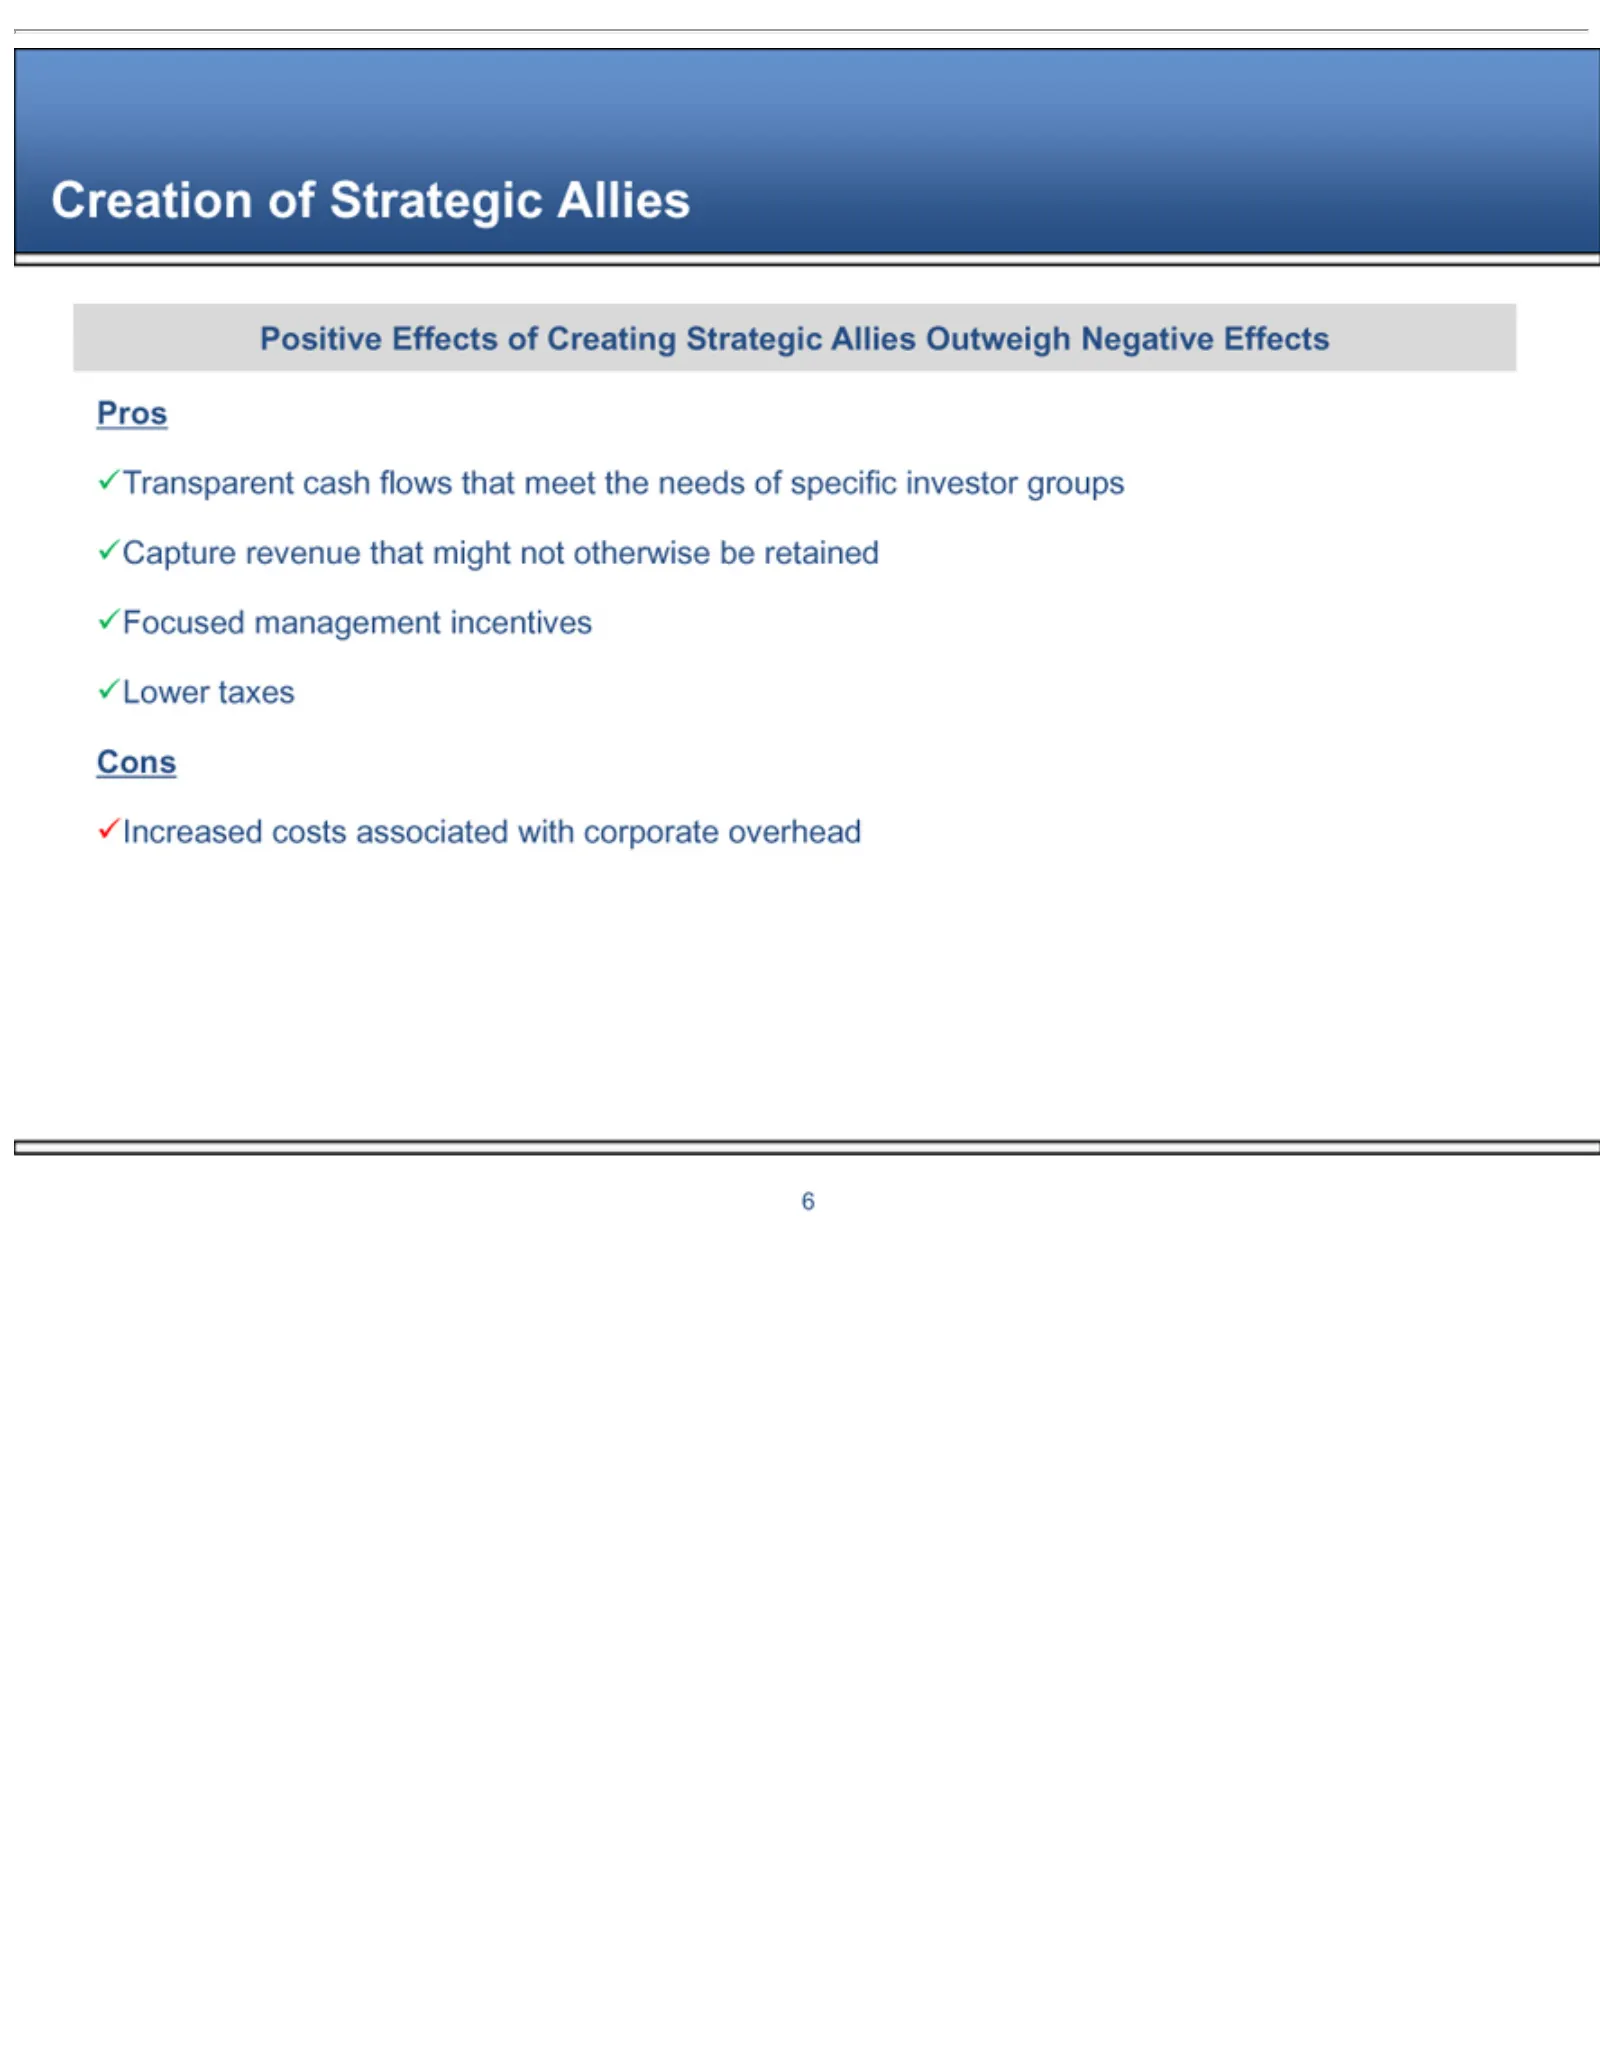
Slide 26: Pros and Cons of Creating Strategic Allies
Creation Positive Transparent Pros Capture Focused Lower Increased 6Cons taxes revenue Effects management ofcosts Strategic cashassociated of that flows Creating Allies might incentives thatwith not meet Strategic otherwise corporate the needs Allies overhead beof Outweigh retained specific investor
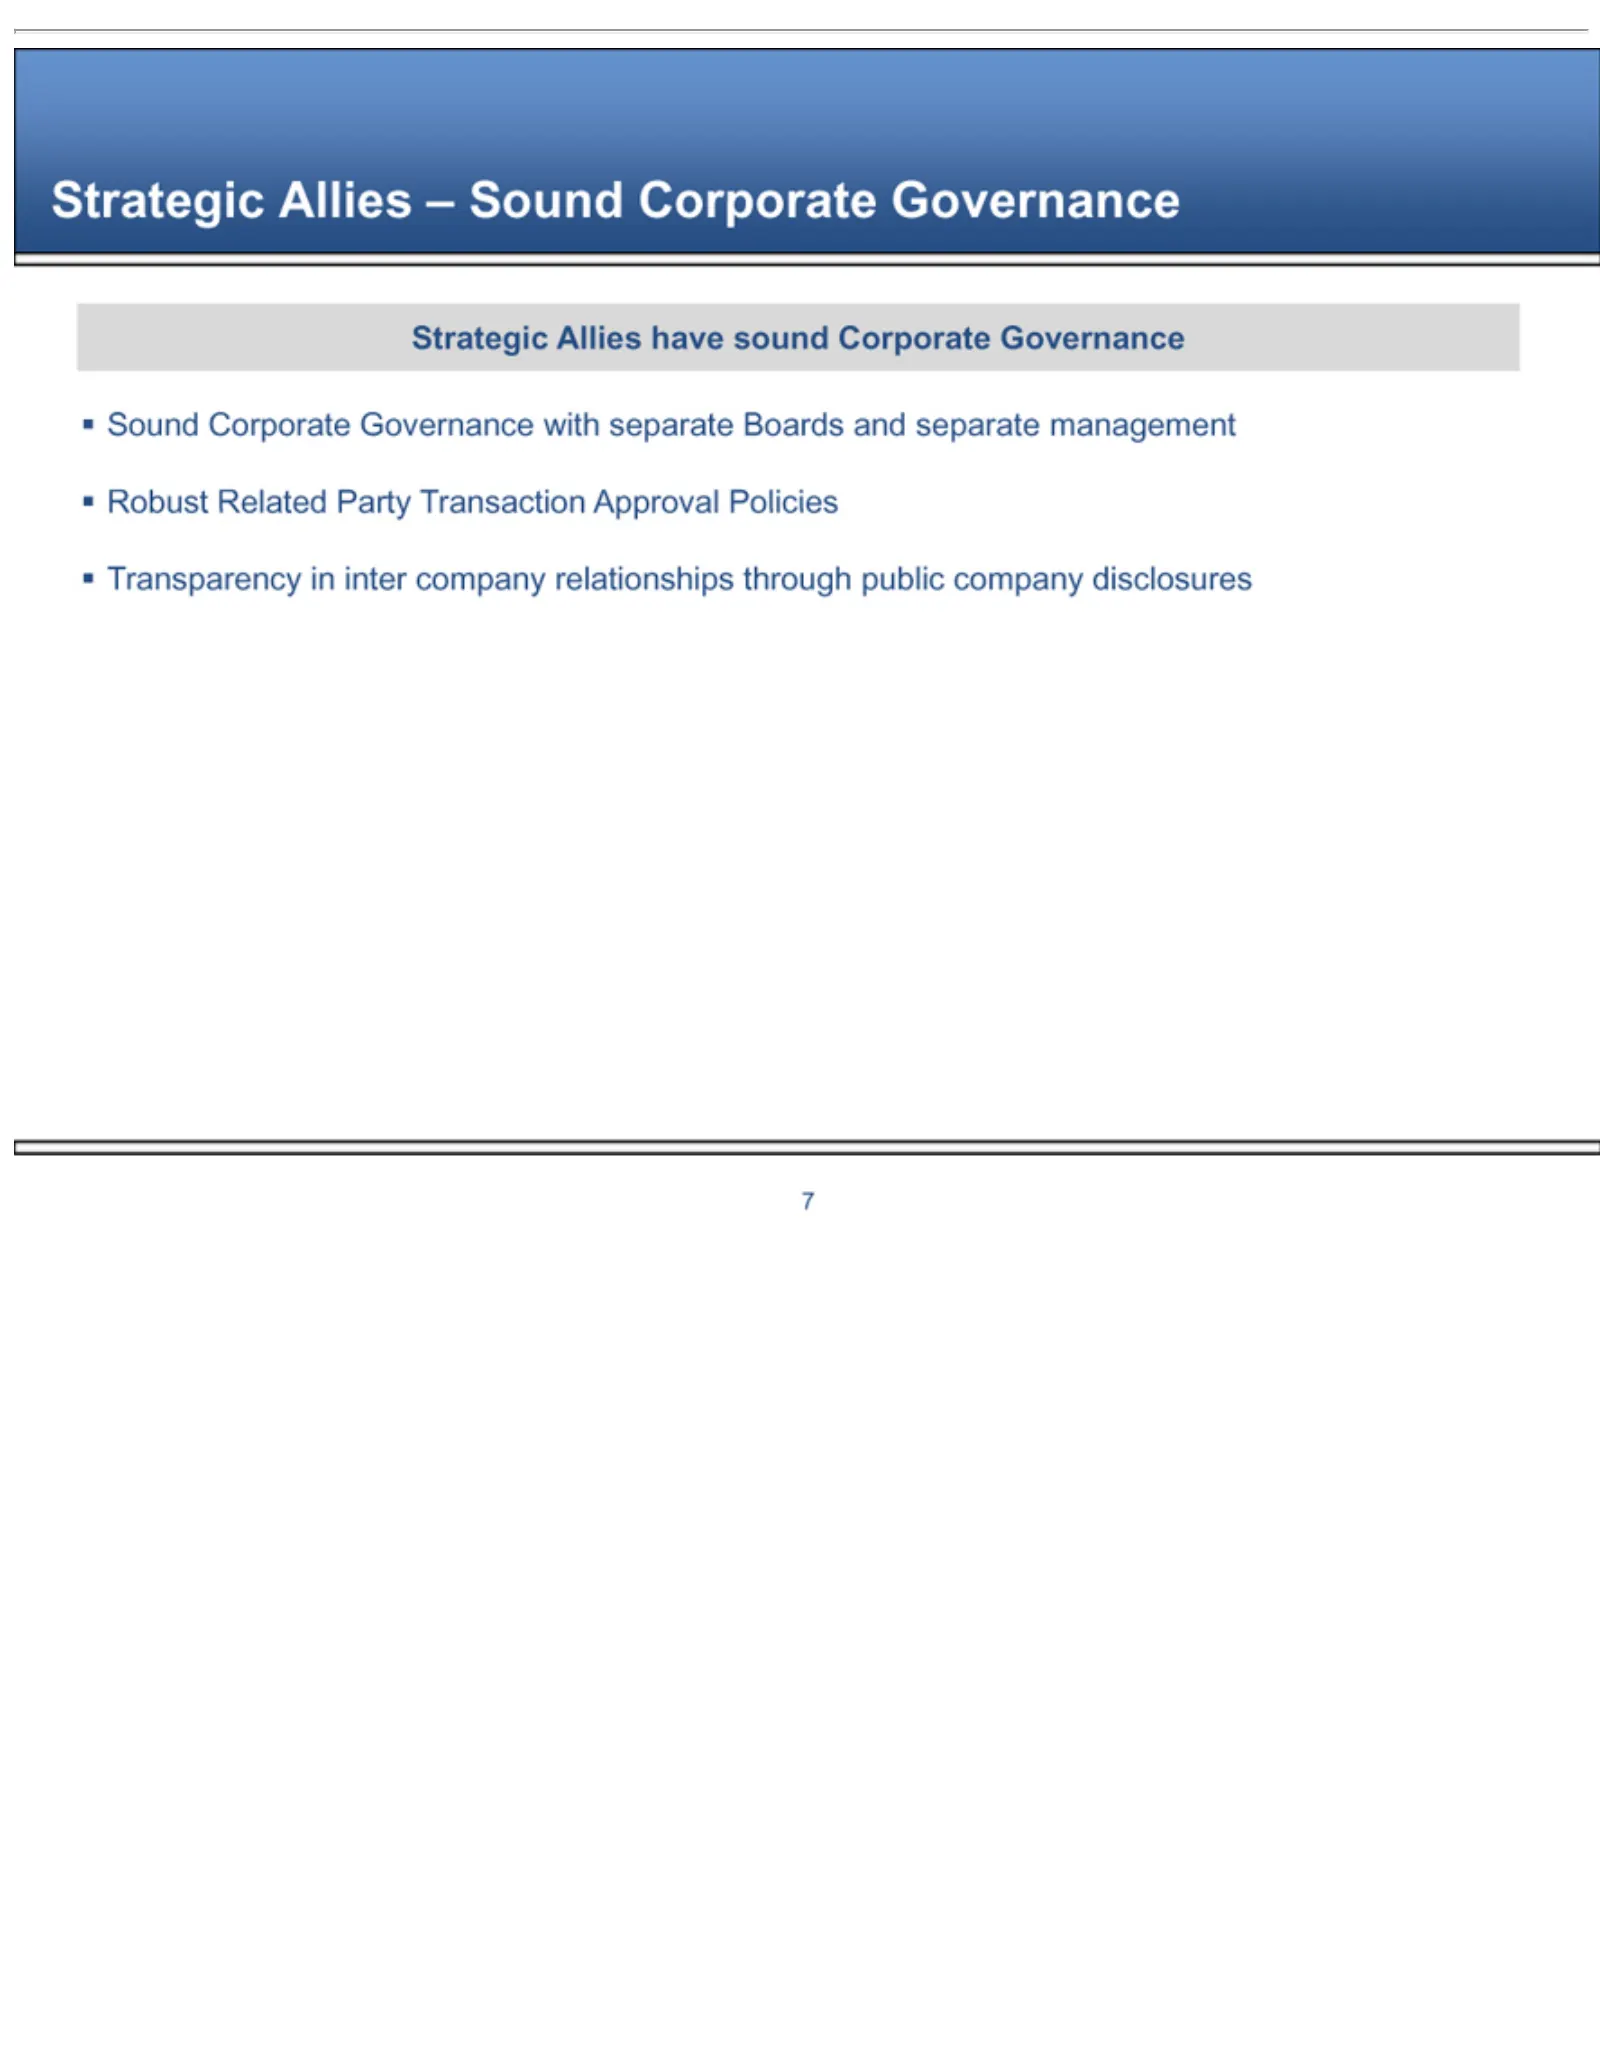
Slide 27: Sound Corporate Governance
Strategic Sound Robust 7Transparency Corporate Related Alliesinhave –Party inter Governance Soundsound Transaction company Corporation Corporate with relationships Approval separate Governance Governance Policies Boards throughand public separate company management disclosures
Slide 28: Agenda: Secular Trends
1. Strategic Agenda 2. 83. Core Operating Secular Trends Allies Positioned Principles for New Landscape
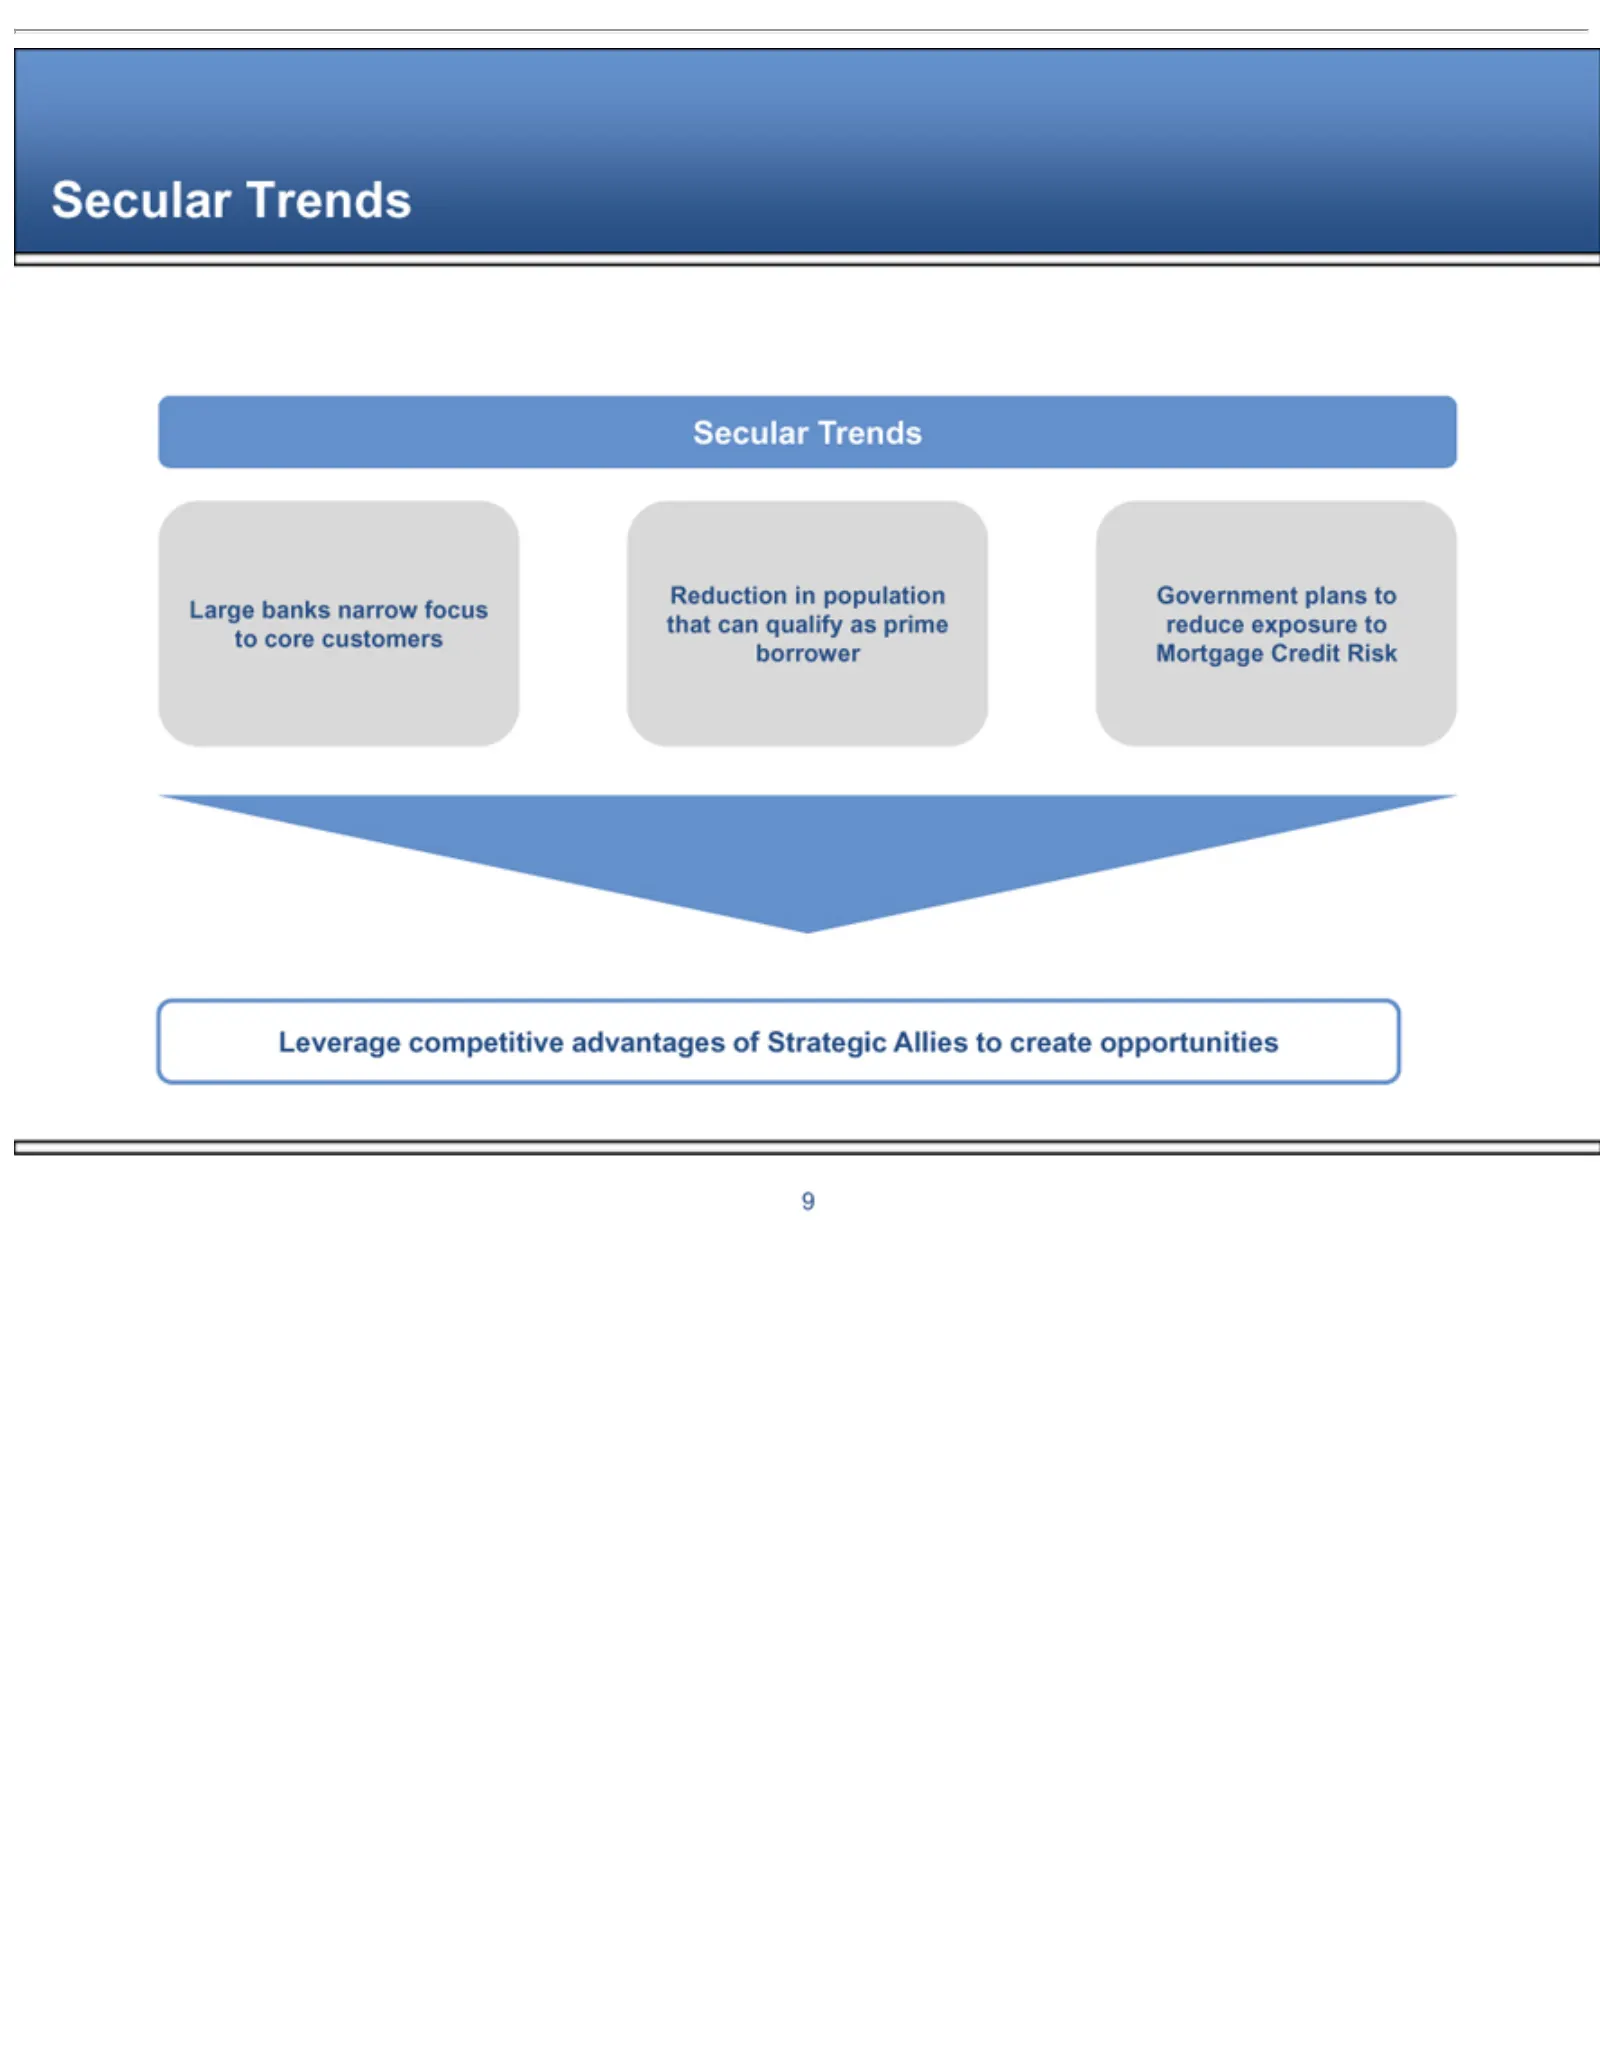
Slide 29: Secular Trends: Banks Reducing Mortgage Credit Risk
Secularbanks Large Reduction Government 9Leverage Trends competitive innarrow plans population tofocus reduce advantages that to exposure can corequalify of customers Strategic to as Mortgage prime Allies borrower Credit to create Riskopportunities
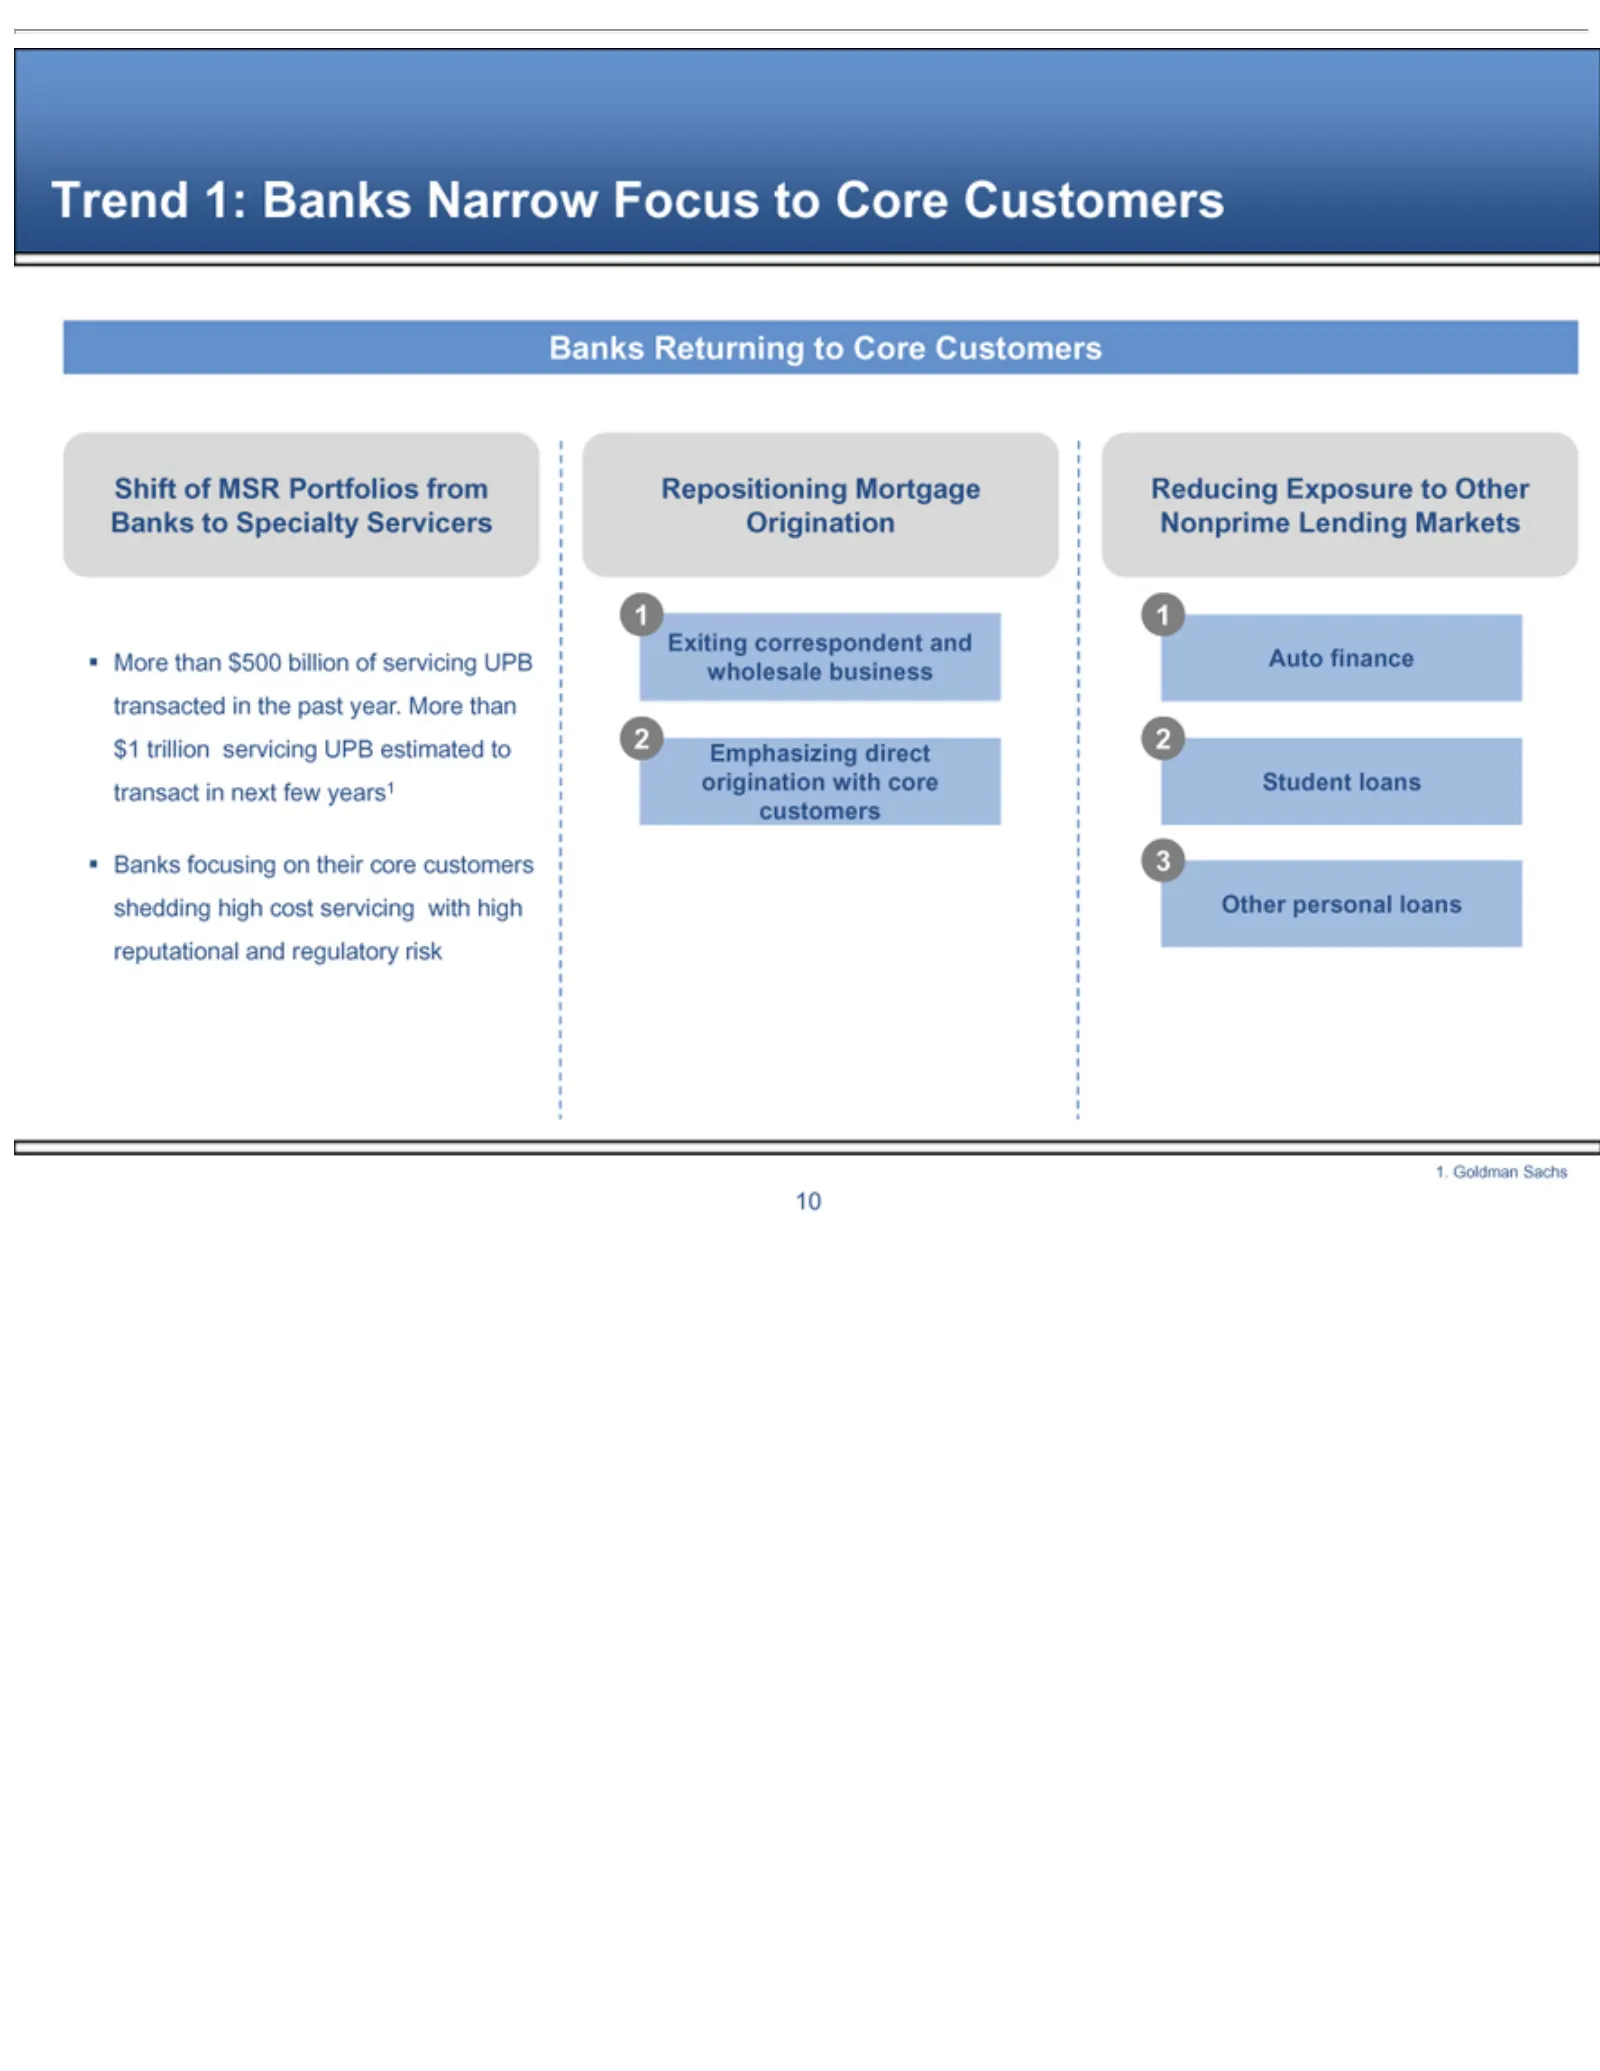
Slide 30: Banks Narrowing Focus to Core Customers
Trend Shift More Banks Repositioning E Reducing 1A 2S 3O 1. 10 tudent xiting mphasizing uto ther Goldman of finance than personal 1: Returning focusing correspondent MSR loans Banks Exposure $500 Sachs direct Portfolios Mortgage loans Narrow on billion totheir origination Core to and Other of Focus
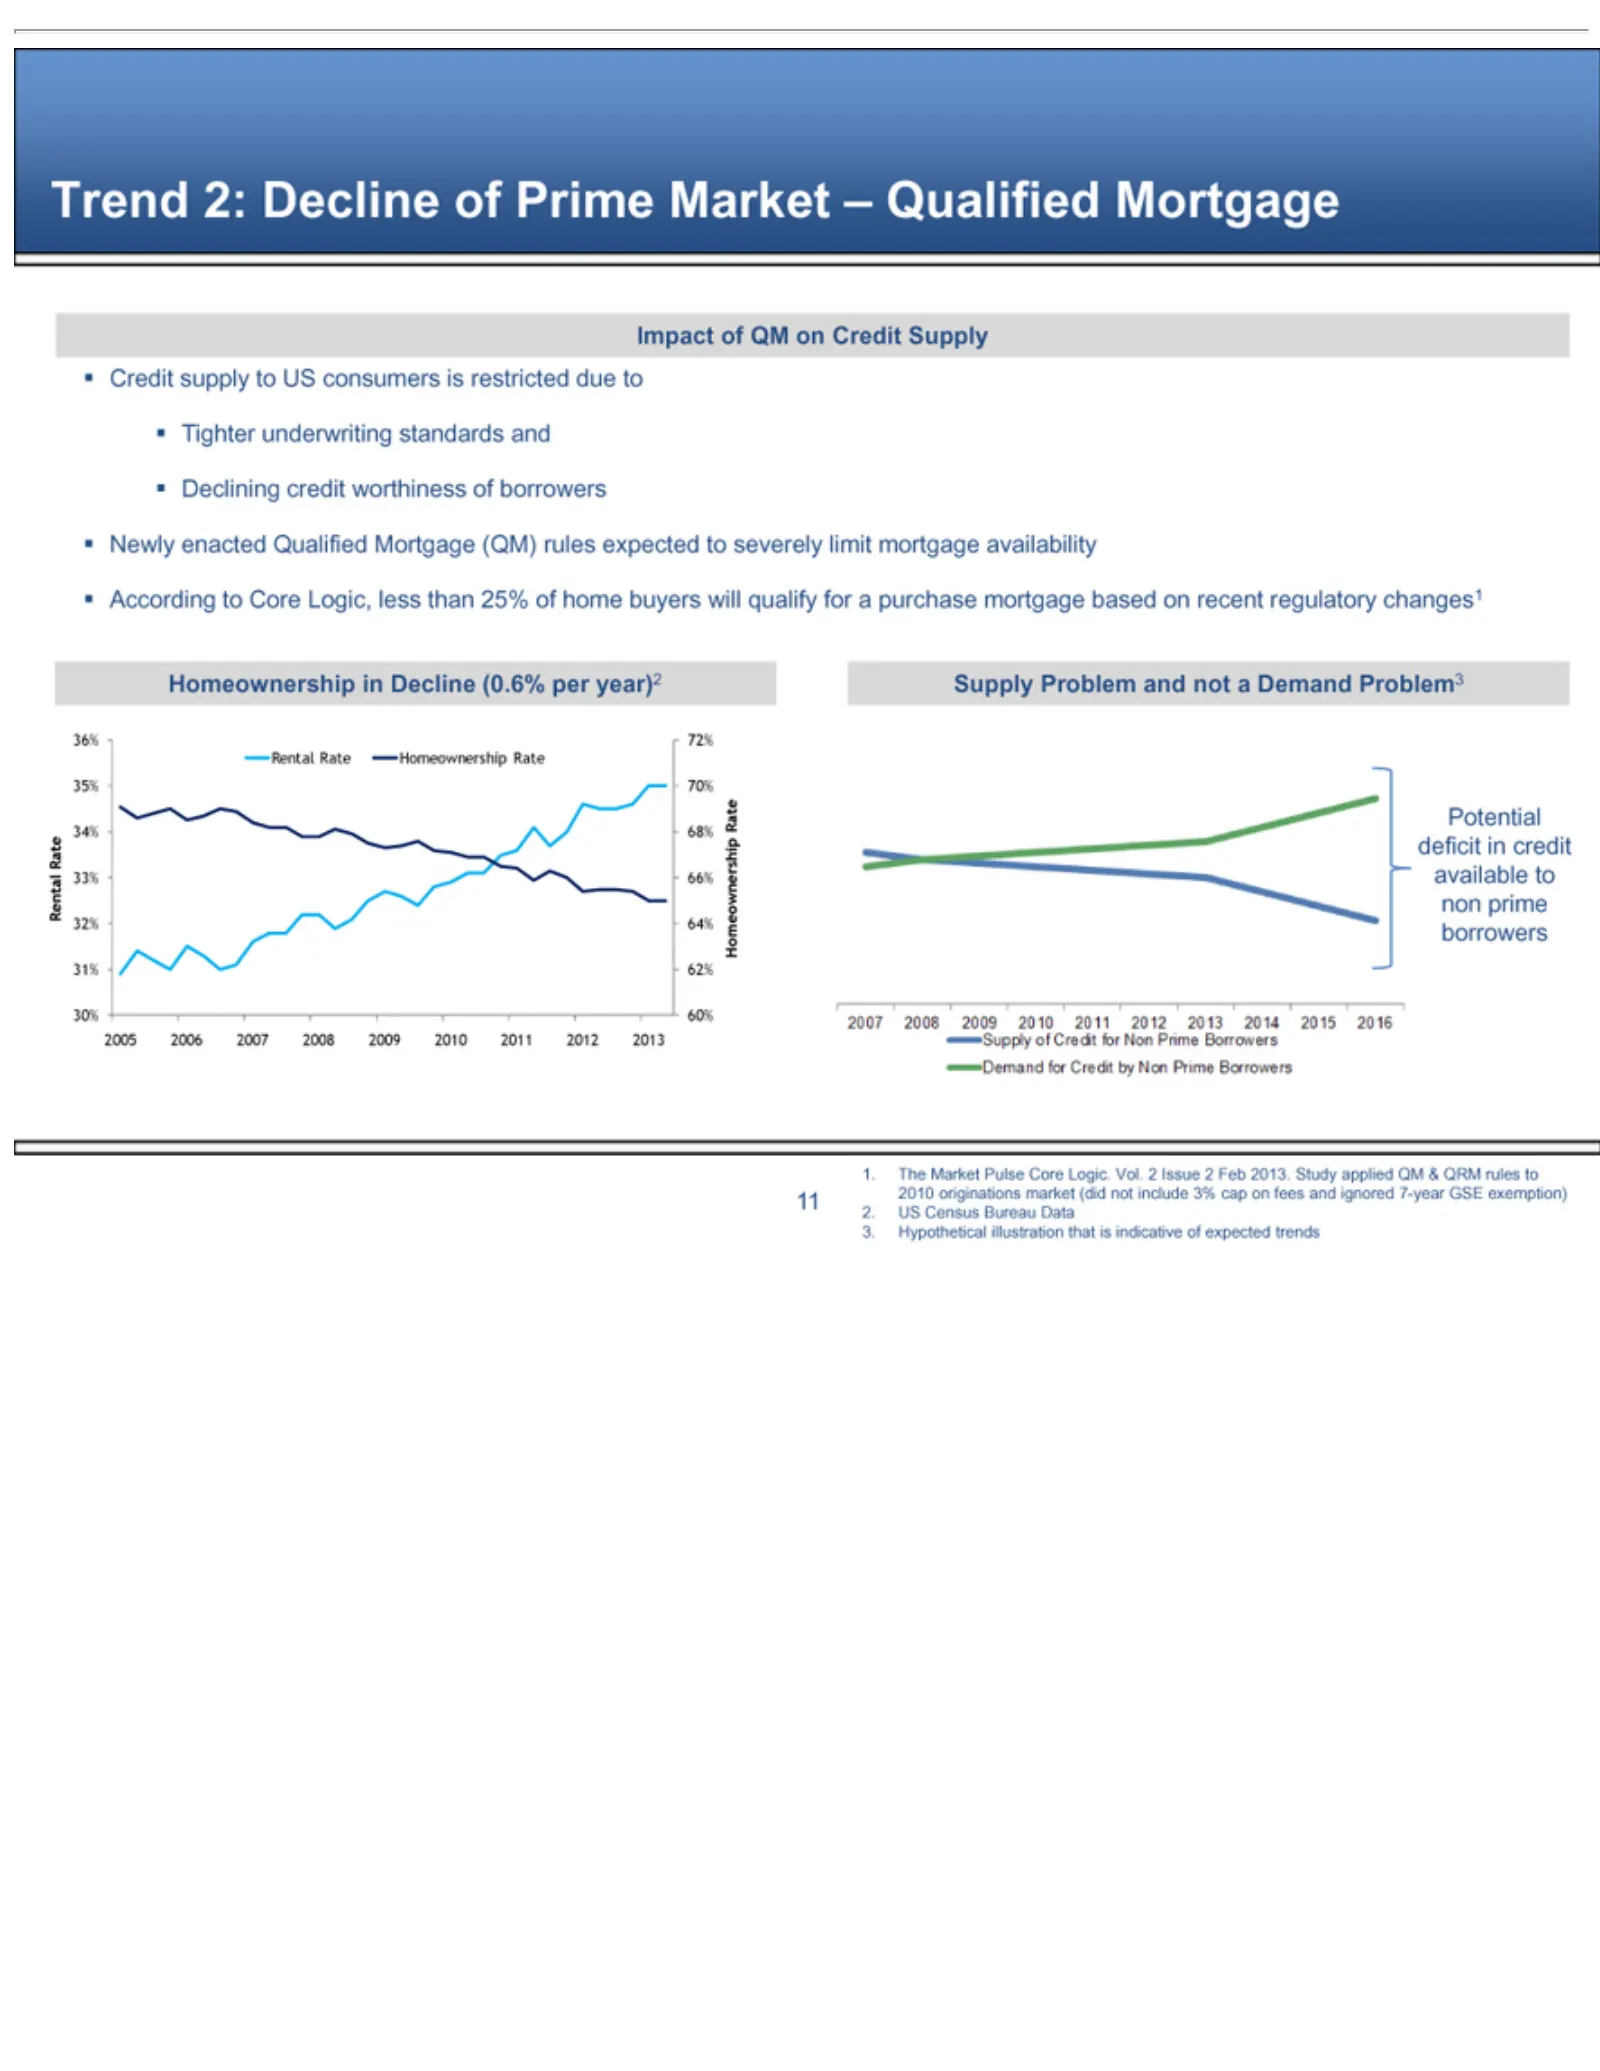
Slide 31: Tighter Credit and Declining Homeownership
Trend Impact Credit Tighter Declining Newly According 36% Rental 35% 34% 33% 32% 31% 30% 2005 Homeownership Potential Supply 2016 2015 2014 2013 2012 2011 2010 2009 2008 2007 Demand 1. 2. 3. 11 The US60% Hypothetical 72% 70% 68% 66% 64% 62% 2006 Census 2: supply Market Rate enacted of Problem underw
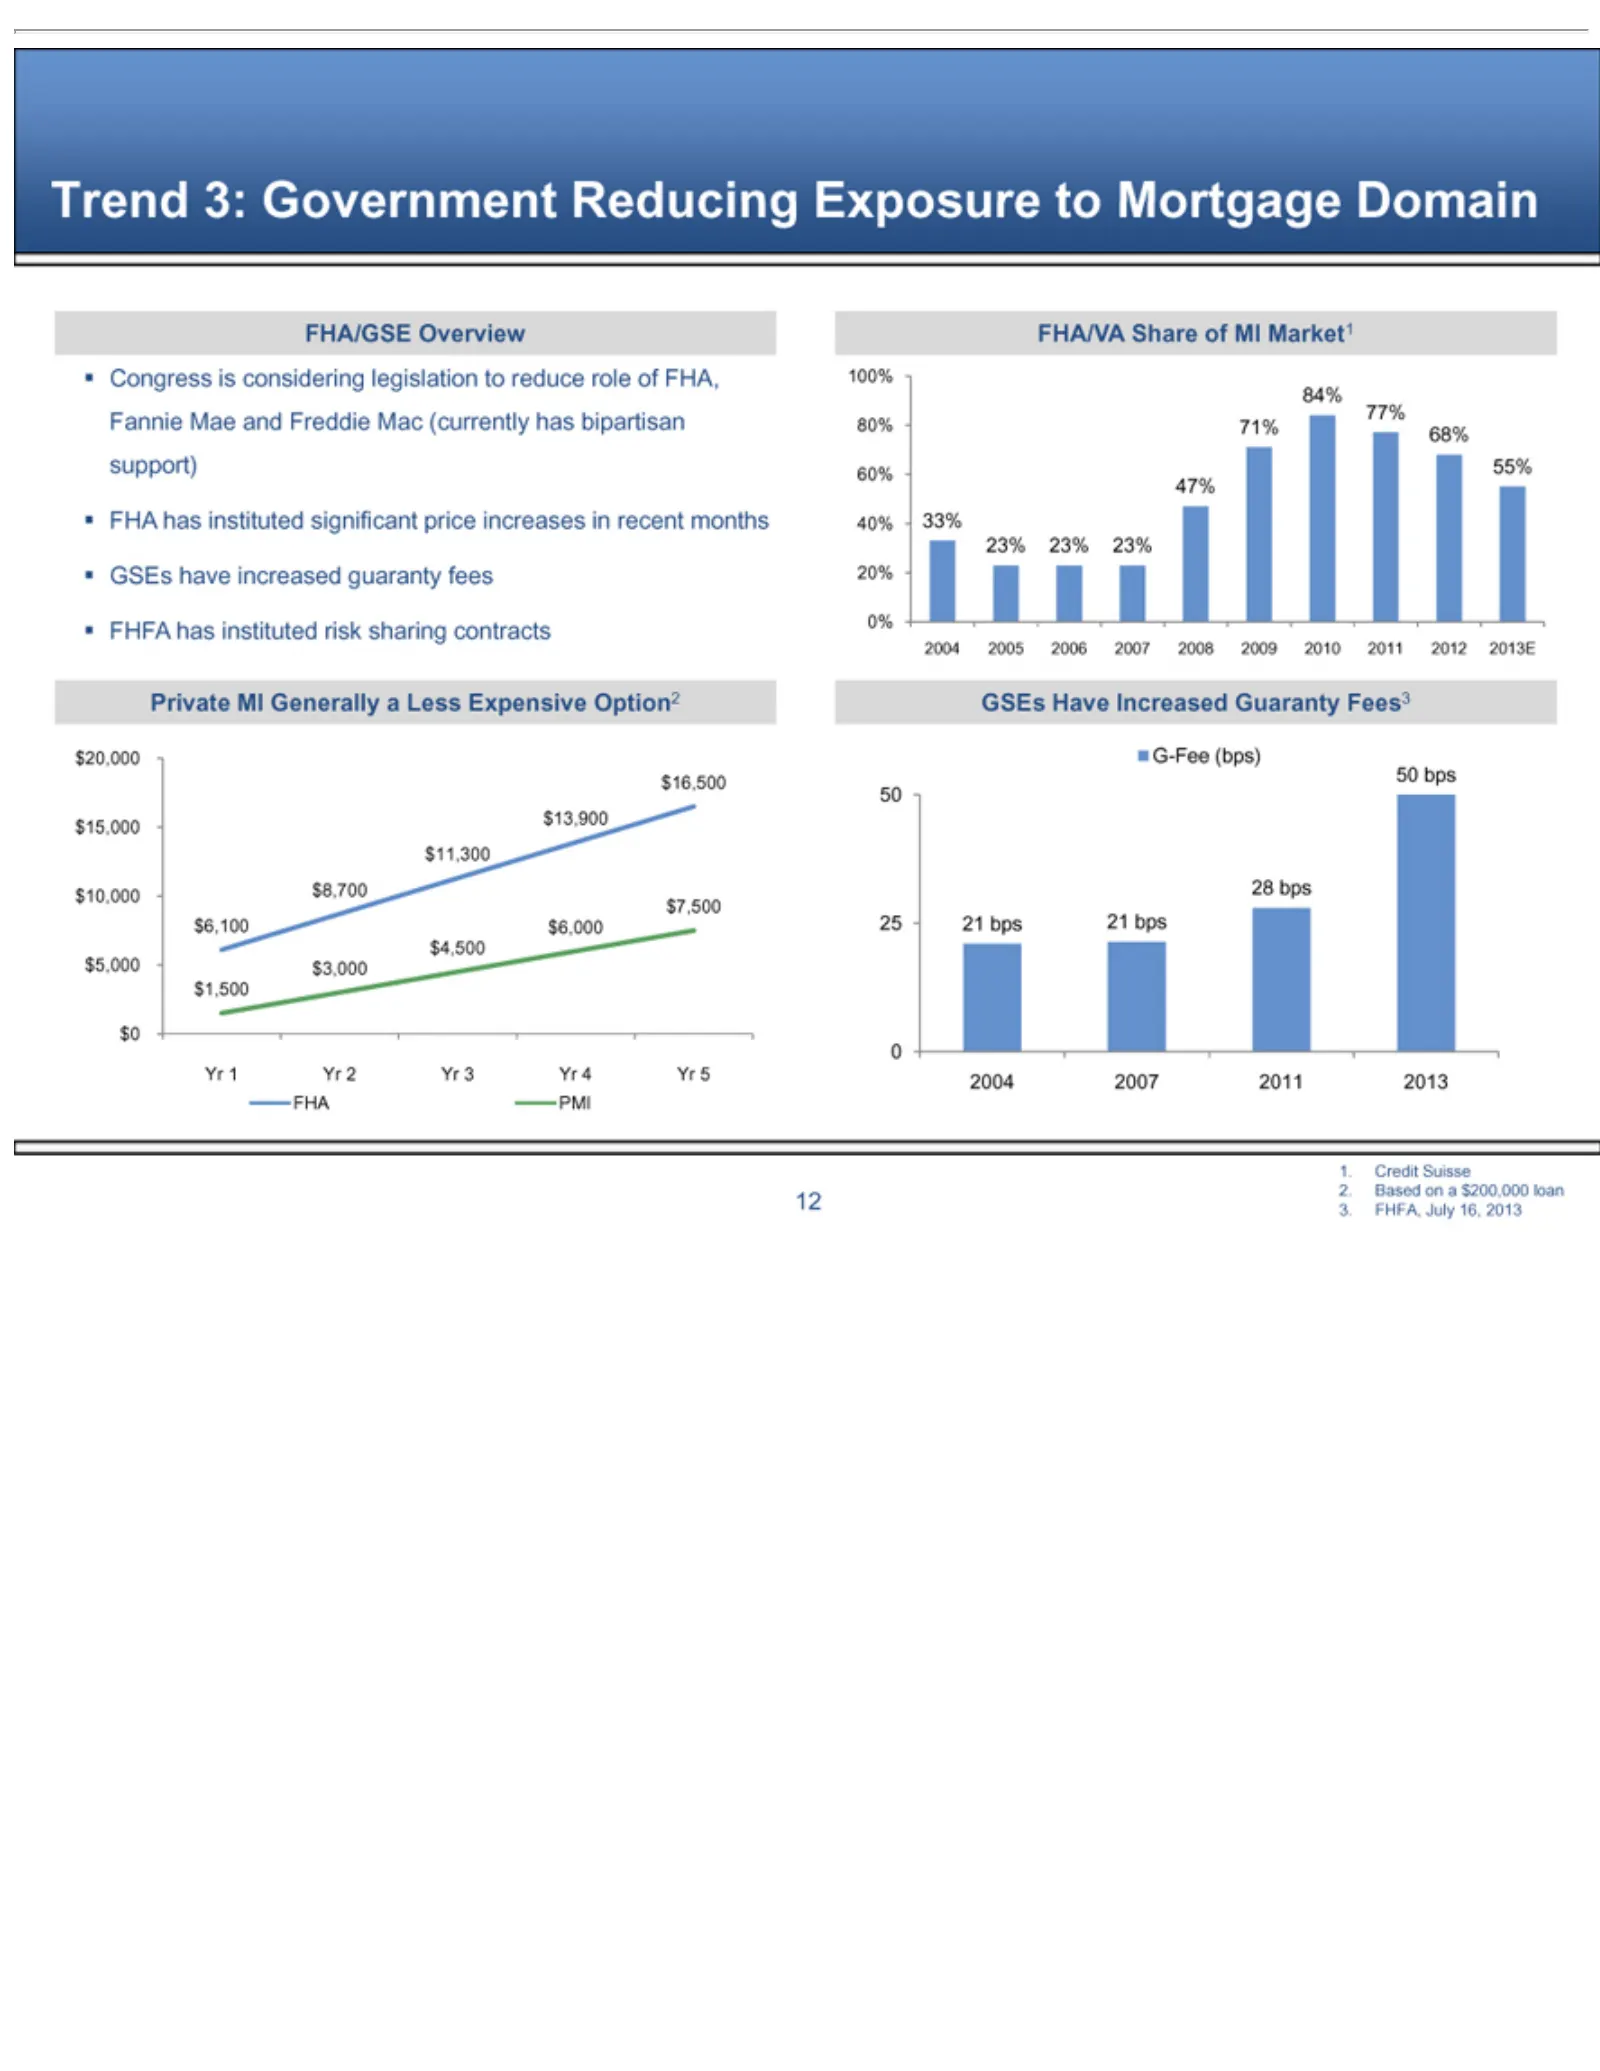
Slide 32: FHA/GSE Reducing Exposure to Mortgage Market
Trend FHA/GSE Congress FHFA FHA/VA 80% 77% 84% 100% 60% 40% 47% 23% 2004 0% 20% Private $15,000 $16,500 $20,000 $10,000 $11,300 $6,100 $7,500 $5,000 $4,500 Yr $0 $1,500 FHA GSEs 50 21 G-Fee 1. 2. 3. 12 Credit Based FHFA, 25 bps 1 Yr 71% 55% 33% 23% has PMI 2005 0Have have 3: has (bps) 2004 $6,000 $3
Slide 33: Agenda: Strategic Allies Positioned
1. Strategic Agenda 2. 3. 13 Core Operating Secular Trends Allies Positioned Principles for New Landscape
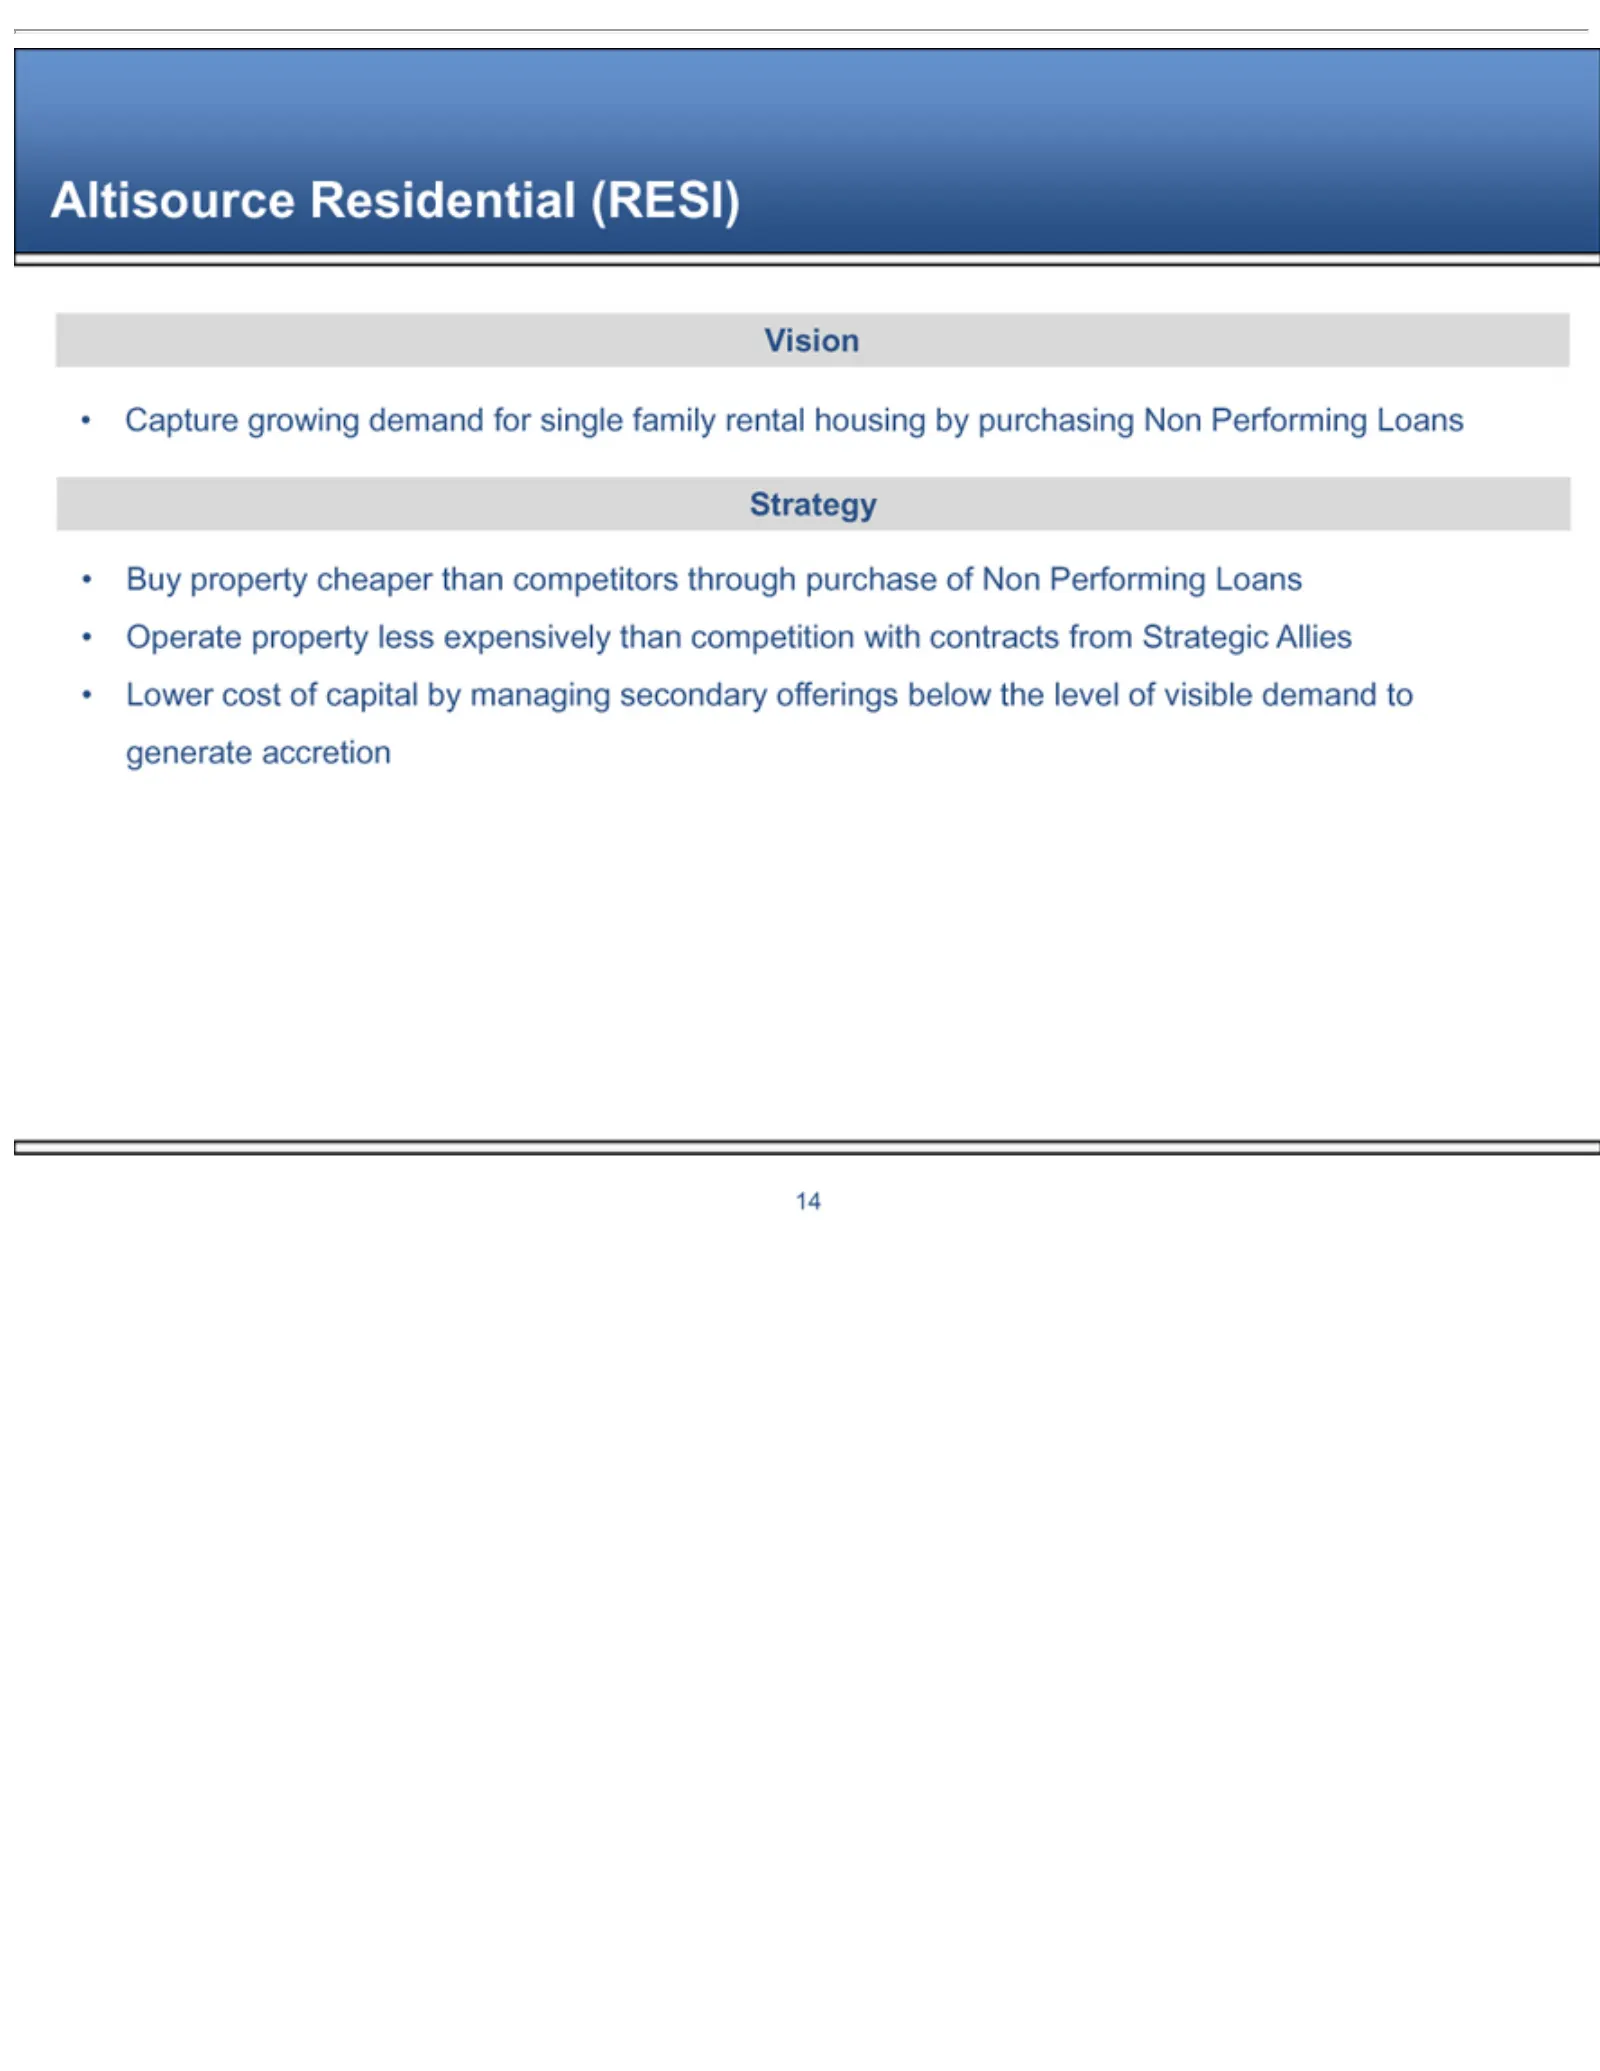
Slide 34: Altisource Residential Vision
Altisource Capture Vision Buy Strategy Operate Lower 14 property cost property growing Residential ofcheaper capital demand less by expensively than (RESI) managing for competitors singlethan secondary family competition through rental offerings purchase housing withbelow contracts of byNon purchasi
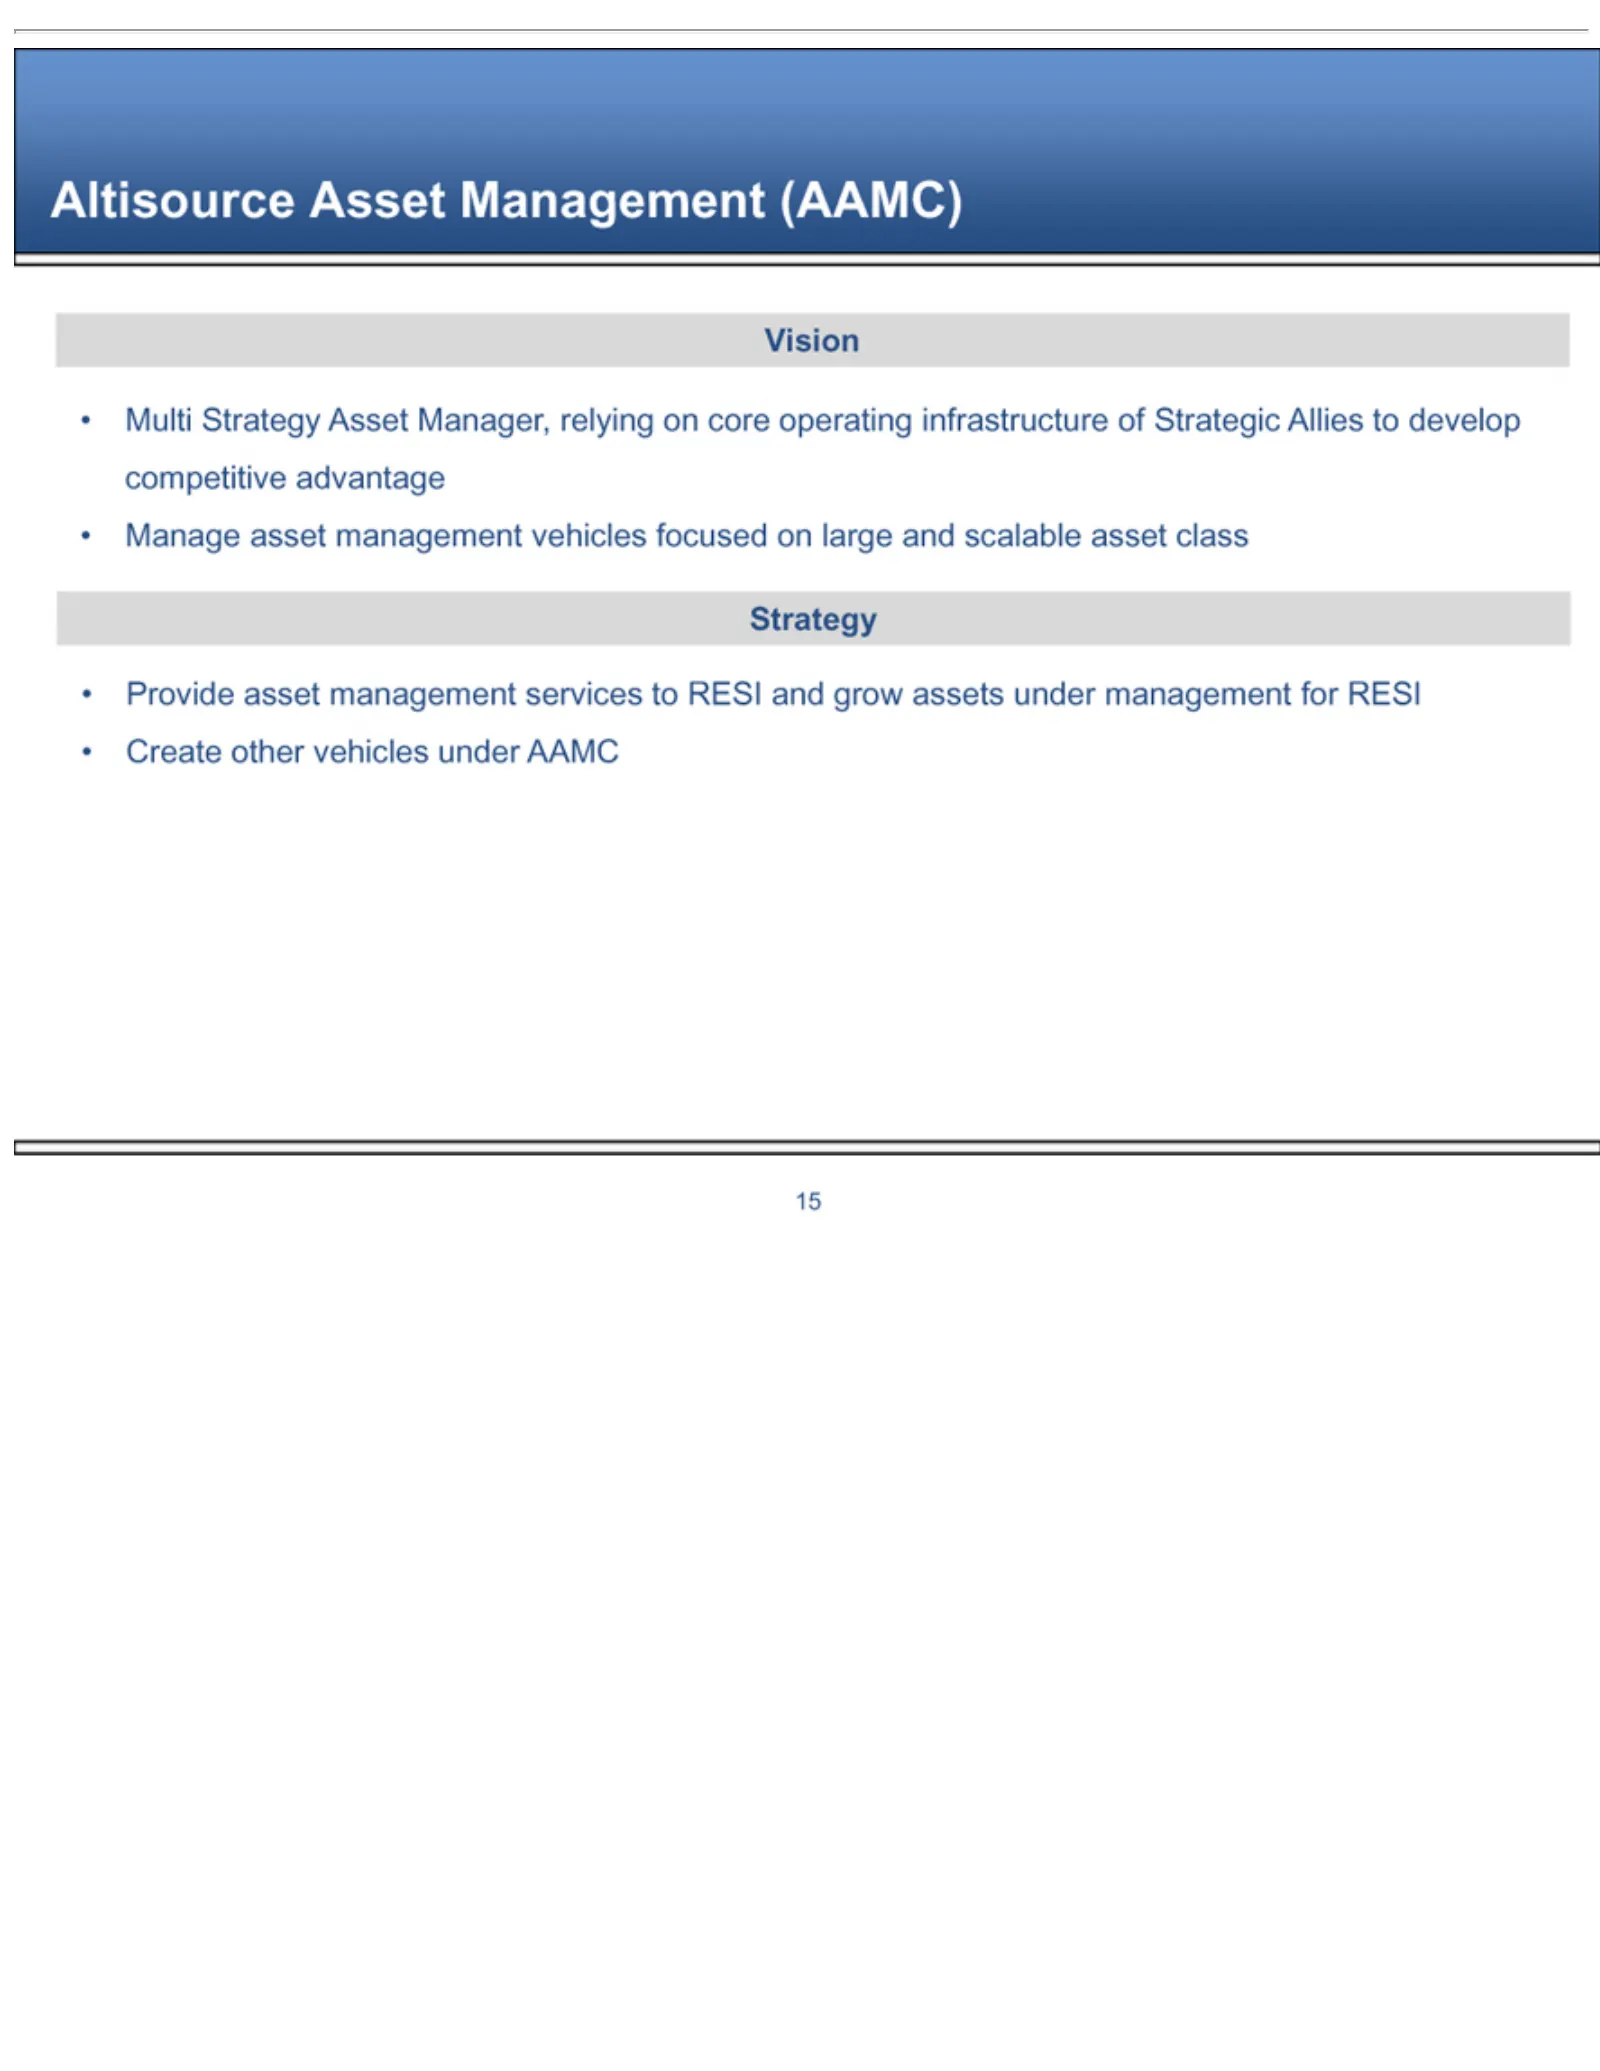
Slide 35: Altisource Asset Management Vision
Altisource Multi Vision Manage Provide Strategy Create 15 Strategy other asset asset Asset vehicles management management Asset Management Manager, underservices vehicles AAMC (AAMC) relying to focused RESI on core and onoperating large growand assets infrastructure scalable underasset management of
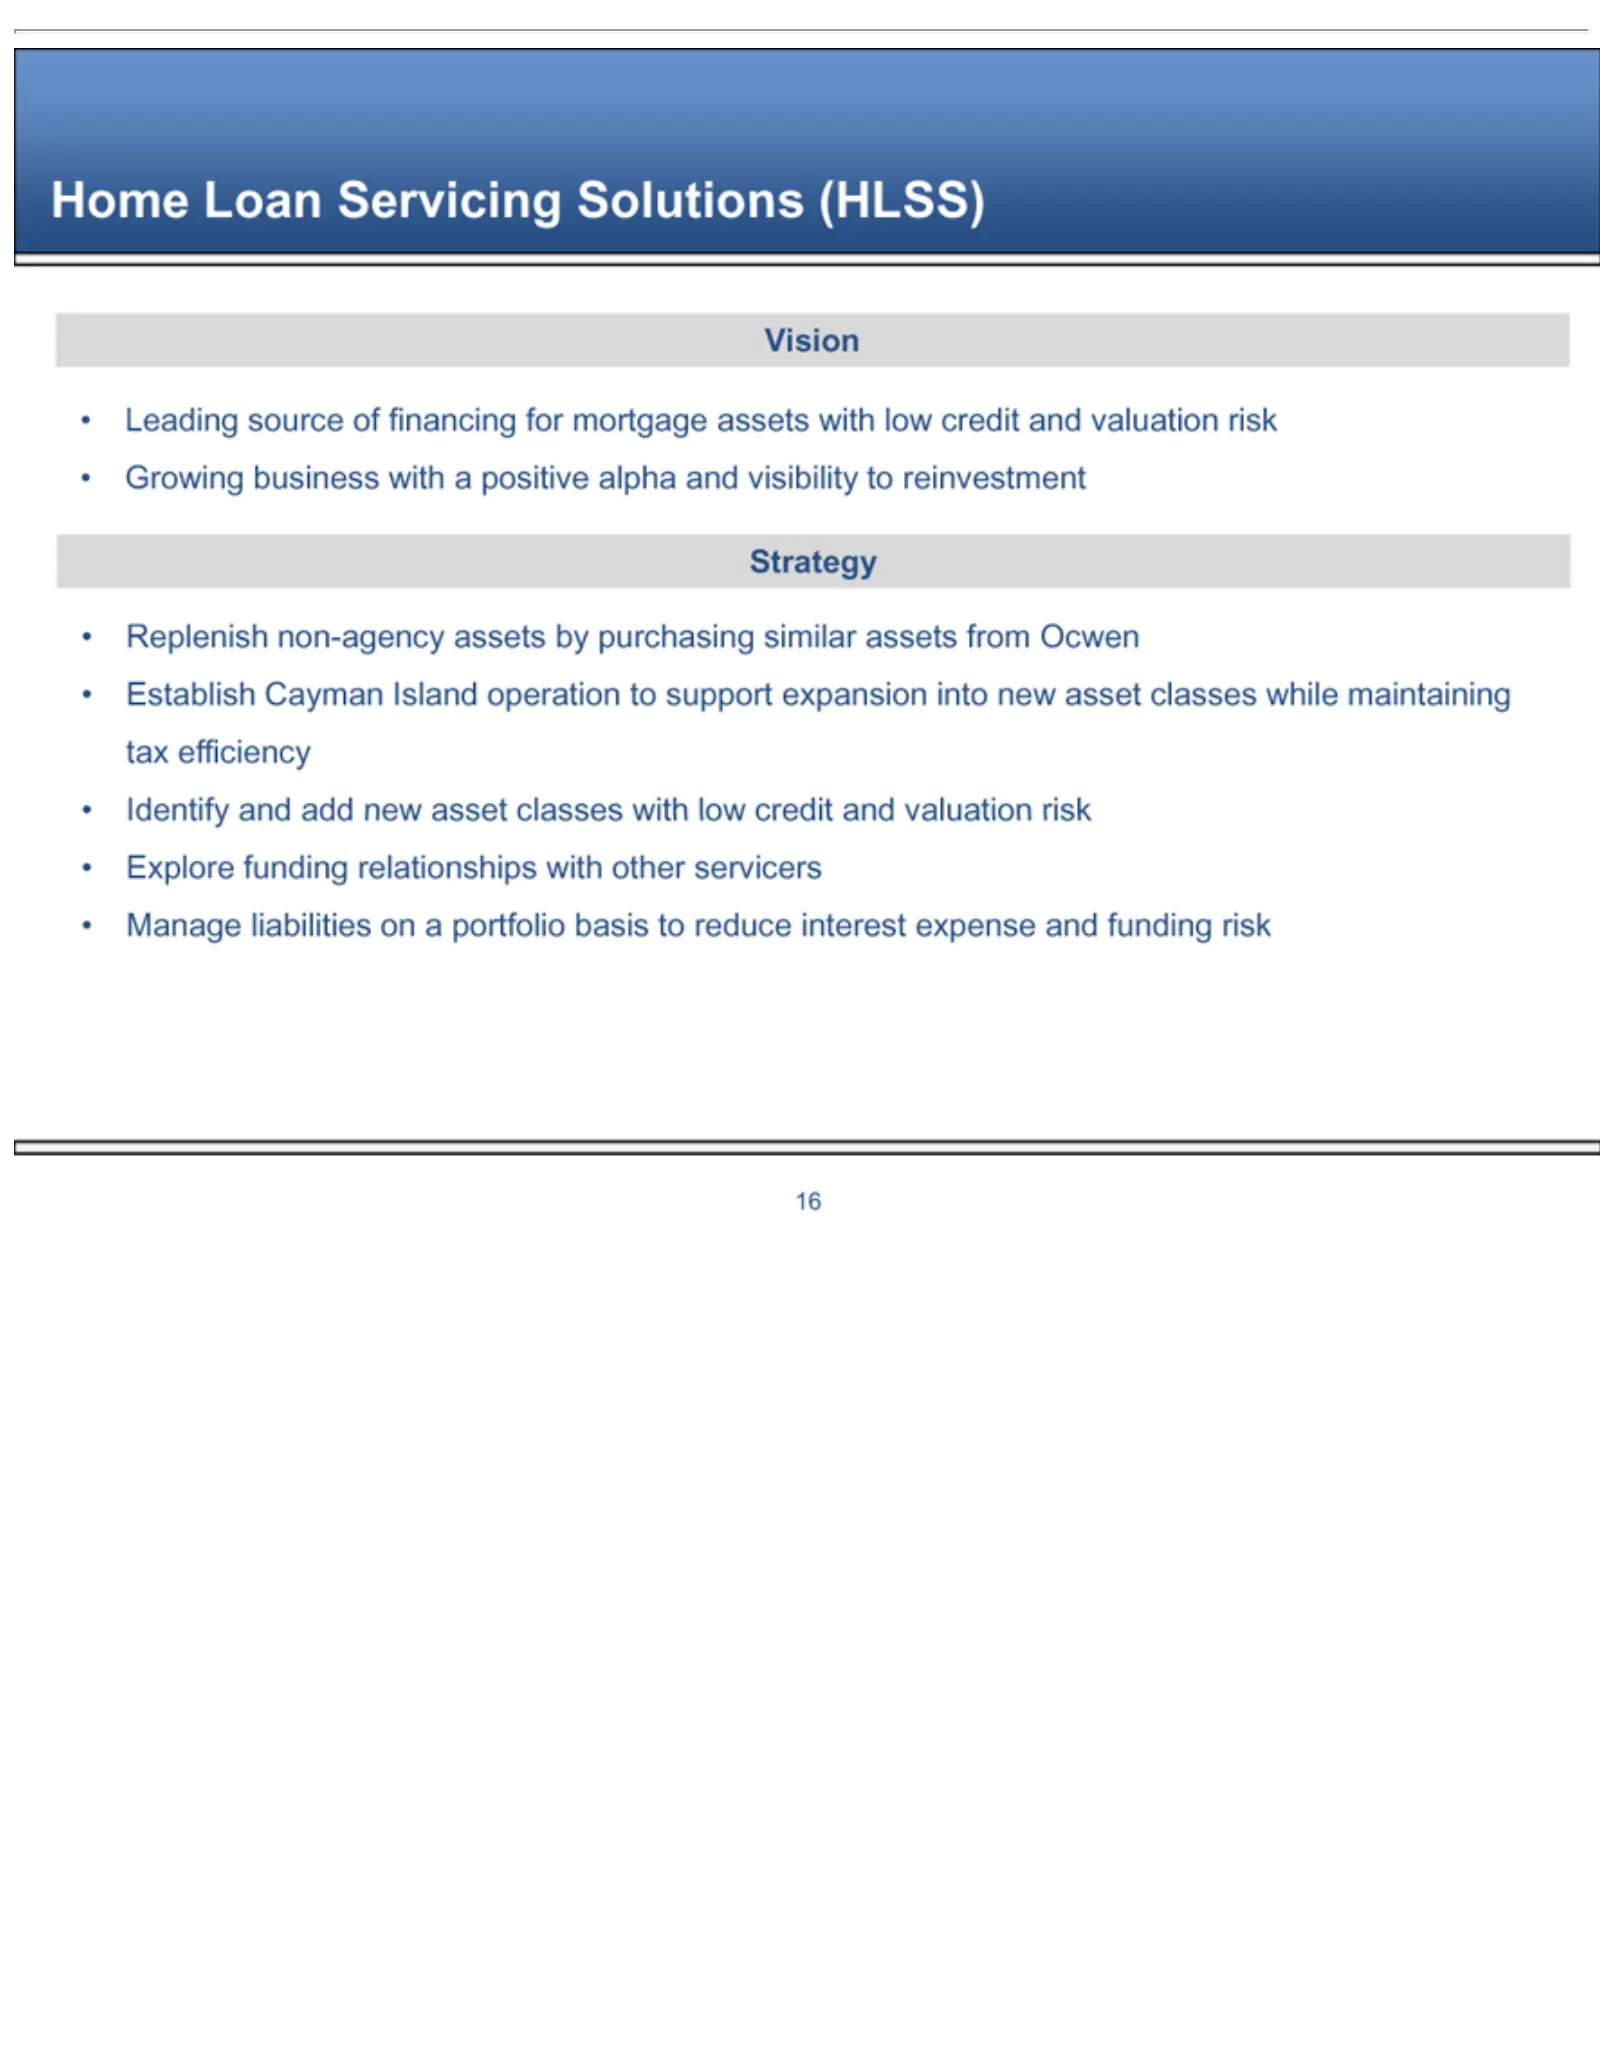
Slide 36: Home Loan Servicing Solutions Vision
Home Loan Leading Vision Growing Replenish Strategy Establish Identify Explore Manage 16 funding and liabilities source business Cayman non-agency Servicing addofrelationships new on with financing Island aasset Solutions assets portfolio a positive operation classes for by with mortgage purchasing
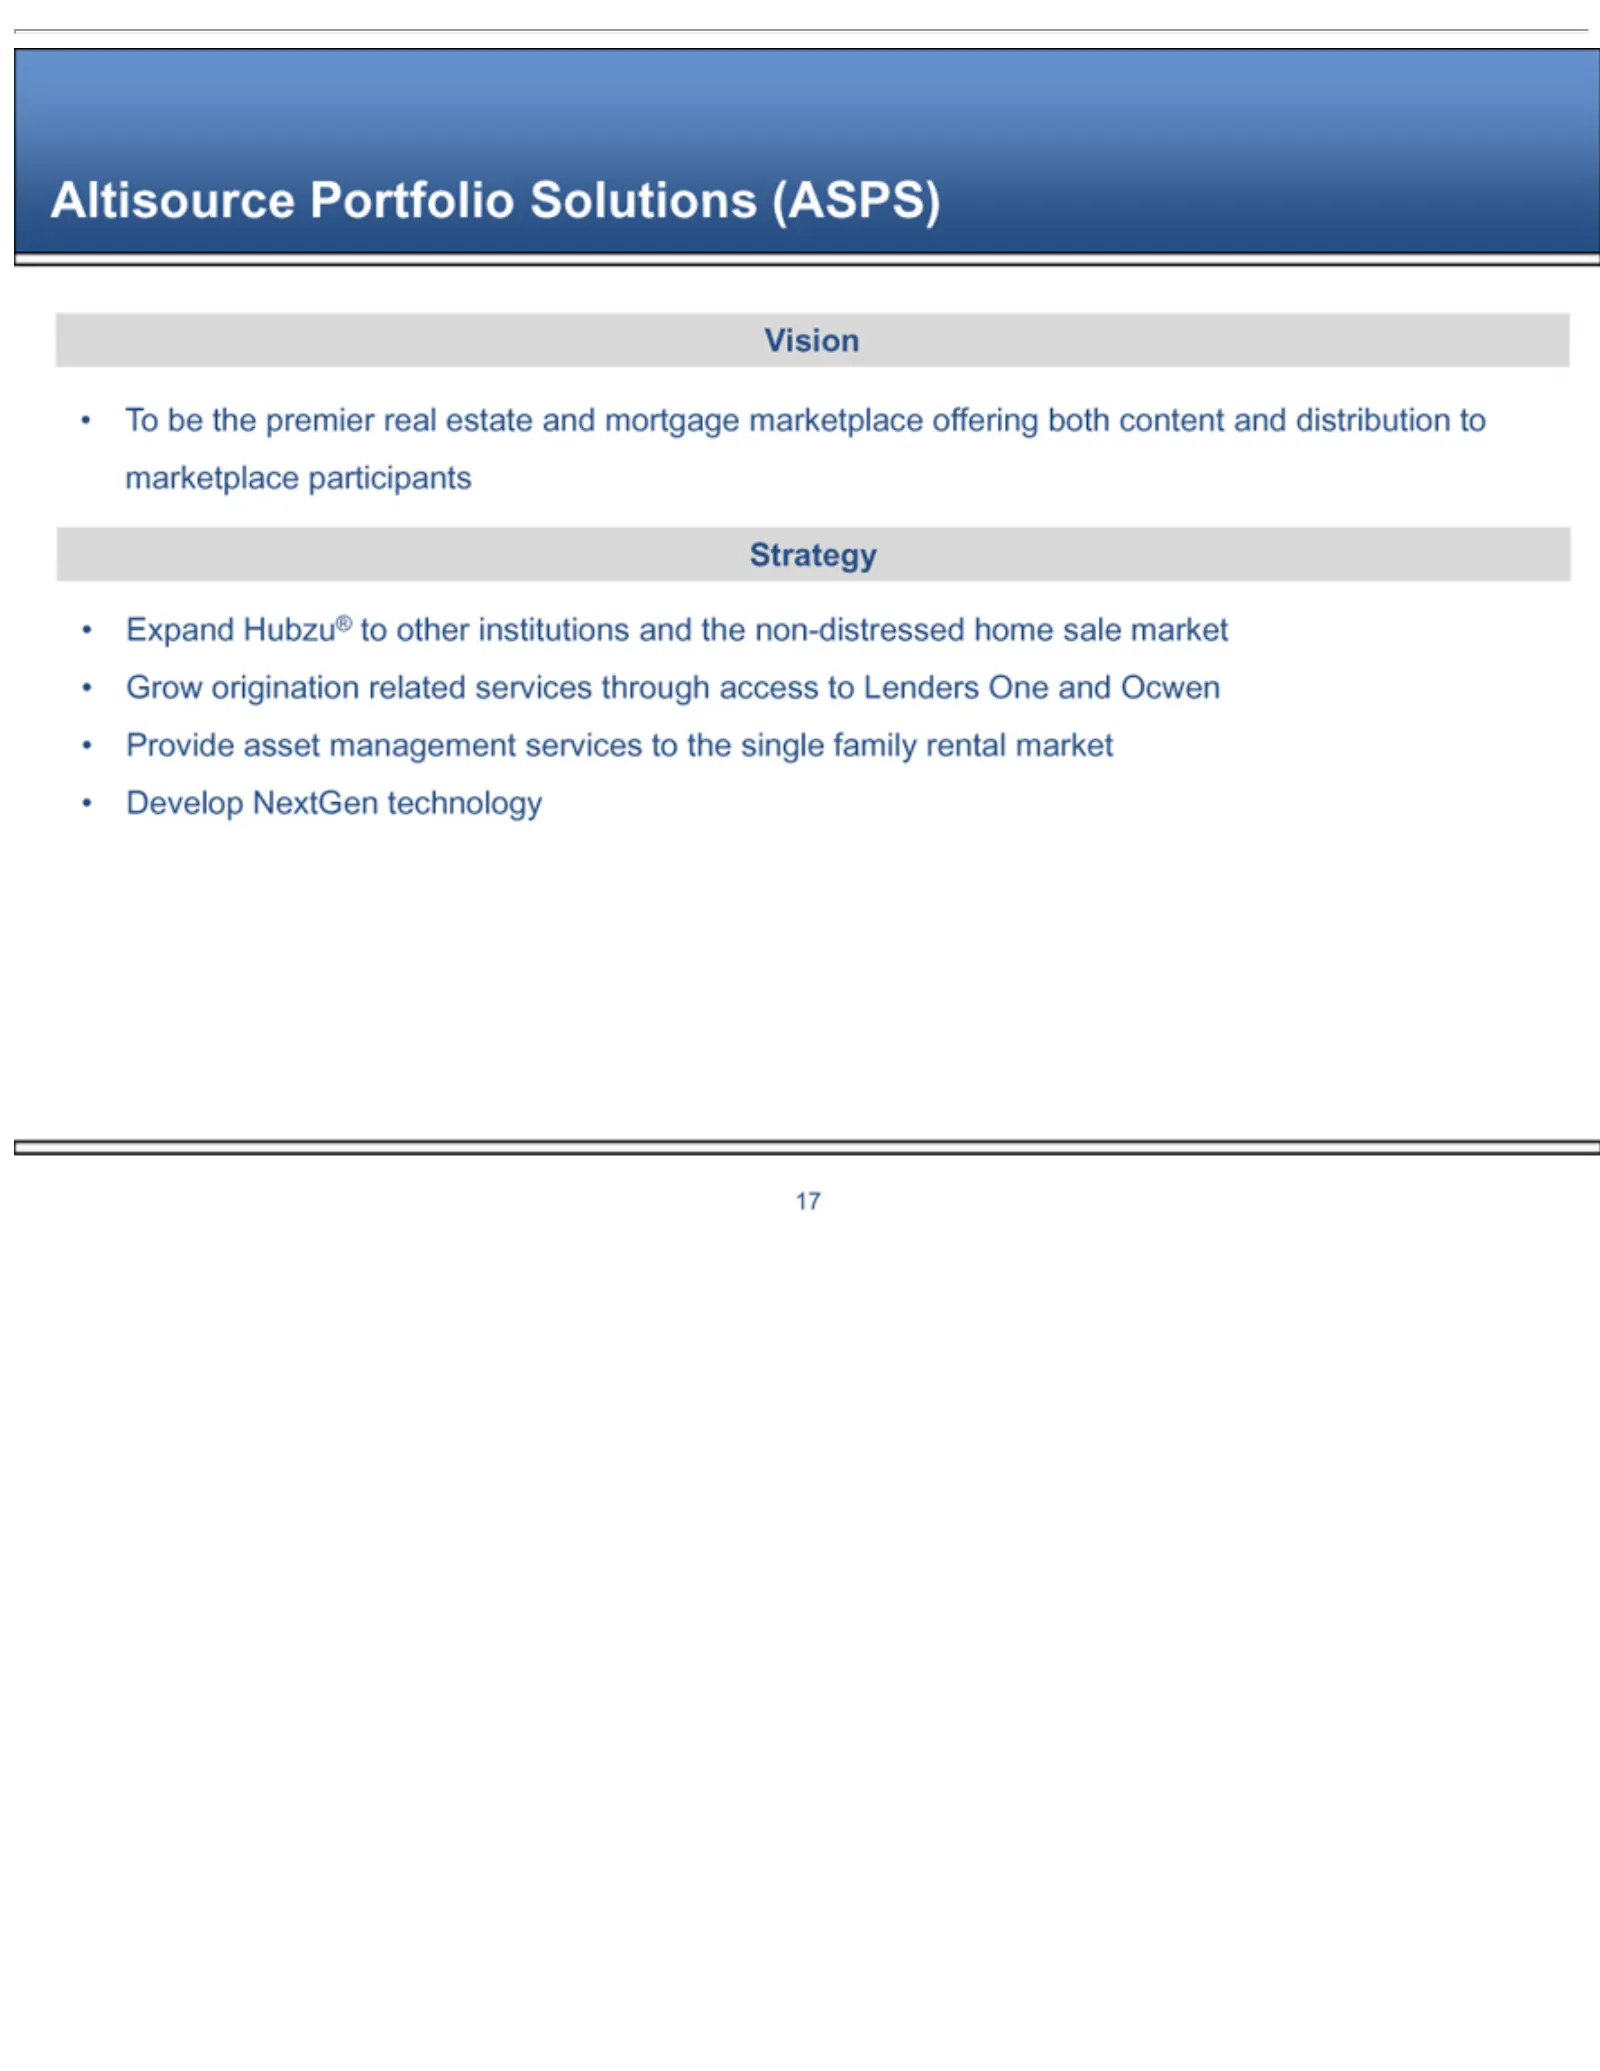
Slide 37: Altisource Portfolio Solutions Vision
Altisource To Vision Expand Strategy Grow Provide Develop 17 be the origination HubzuR asset NextGen premier Portfolio management to related real technology other Solutions estate services institutions services and (ASPS) mortgage through toand thethe single access marketplace non-distressed family
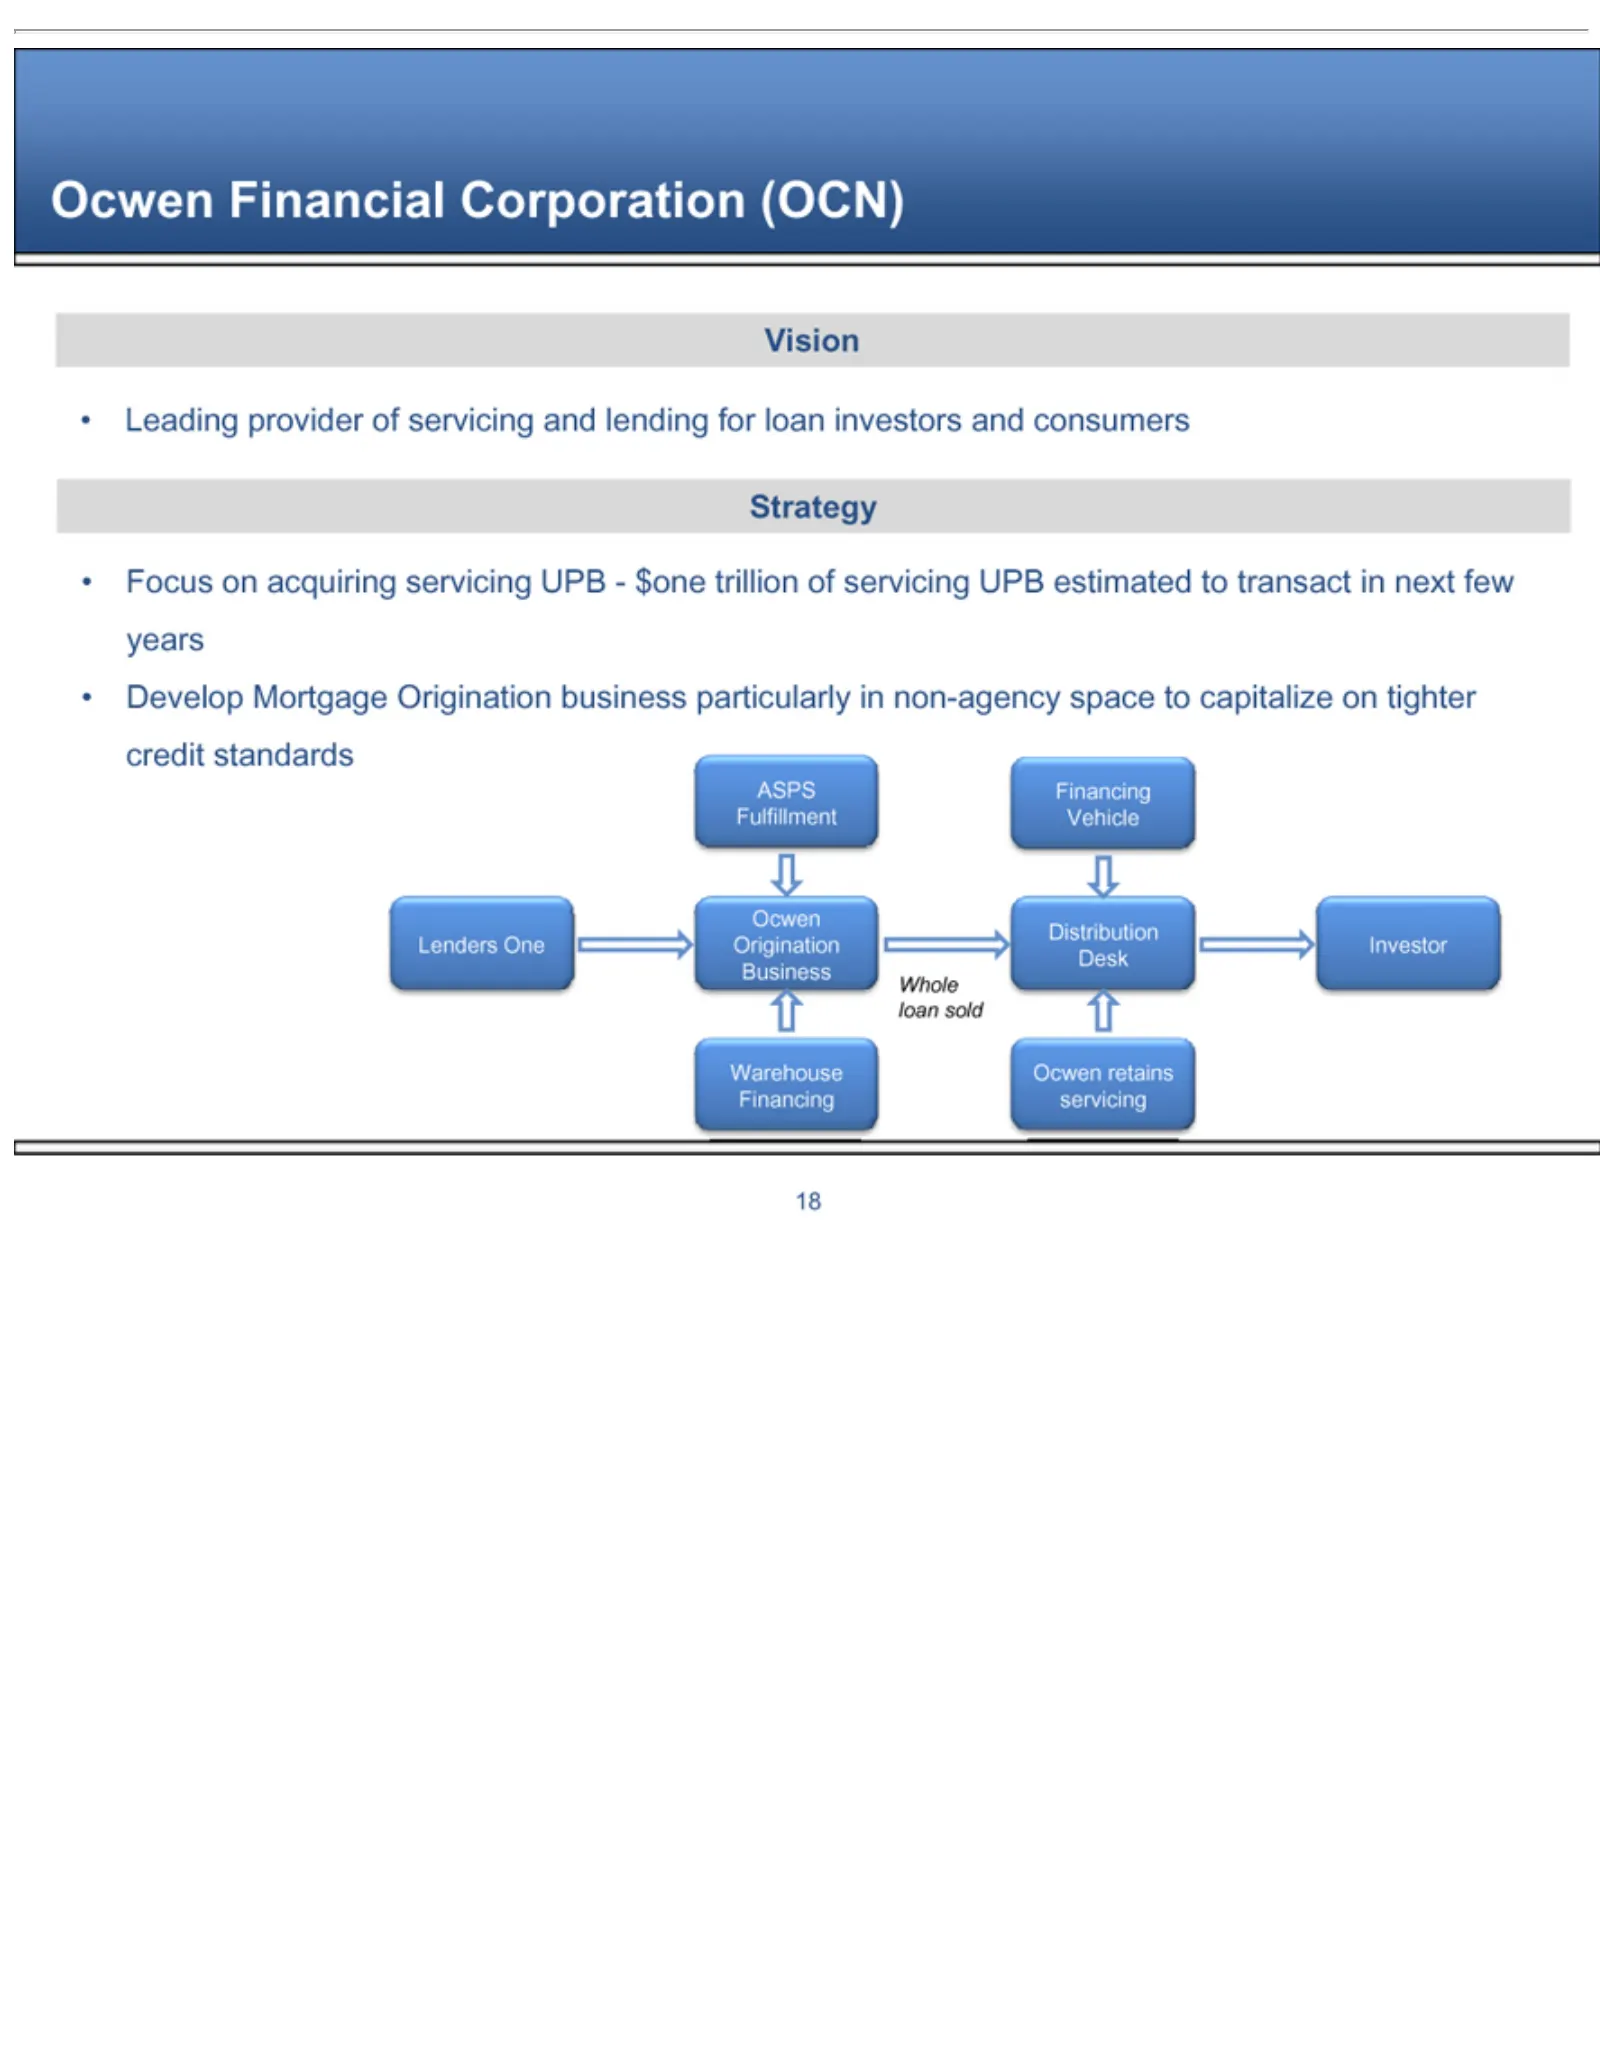
Slide 38: Ocwen Financial Corporation Vision
Leading Vision Focus Strategy Develop ASPS Financing Lenders Distribution Whole Investor Warehouse Ocwen 18 on Fulfillment loan Financial Origination retains One provider Mortgage acquiring Vehicle Financing sold Desk servicing Corporation ofOrigination servicing Business servicingUPB (OCN) and busi
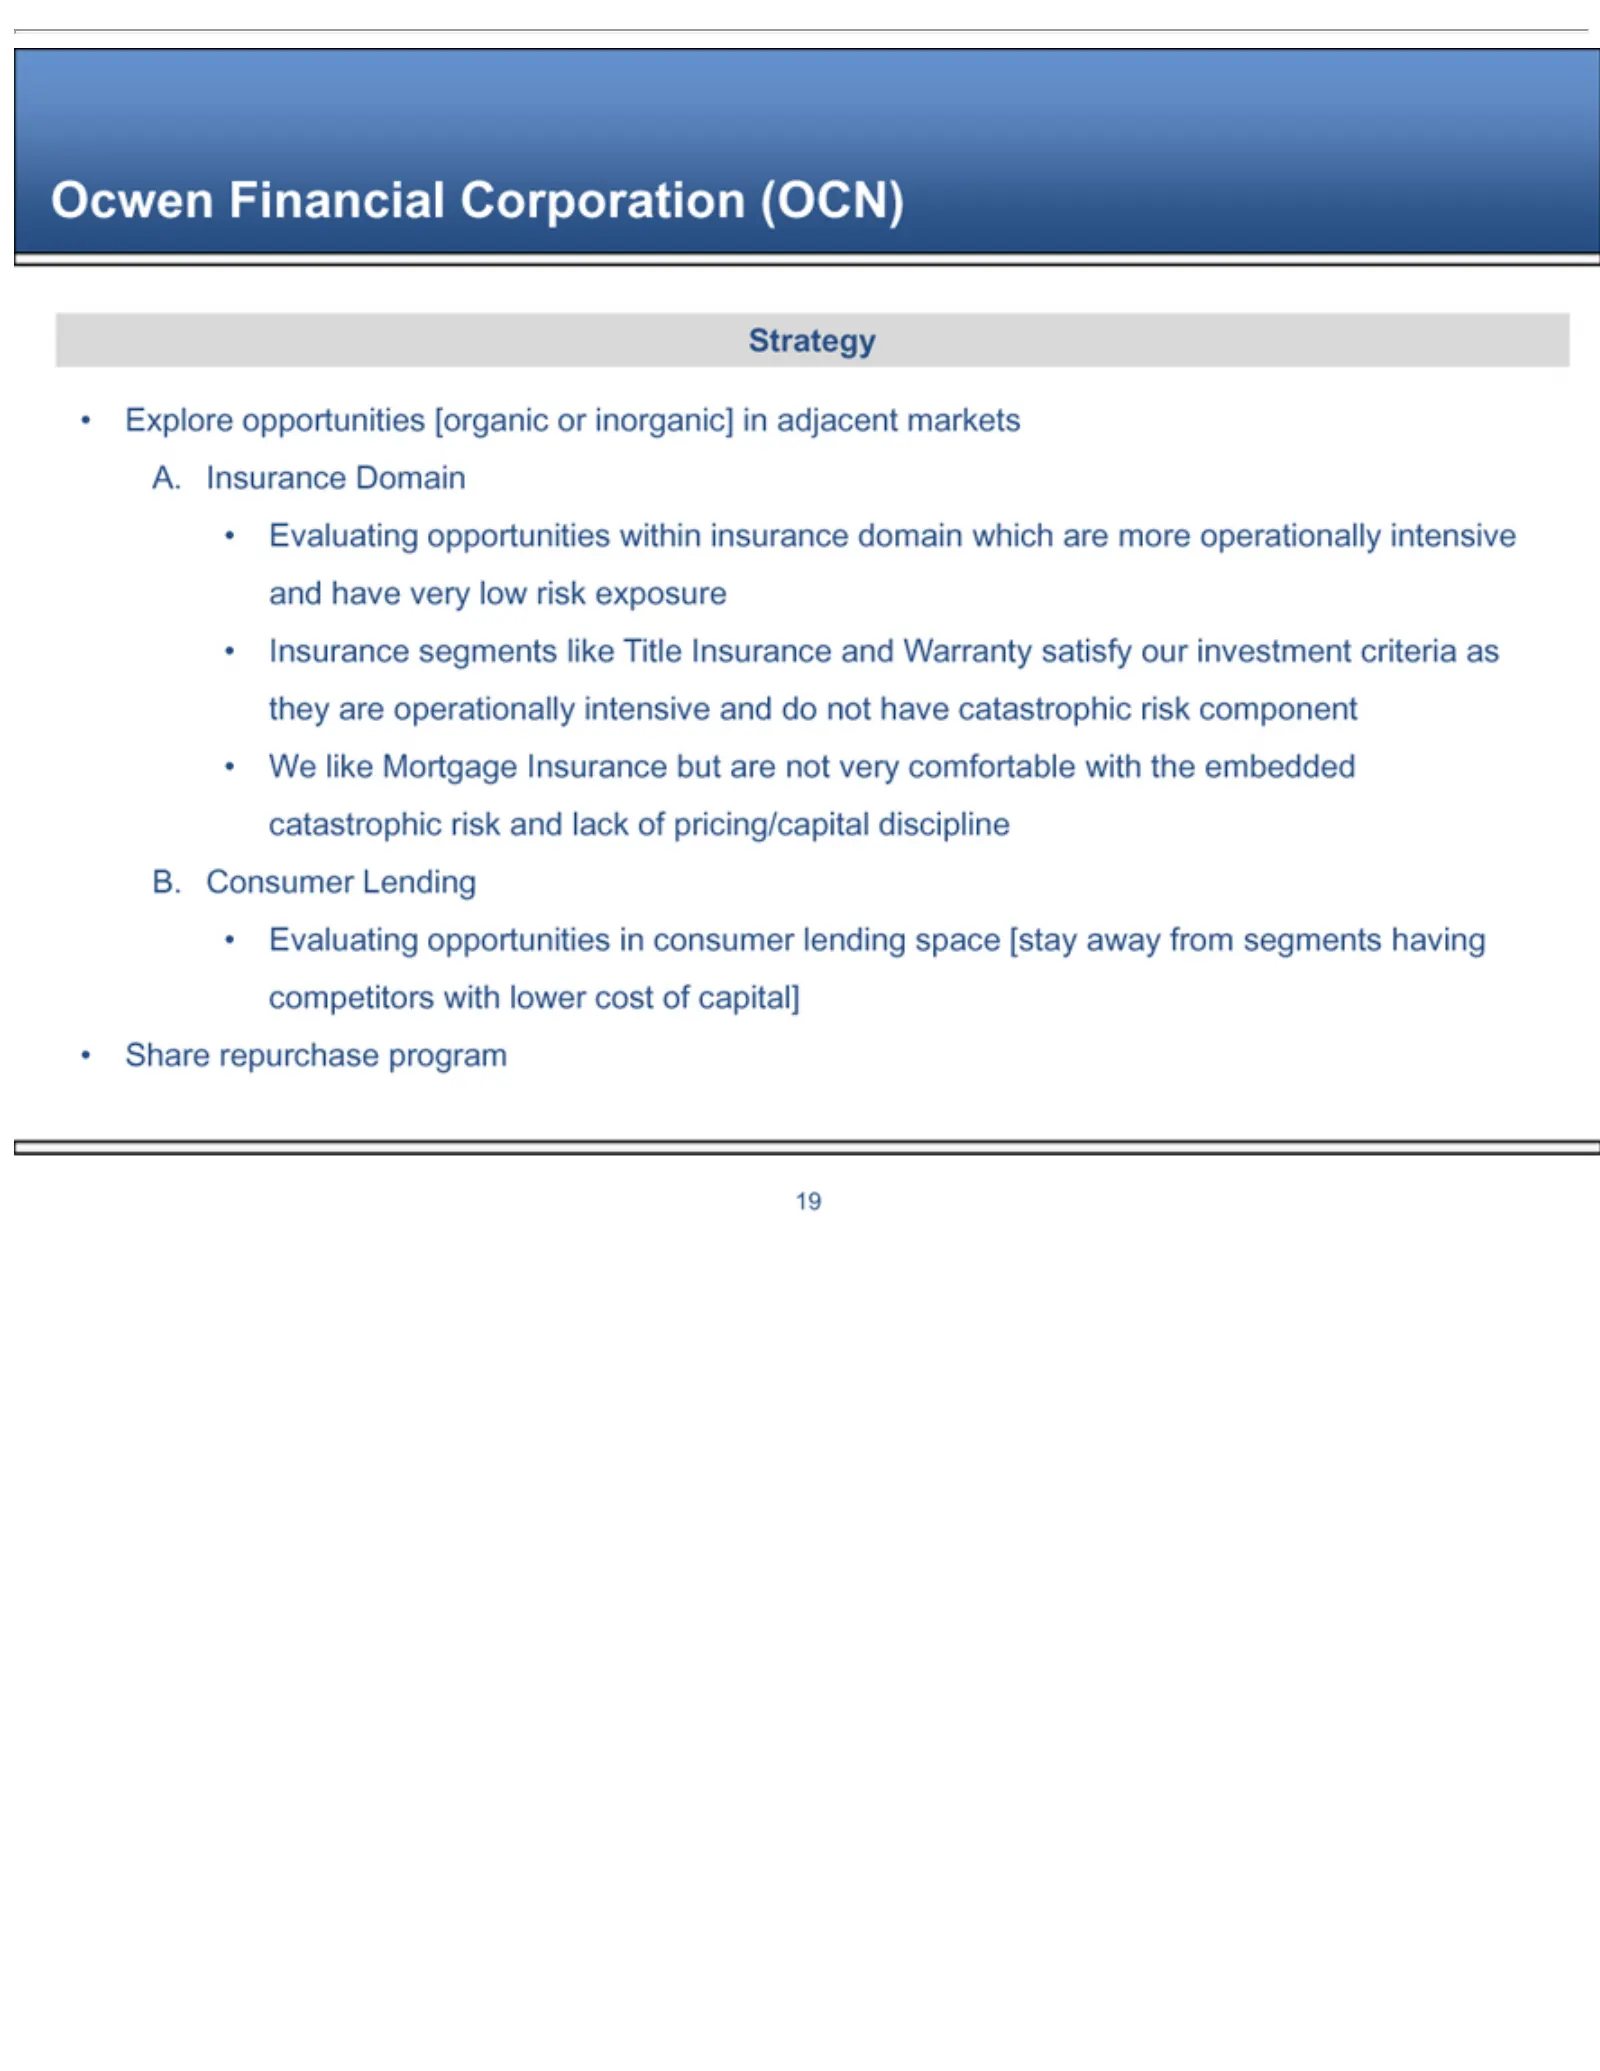
Slide 39: Ocwen Explore Strategy
Ocwen Explore Strategy Insurance We Evaluating Share 19 like repurchase Financial Mortgage opportunities segments opportunities Corporation program Insurance like [organic Title within in consumer but Insurance (OCN) orinsurance are inorganic] not lending and very domain Warranty in comfortable spac
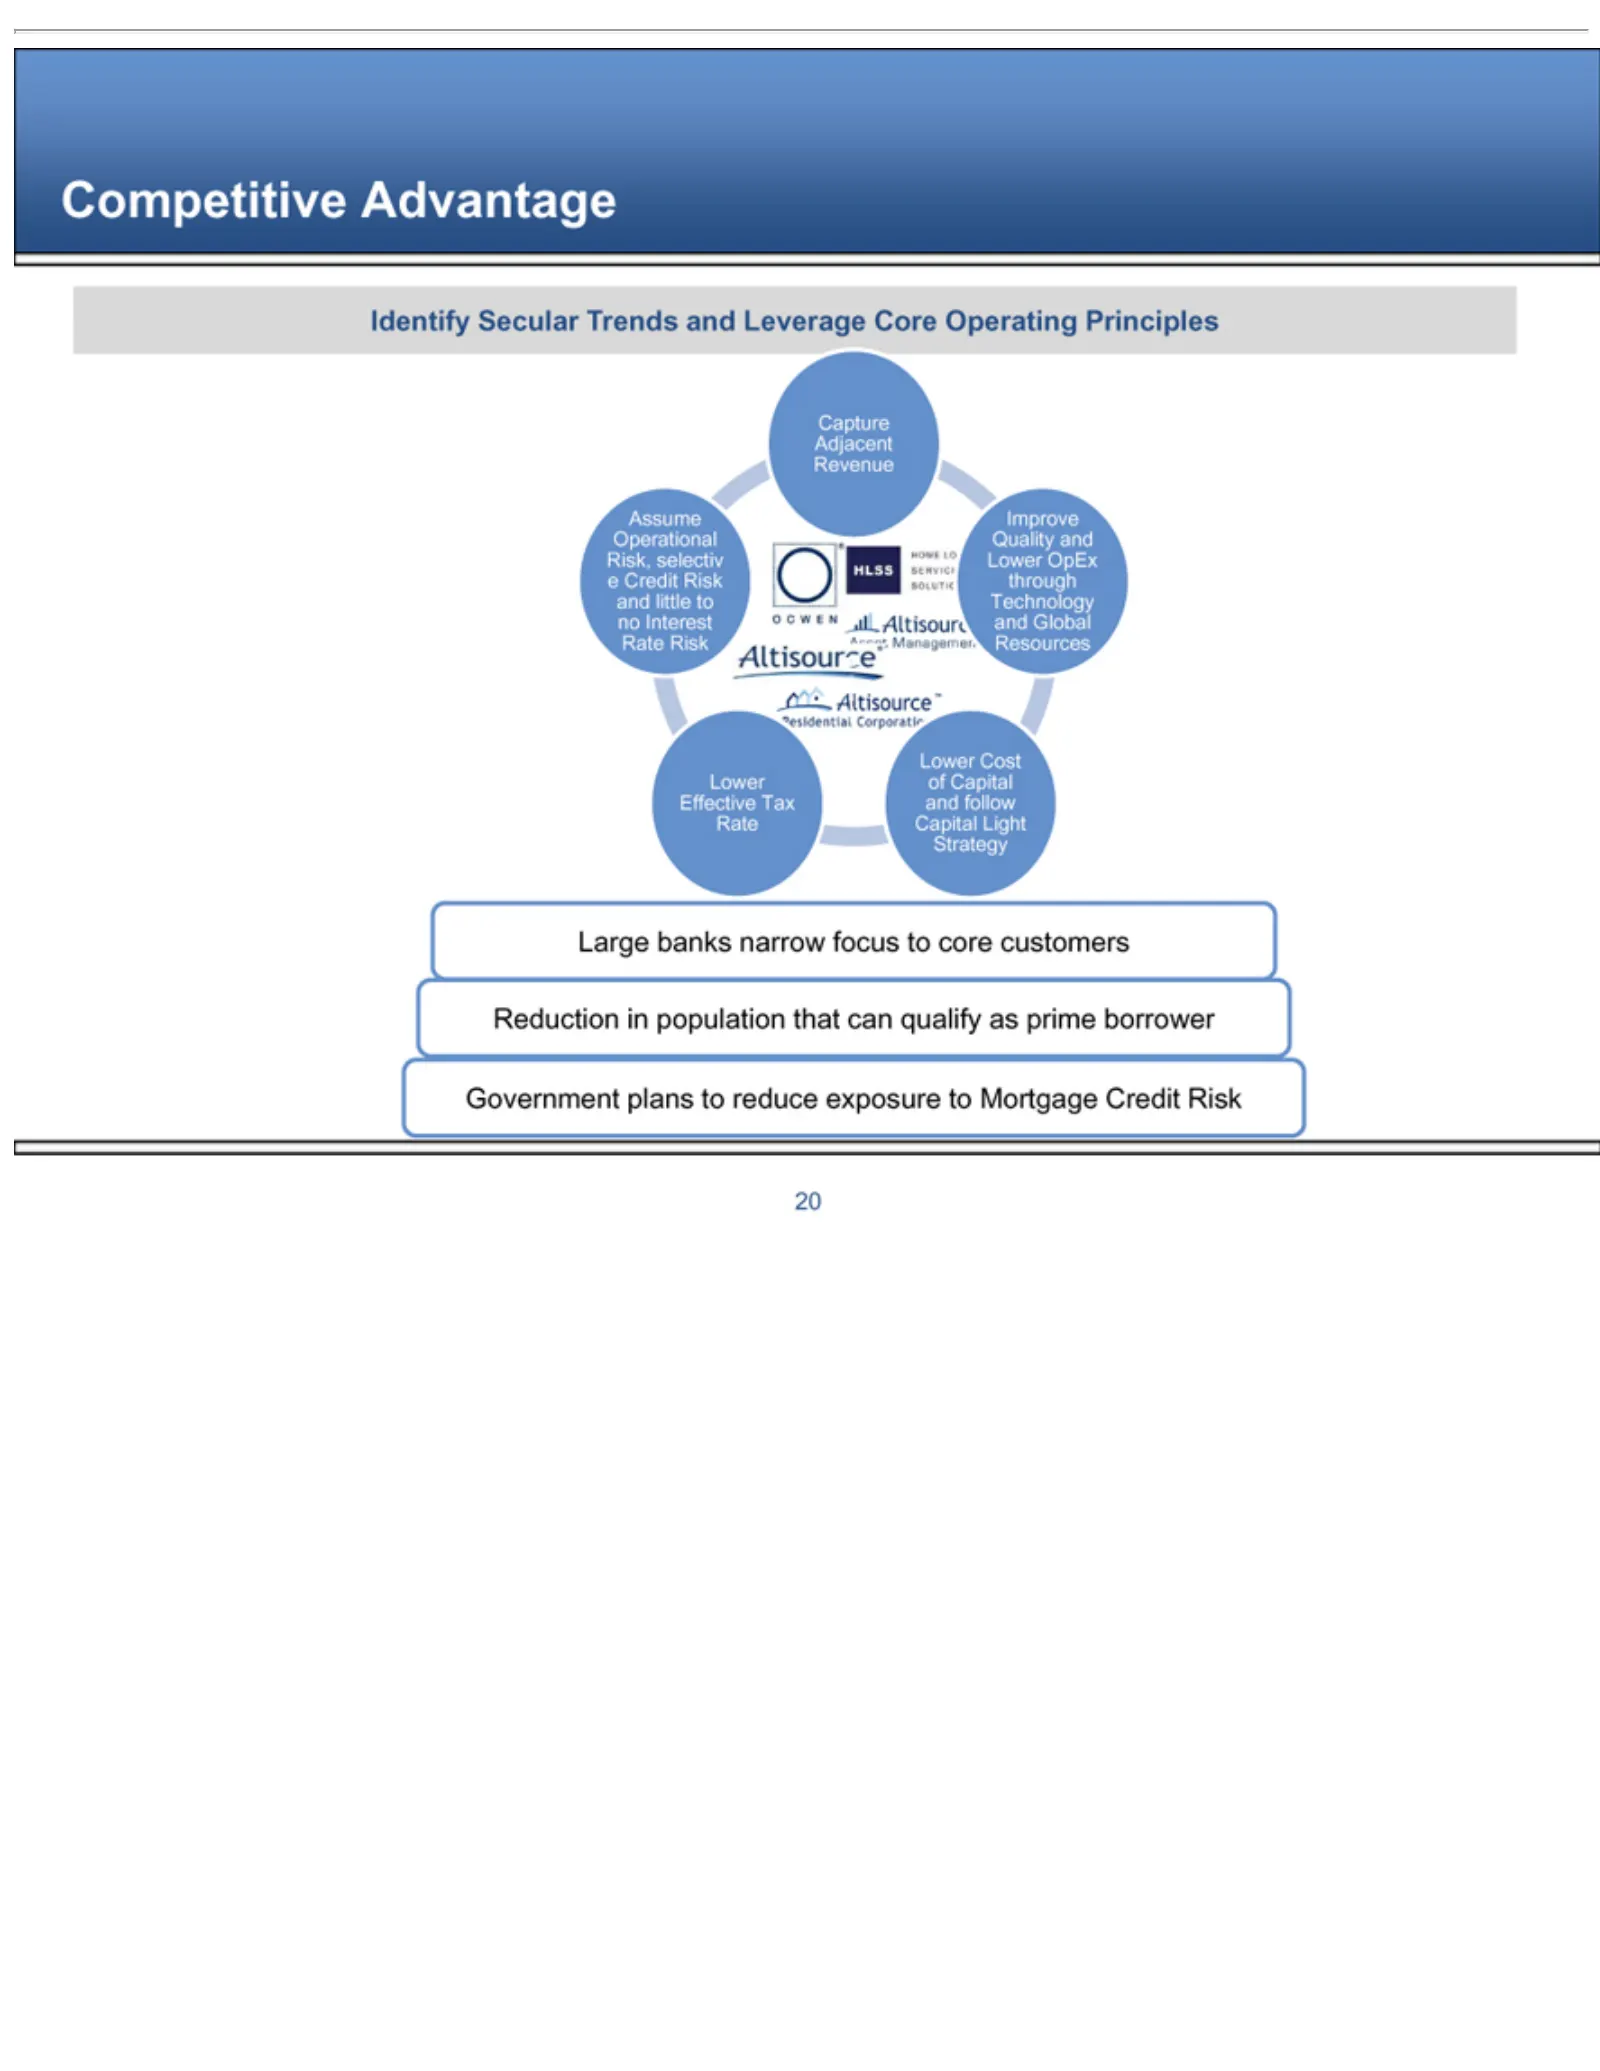
Slide 40: Summary of Strategic Allies' Principles
Competitive Identify Assume Capture Improve Lower OCWEN HOME HLSS Asset Residential AltisourceTM AltisourceR Large Reduction Government 20 Management banks Effective Cost LOANTM Adjacent Secular Operational Quality RinCorporation of Advantage narrow plans population Capital Trends Tax and Revenue to
Source: SEC EDGAR · 8-K filed Dec 3, 2013
More decks from Home Loan Servicing Solutions Ltd
 Merger or Acquisition (February 2015)6 slides · Feb 23, 2015
 Q3 2014 Earnings Presentation15 slides · Oct 21, 2014
 Debt Investor Presentation (September 2014)40 slides · Sep 22, 2014
 Investor Presentation (September 2014)14 slides · Sep 8, 2014
 Investor Presentation (May 2014)17 slides · May 20, 2014
 Debt Investor Presentation (January 2014)45 slides · Jan 23, 2014