Valassis Communications — Deutsche Bank Leveraged Finance Conference 2009
19 slides from Valassis Communications's conference presentation, Oct 2, 2009

Slide 1: Delivering Value to Consumers – how, when and where they want
Exhibit 99.1 Delivering Value to Consumers – how, when and where they want Deutsche Bank Leveraged Finance Conference October 1, 2009 ®
Slide 2: Safe Harbor
Safe Harbor Certain statements found in this document constitute “forward-looking statements” within the meaning of the Private Securities Litigation Reform Act of 1995. Such forward-looking statements involve known and unknown risks and uncertainties and other factors which may cause our actual res
Slide 3: Delivering value to consumers… how, when and where they want
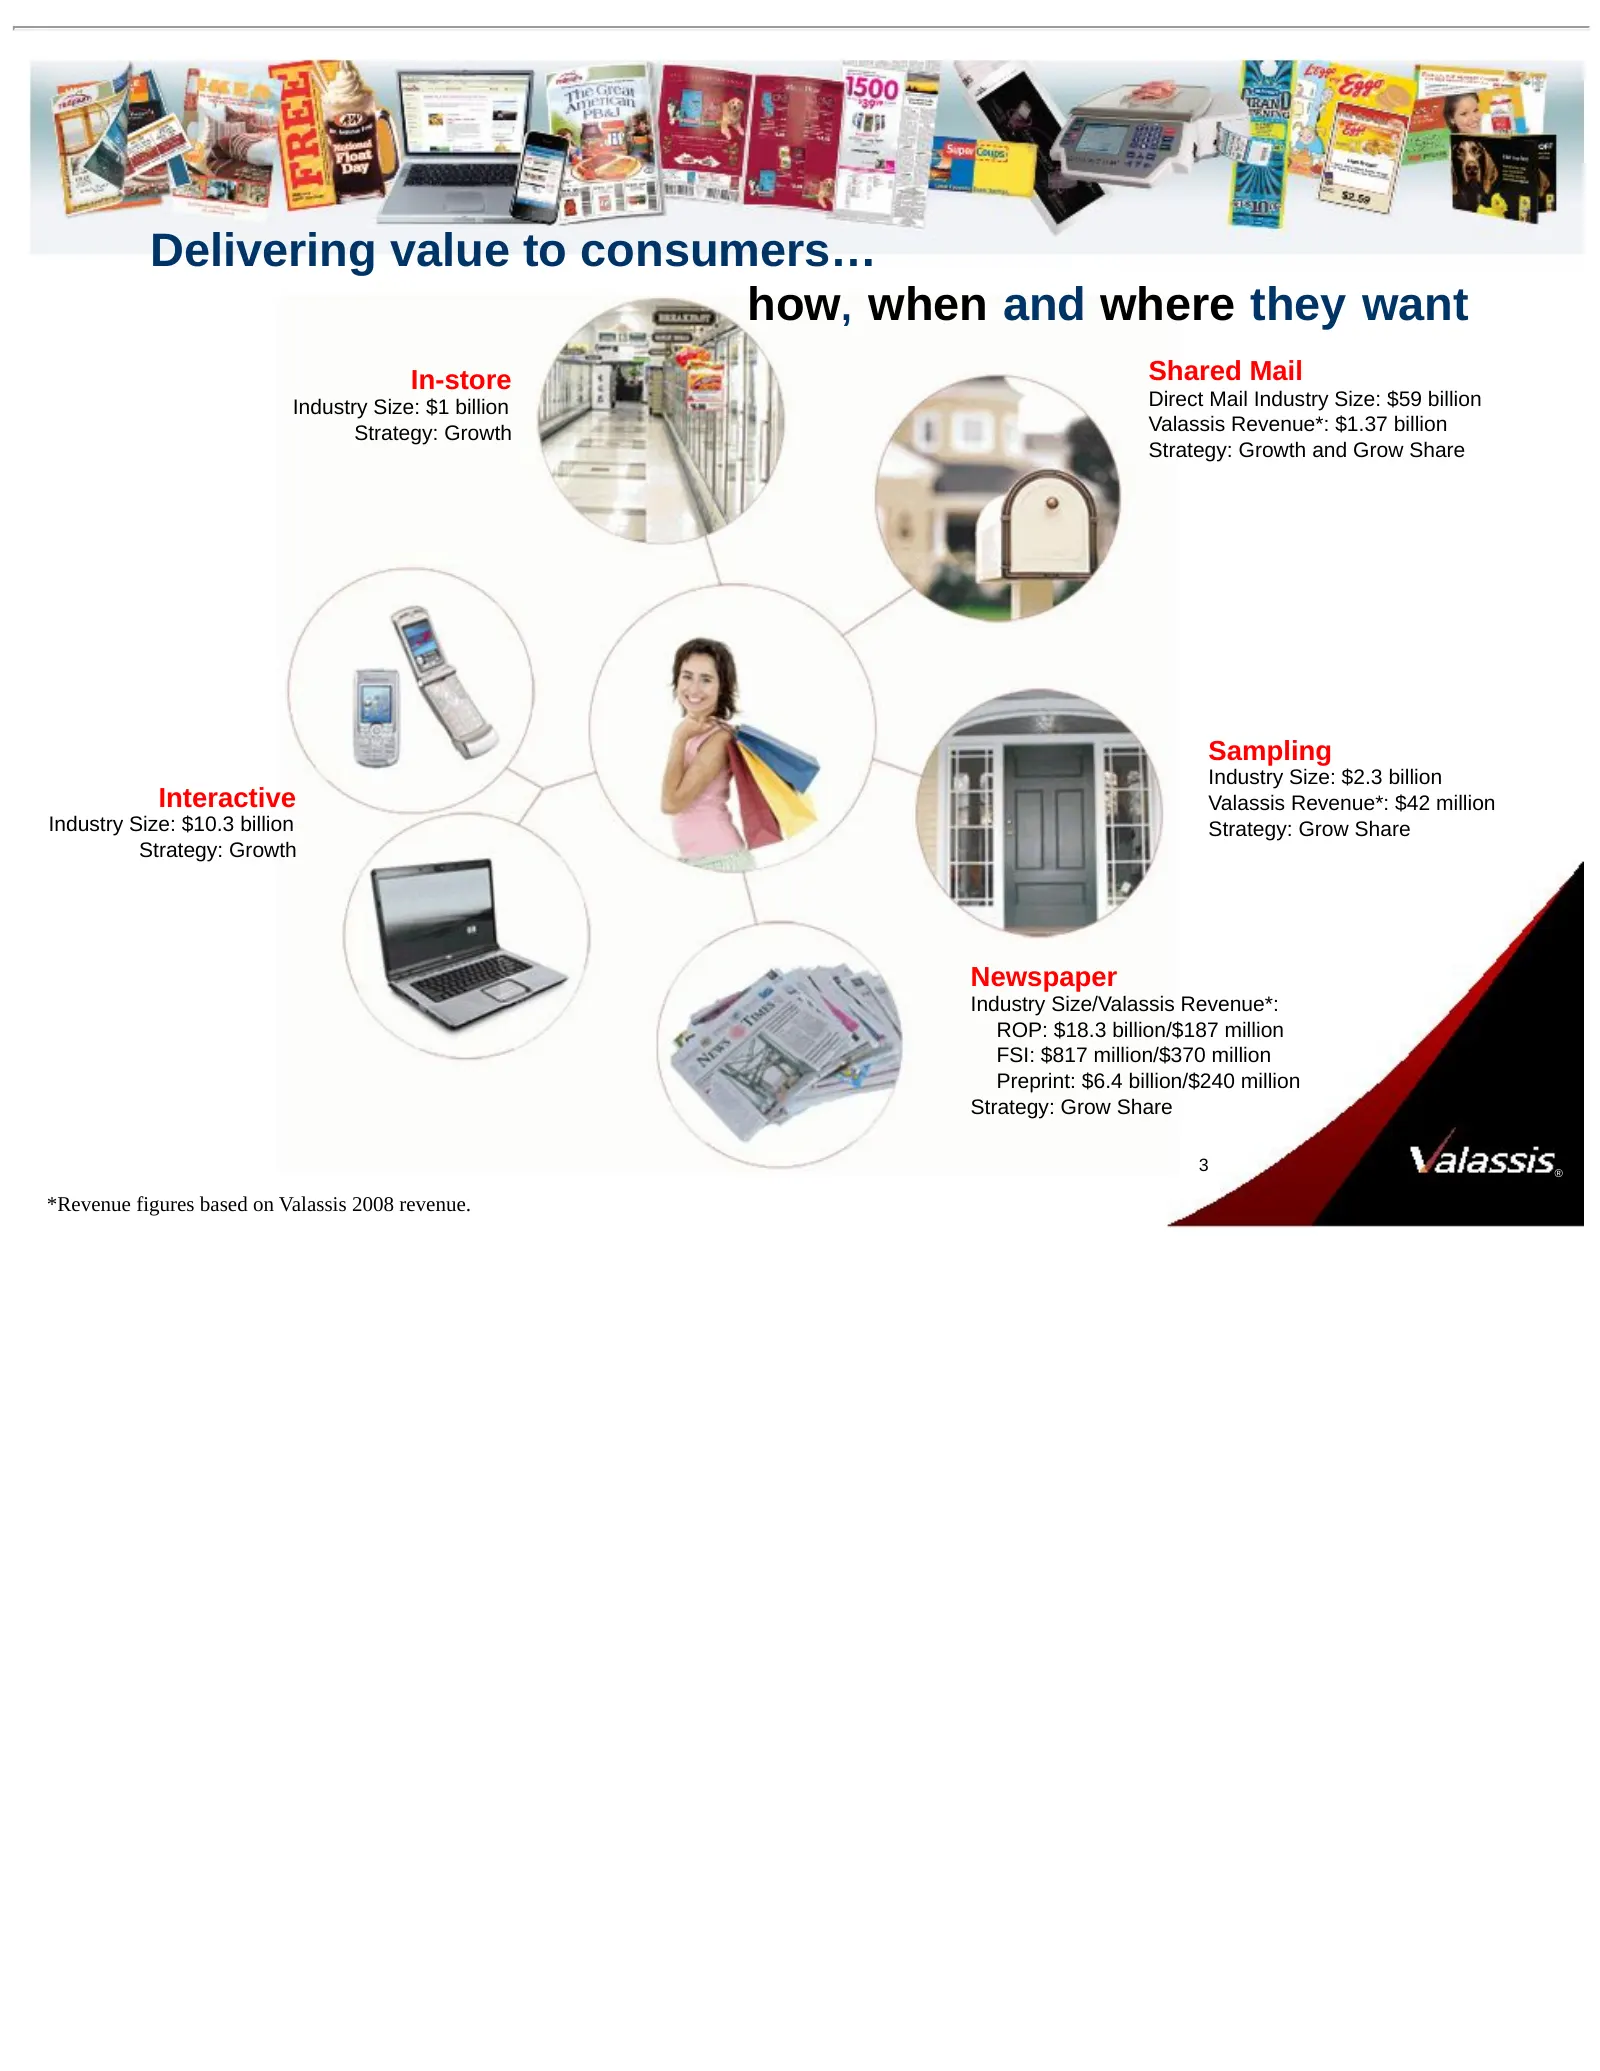
Delivering value to consumers… how, when and where they want In-store Shared Mail Industry Size: $1 billion Direct Mail Industry Size: $59 billion Strategy: Growth Valassis Revenue*: $1.37 billion Strategy: Growth and Grow Share Sampling Industry Size: $2.3 billion Interactive Valassis Revenue*: $42
Slide 4: 2008 Revenue and YTD Revenue
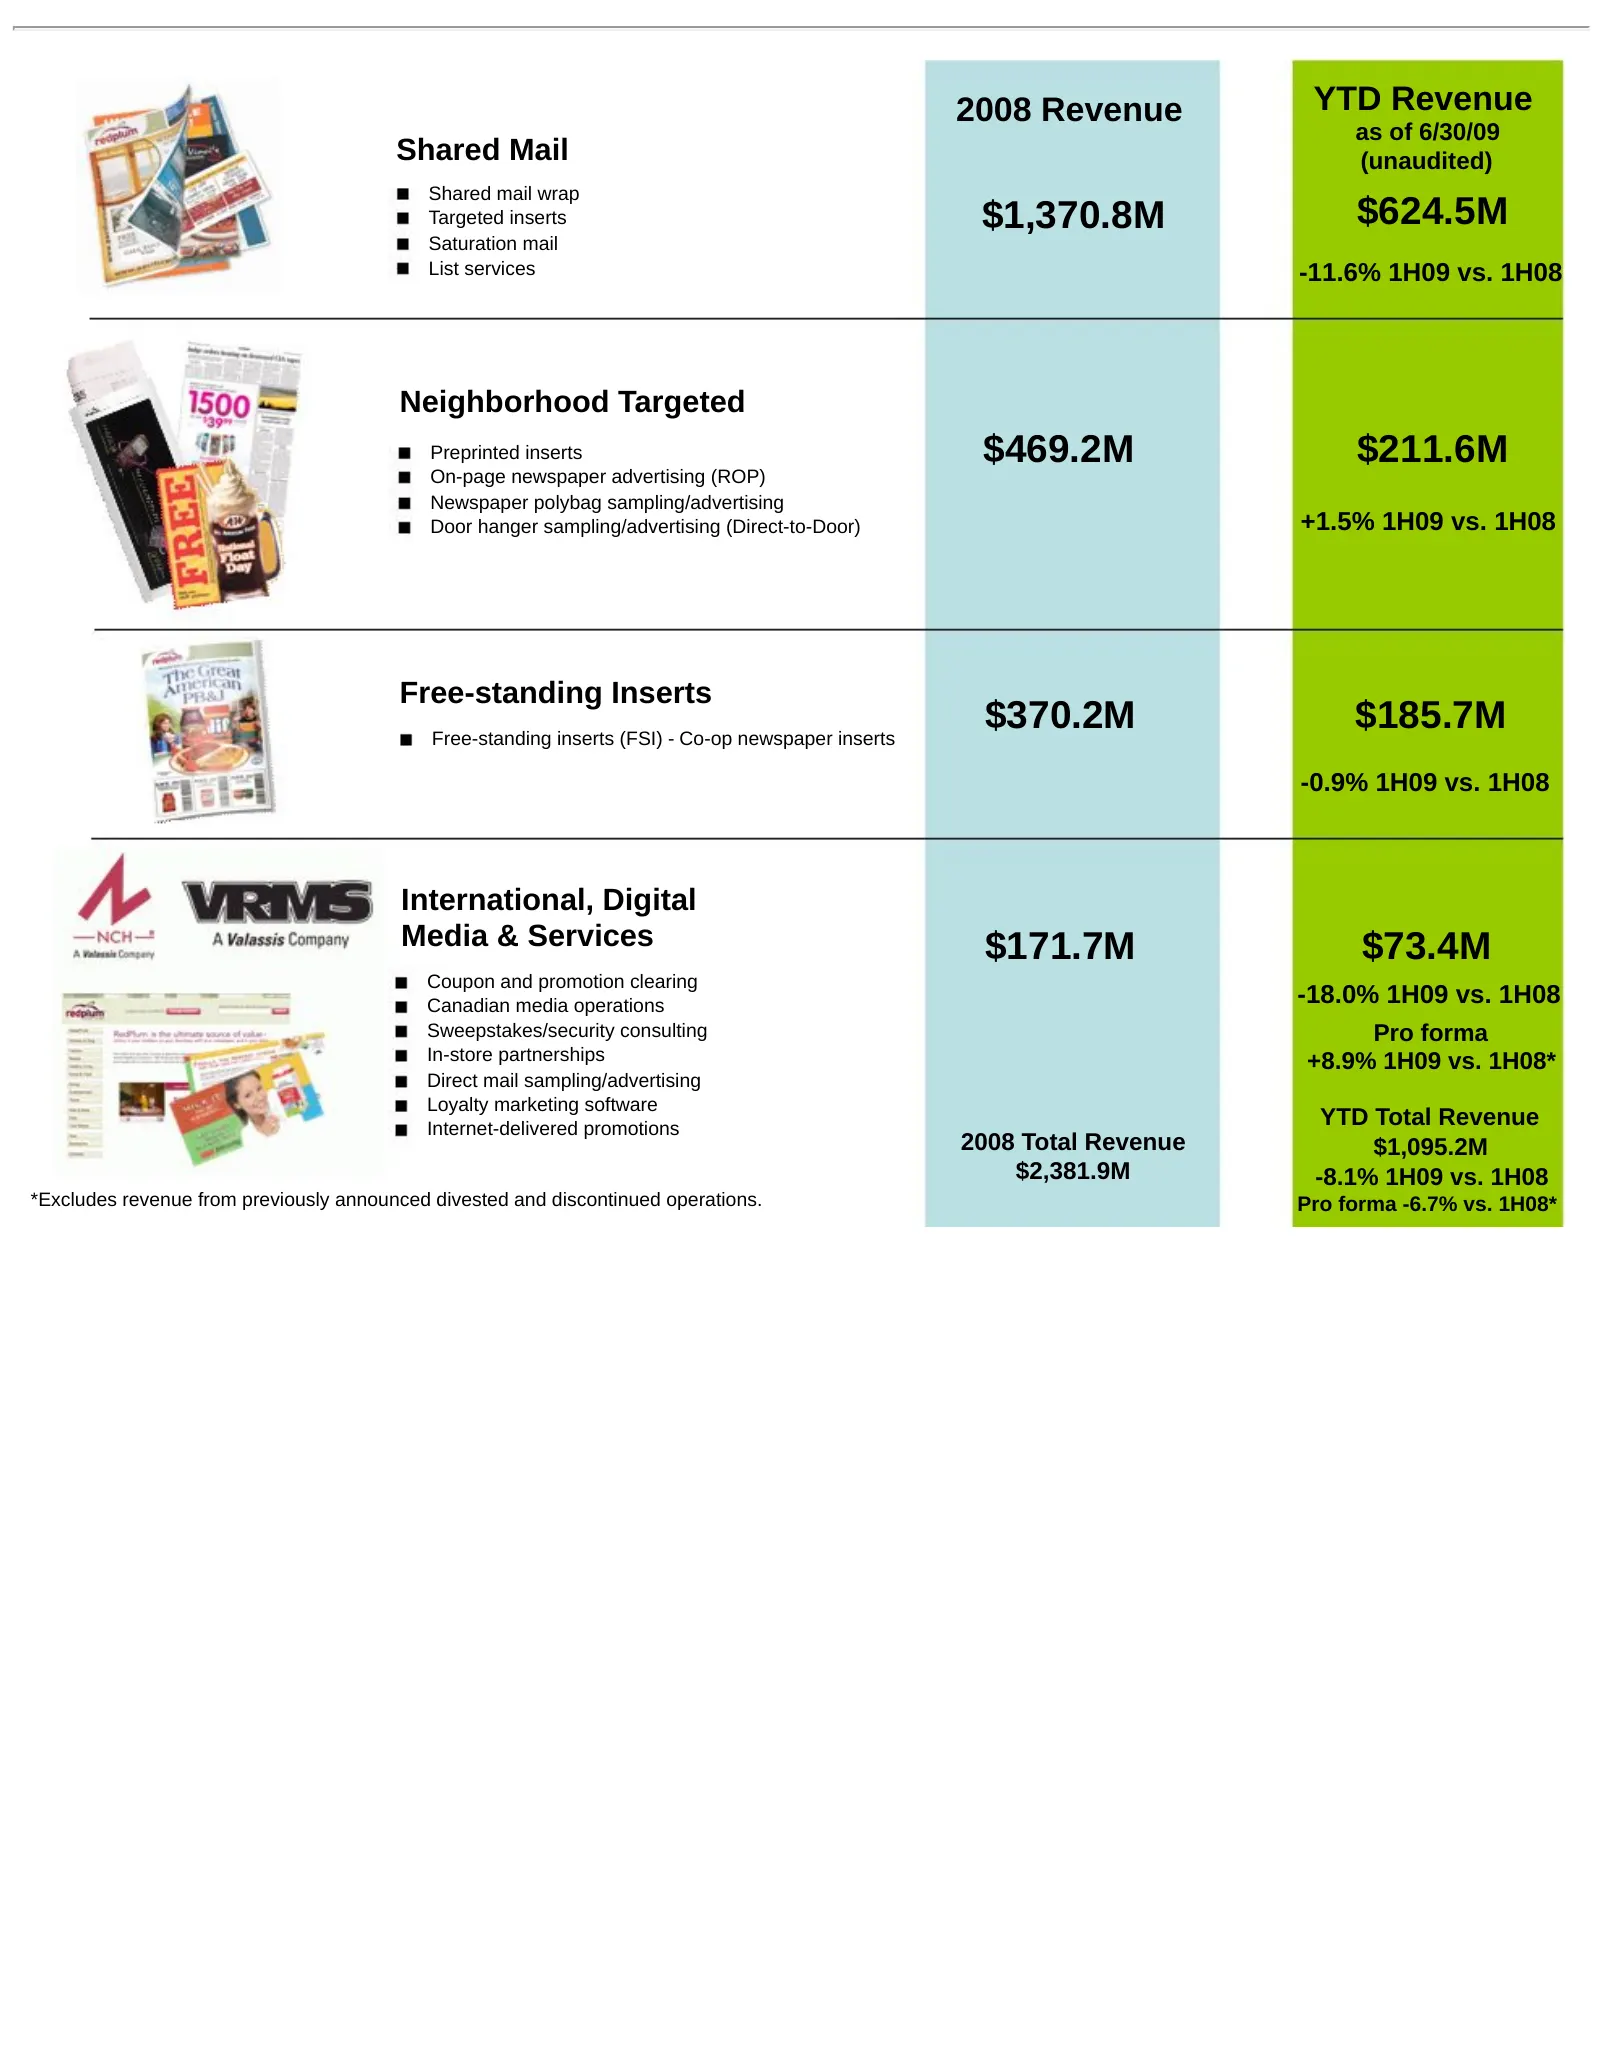
2008 Revenue YTD Revenue as of 6/30/09 Shared Mail (unaudited) Shared mail wrap Targeted inserts $1,370.8M $624.5M Saturation mail List services -11.6% 1H09 vs. 1H08 Neighborhood Targeted Preprinted inserts $469.2M $211.6M On-page newspaper advertising (ROP) Newspaper polybag sampling/advertising Do
Slide 5: Diversification - 2008
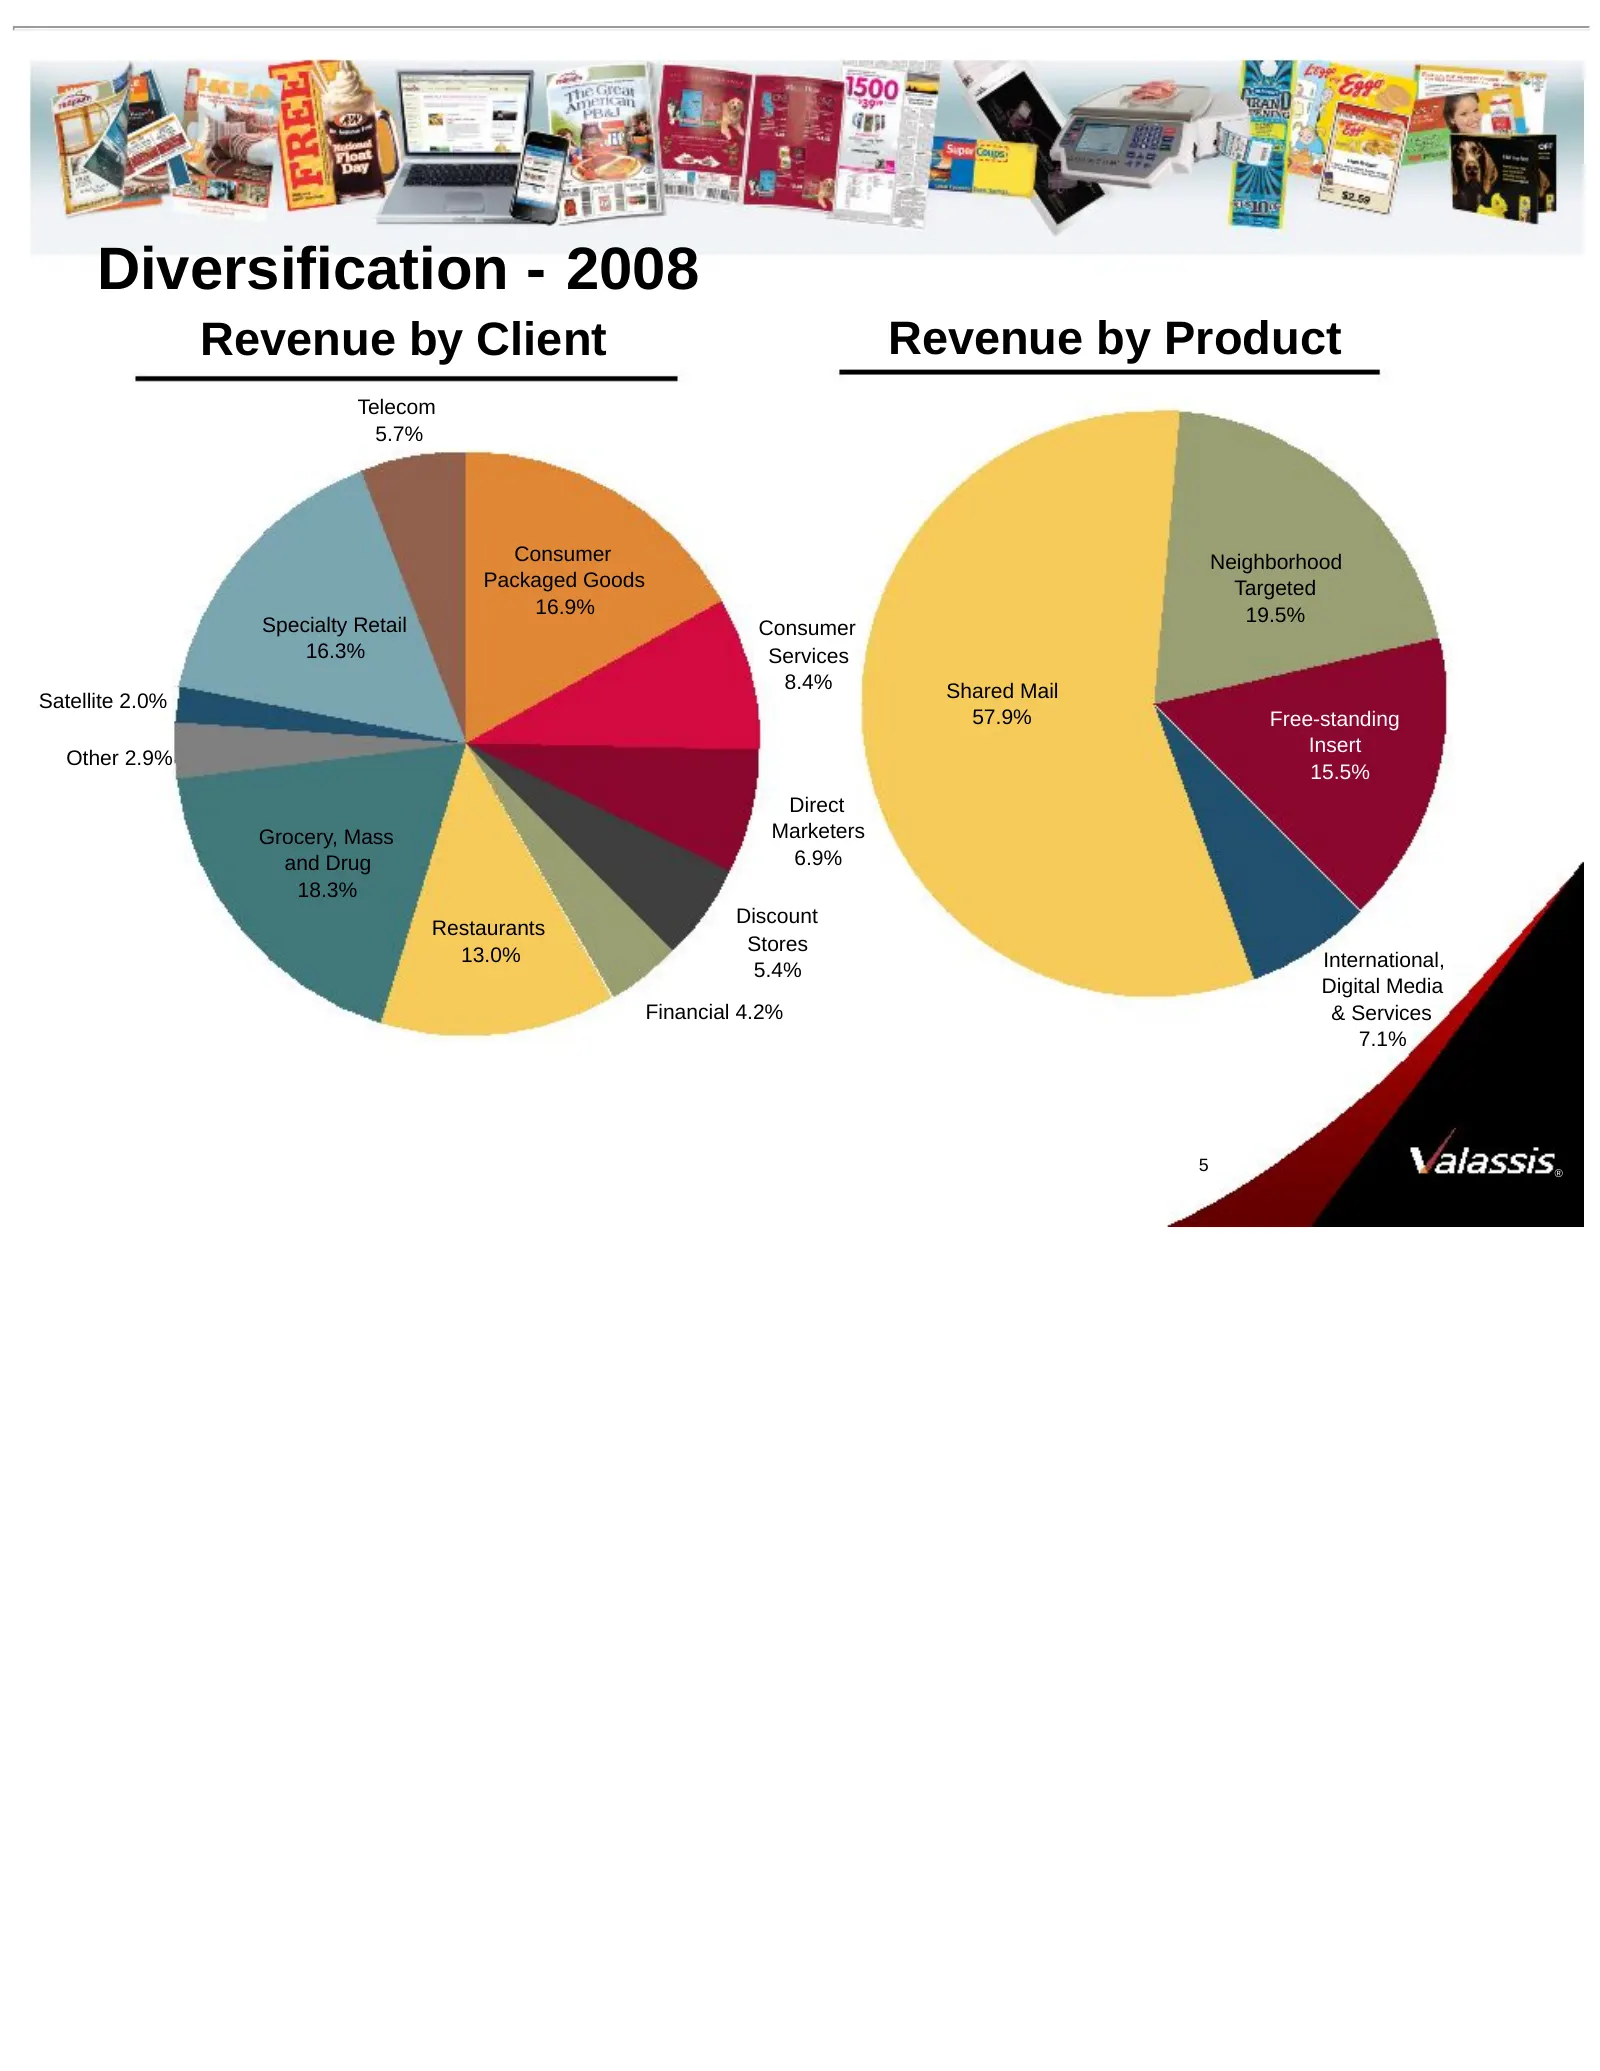
Diversification - 2008 Revenue by Client Revenue by Product Telecom 5.7% Consumer Neighborhood Packaged Goods Targeted 16.9% 19.5% Specialty Retail Consumer 16.3% Services 8.4% Shared Mail Satellite 2.0% 57.9% Free-standing Insert Other 2.9% 15.5% Direct Grocery, Mass Marketers and Drug 6.9% 18.3% D
Slide 6: 2009 Strategy
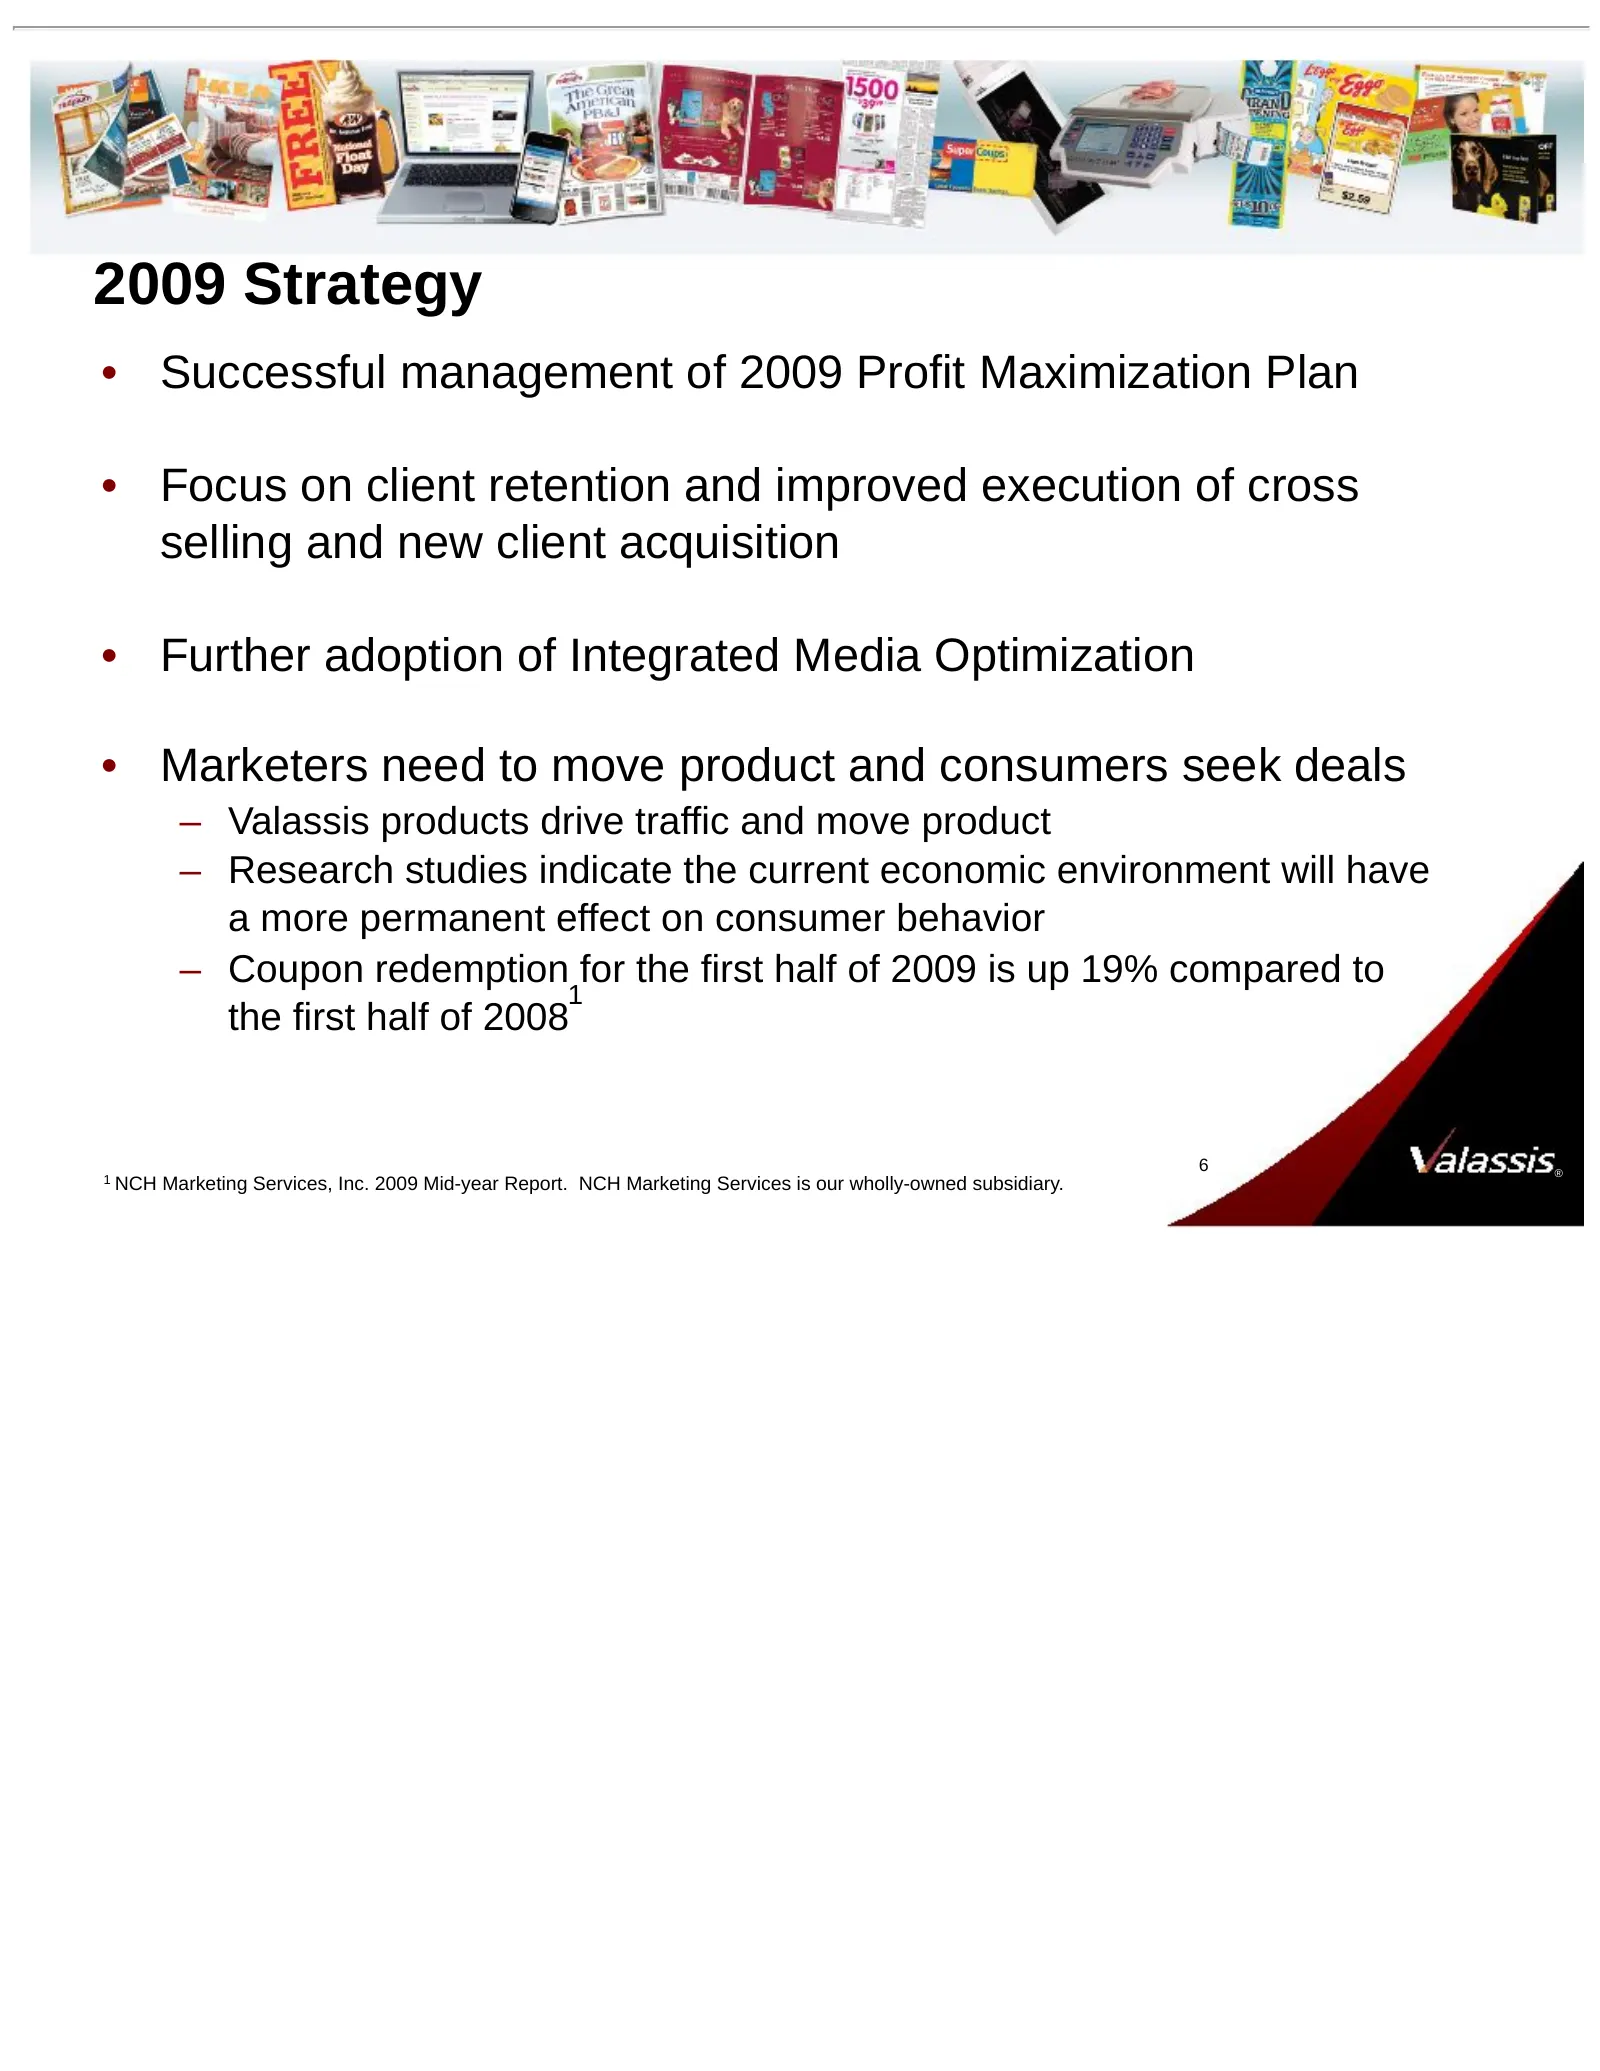
2009 Strategy • Successful management of 2009 Profit Maximization Plan • Focus on client retention and improved execution of cross selling and new client acquisition • Further adoption of Integrated Media Optimization • Marketers need to move product and consumers seek deals – Valassis products driv
Slide 7: Long-term Growth Strategy
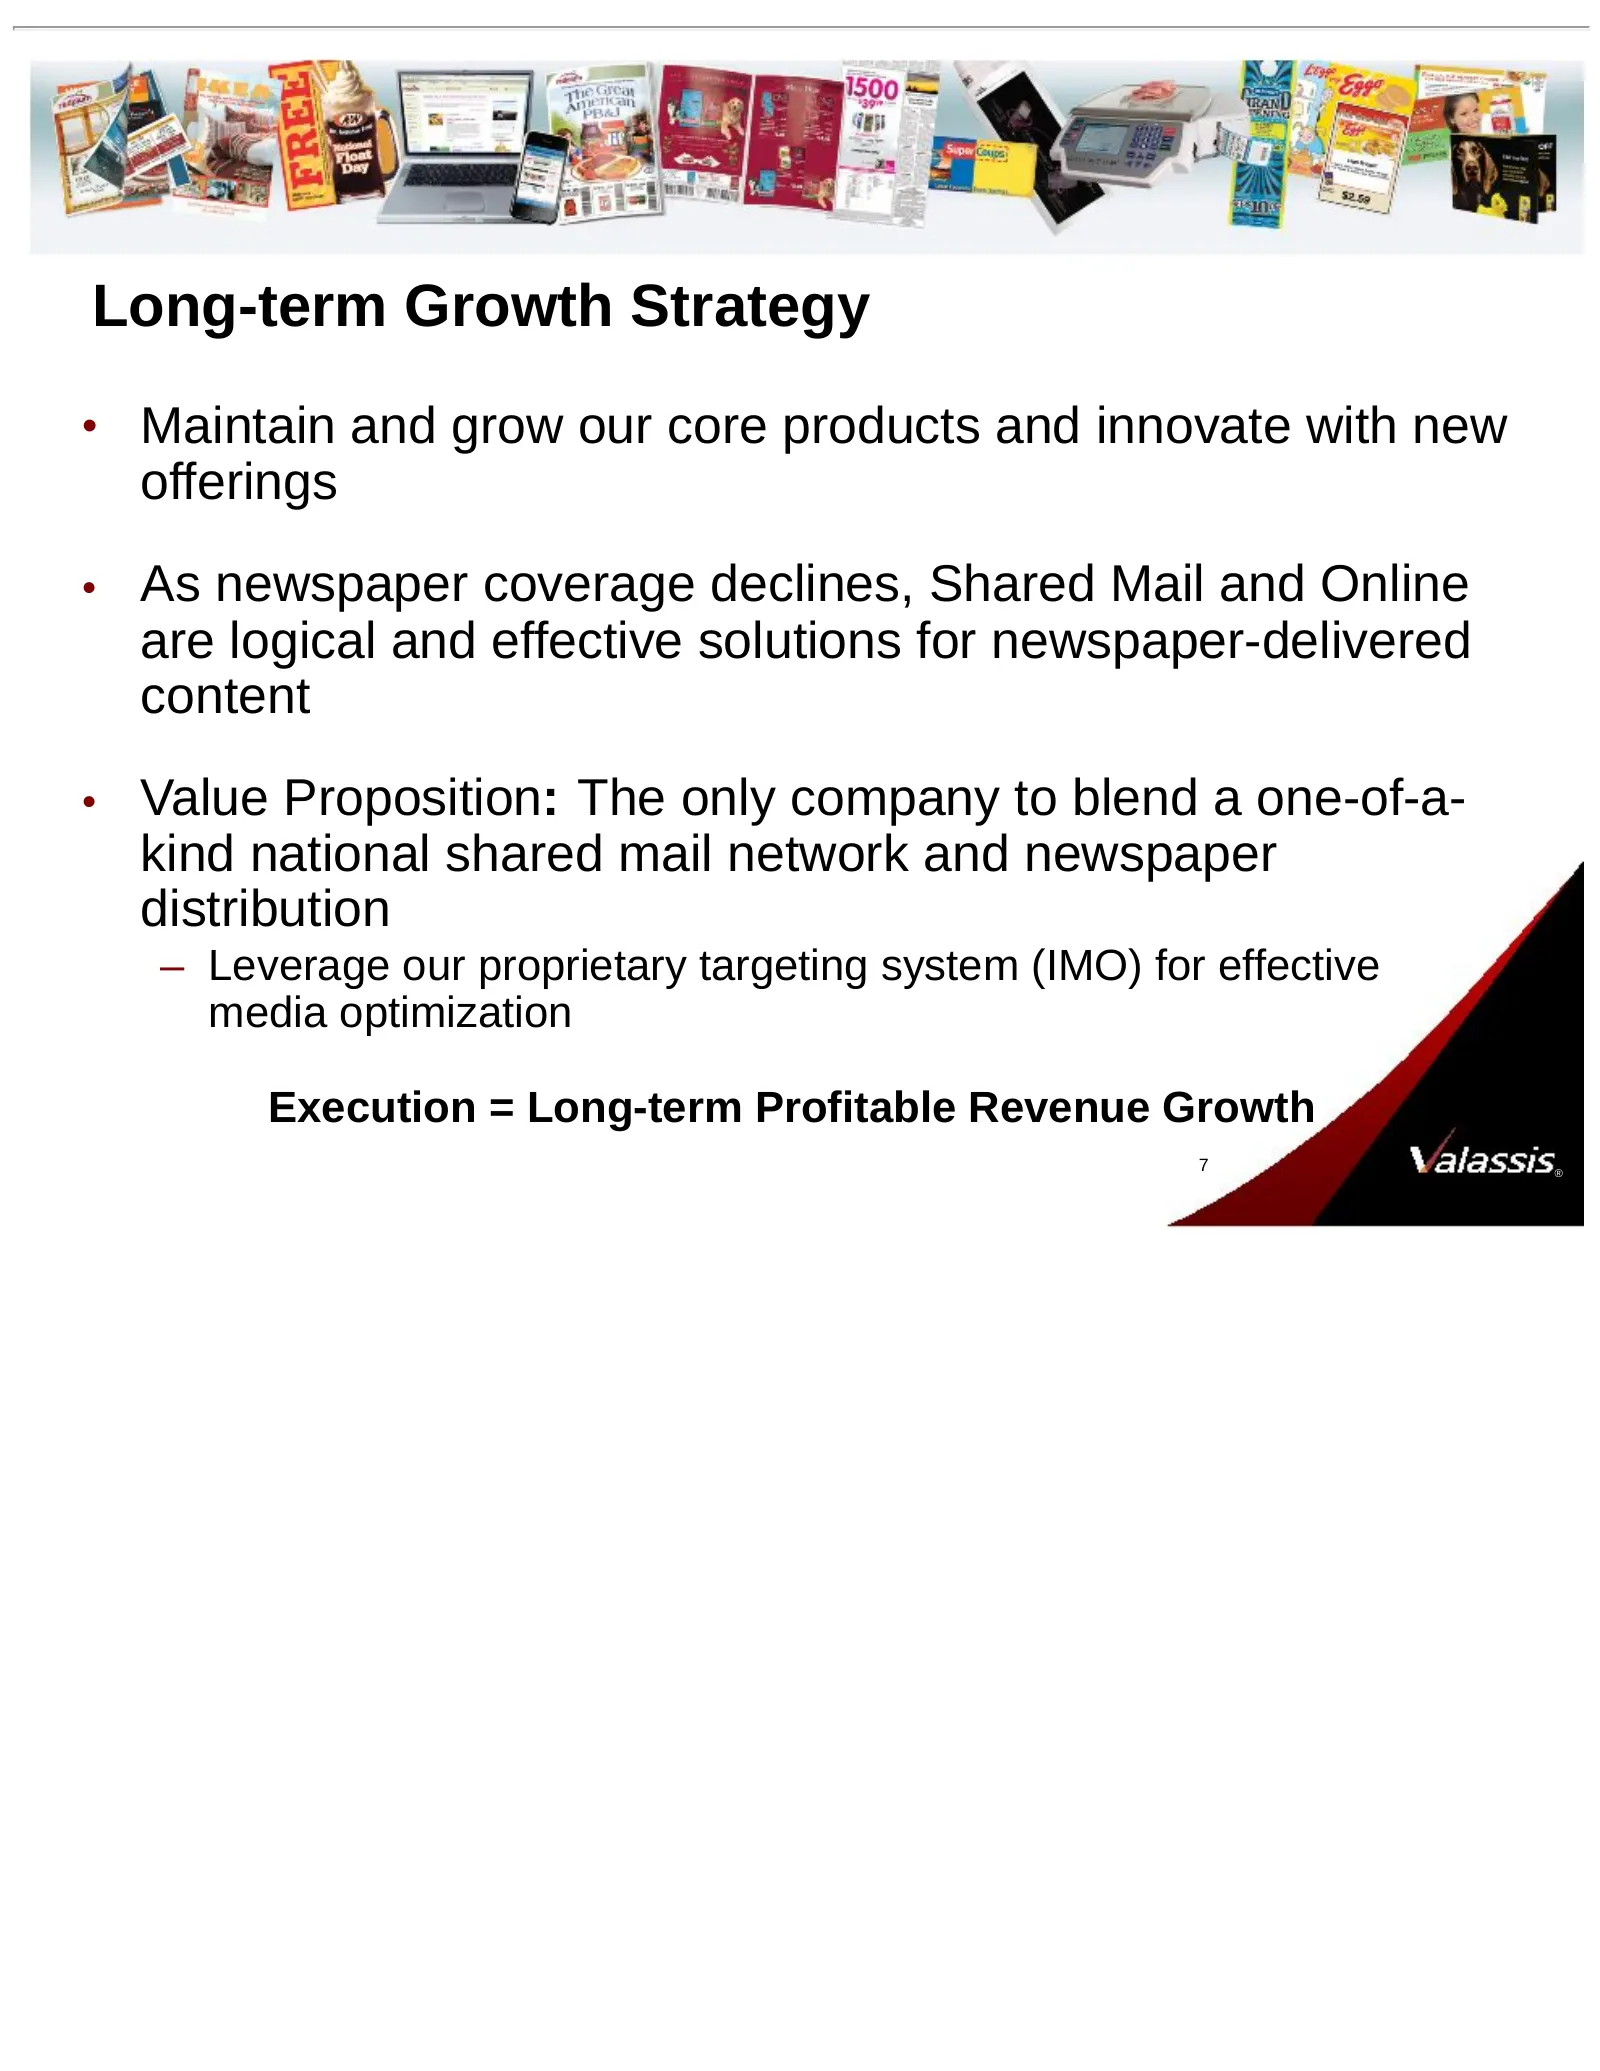
Long-term Growth Strategy • Maintain and grow our core products and innovate with new offerings • As newspaper coverage declines, Shared Mail and Online are logical and effective solutions for newspaper-delivered content • Value Proposition: The only company to blend a one-of-a- kind national shared
Slide 8: Guidance (increased July 30, 2009)
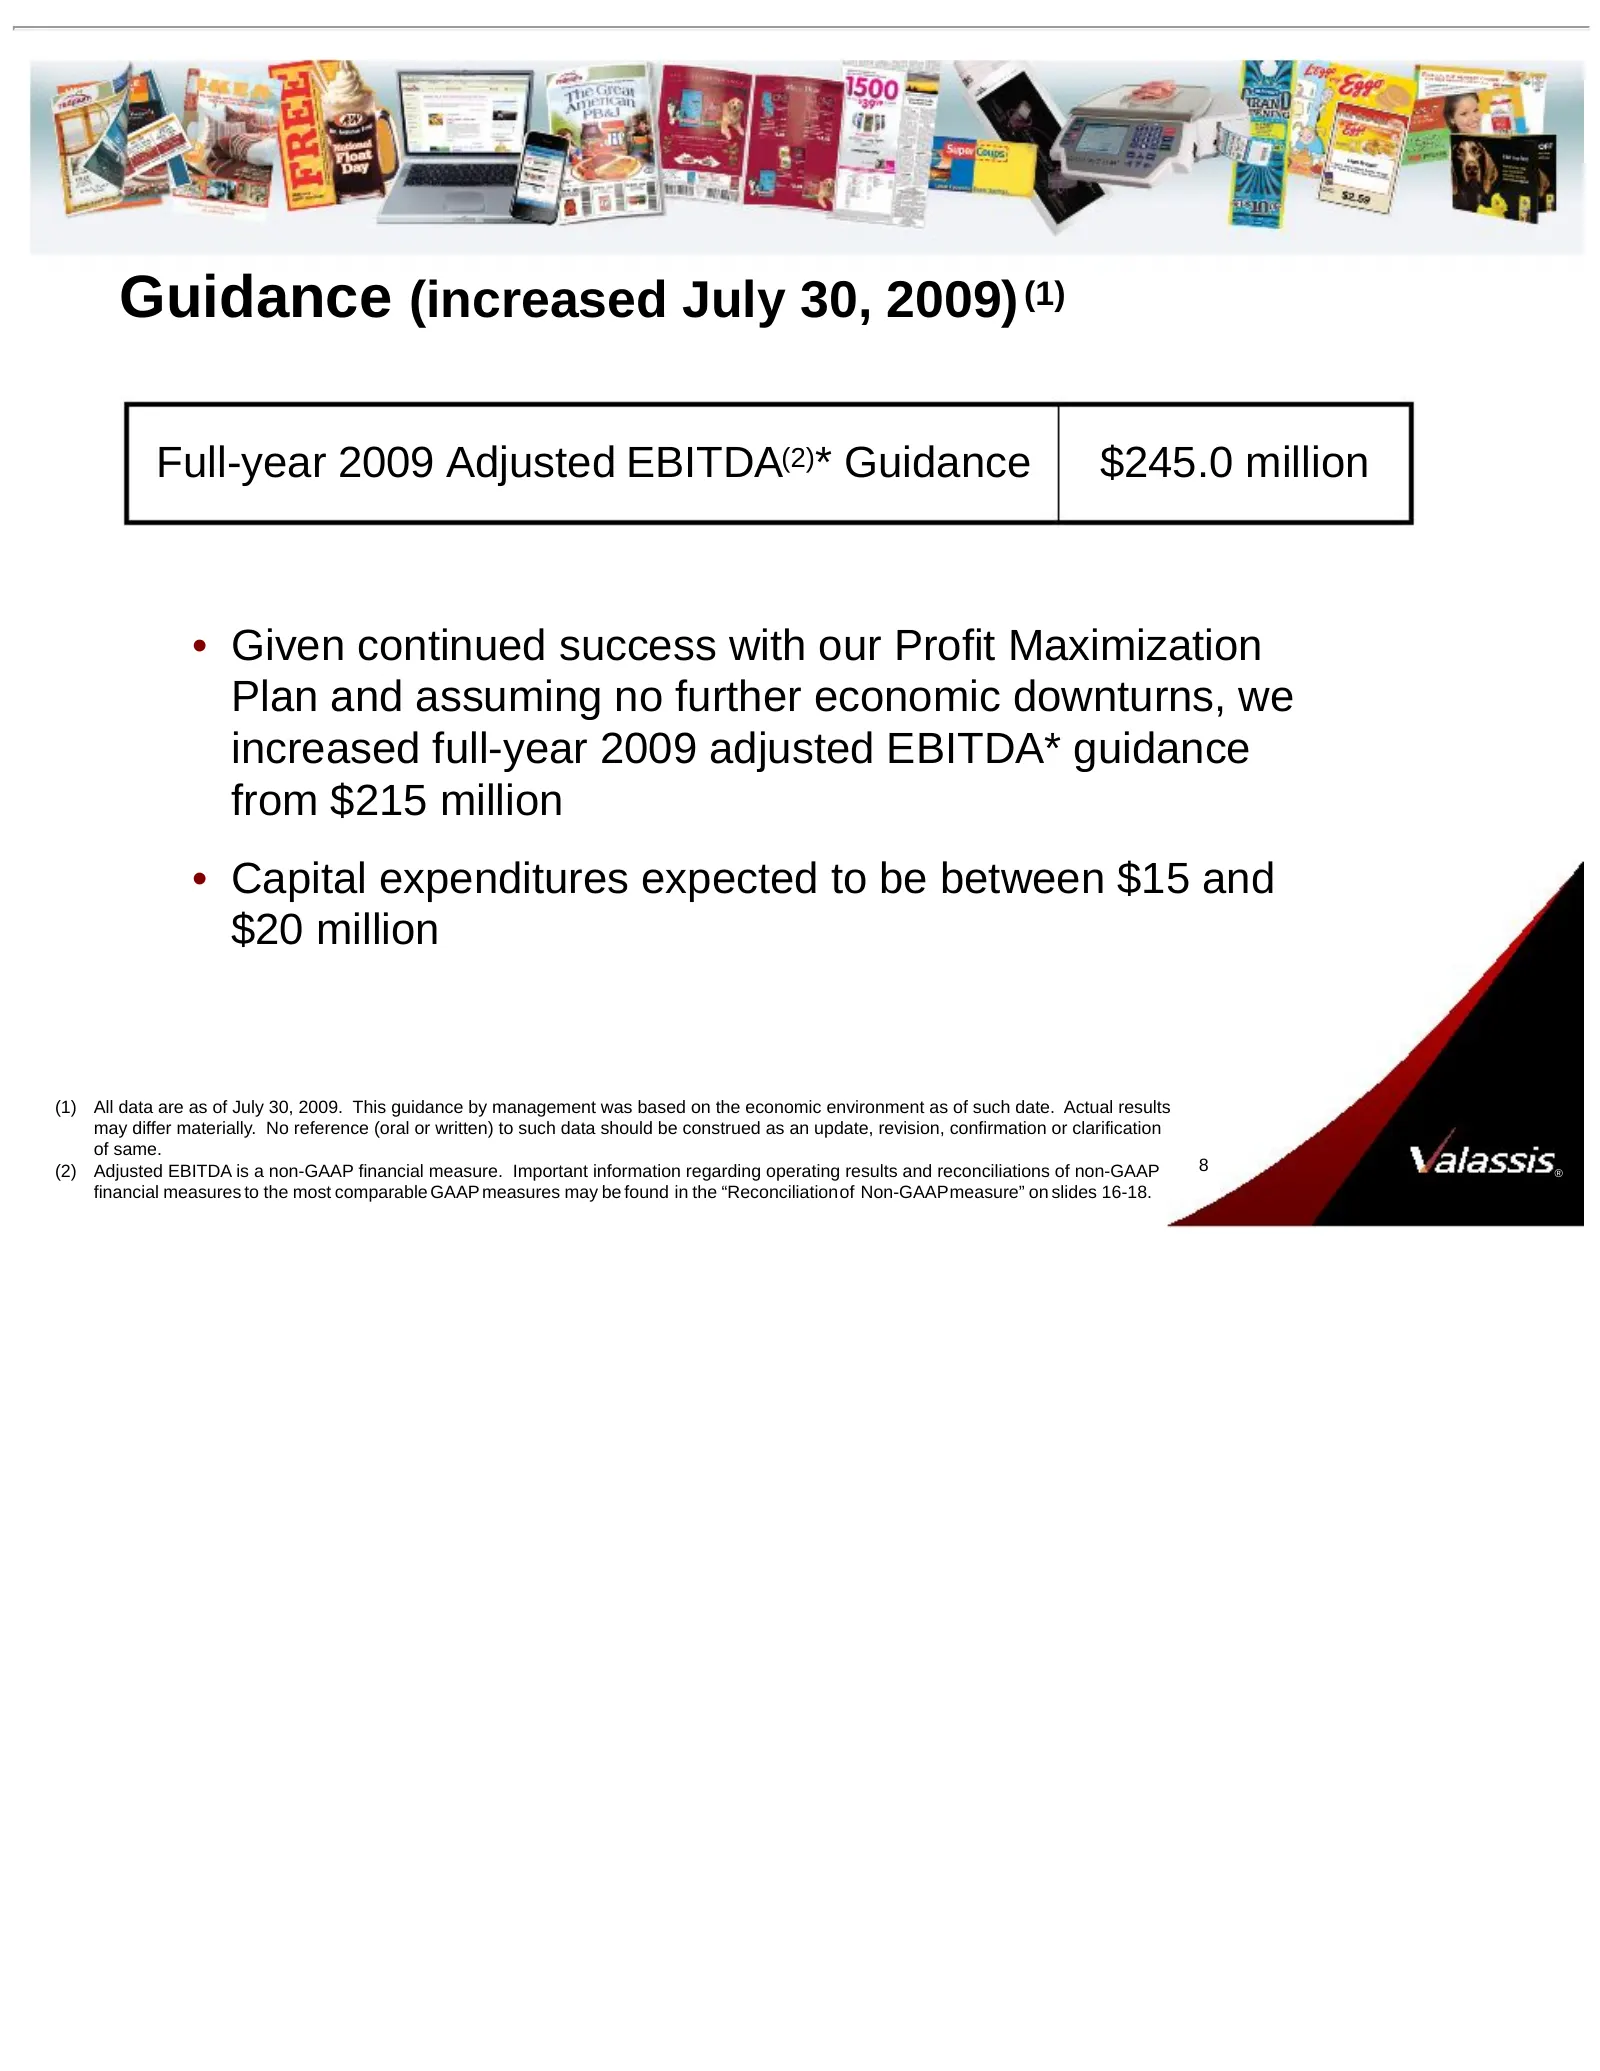
Guidance (increased July 30, 2009) (1) Full-year 2009 Adjusted EBITDA(2)* Guidance $245.0 million • Given continued success with our Profit Maximization Plan and assuming no further economic downturns, we increased full-year 2009 adjusted EBITDA* guidance from $215 million • Capital expenditures exp
Slide 9: 2009 Profit Maximization Plan (PMP)
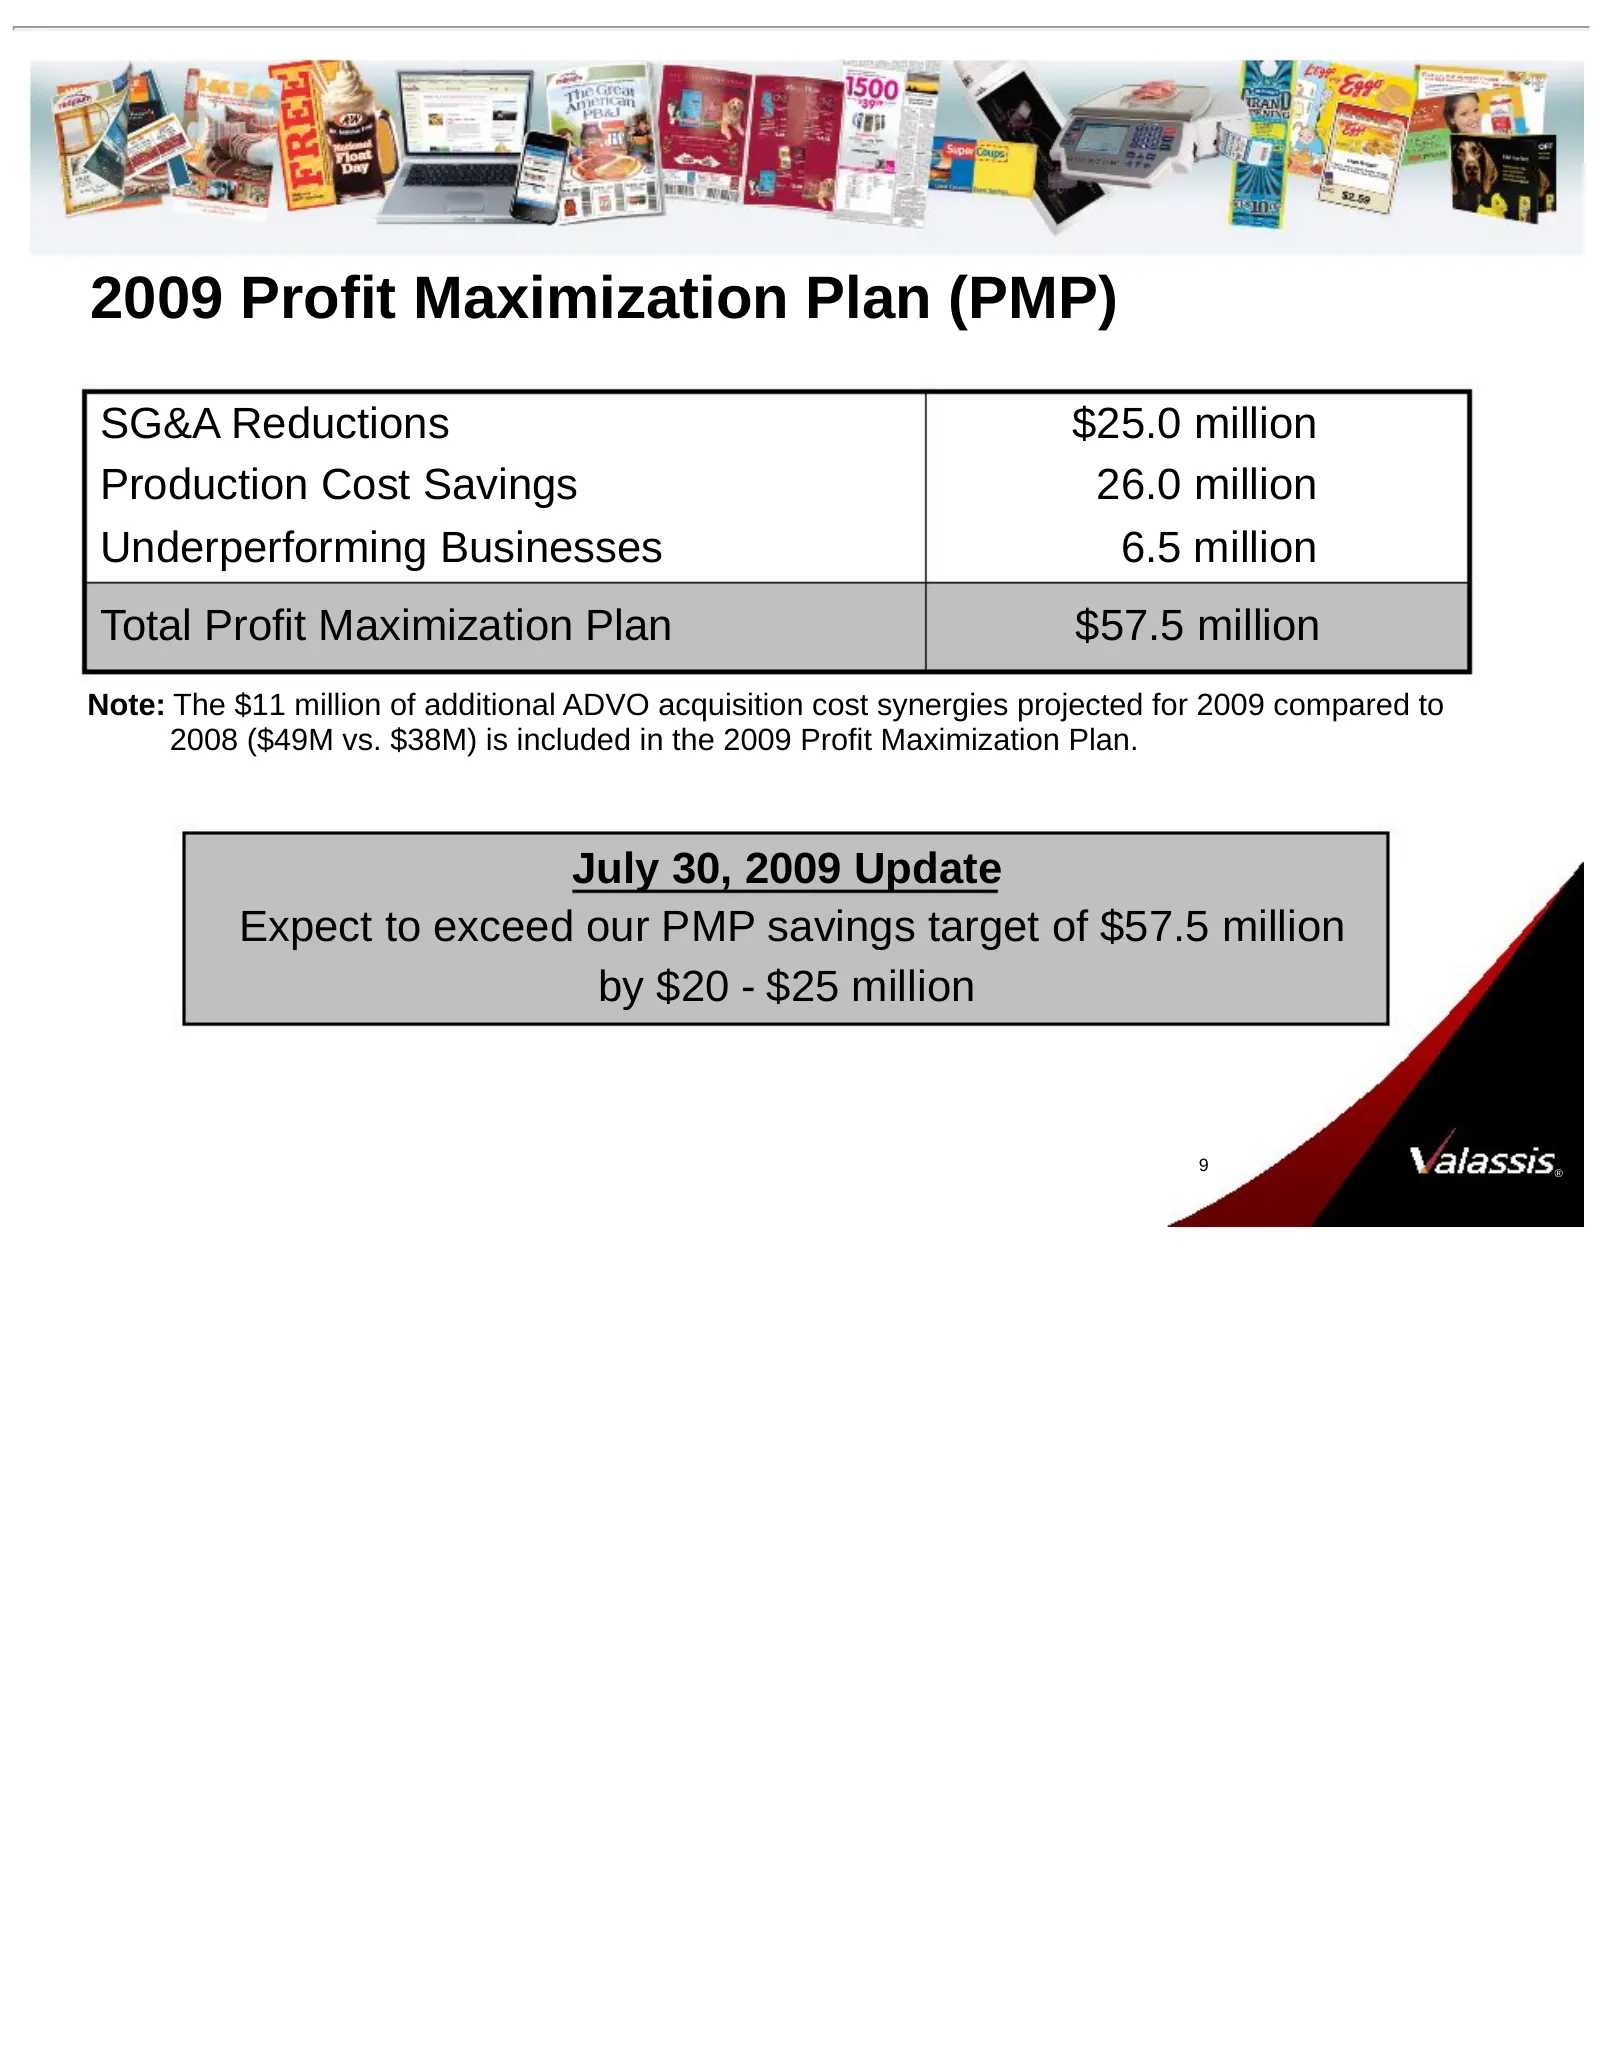
2009 Profit Maximization Plan (PMP) SG&A Reductions $25.0 million Production Cost Savings 26.0 million Underperforming Businesses 6.5 million Total Profit Maximization Plan $57.5 million Note: The $11 million of additional ADVO acquisition cost synergies projected for 2009 compared to 2008 ($49M vs.
Slide 10: Capital Structure
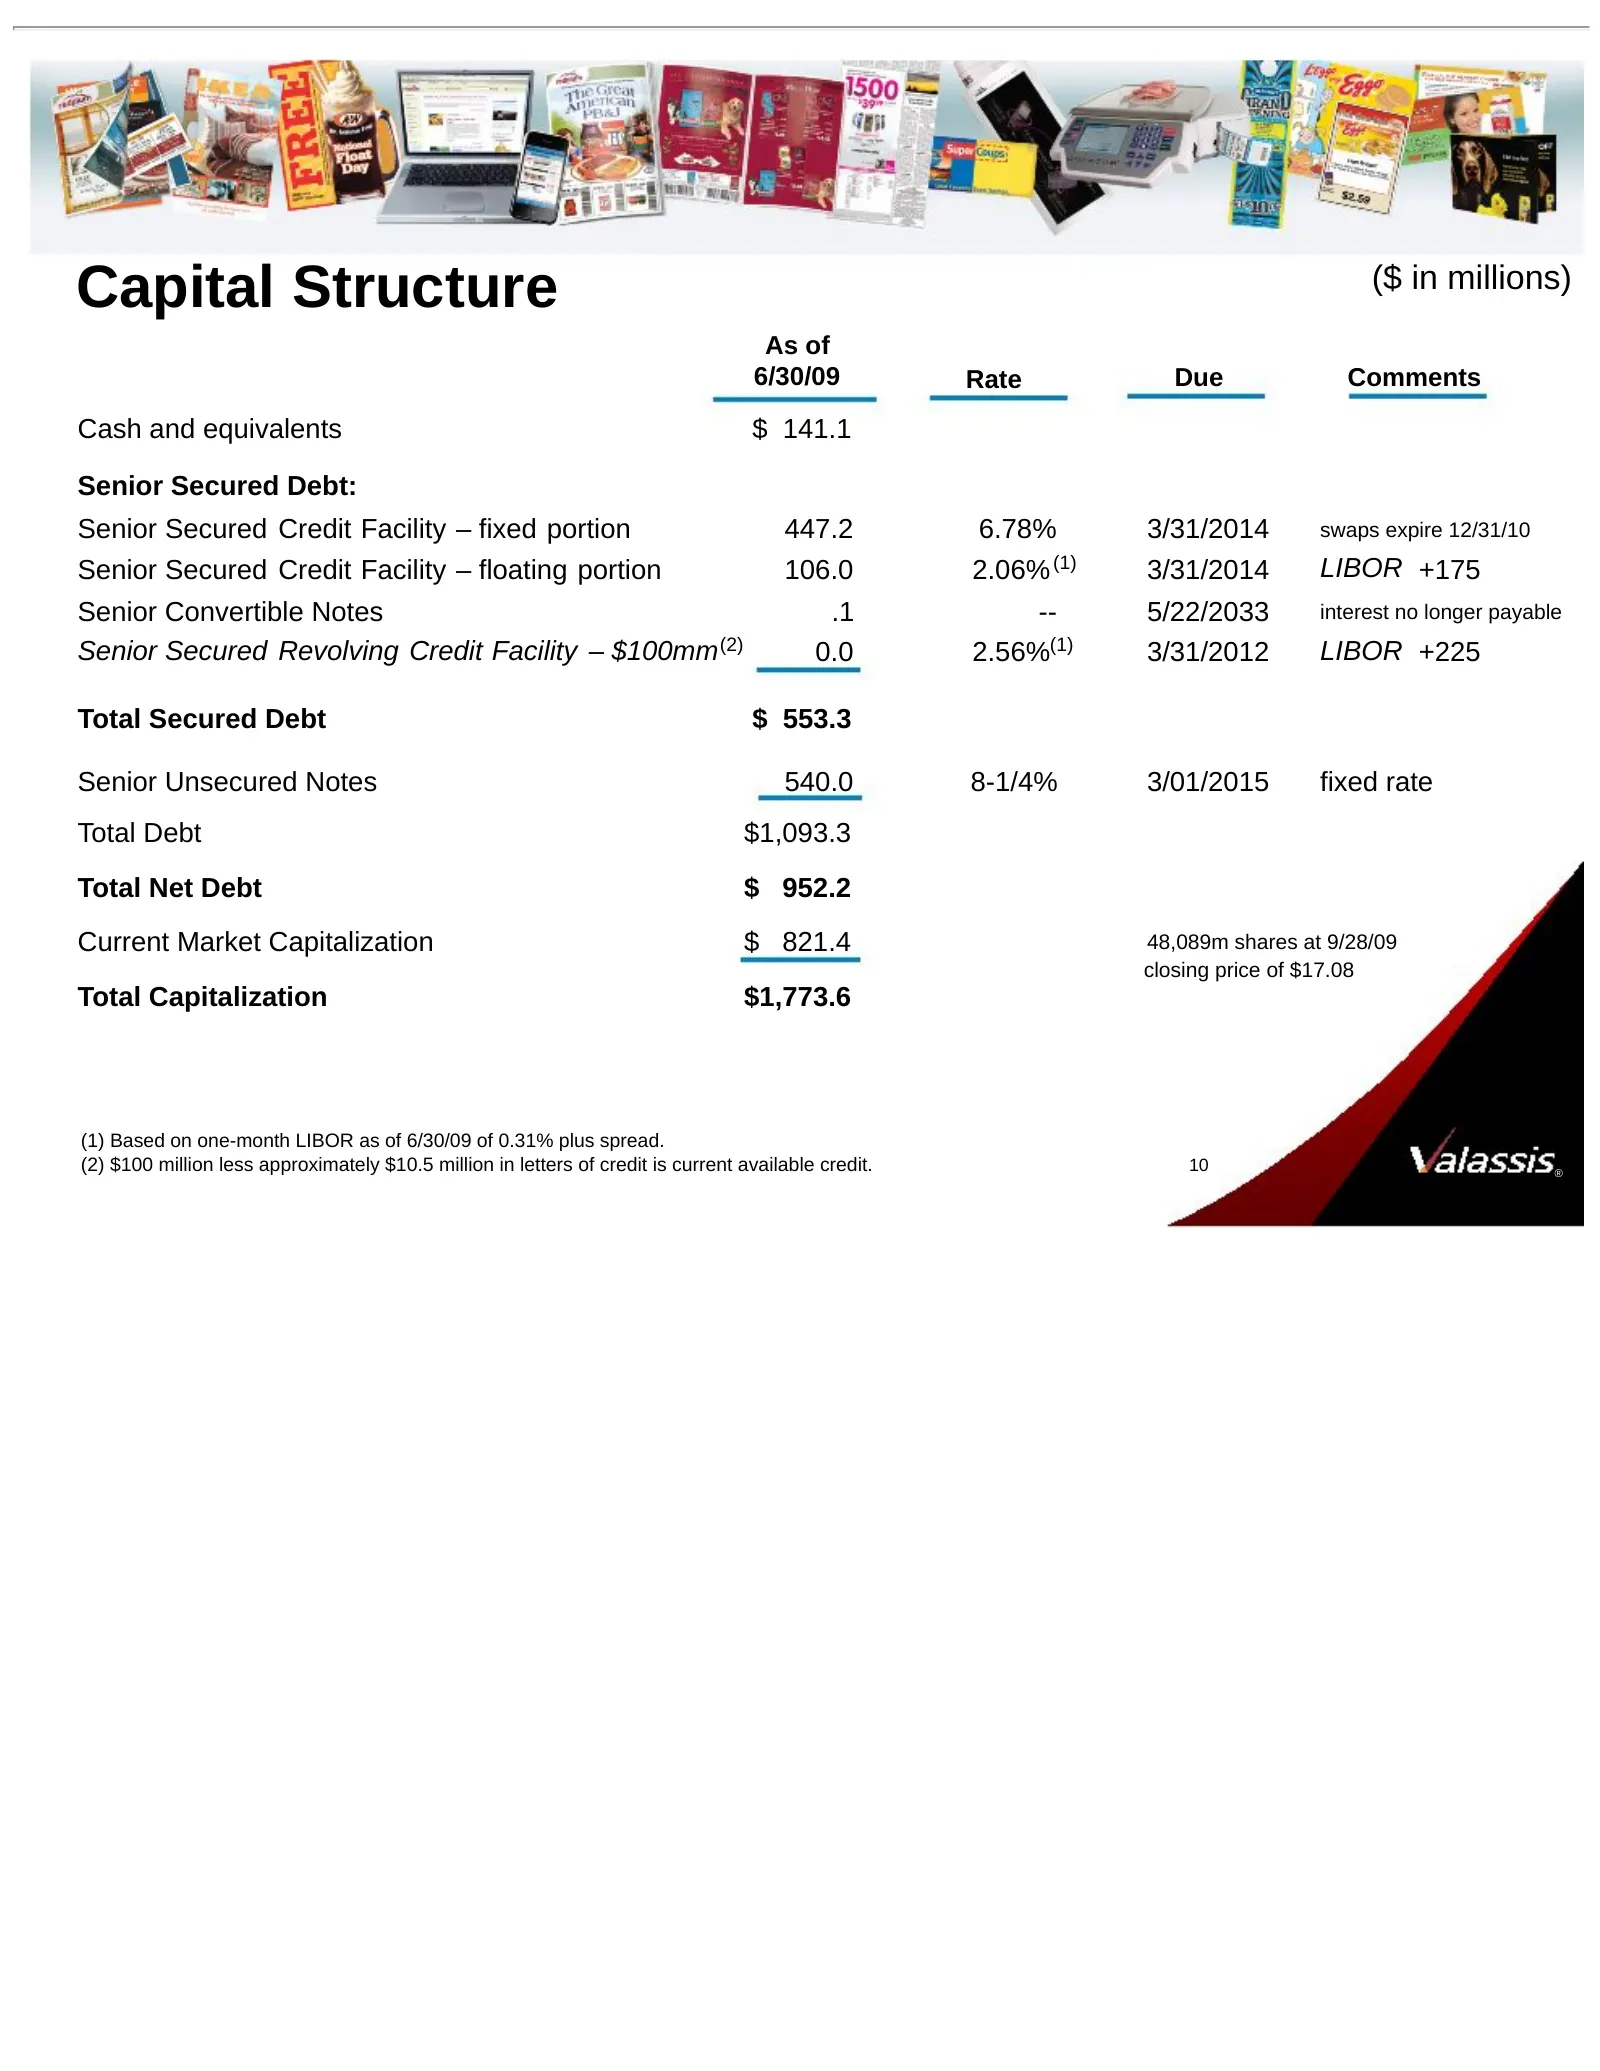
Capital Structure ($ in millions) As of 6/30/09 Rate Due Comments Cash and equivalents $ 141.1 Senior Secured Debt: Senior Secured Credit Facility – fixed portion 447.2 6.78% 3/31/2014 swaps expire 12/31/10 Senior Secured Credit Facility – floating portion 106.0 2.06% (1) 3/31/2014 LIBOR +175 Senior
Slide 11: Cash Flow and Interest Update - First Half 2009
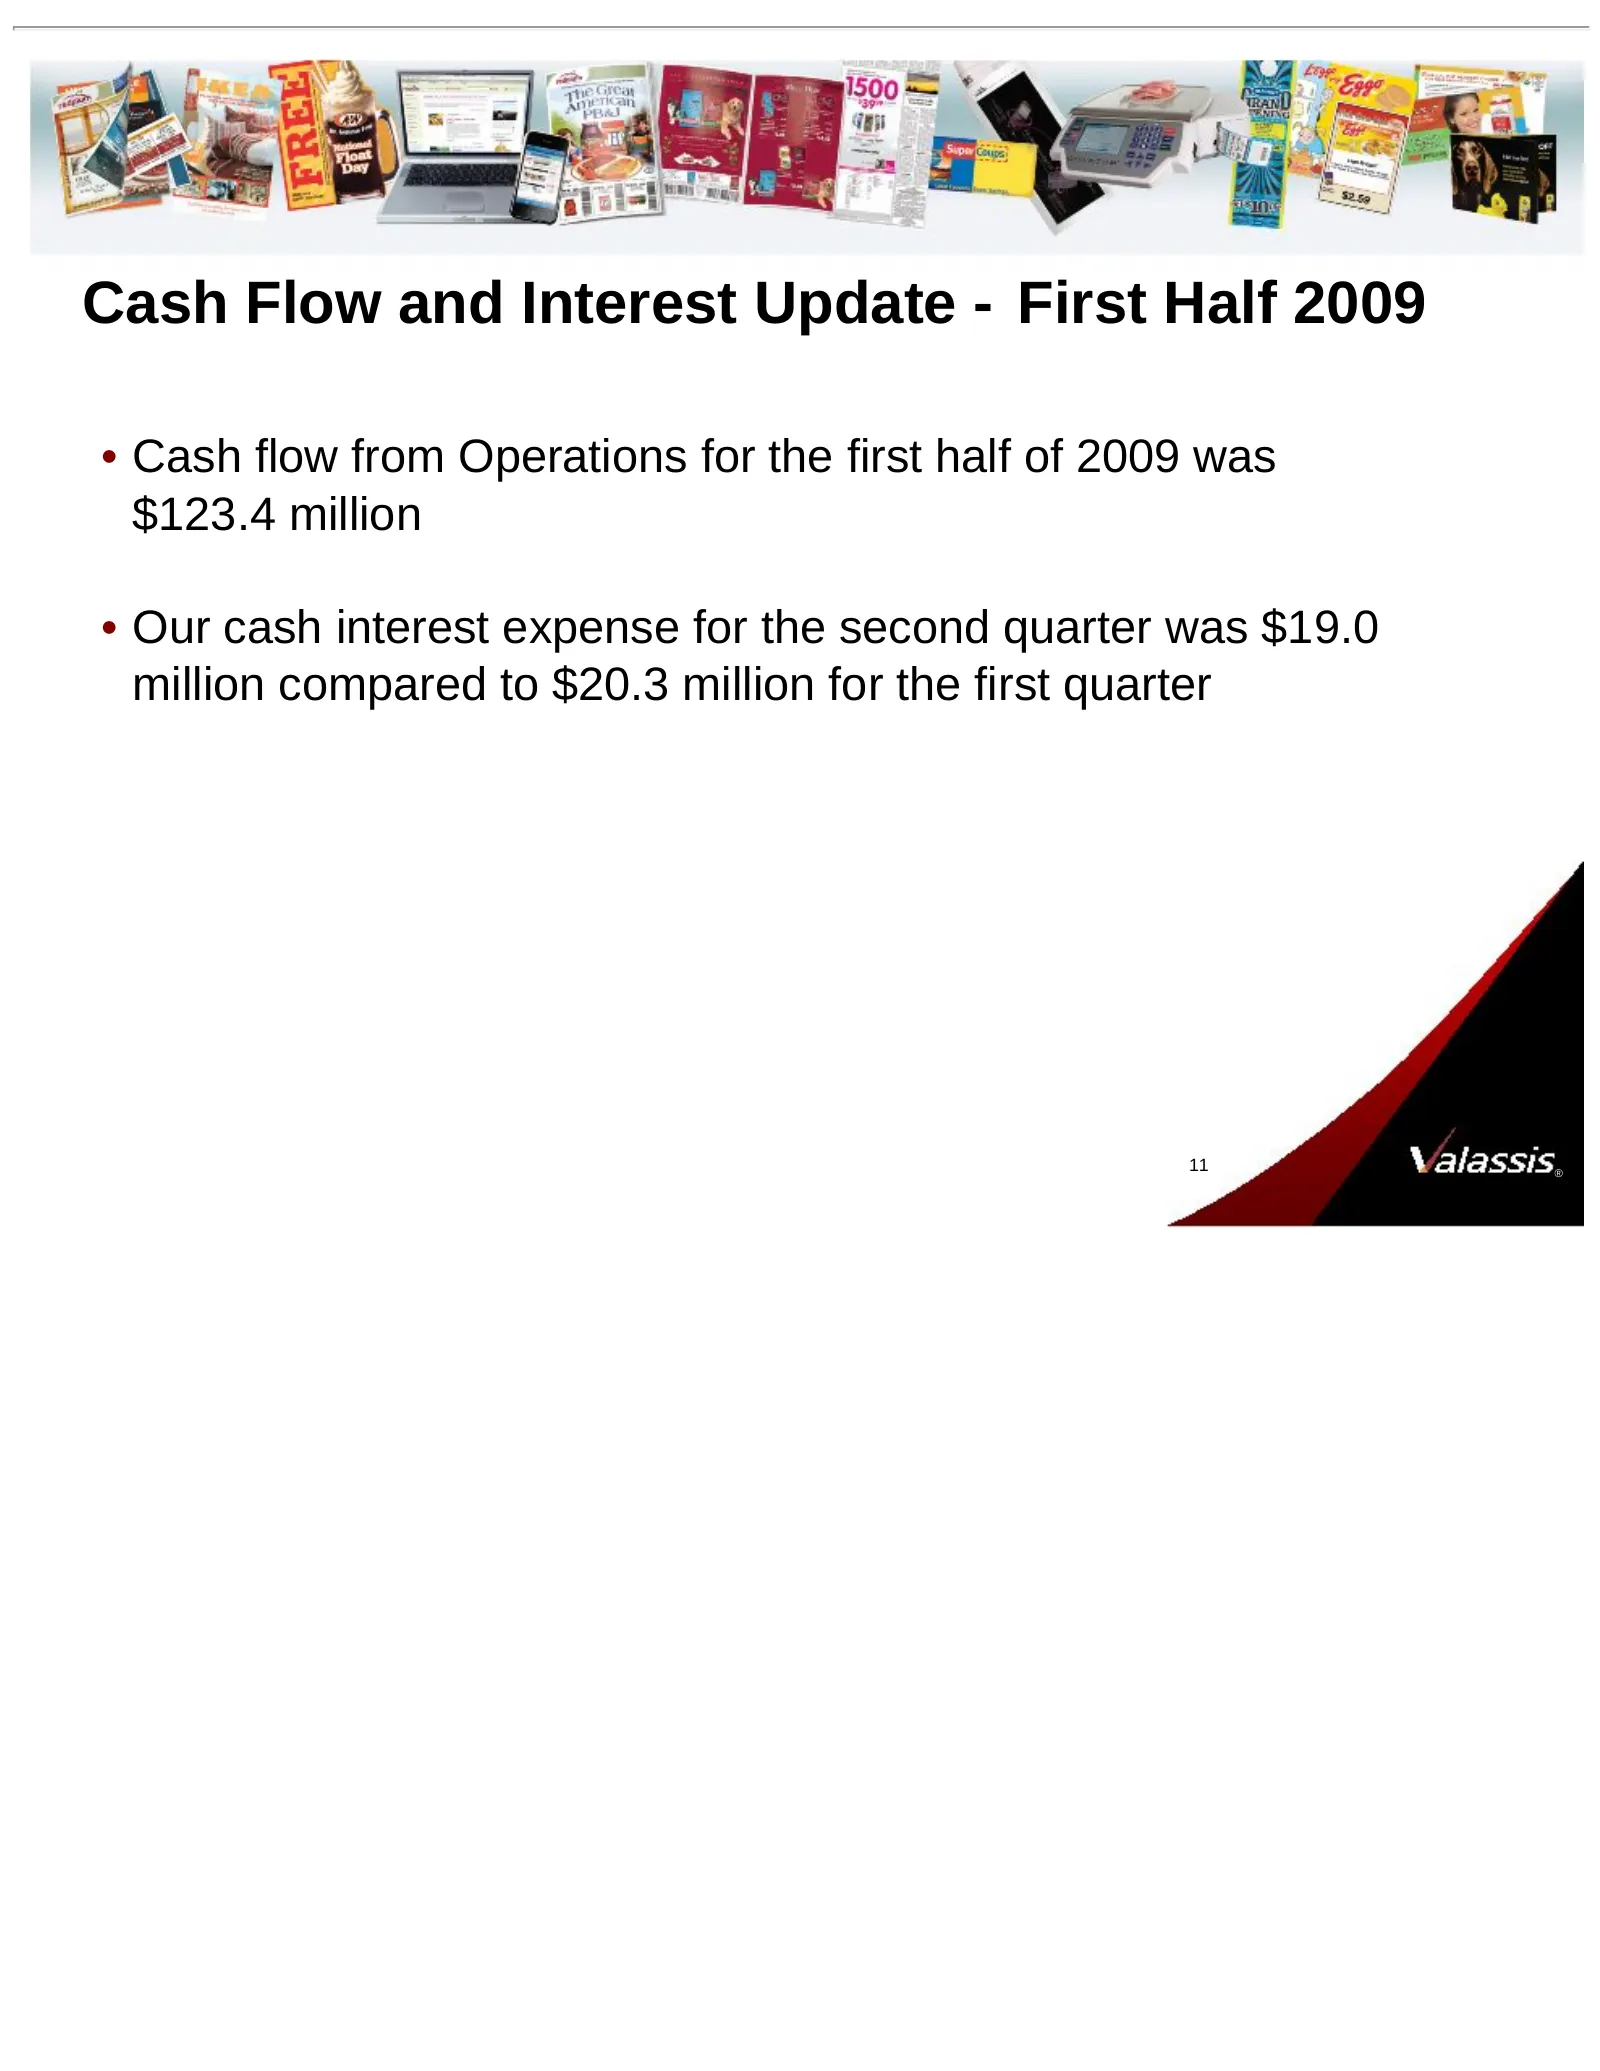
Cash Flow and Interest Update - First Half 2009 • Cash flow from Operations for the first half of 2009 was $123.4 million • Our cash interest expense for the second quarter was $19.0 million compared to $20.3 million for the first quarter 11 ®
Slide 12: Capital Structure Update – Thru September 30, 2009
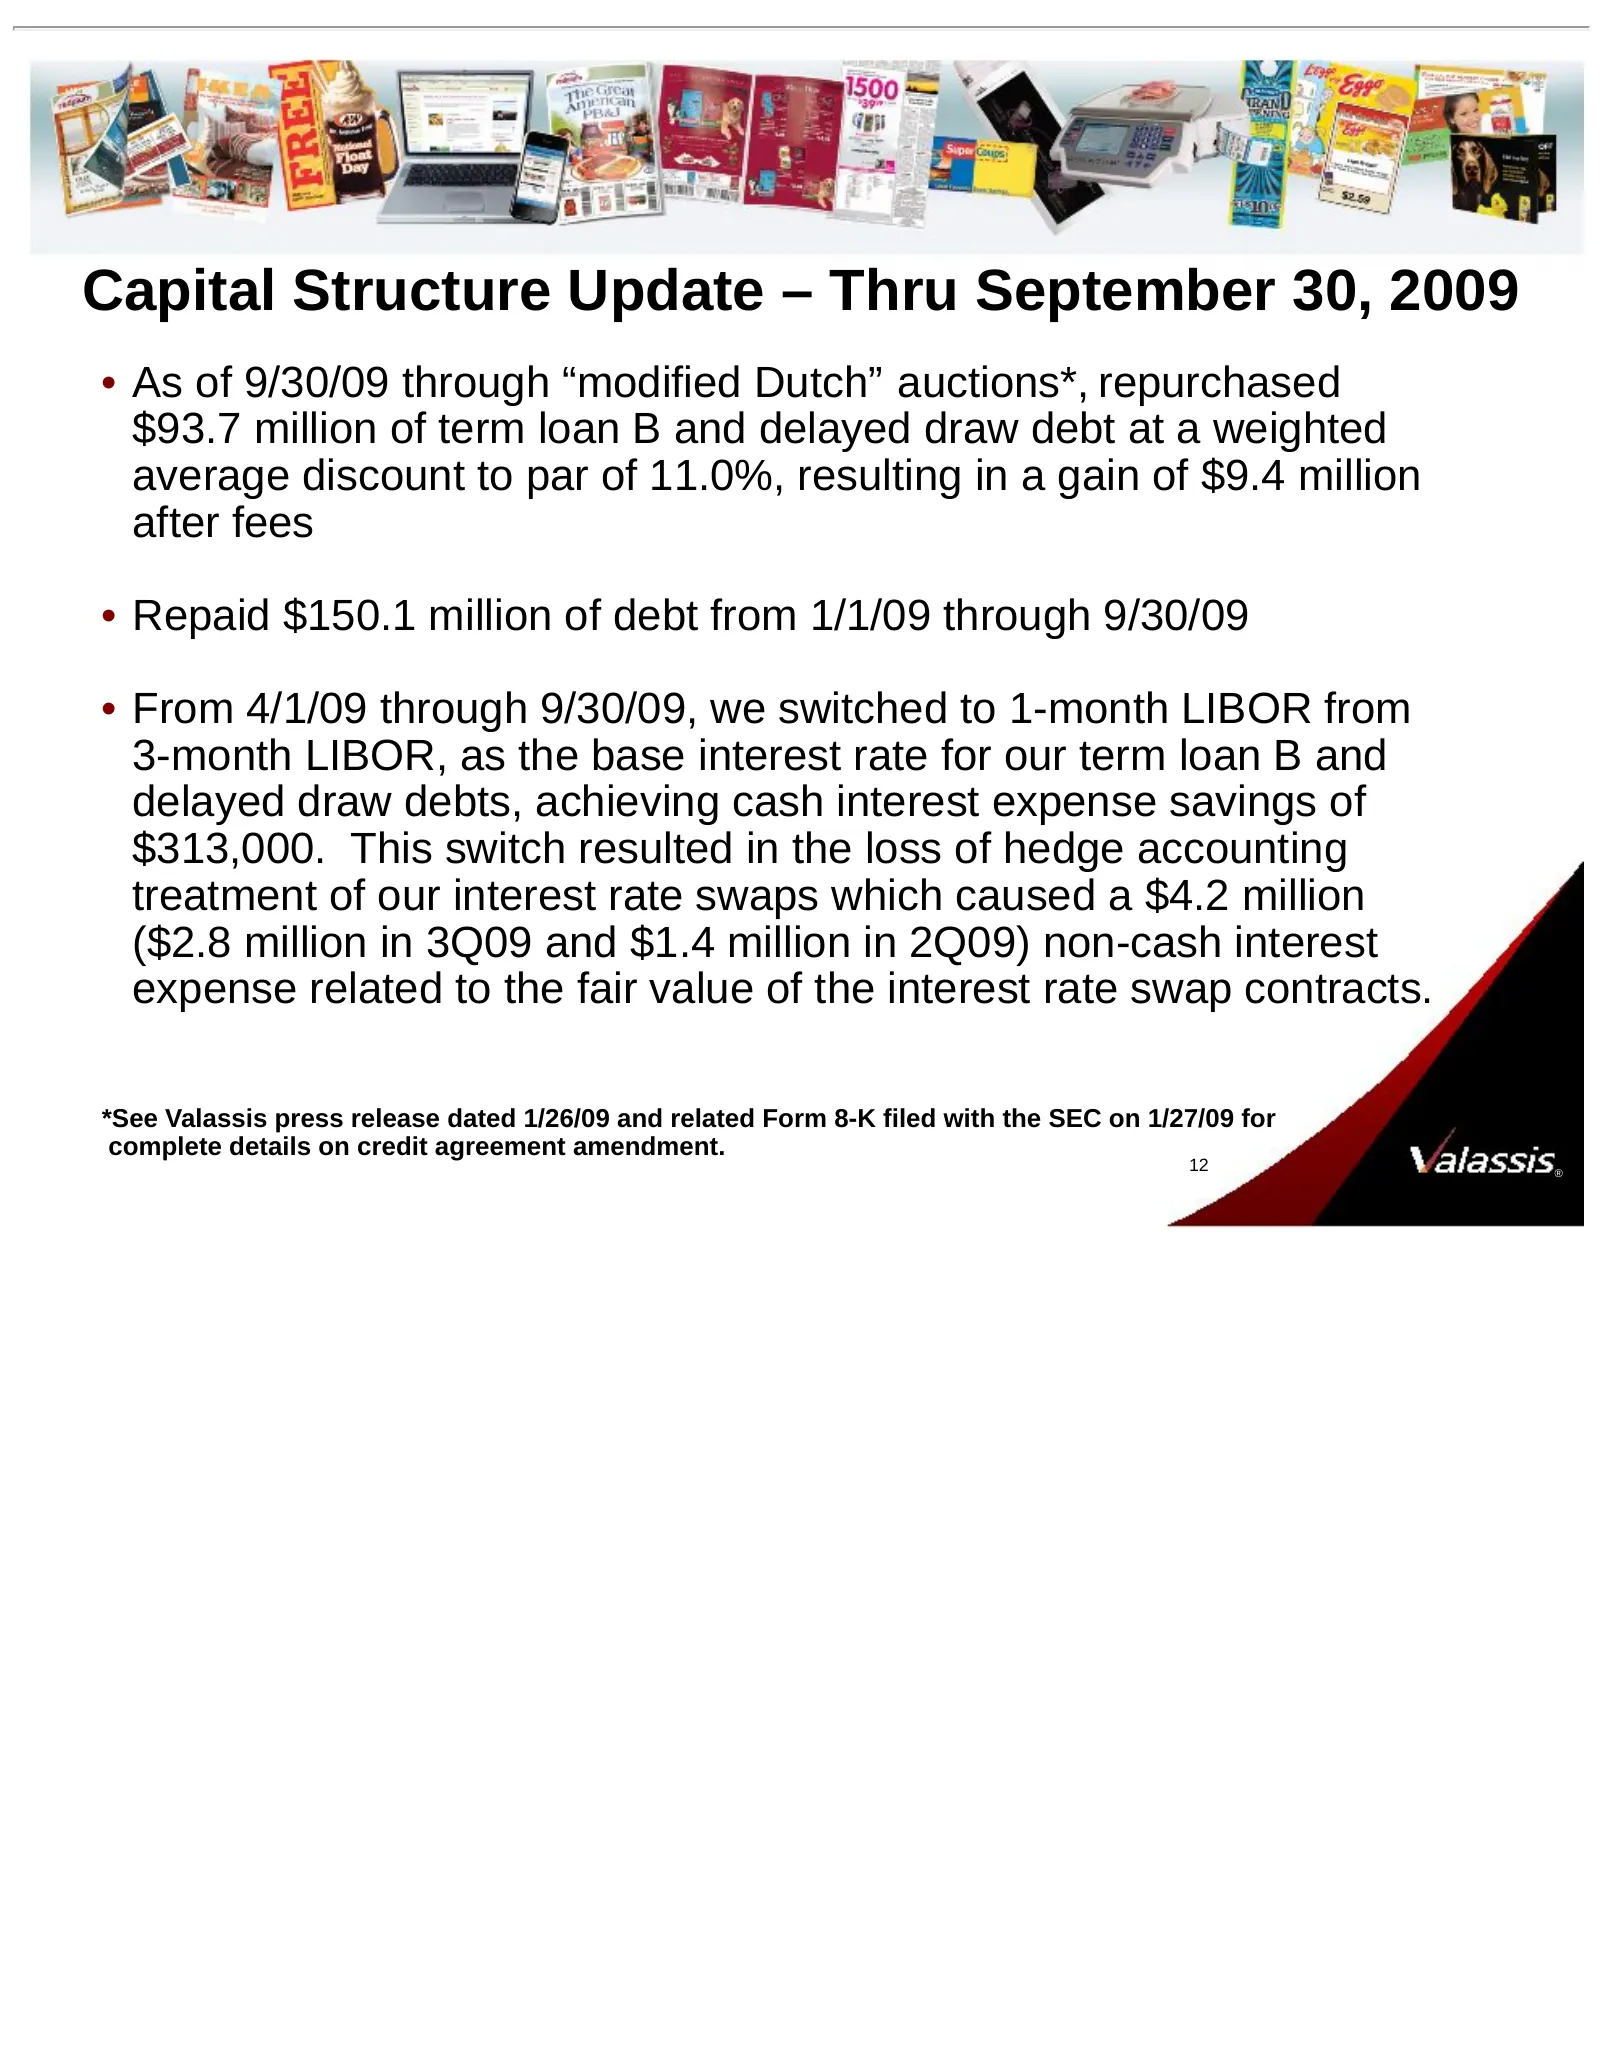
Capital Structure Update – Thru September 30, 2009 • As of 9/30/09 through “modified Dutch” auctions*, repurchased $93.7 million of term loan B and delayed draw debt at a weighted average discount to par of 11.0%, resulting in a gain of $9.4 million after fees • Repaid $150.1 million of debt from 1/
Slide 13: Covenant Analysis
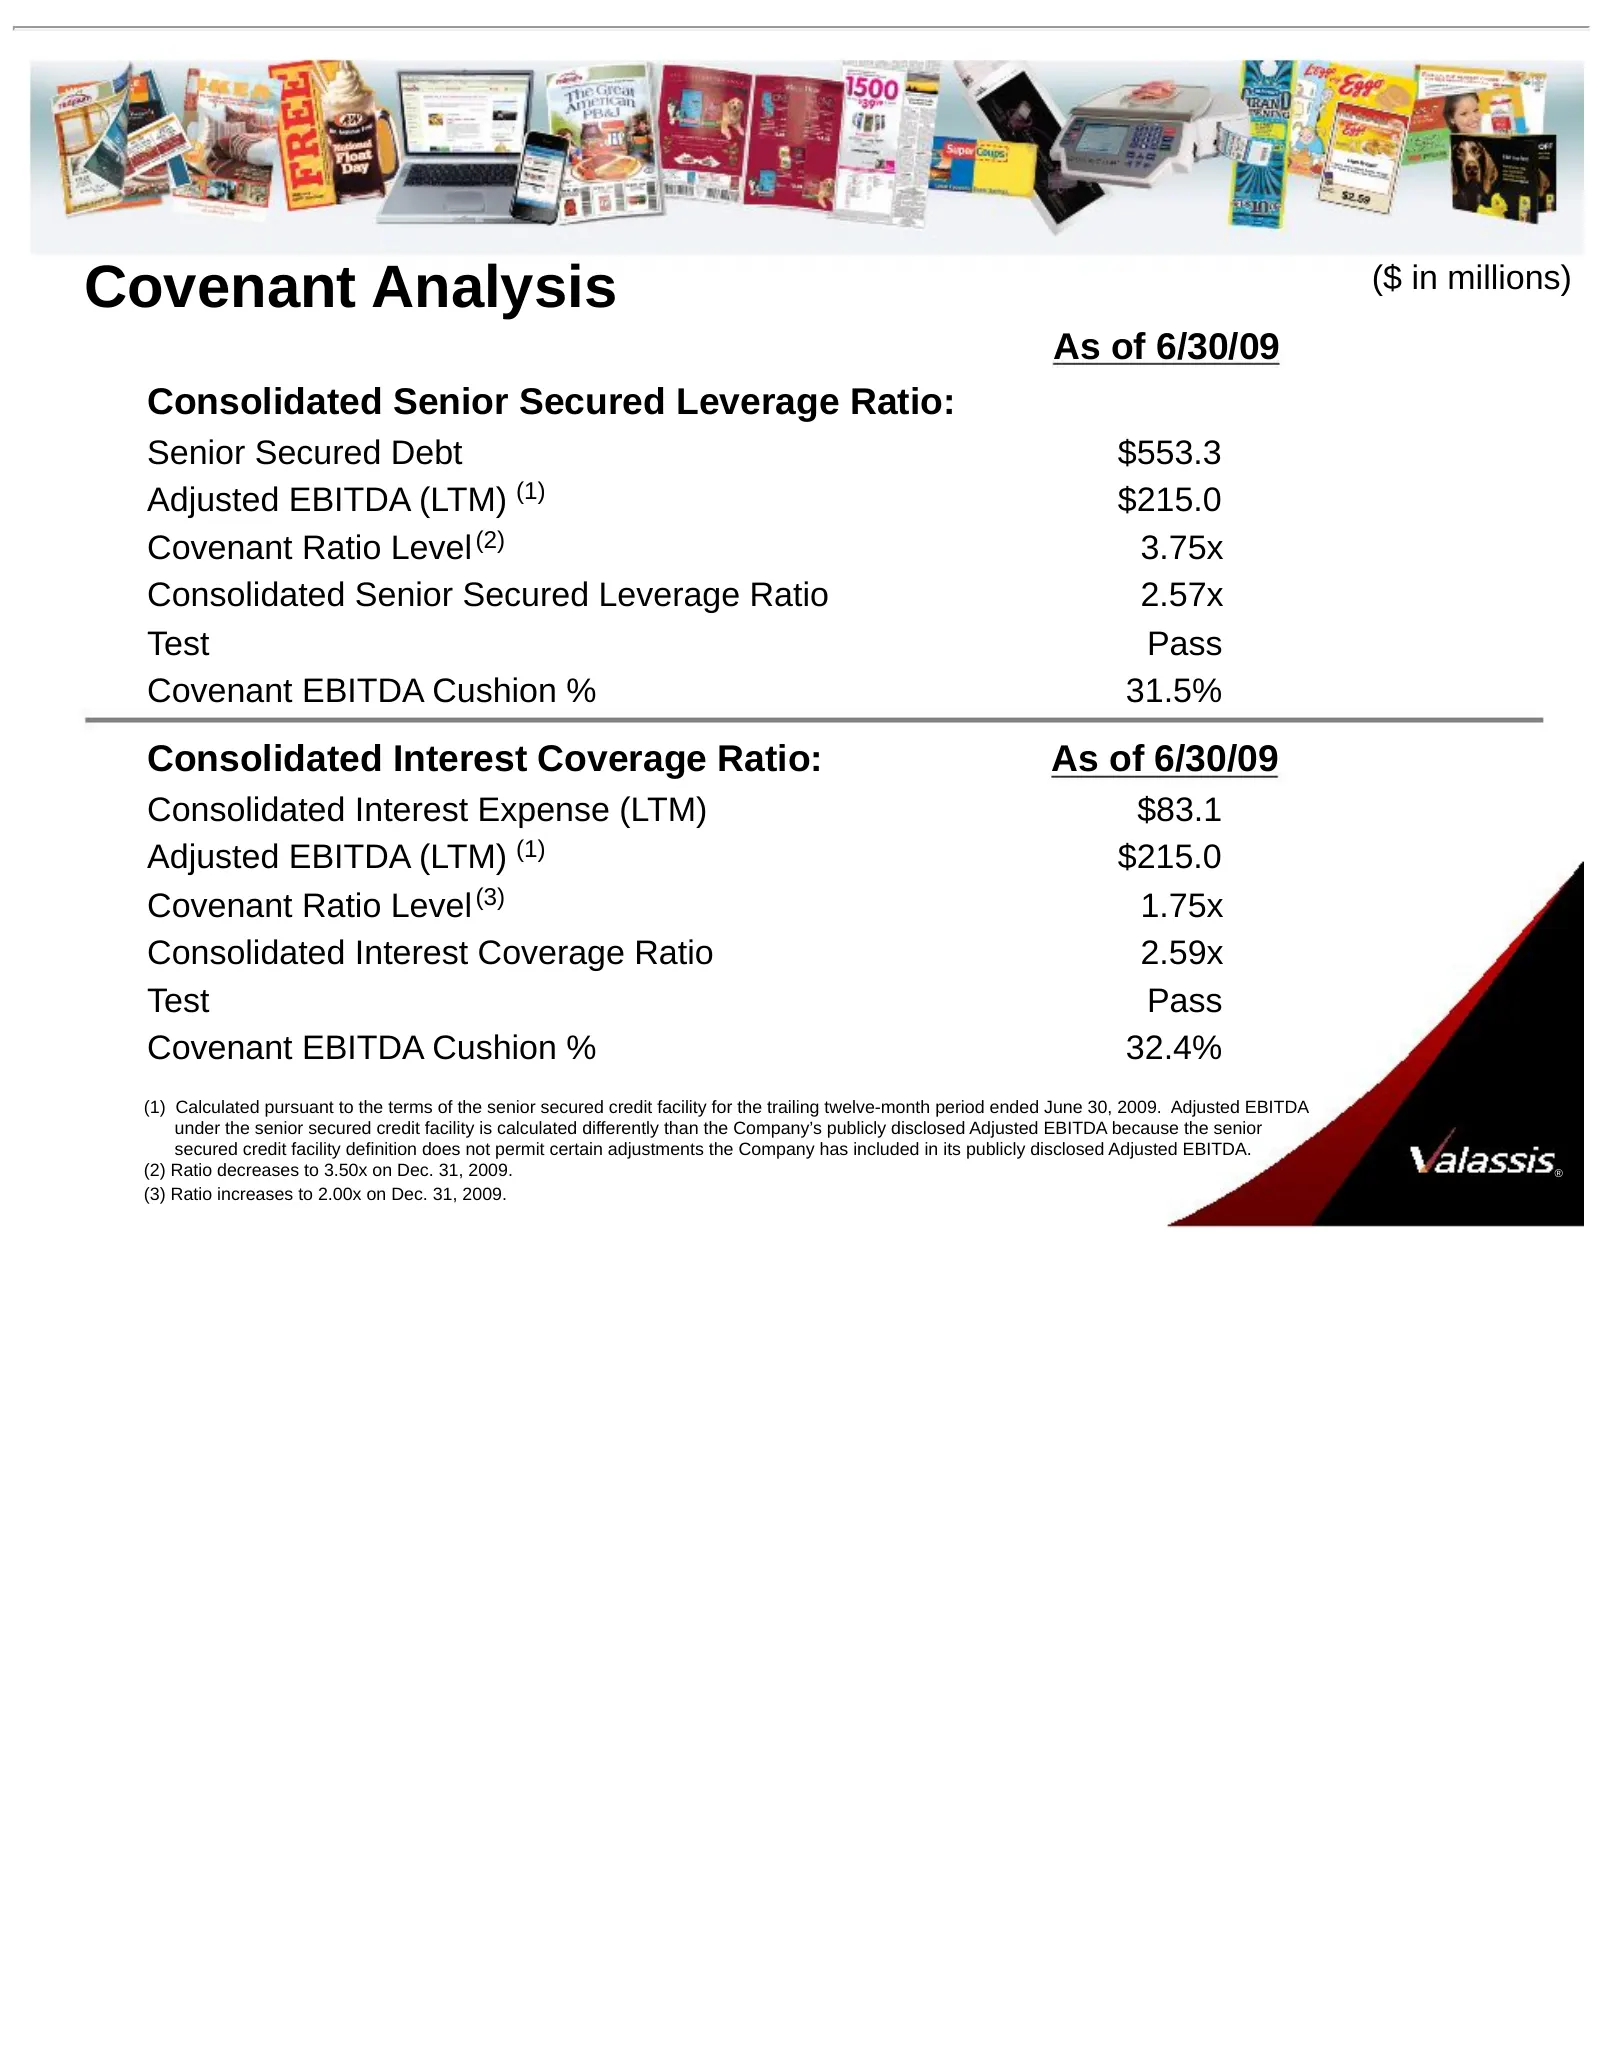
Covenant Analysis ($ in millions) As of 6/30/09 Consolidated Senior Secured Leverage Ratio: Senior Secured Debt $553.3 Adjusted EBITDA (LTM) (1) $215.0 Covenant Ratio Level (2) 3.75x Consolidated Senior Secured Leverage Ratio 2.57x Test Pass Covenant EBITDA Cushion % 31.5% Consolidated Interest Cove
Slide 14: Why Invest in Valassis?
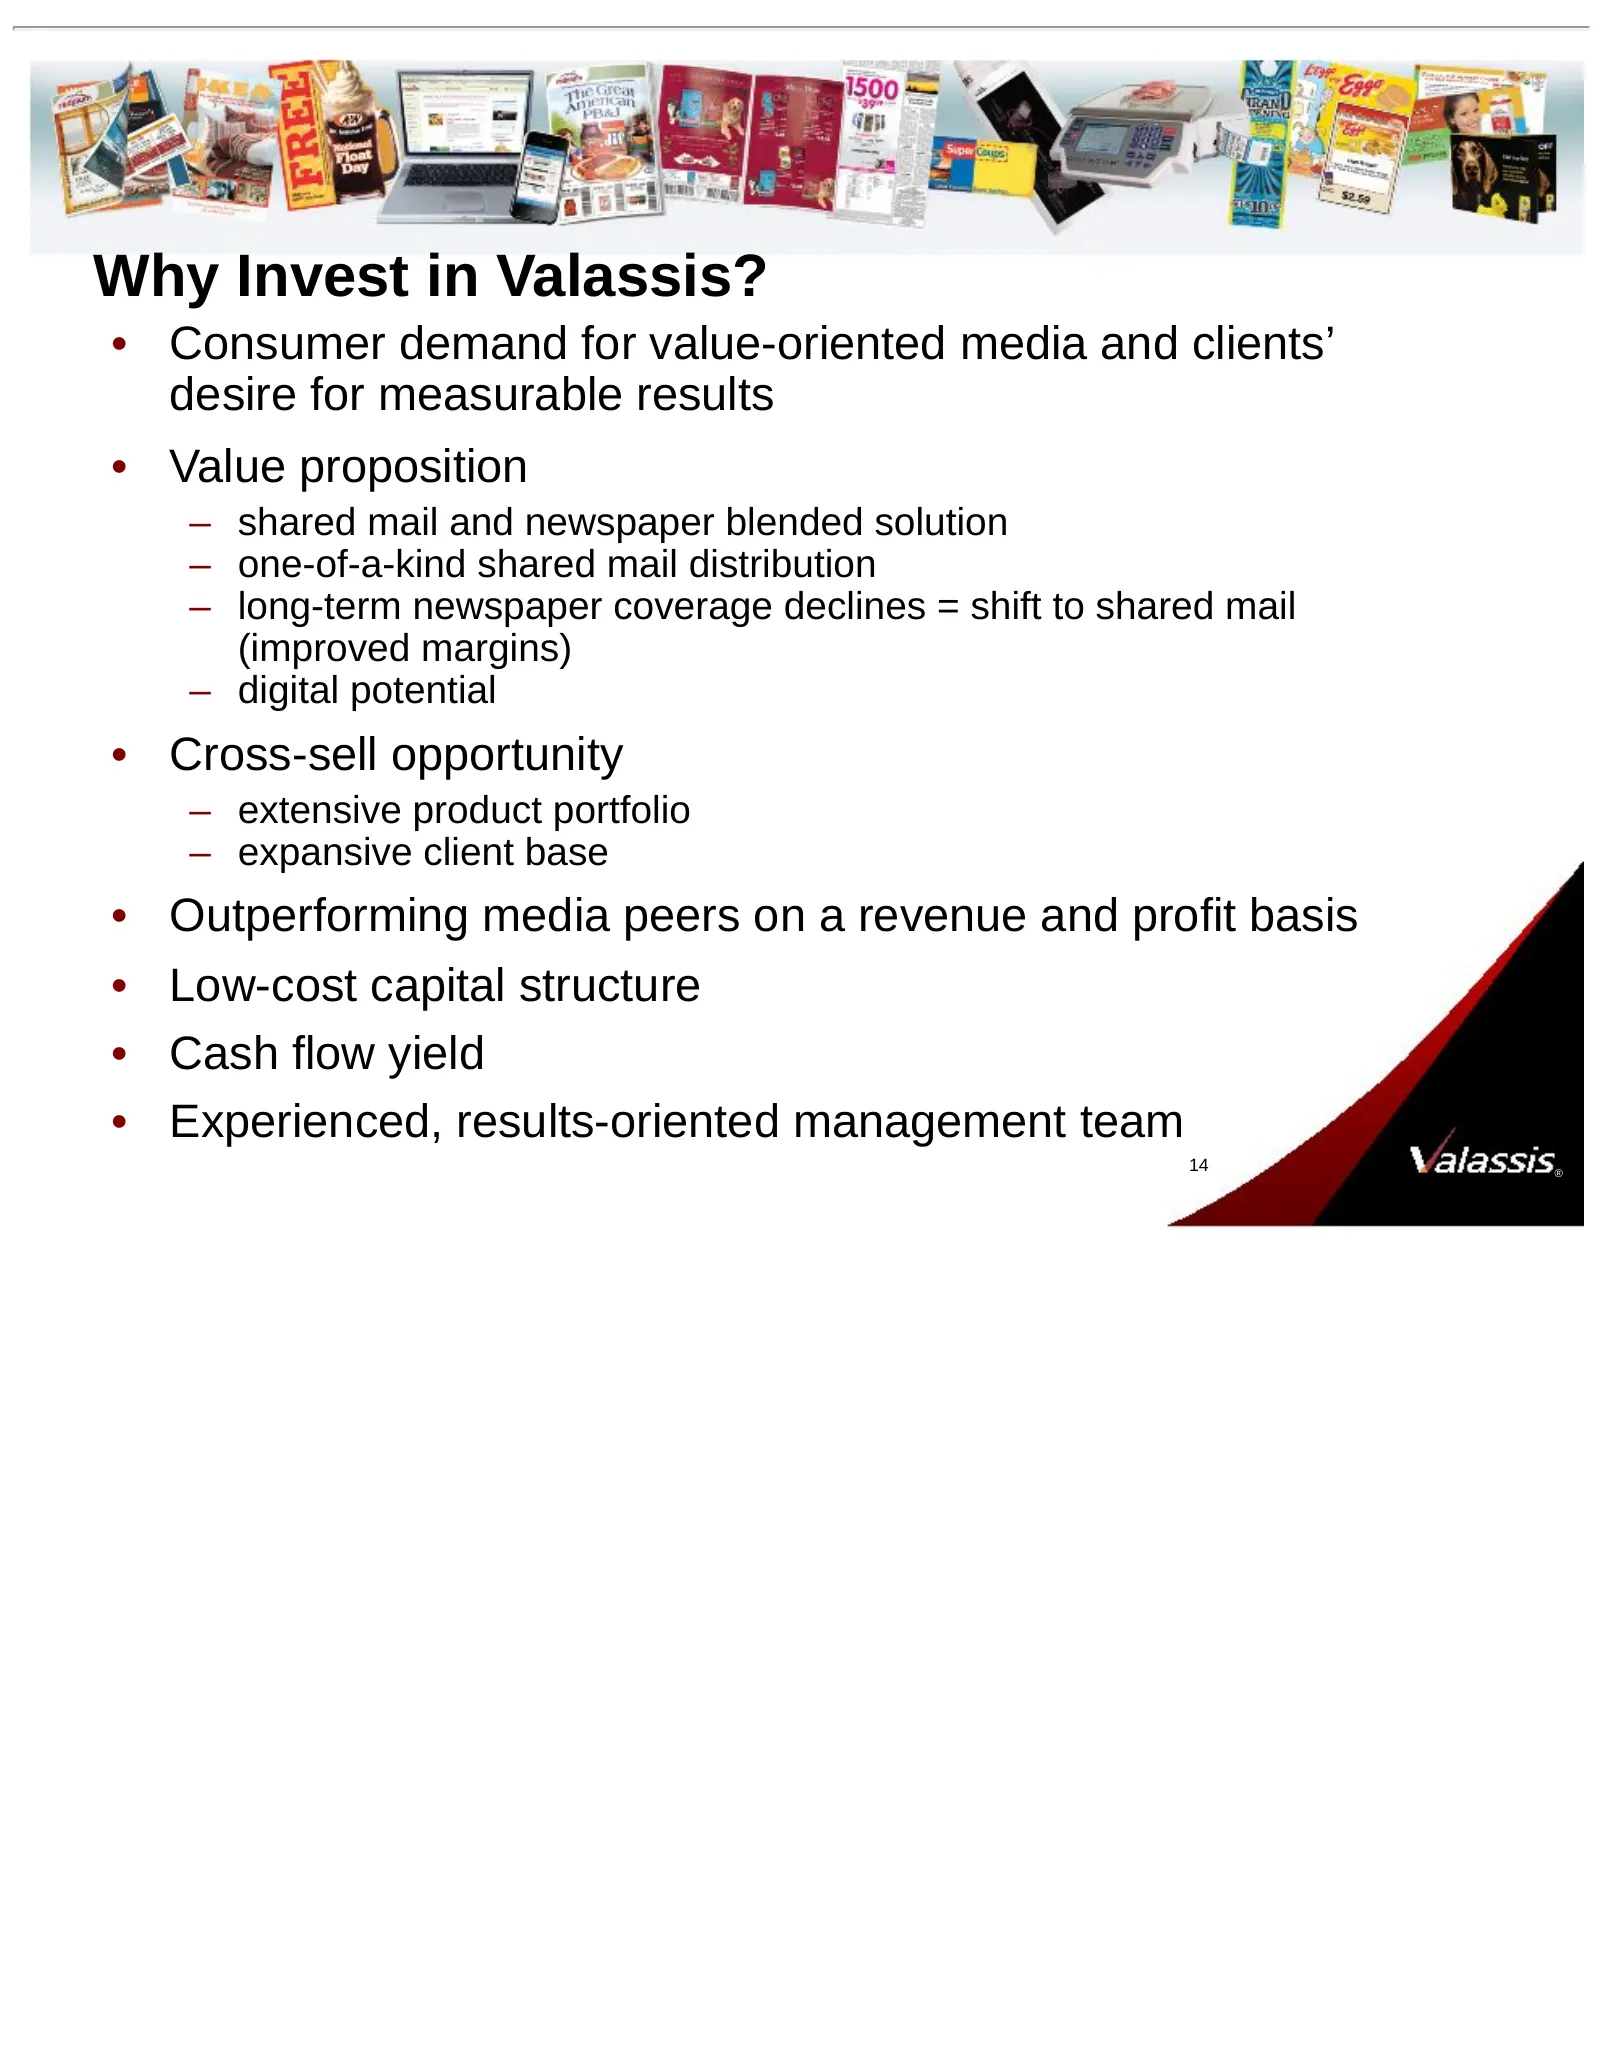
Why Invest in Valassis? • Consumer demand for value-oriented media and clients’ desire for measurable results • Value proposition – shared mail and newspaper blended solution – one-of-a-kind shared mail distribution – long-term newspaper coverage declines = shift to shared mail (improved margins) –
Slide 15: Appendix
Appendix ®
Slide 16: Reconciliation of Non-GAAP Measure
Reconciliation of Non-GAAP Measure Non-GAAP Financial Measures *We define adjusted EBITDA as earnings before net interest expense, other non-cash expenses (income), net, income taxes, depreciation, amortization, stock-based compensation expense associated with SFAS No. 123R, non-recurring restructur
Slide 17: Adjusted EBITDA to Net Earnings and Cash Flow from Operations
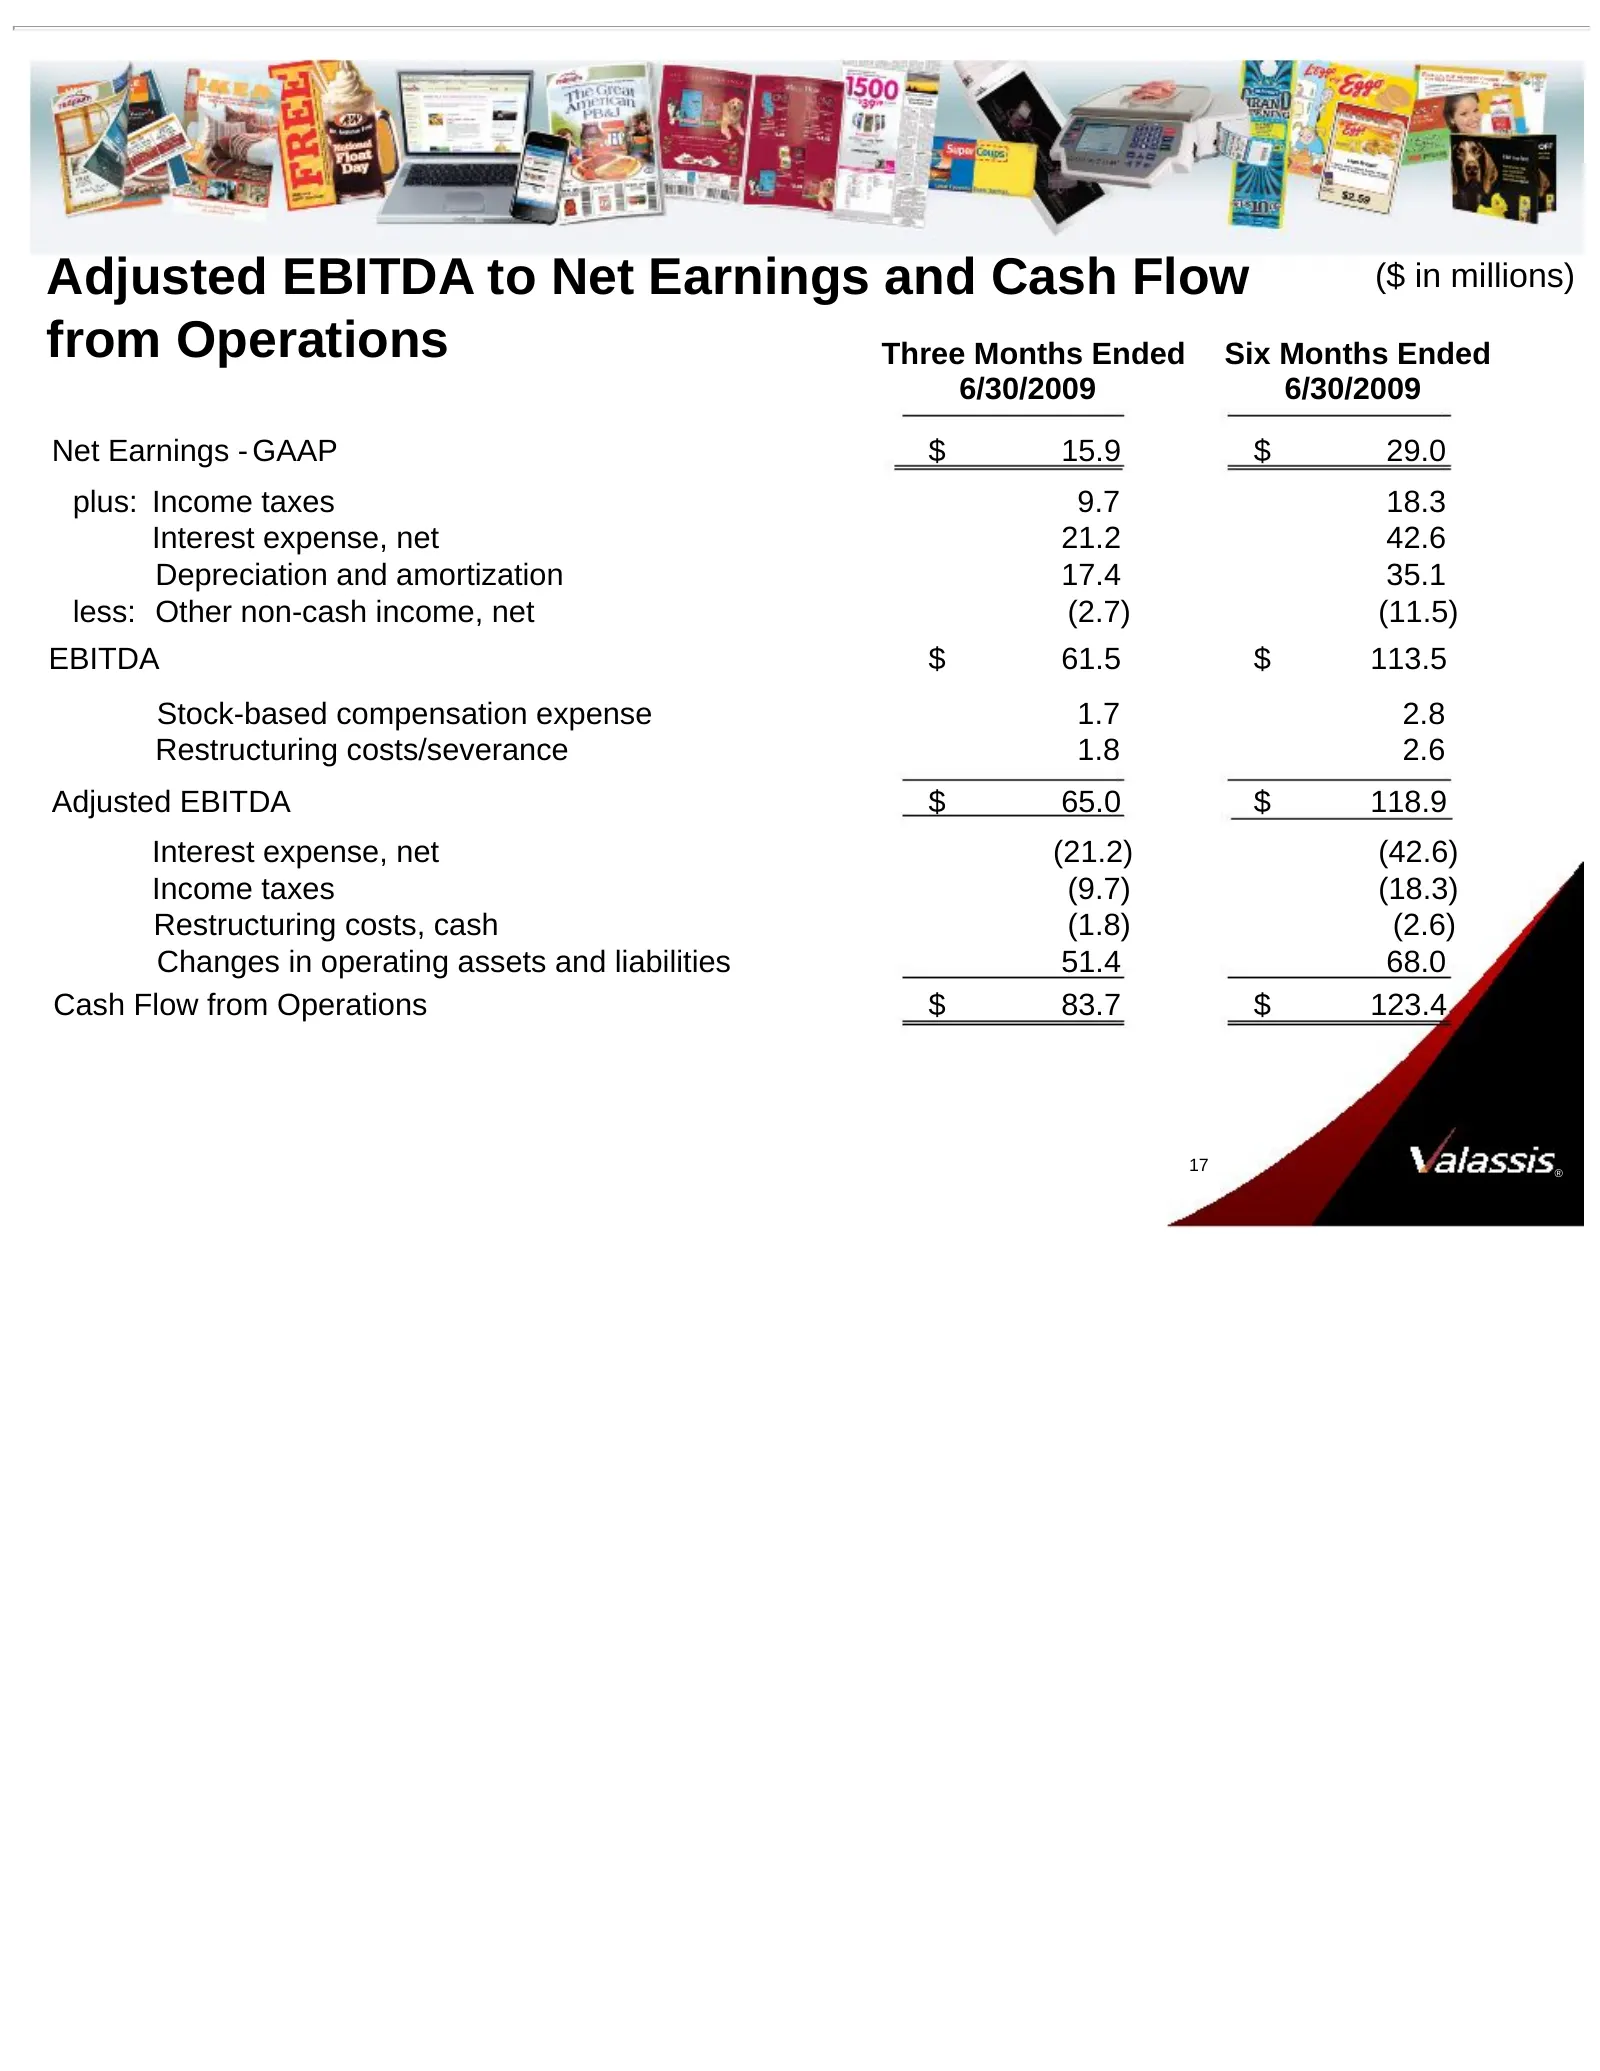
Adjusted EBITDA to Net Earnings and Cash Flow ($ in millions) from Operations Three Months Ended Six Months Ended 6/30/2009 6/30/2009 Net Earnings - GAAP $ 15.9 $ 29.0 plus: Income taxes 9.7 18.3 Interest expense, net 21.2 42.6 Depreciation and amortization 17.4 35.1 less: Other non-cash income, net
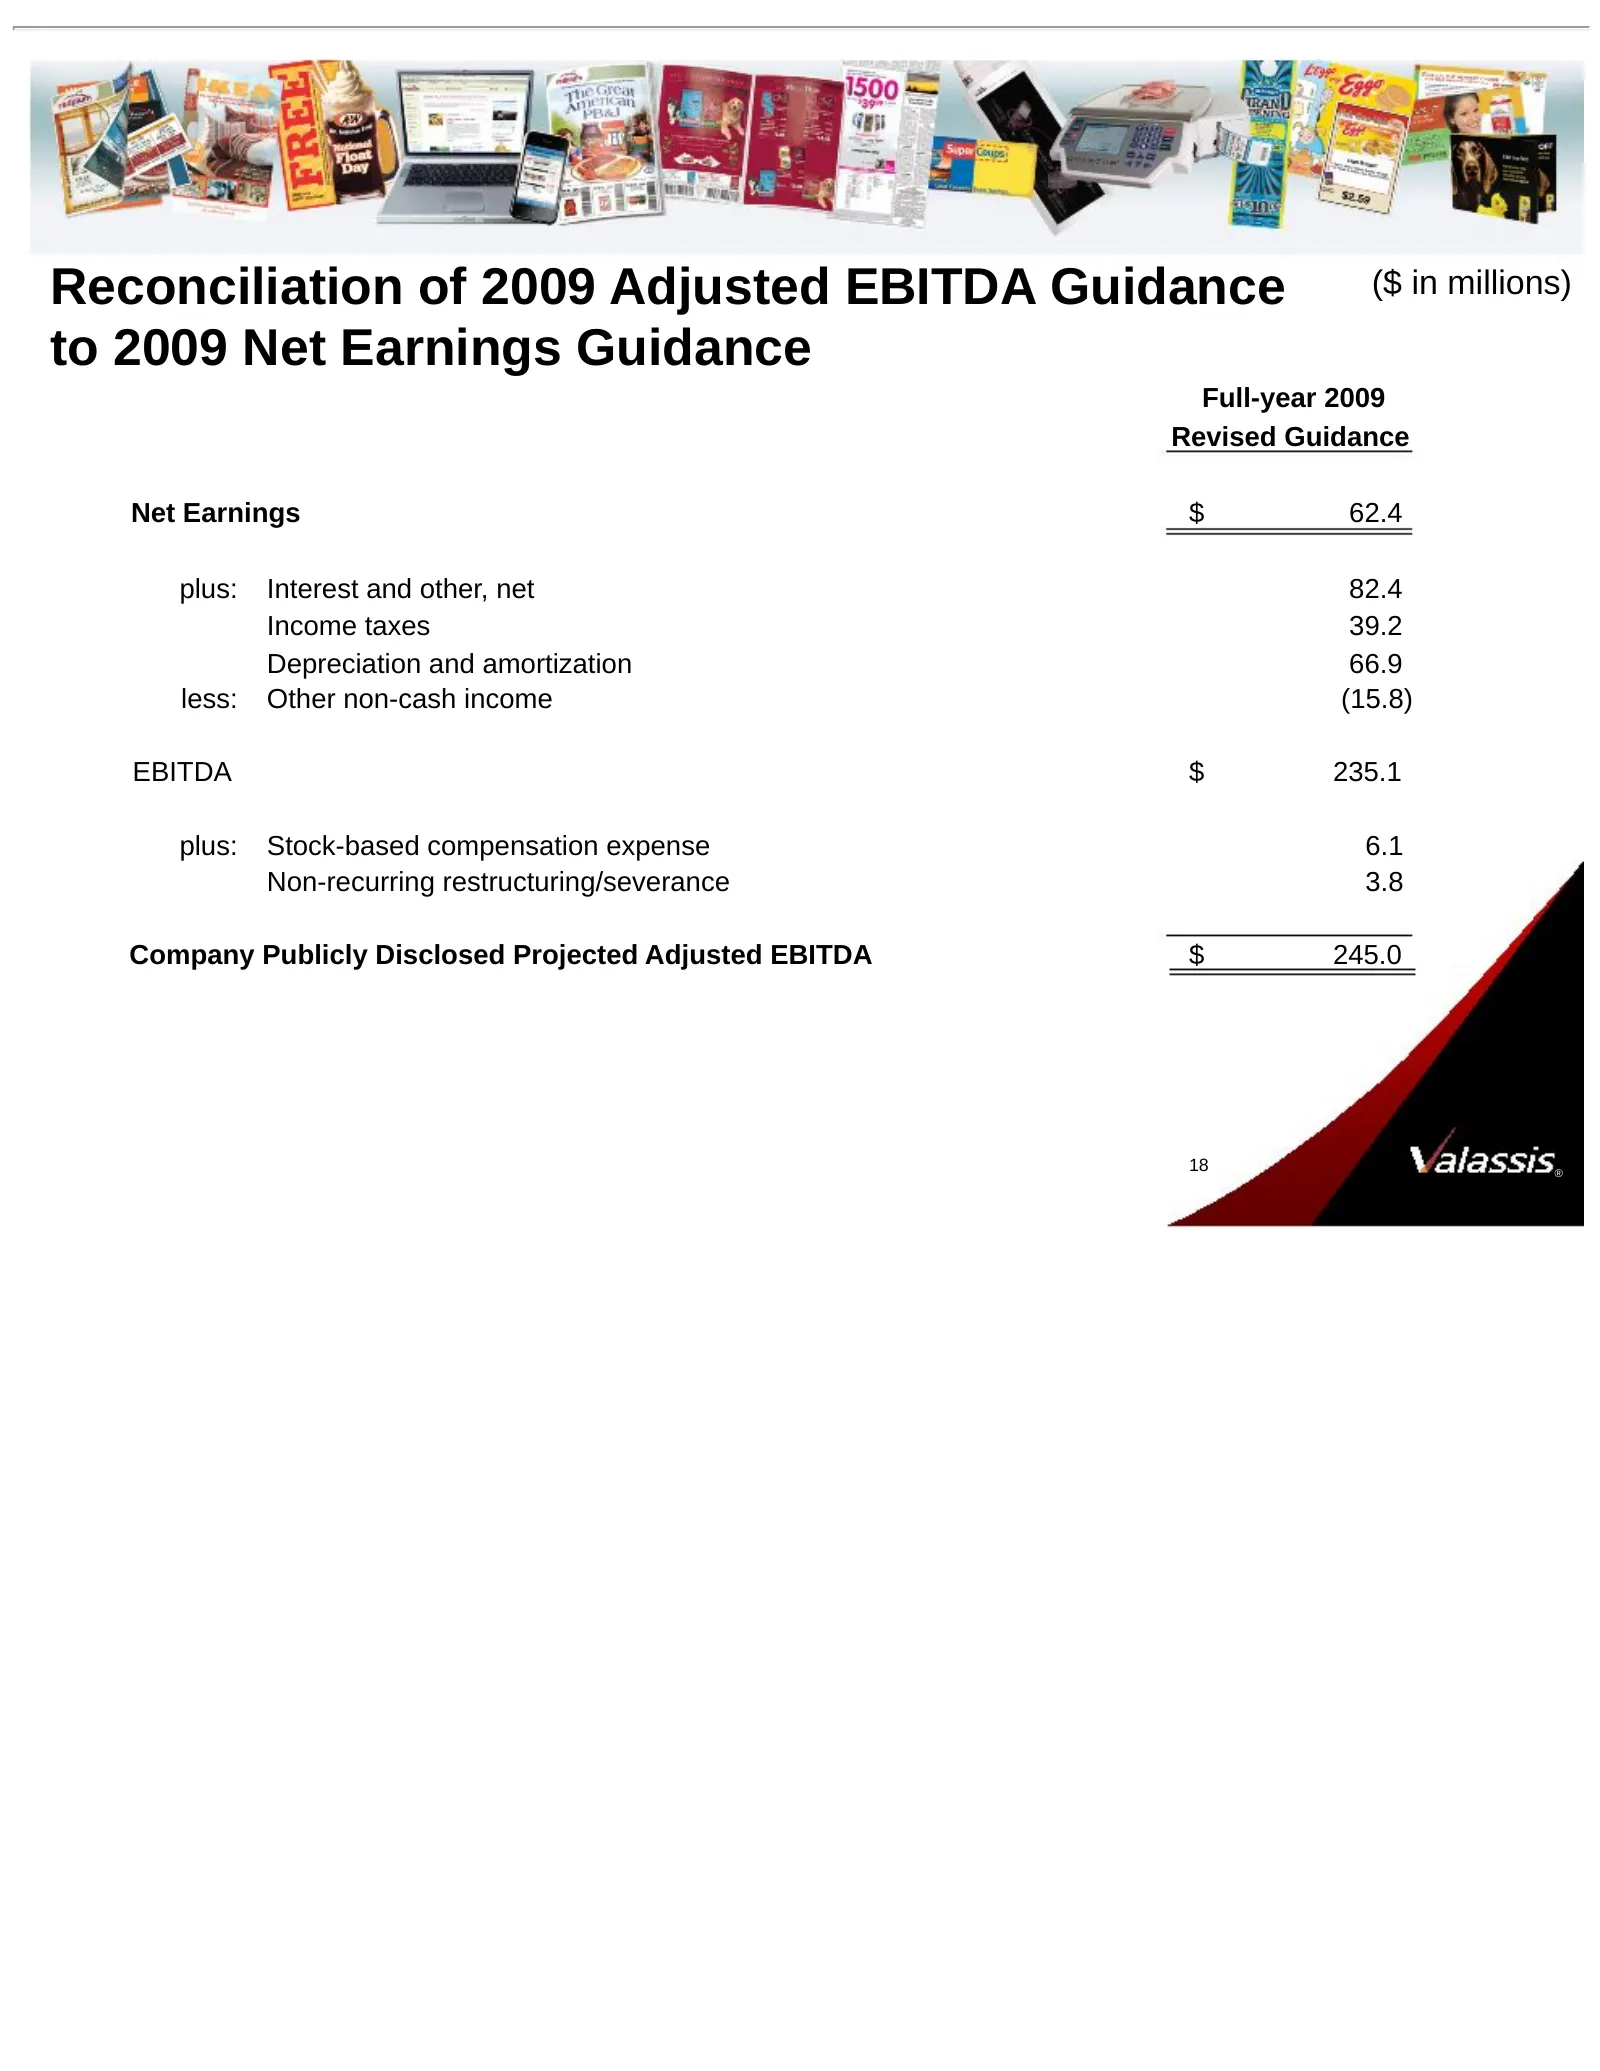
Slide 18: Reconciliation of 2009 Adjusted EBITDA Guidance to Net Earnings Guidance
Reconciliation of 2009 Adjusted EBITDA Guidance ($ in millions) to 2009 Net Earnings Guidance Full-year 2009 Revised Guidance Net Earnings $ 62.4 plus: Interest and other, net 82.4 Income taxes 39.2 Depreciation and amortization 66.9 less: Other non-cash income (15.8) EBITDA $ 235.1 plus: Stock-base

Slide 19: Delivering Value to Consumers – how, when and where they want
Delivering Value to Consumers – how, when and where they want Deutsche Bank Leveraged Finance Conference October 1, 2009 ®
Source: SEC EDGAR · 8-K filed Oct 2, 2009
More decks from Valassis Communications Inc
 Investor Presentation (August 2011)23 slides · Aug 15, 2011
 Investor Day (September 2010)123 slides · Sep 30, 2010
 Investor Presentation (November 2009)17 slides · Nov 2, 2009
 J.P. Morgan SMid Cap Conference 200822 slides · Dec 9, 2008
 Deutsche Bank Leveraged Finance Conference 200822 slides · Sep 24, 2008
 Investor Presentation (September 2007)19 slides · Sep 6, 2007