Chaparral Energy — Cowen Energy & Natural Resources Conference 2017
41 slides from Chaparral Energy's conference presentation, Dec 4, 2017
Slide 1: Cowen Energy & Natural Resources Conference, December 2017
December, 2017 Cowen Energy & Natural Resources Conference Exhibit 99.1
Slide 2: Forward-Looking Statements and Risk Factors
Statements made in these presentation slides and by representatives of Chaparral Energy (“Chaparral” or the “company”) during the course of this presentation that are not historical facts are “forward-looking statements.” These statements are based on certain assumptions and expectations made by the
Slide 3: General Overview
General Overview
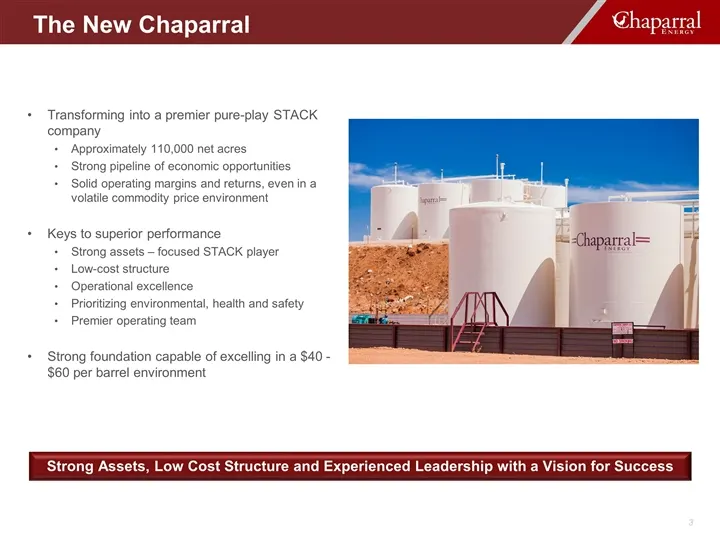
Slide 4: The New Chaparral
Transforming into a premier pure-play STACK company Approximately 110,000 net acres Strong pipeline of economic opportunities Solid operating margins and returns, even in a volatile commodity price environment Keys to superior performance Strong assets – focused STACK player Low-cost structure Opera
Slide 5: Recent Achievements
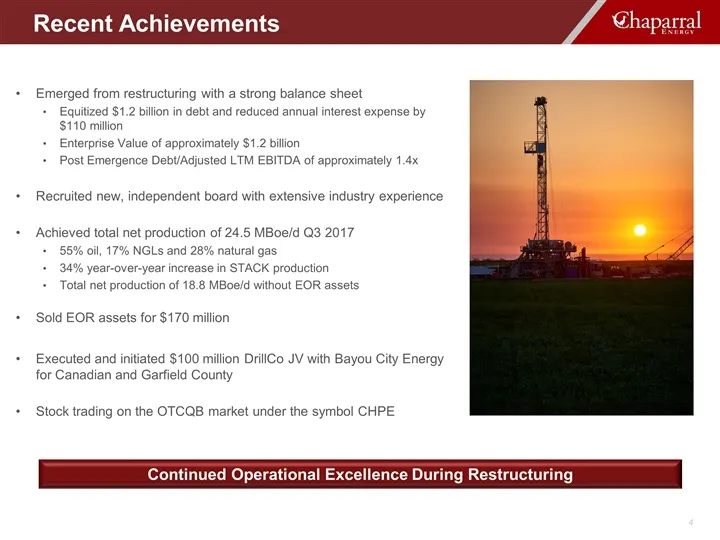
Emerged from restructuring with a strong balance sheet Equitized $1.2 billion in debt and reduced annual interest expense by $110 million Enterprise Value of approximately $1.2 billion Post Emergence Debt/Adjusted LTM EBITDA of approximately 1.4x Recruited new, independent board with extensive indus
Slide 6: Year End 2016 SEC Proved Reserves
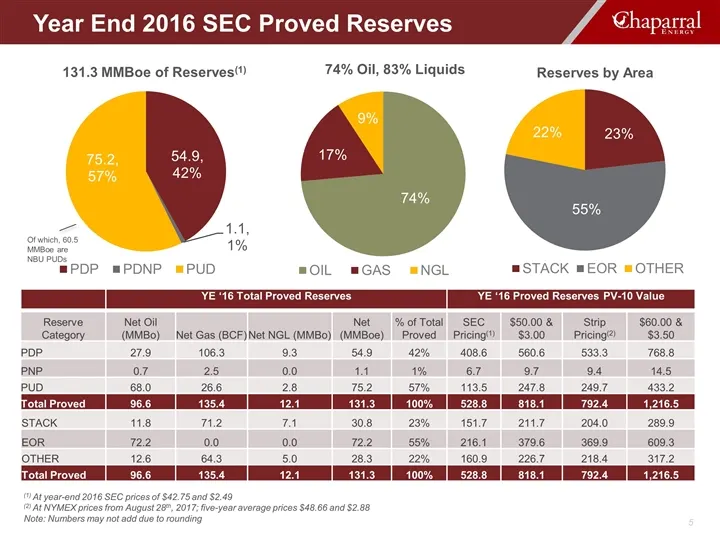
YE ‘16 Total Proved Reserves YE ‘16 Proved Reserves PV-10 Value Reserve Category Net Oil (MMBo) Net Gas (BCF) Net NGL (MMBo) Net (MMBoe) % of Total Proved SEC Pricing(1) $50.00 & $3.00 Strip Pricing(2) $60.00 & $3.50 PDP 27.9 106.3 9.3 54.9 42% 408.6 560.6 533.3 768.8 PNP 0.7 2.5 0.0 1.1 1% 6.7 9.7
Slide 7: 2018 Strategy
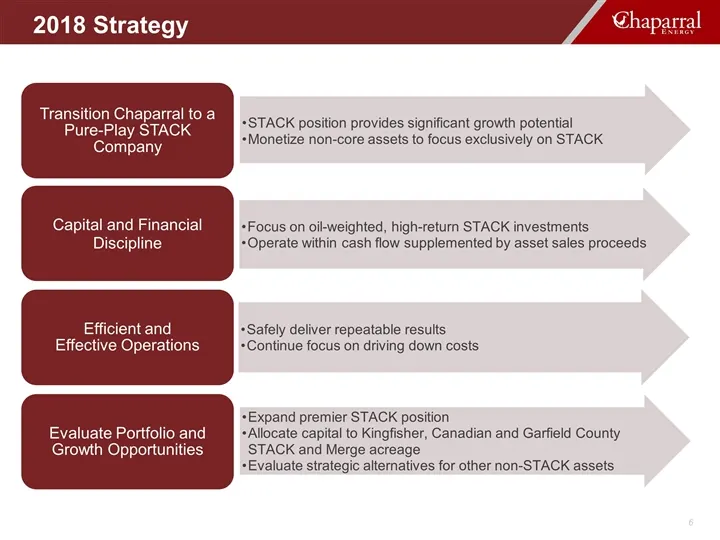
2018 Strategy Transition Chaparral to a Pure-Play STACK Company Efficient and Effective Operations Continue focus on driving down costs Evaluate Portfolio and Growth Opportunities STACK position provides significant growth potential Safely deliver repeatable results Expand premier STACK position Mon
Slide 8: 2017 Oil & Gas Capital Budget Summary
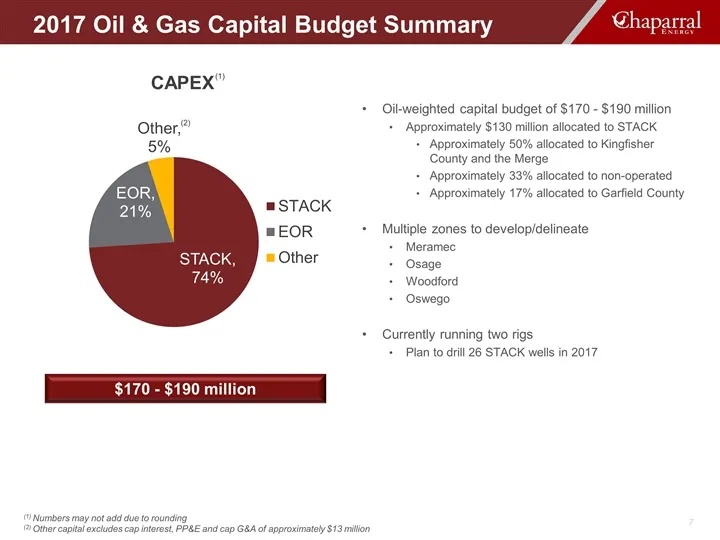
Oil-weighted capital budget of $170 - $190 million Approximately $130 million allocated to STACK Approximately 50% allocated to Kingfisher County and the Merge Approximately 33% allocated to non-operated Approximately 17% allocated to Garfield County Multiple zones to develop/delineate Meramec Osage
Slide 9: 2017 Production Guidance
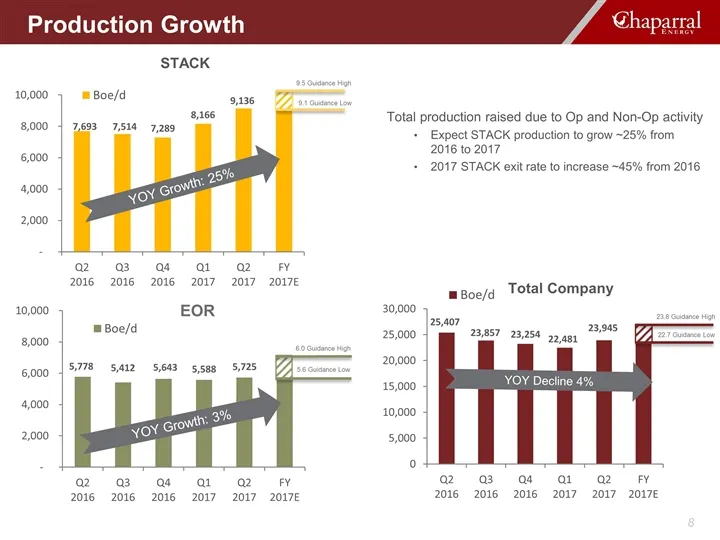
Total production raised due to Op and Non-Op activity Expect STACK production to grow ~25% from 2016 to 2017 2017 STACK exit rate to increase ~45% from 2016 Total Company EOR YOY Decline 4% Production Growth STACK YOY Growth: 25% 9.1 Guidance Low 9.5 Guidance High 22.7 Guidance Low 23.8 Guidance Hig
Slide 10: Asset Overview
Asset Overview
Slide 11: Asset Overview
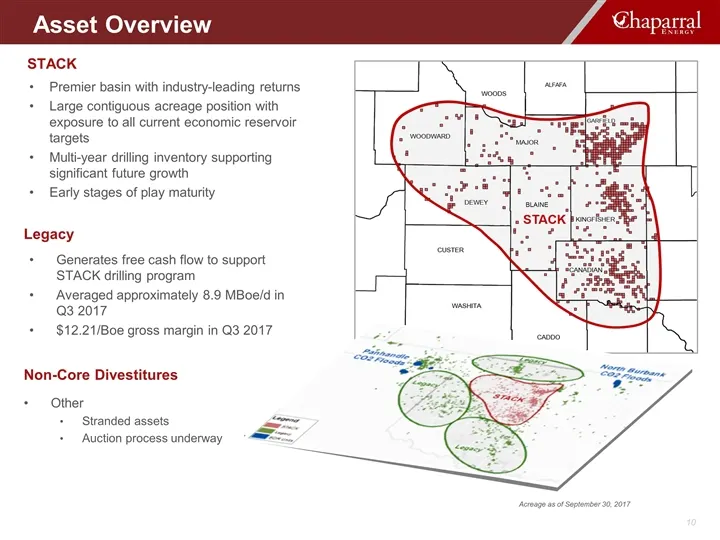
Other Stranded assets Auction process underway Premier basin with industry-leading returns Large contiguous acreage position with exposure to all current economic reservoir targets Multi-year drilling inventory supporting significant future growth Early stages of play maturity STACK Generates free c
Slide 12: Asset Overview: STACK Overview
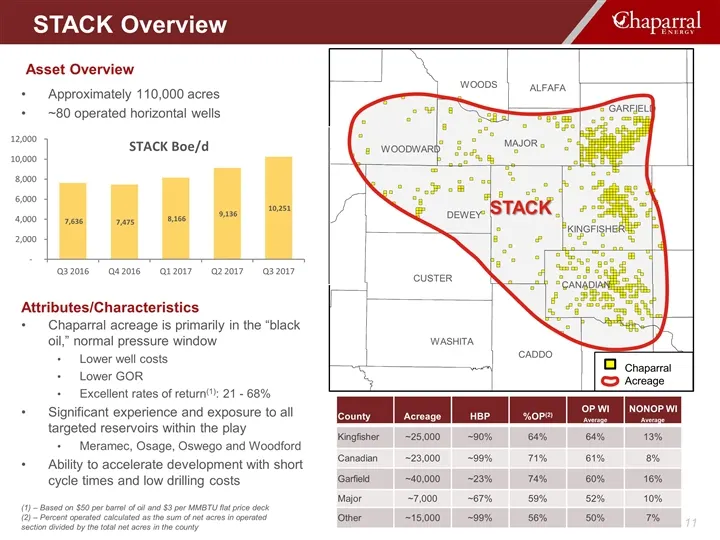
Asset Overview County Acreage HBP %OP(2) OP WI Average NONOP WI Average Kingfisher ~25,000 ~90% 64% 64% 13% Canadian ~23,000 ~99% 71% 61% 8% Garfield ~40,000 ~23% 74% 60% 16% Major ~7,000 ~67% 59% 52% 10% Other ~15,000 ~99% 56% 50% 7% Chaparral acreage is primarily in the “black oil,” normal pressur
Slide 13: STACK Attributes
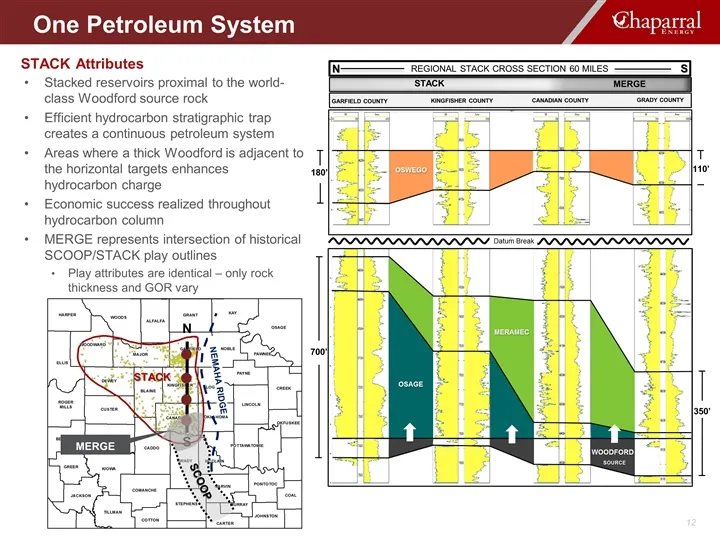
Stacked reservoirs proximal to the world-class Woodford source rock Efficient hydrocarbon stratigraphic trap creates a continuous petroleum system Areas where a thick Woodford is adjacent to the horizontal targets enhances hydrocarbon charge Economic success realized throughout hydrocarbon column ME
Slide 14: STACK Drilling Joint Venture
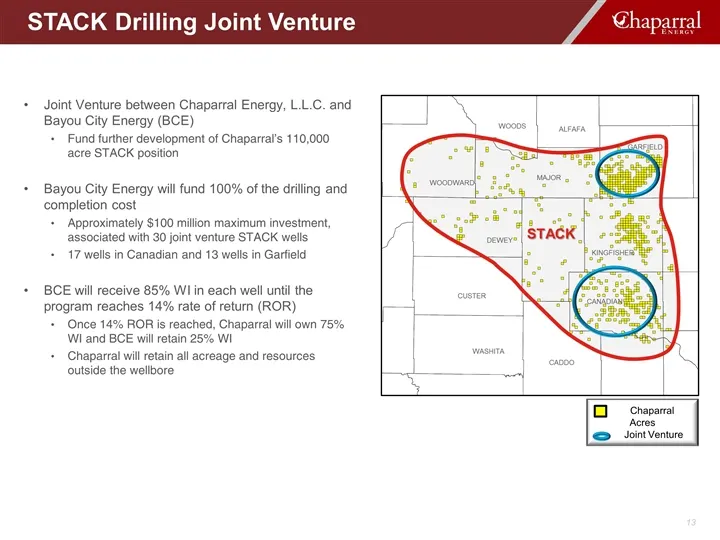
STACK Drilling Joint Venture Joint Venture between Chaparral Energy, L.L.C. and Bayou City Energy (BCE) Fund further development of Chaparral’s 110,000 acre STACK position Bayou City Energy will fund 100% of the drilling and completion cost Approximately $100 million maximum investment, associated w
Slide 15: STACK Kingfisher County Overview
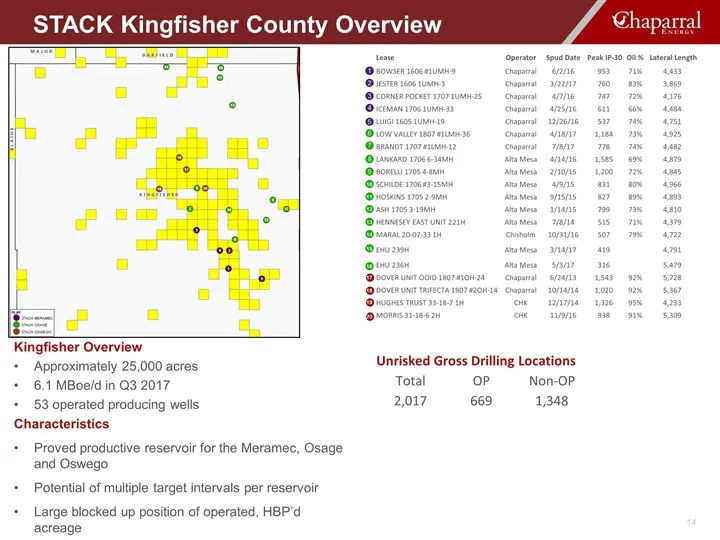
STACK Kingfisher County Overview Kingfisher Overview Approximately 25,000 acres 6.1 MBoe/d in Q3 2017 53 operated producing wells Characteristics Proved productive reservoir for the Meramec, Osage and Oswego Potential of multiple target intervals per reservoir Large blocked up position of operated,
Slide 16: STACK Canadian County Overview
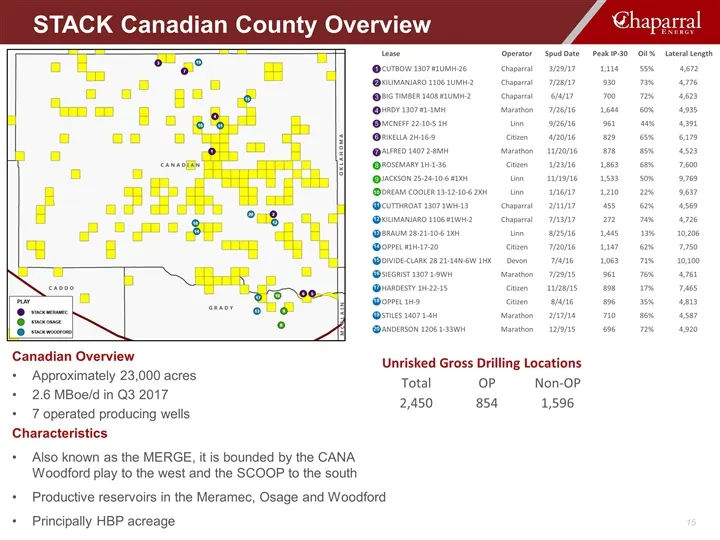
Canadian Overview Approximately 23,000 acres 2.6 MBoe/d in Q3 2017 7 operated producing wells Characteristics Also known as the MERGE, it is bounded by the CANA Woodford play to the west and the SCOOP to the south Productive reservoirs in the Meramec, Osage and Woodford Principally HBP acreage STACK
Slide 17: STACK Garfield County Overview
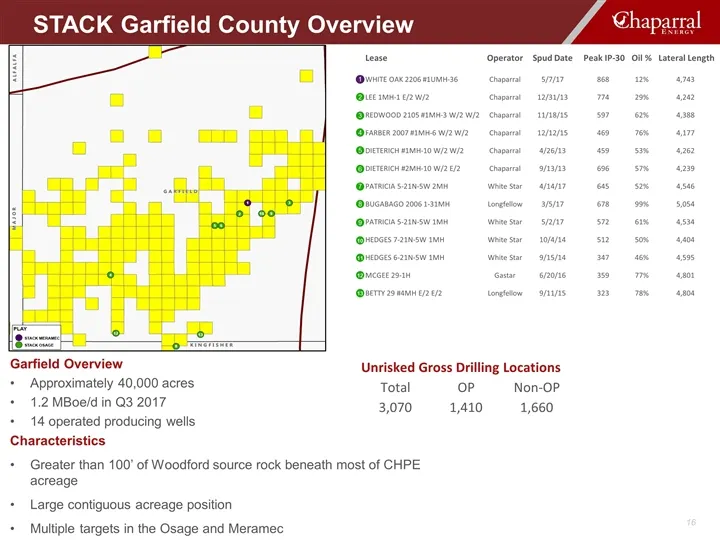
Garfield Overview Approximately 40,000 acres 1.2 MBoe/d in Q3 2017 14 operated producing wells Characteristics Greater than 100’ of Woodford source rock beneath most of CHPE acreage Large contiguous acreage position Multiple targets in the Osage and Meramec STACK Garfield County Overview Unrisked Gr
Slide 18: Recent STACK Transactions
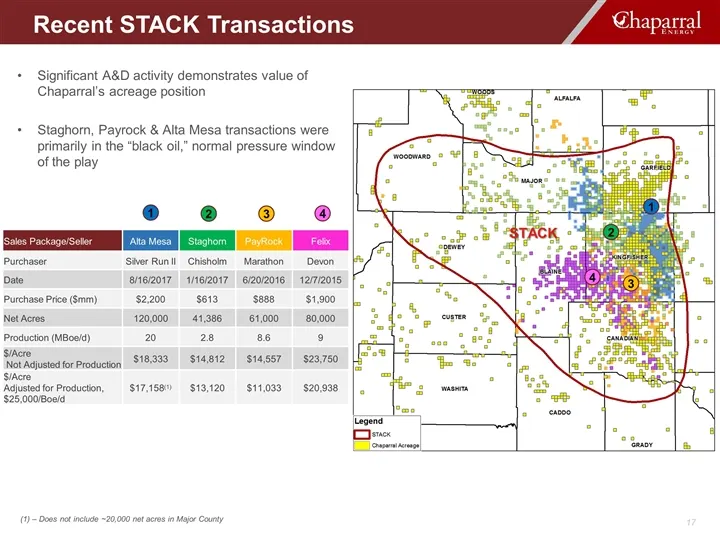
Significant A&D activity demonstrates value of Chaparral’s acreage position Staghorn, Payrock & Alta Mesa transactions were primarily in the “black oil,” normal pressure window of the play 2 3 4 4 3 2 Recent STACK Transactions 1 1 (1) – Does not include ~20,000 net acres in Major County Sales Packag
Slide 19: Multi-Year Inventory Across STACK
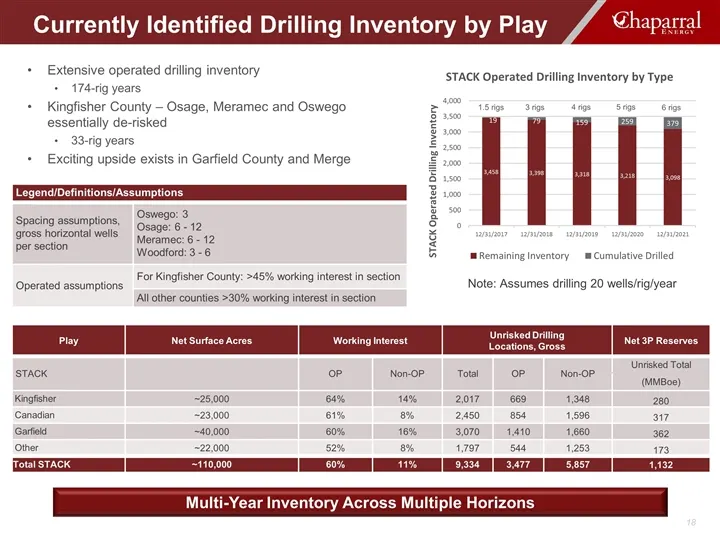
Extensive operated drilling inventory 174-rig years Kingfisher County – Osage, Meramec and Oswego essentially de-risked 33-rig years Exciting upside exists in Garfield County and Merge Legend/Definitions/Assumptions Spacing assumptions, gross horizontal wells per section Oswego: 3 Osage: 6 - 12 Mera
Slide 20: Chaparral Well Performance in STACK
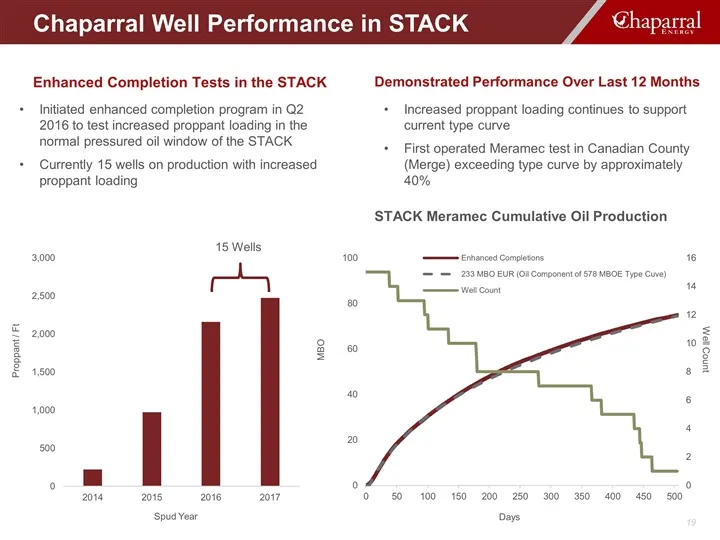
Chaparral Well Performance in STACK Enhanced Completion Tests in the STACK Initiated enhanced completion program in Q2 2016 to test increased proppant loading in the normal pressured oil window of the STACK Currently 15 wells on production with increased proppant loading MBO Demonstrated Performance
Slide 21: Operational Excellence – Drilling and Completions
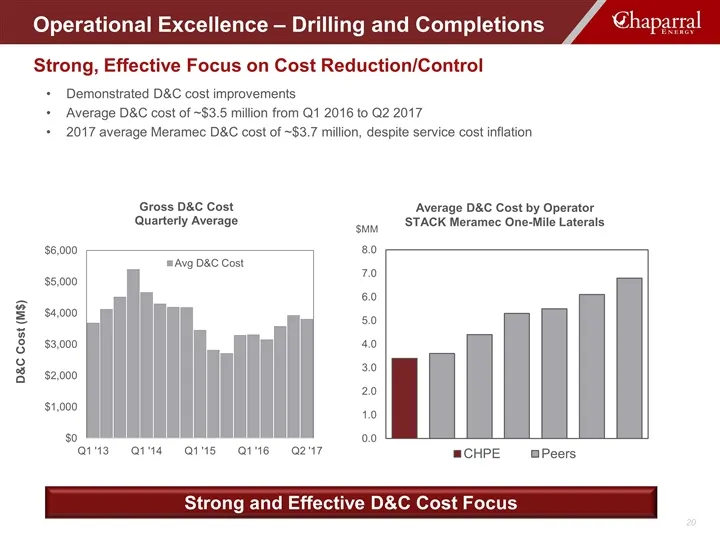
Operational Excellence – Drilling and Completions Strong, Effective Focus on Cost Reduction/Control Demonstrated D&C cost improvements Average D&C cost of ~$3.5 million from Q1 2016 to Q2 2017 2017 average Meramec D&C cost of ~$3.7 million, despite service cost inflation Average D&C Cost by Operator
Slide 22: Non-Core Legacy Asset Overview
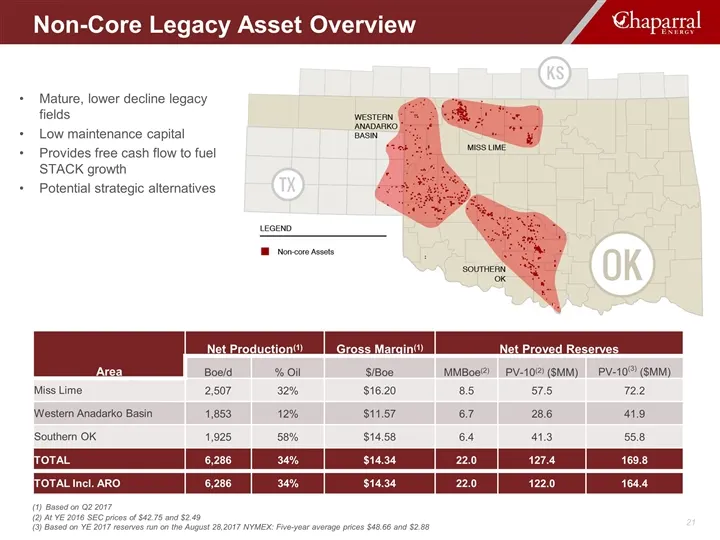
Mature, lower decline legacy fields Low maintenance capital Provides free cash flow to fuel STACK growth Potential strategic alternatives Area Net Production(1) Gross Margin(1) Net Proved Reserves Boe/d % Oil $/Boe MMBoe(2) PV-10(2) ($MM) PV-10(3) ($MM) Miss Lime 2,507 32% $16.20 8.5 57.5 72.2 Weste
Slide 23: Financial Overview
Financial Overview
Slide 24: Financial Strategy
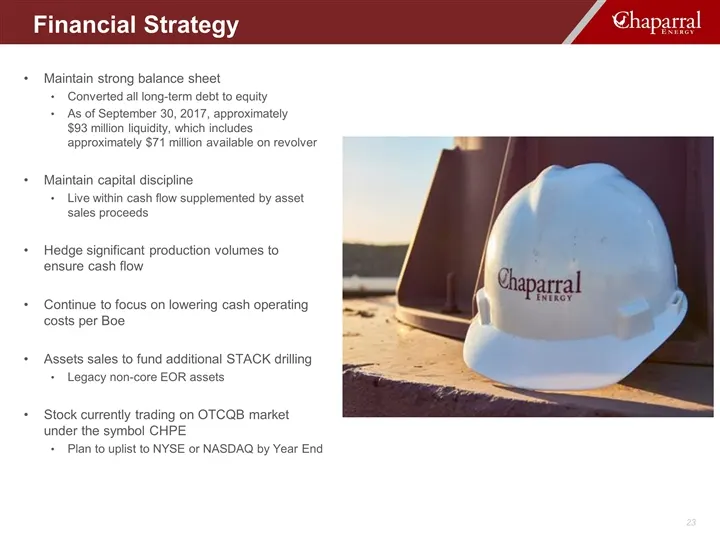
Maintain strong balance sheet Converted all long-term debt to equity As of September 30, 2017, approximately $93 million liquidity, which includes approximately $71 million available on revolver Maintain capital discipline Live within cash flow supplemented by asset sales proceeds Hedge significant
Slide 25: Financial Position and Liquidity Post EOR Sale
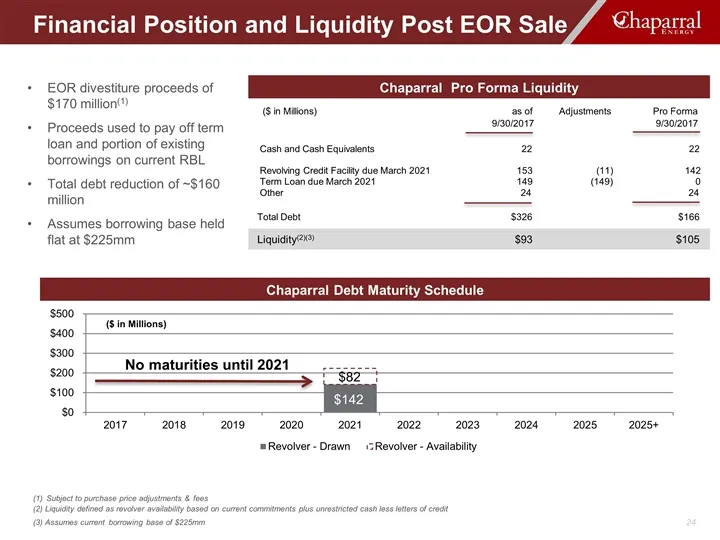
Financial Position and Liquidity Post EOR Sale EOR divestiture proceeds of $170 million(1) Proceeds used to pay off term loan and portion of existing borrowings on current RBL Total debt reduction of ~$160 million Assumes borrowing base held flat at $225mm Chaparral Pro Forma Liquidity ($ in Million
Slide 26: Hedging Strategy
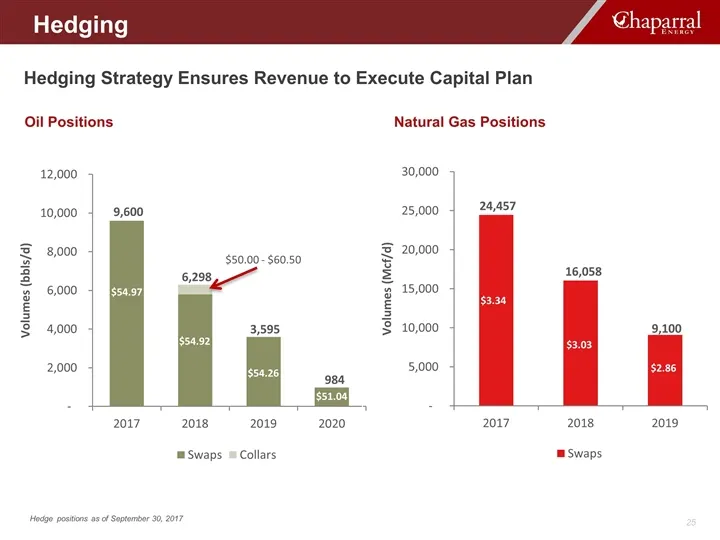
Hedging Strategy Ensures Revenue to Execute Capital Plan Oil Positions Natural Gas Positions Hedge positions as of September 30, 2017 Hedging $54.92 $50.00 - $60.50 $54.97 $54.26 $51.04
Slide 27: Why Chaparral?
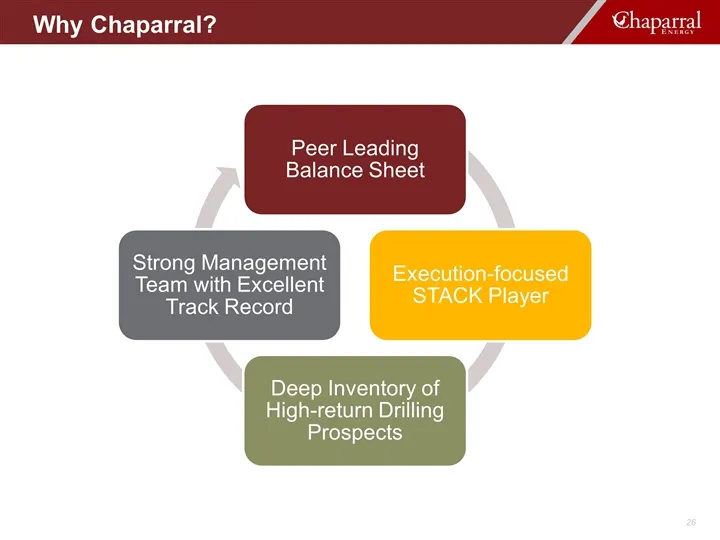
Why Chaparral? Why Chaparral? Peer Leading Balance Sheet Execution-focused STACK Player Deep Inventory of High-return Drilling Prospects Strong Management Team with Excellent Track Record

Slide 28: Appendix
Appendix
Slide 29: Type Curve Parameters
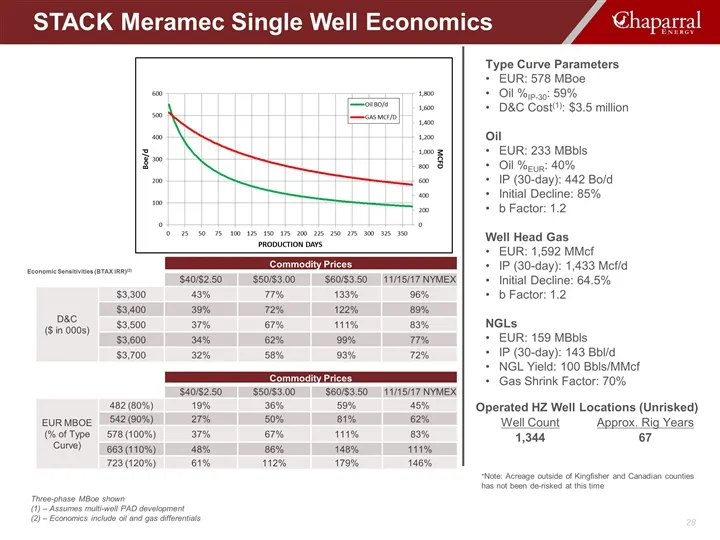
Type Curve Parameters EUR: 578 MBoe Oil %IP-30: 59% D&C Cost(1): $3.5 million Oil EUR: 233 MBbls Oil %EUR: 40% IP (30-day): 442 Bo/d Initial Decline: 85% b Factor: 1.2 Well Head Gas EUR: 1,592 MMcf IP (30-day): 1,433 Mcf/d Initial Decline: 64.5% b Factor: 1.2 NGLs EUR: 159 MBbls IP (30-day): 143 Bbl
Slide 30: Type Curve Parameters
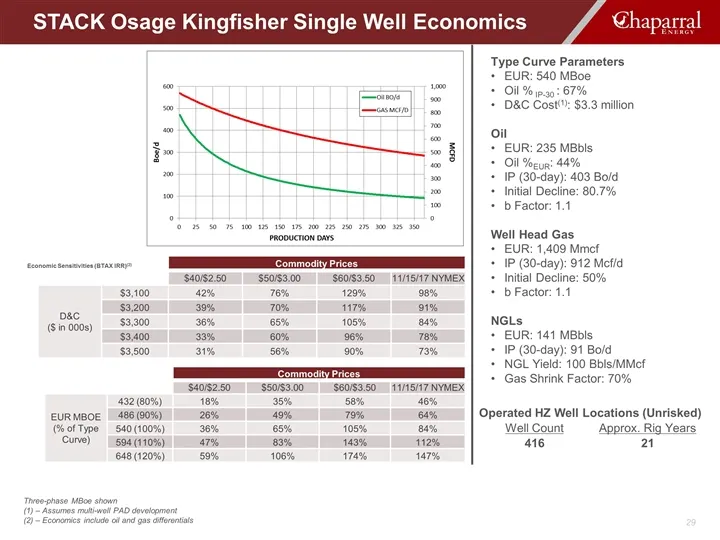
Type Curve Parameters EUR: 540 MBoe Oil % IP-30 : 67% D&C Cost(1): $3.3 million Oil EUR: 235 MBbls Oil %EUR: 44% IP (30-day): 403 Bo/d Initial Decline: 80.7% b Factor: 1.1 Well Head Gas EUR: 1,409 Mmcf IP (30-day): 912 Mcf/d Initial Decline: 50% b Factor: 1.1 NGLs EUR: 141 MBbls IP (30-day): 91 Bo/d
Slide 31: Type Curve Parameters
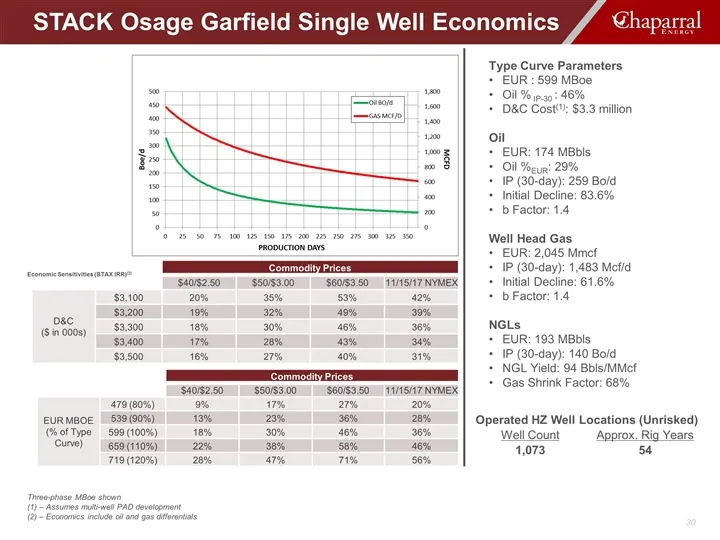
Type Curve Parameters EUR : 599 MBoe Oil % IP-30 : 46% D&C Cost(1): $3.3 million Oil EUR: 174 MBbls Oil %EUR: 29% IP (30-day): 259 Bo/d Initial Decline: 83.6% b Factor: 1.4 Well Head Gas EUR: 2,045 Mmcf IP (30-day): 1,483 Mcf/d Initial Decline: 61.6% b Factor: 1.4 NGLs EUR: 193 MBbls IP (30-day): 14
Slide 32: Type Curve Parameters
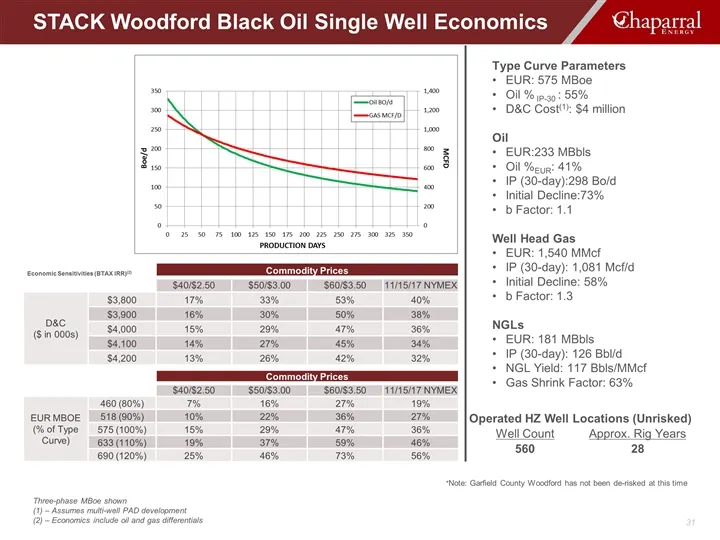
Type Curve Parameters EUR: 575 MBoe Oil % IP-30 : 55% D&C Cost(1): $4 million Oil EUR:233 MBbls Oil %EUR: 41% IP (30-day):298 Bo/d Initial Decline:73% b Factor: 1.1 Well Head Gas EUR: 1,540 MMcf IP (30-day): 1,081 Mcf/d Initial Decline: 58% b Factor: 1.3 NGLs EUR: 181 MBbls IP (30-day): 126 Bbl/d NG
Slide 33: Type Curve Parameters
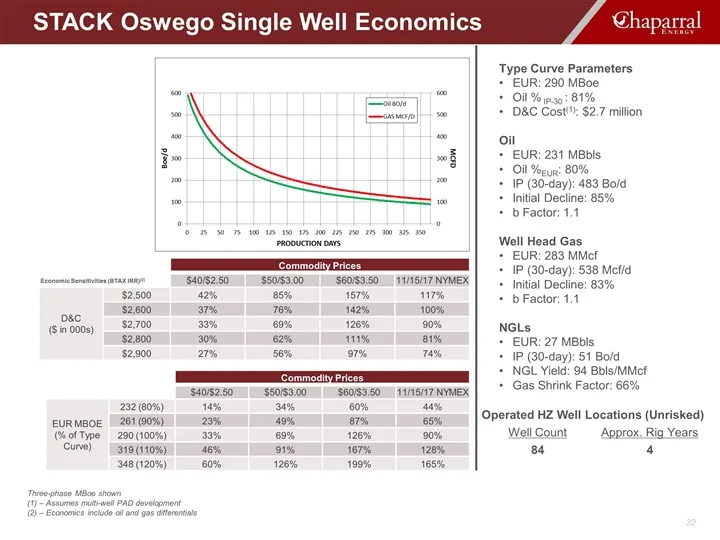
Type Curve Parameters EUR: 290 MBoe Oil % IP-30 : 81% D&C Cost(1): $2.7 million Oil EUR: 231 MBbls Oil %EUR: 80% IP (30-day): 483 Bo/d Initial Decline: 85% b Factor: 1.1 Well Head Gas EUR: 283 MMcf IP (30-day): 538 Mcf/d Initial Decline: 83% b Factor: 1.1 NGLs EUR: 27 MBbls IP (30-day): 51 Bo/d NGL
Slide 34: 2017 Guidance
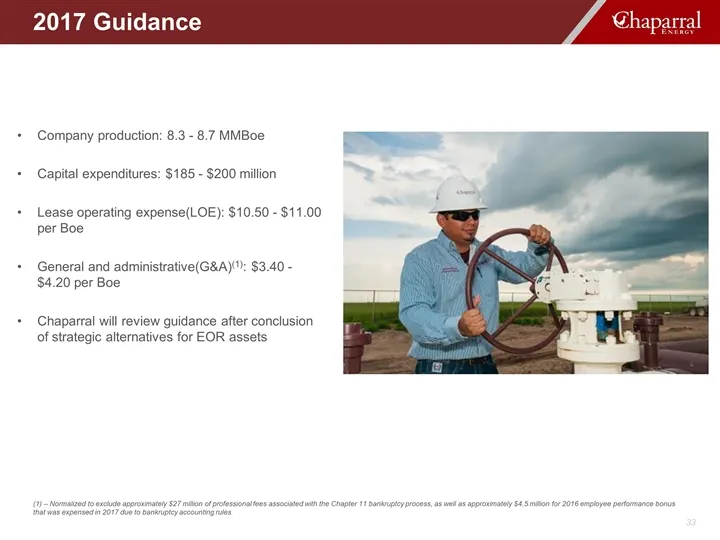
Company production: 8.3 - 8.7 MMBoe Capital expenditures: $185 - $200 million Lease operating expense(LOE): $10.50 - $11.00 per Boe General and administrative(G&A)(1): $3.40 - $4.20 per Boe Chaparral will review guidance after conclusion of strategic alternatives for EOR assets 2017 Guidance (1) – N
Slide 35: Contact Information
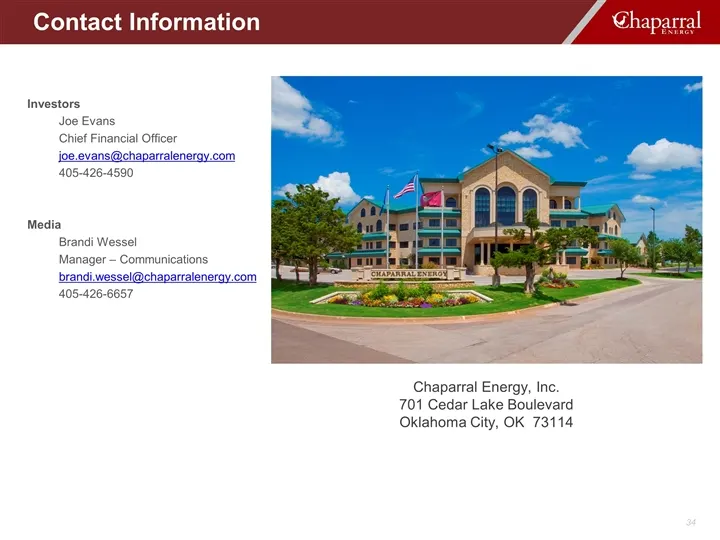
Investors Joe Evans Chief Financial Officer [email protected] 405-426-4590 Media Brandi Wessel Manager – Communications [email protected] 405-426-6657 Contact Information Contact Information Chaparral Energy, Inc. 701 Cedar Lake Boulevard Oklahoma City, OK 73114
Slide 36: Management Team
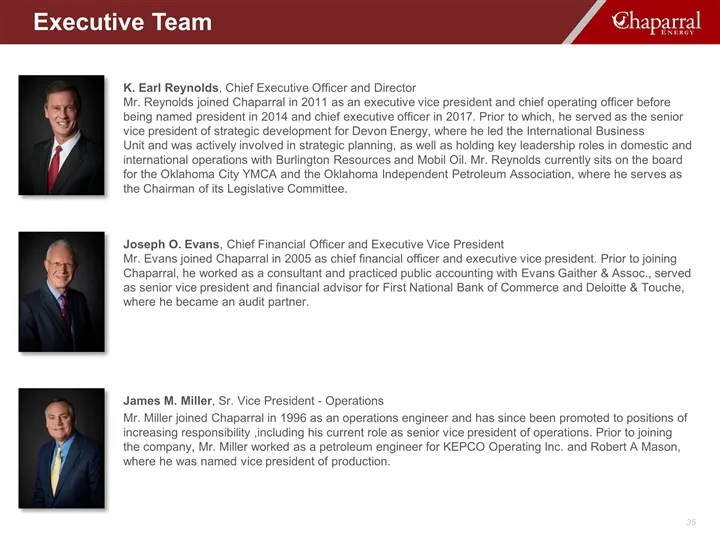
James M. Miller, Sr. Vice President - Operations Mr. Miller joined Chaparral in 1996 as an operations engineer and has since been promoted to positions of increasing responsibility ,including his current role as senior vice president of operations. Prior to joining the company, Mr. Miller worked as
Slide 37: Board of Directors
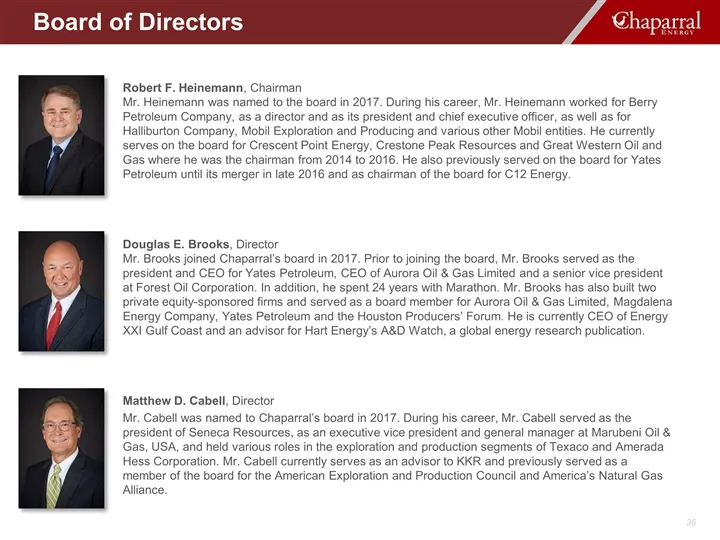
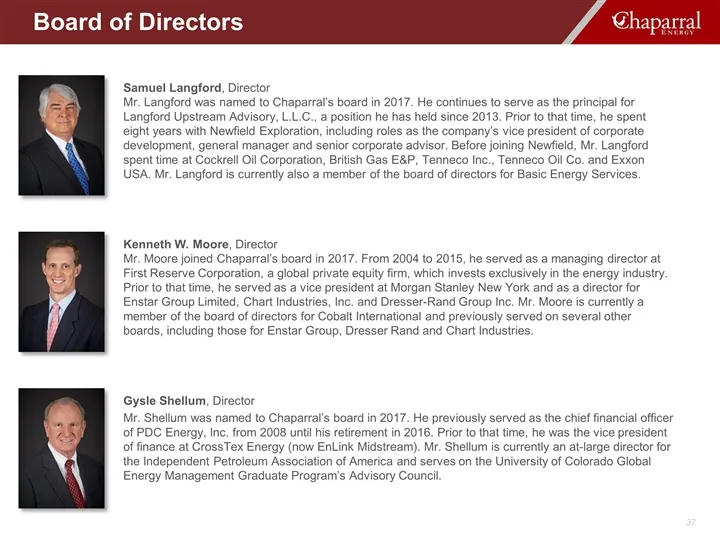
Matthew D. Cabell, Director Mr. Cabell was named to Chaparral’s board in 2017. During his career, Mr. Cabell served as the president of Seneca Resources, as an executive vice president and general manager at Marubeni Oil & Gas, USA, and held various roles in the exploration and production segments o
Slide 38: Board of Directors
Gysle Shellum, Director Mr. Shellum was named to Chaparral’s board in 2017. He previously served as the chief financial officer of PDC Energy, Inc. from 2008 until his retirement in 2016. Prior to that time, he was the vice president of finance at CrossTex Energy (now EnLink Midstream). Mr. Shellum
Slide 39: Reserve Estimates
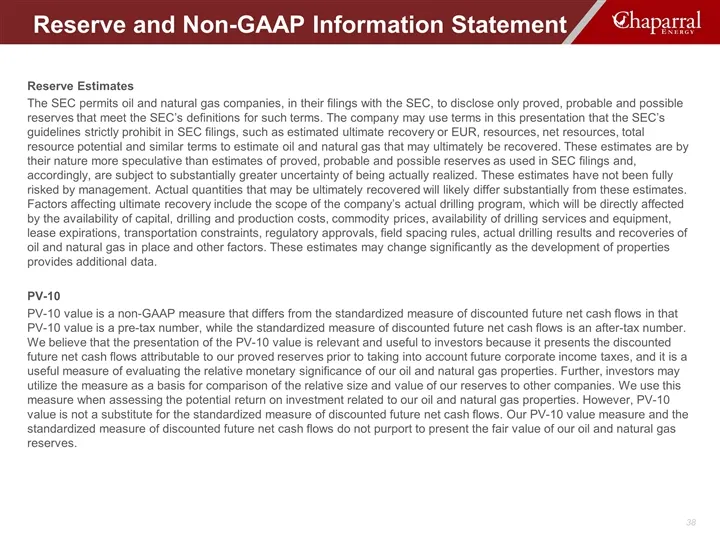
Reserve Estimates The SEC permits oil and natural gas companies, in their filings with the SEC, to disclose only proved, probable and possible reserves that meet the SEC’s definitions for such terms. The company may use terms in this presentation that the SEC’s guidelines strictly prohibit in SEC fi
Slide 40: Reconciliations
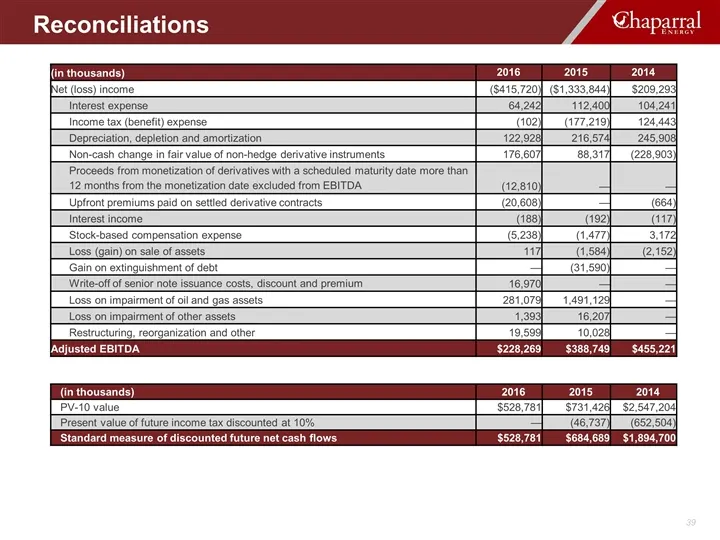
Reconciliations (in thousands) 2016 2015 2014 Net (loss) income ($415,720) ($1,333,844) $209,293 Interest expense 64,242 112,400 104,241 Income tax (benefit) expense (102) (177,219) 124,443 Depreciation, depletion and amortization 122,928 216,574 245,908 Non-cash change in fair value of non-hedge de

Slide 41: Energizing America's Heartland
ENERGIZING America’s Heartland
Source: SEC EDGAR · 8-K filed Dec 4, 2017
More decks from Chaparral Energy Inc
 Debt Investor Presentation (August 2020)10 slides · Aug 17, 2020
 Q1 2020 Earnings Presentation26 slides · May 12, 2020
 Investor Presentation (March 2020)30 slides · Mar 12, 2020
 Q3 2019 Earnings Presentation31 slides · Nov 12, 2019
 Q2 2019 Earnings Presentation33 slides · Aug 8, 2019
 Investor Presentation (May 2019)41 slides · May 28, 2019