Rehabcare — JP Morgan Conference 2010
19 slides from Rehabcare's conference presentation, Jan 12, 2010
Slide 1: Investor Presentation
Exhibit 99 Investor Presentation JP Morgan Conference January 13, 2010
Slide 2: Company Overview
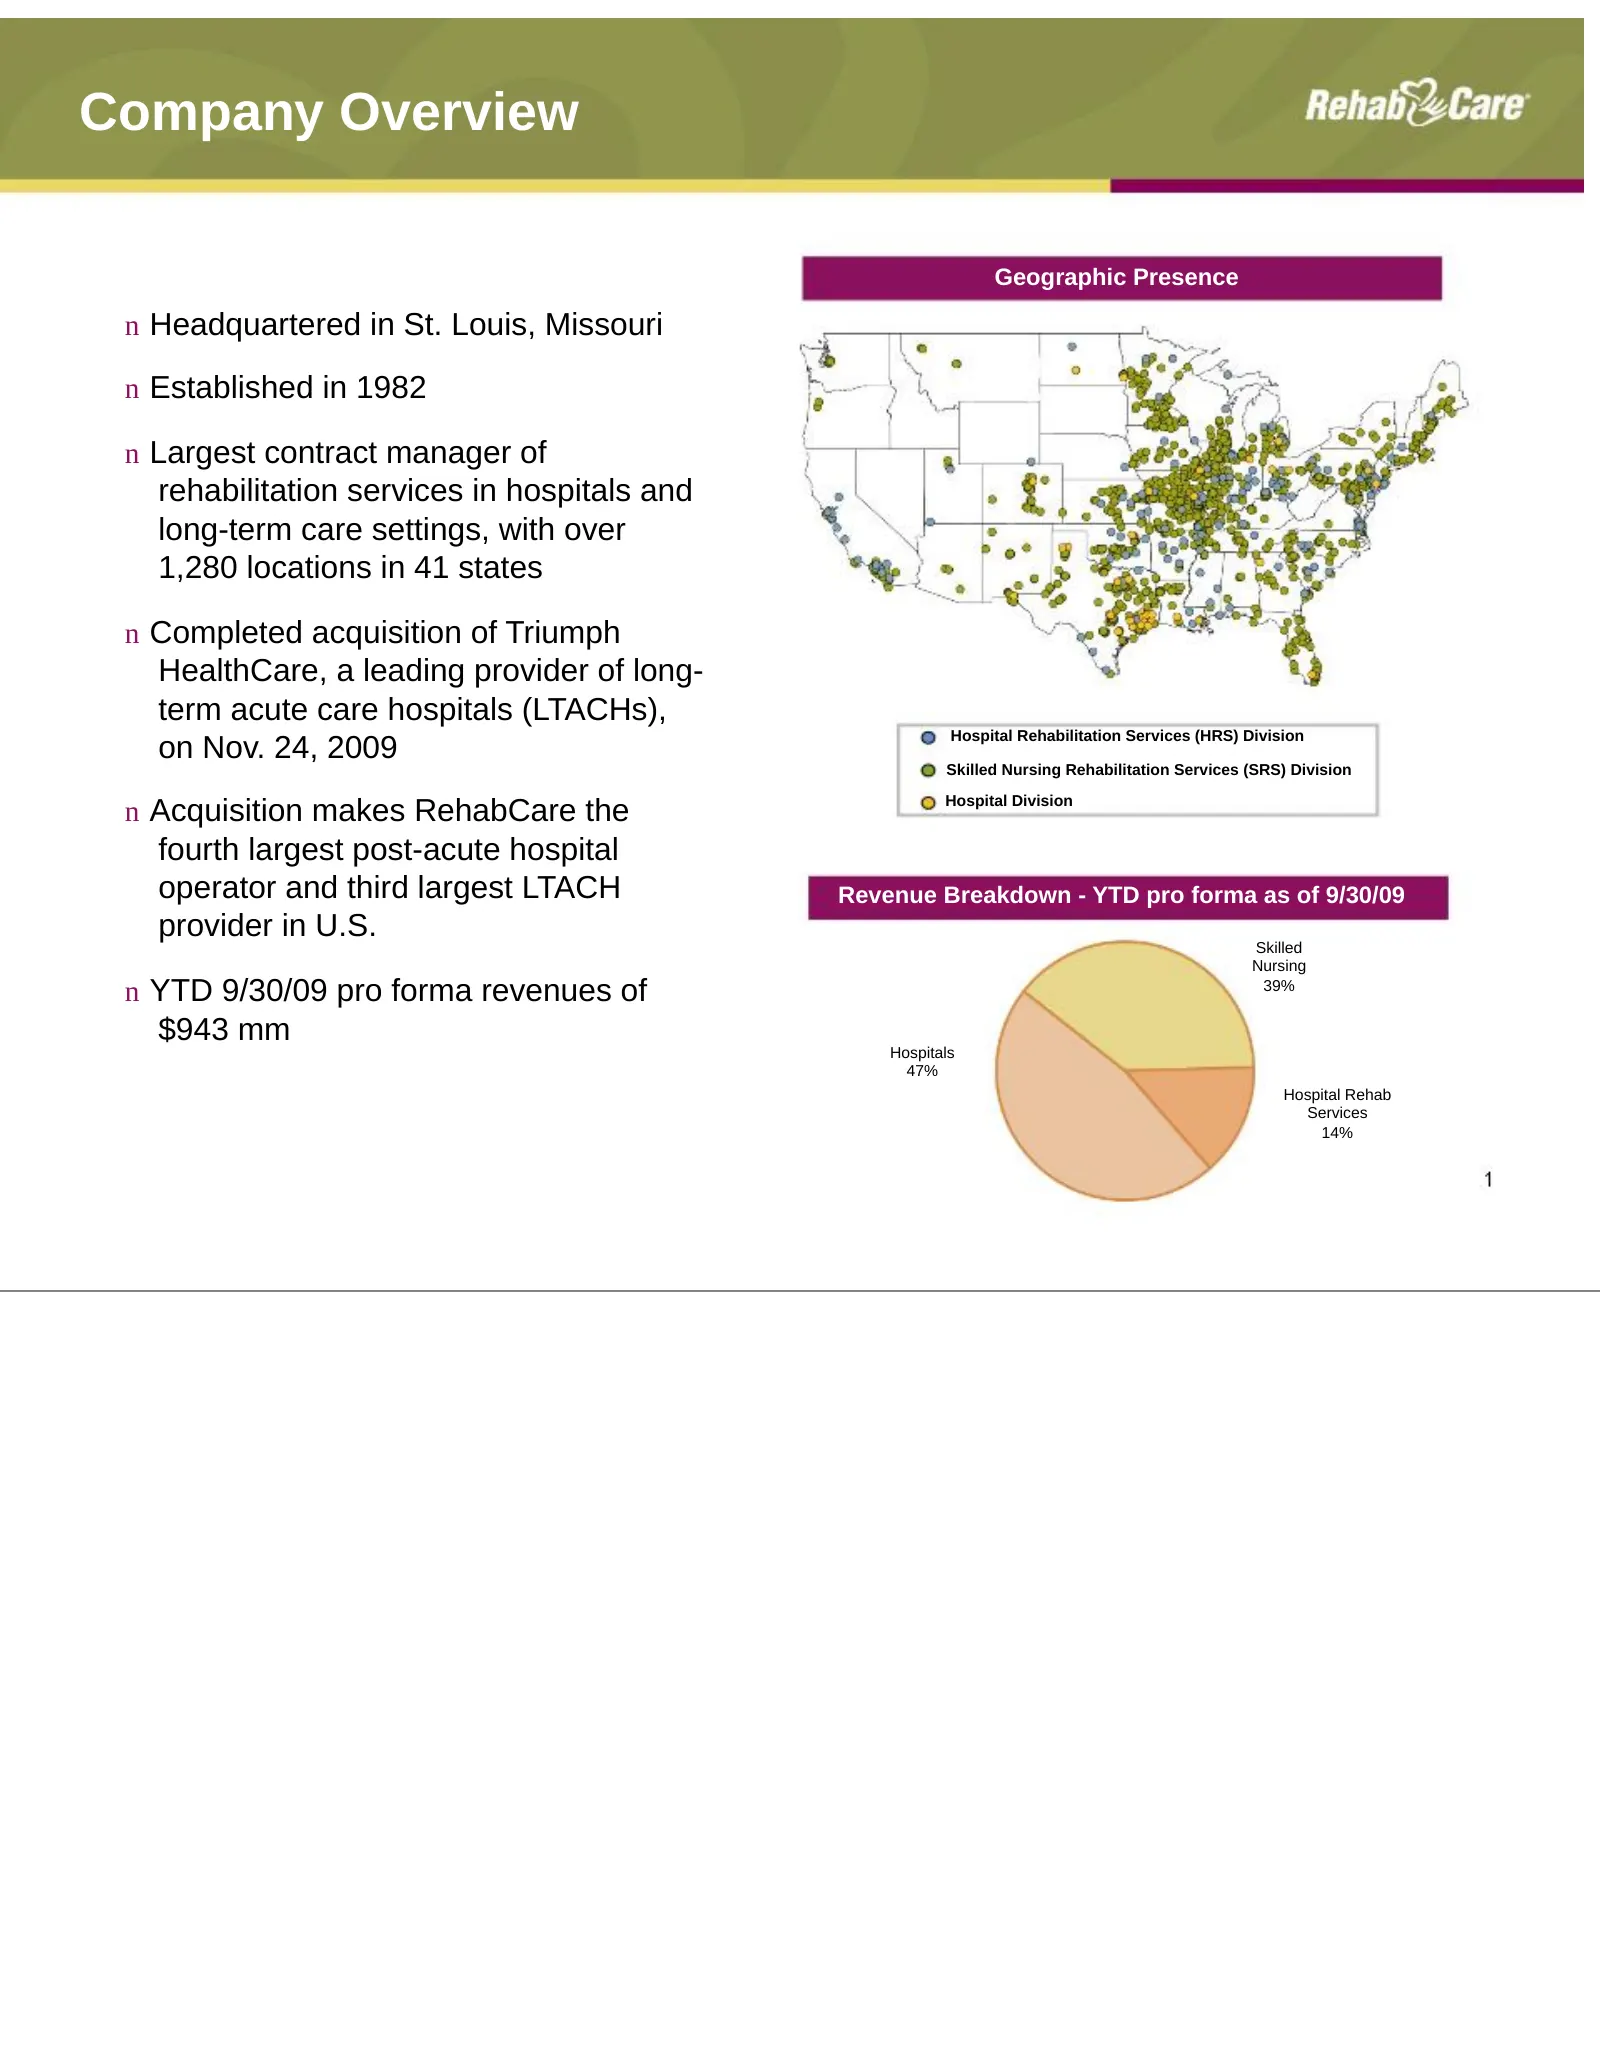
Company Overview Geographic Presence n Headquartered in St. Louis, Missouri n Established in 1982 n Largest contract manager of rehabilitation services in hospitals and long-term care settings, with over 1,280 locations in 41 states n Completed acquisition of Triumph HealthCare, a leading provider o
Slide 3: Market Overview
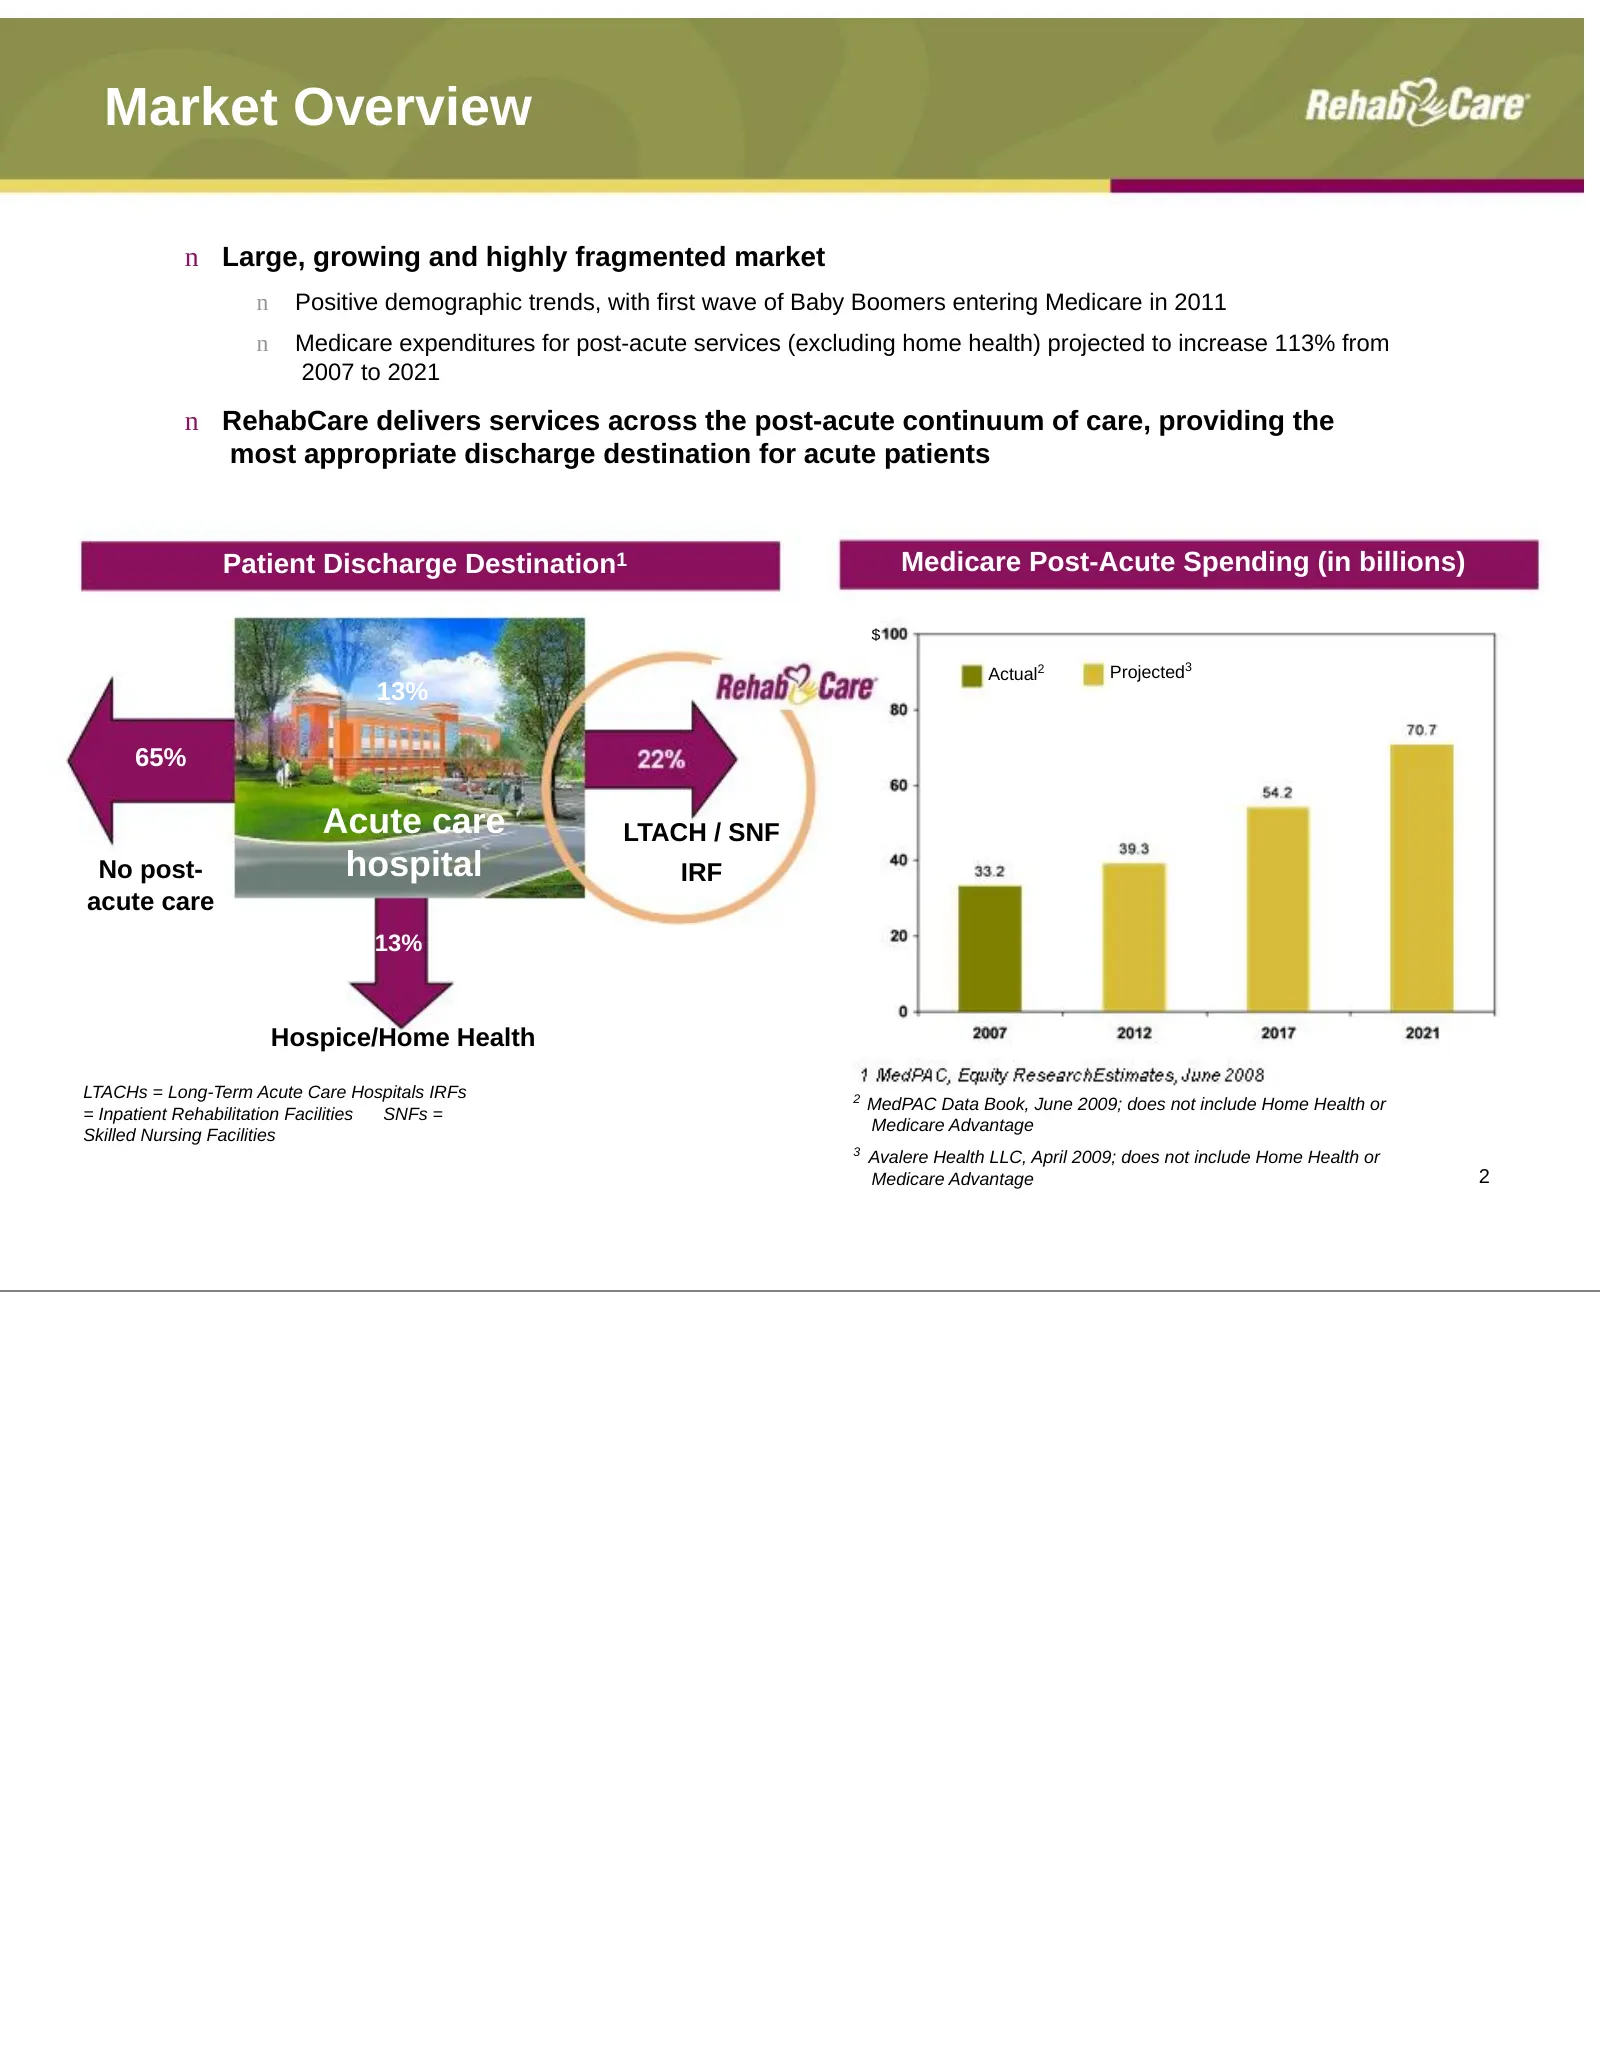
Market Overview n Large, growing and highly fragmented market n Positive demographic trends, with first wave of Baby Boomers entering Medicare in 2011 n Medicare expenditures for post-acute services (excluding home health) projected to increase 113% from 2007 to 2021 n RehabCare delivers services ac
Slide 4: Hospital Division Overview
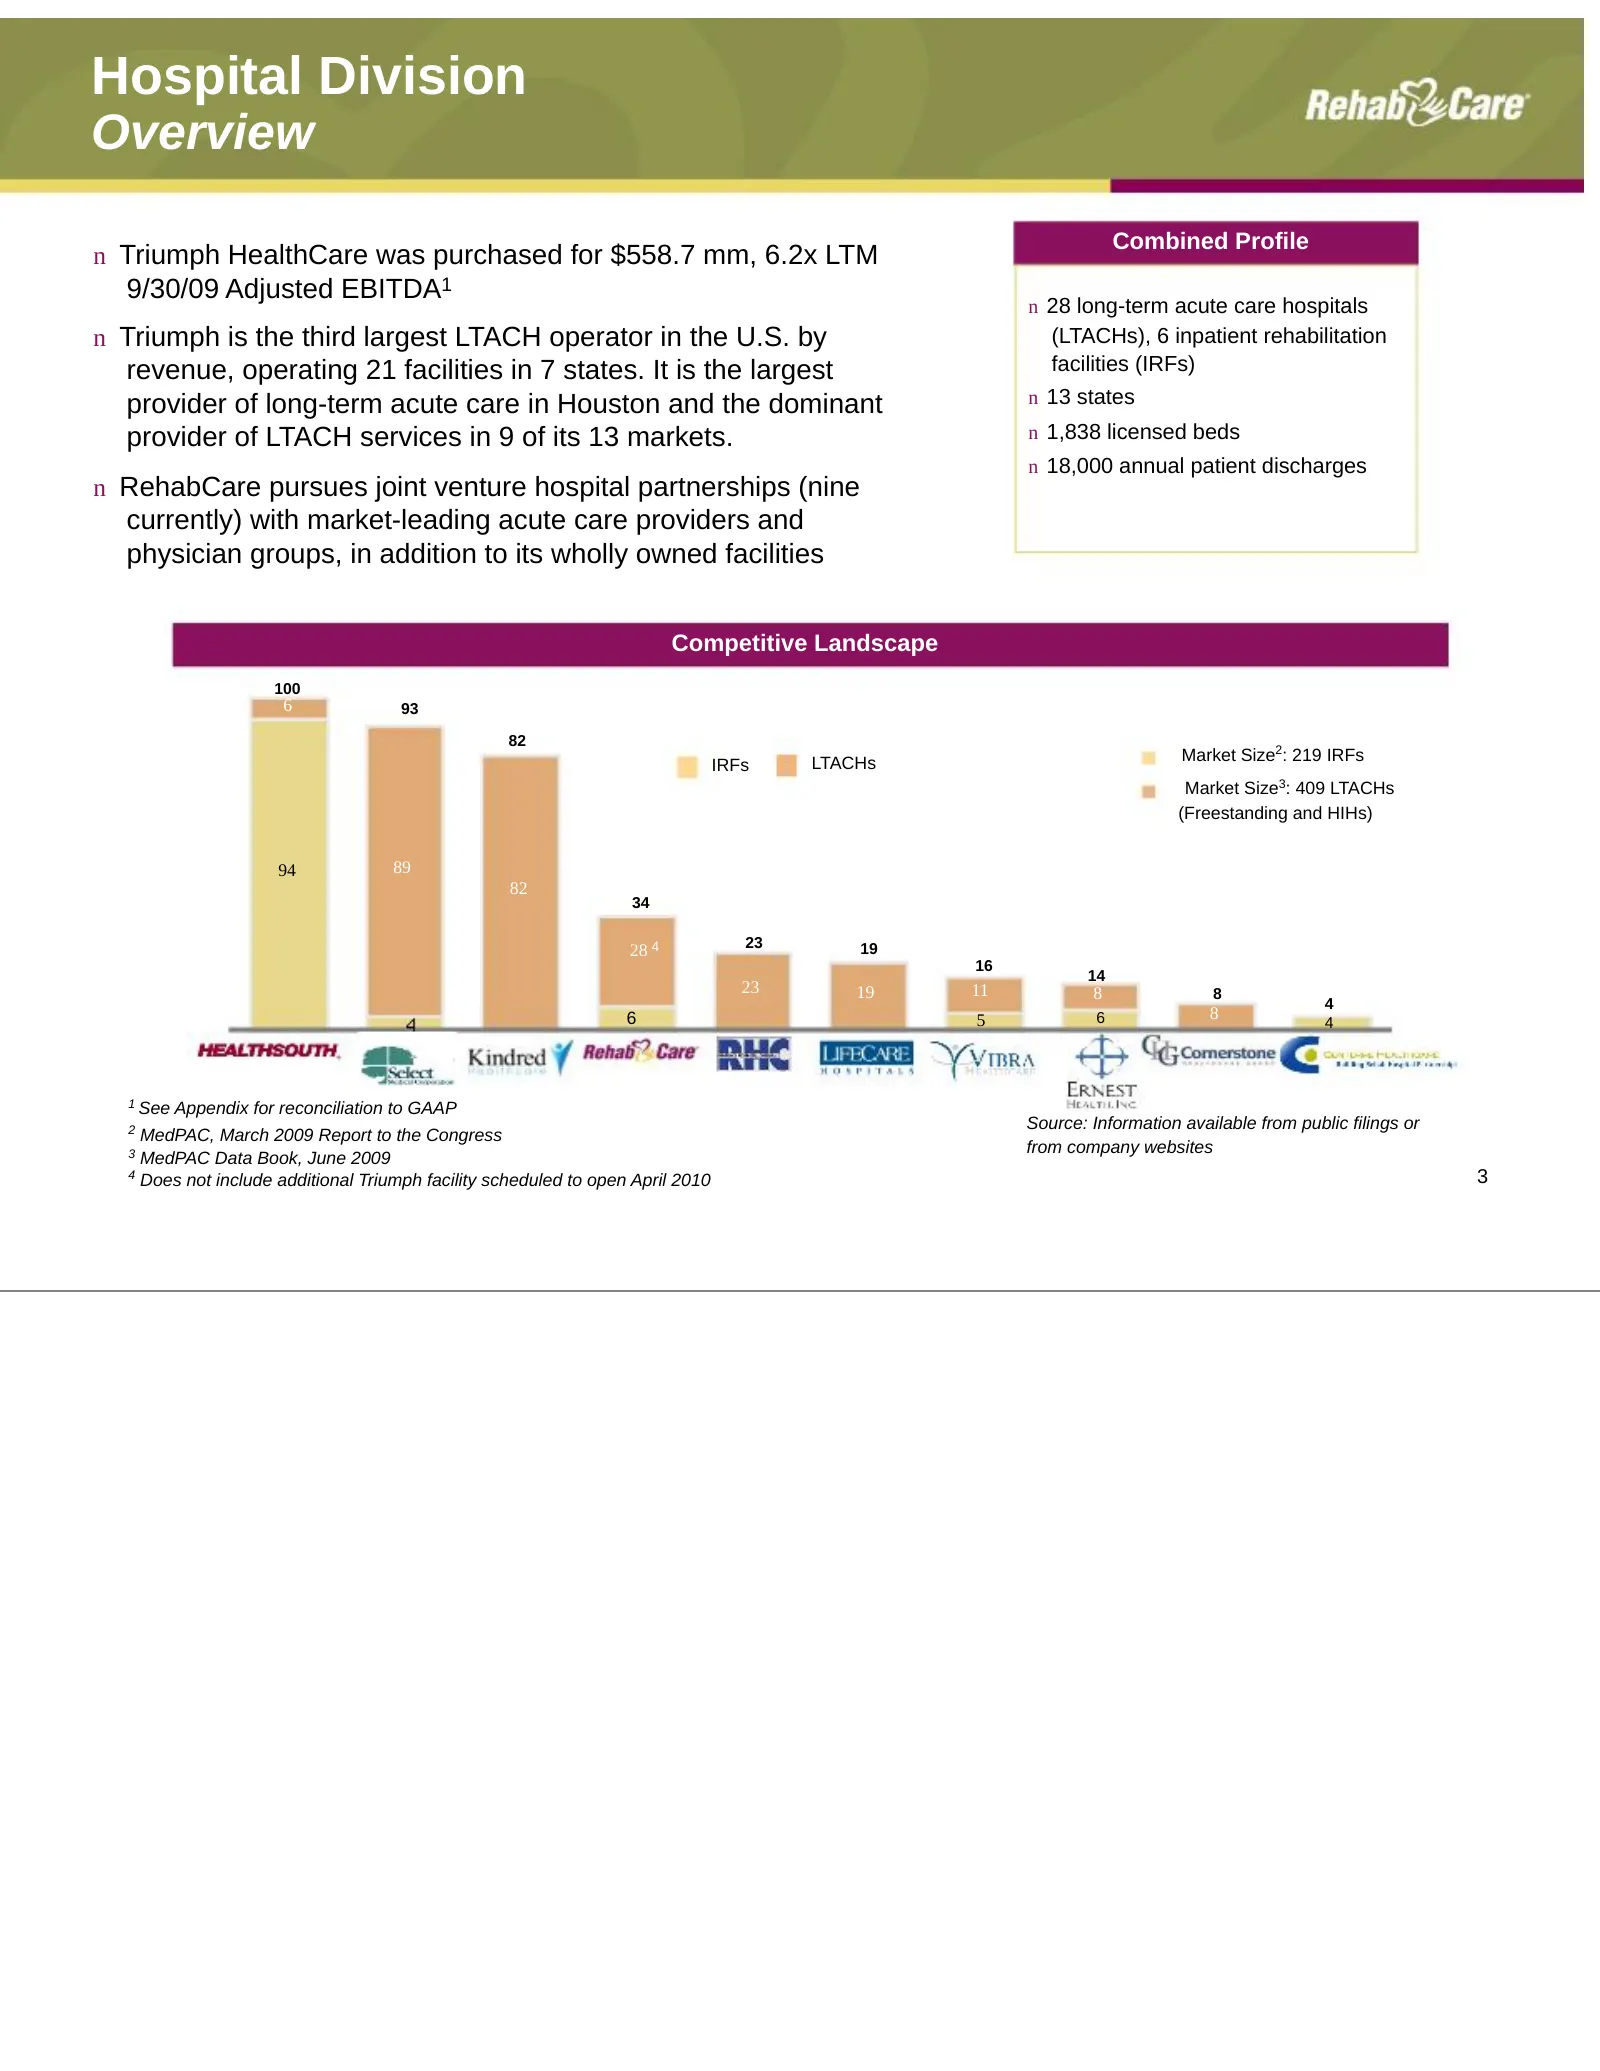
Hospital Division Overview Combined Profile n Triumph HealthCare was purchased for $558.7 mm, 6.2x LTM 9/30/09 Adjusted EBITDA1 n 28 long-term acute care hospitals n Triumph is the third largest LTACH operator in the U.S. by (LTACHs), 6 inpatient rehabilitation revenue, operating 21 facilities in 7
Slide 5: Triumph Acquisition: Strategic rationale - operational
Triumph Acquisition Strategic rationale - operational n Combination provides immediate economies of scale n Ability to adopt Triumph’s operational strengths, which have produced a consistent record of strong earnings performance compared to major competitors n Creates stronger, more comprehensive co
Slide 6: Triumph Operational Strengths
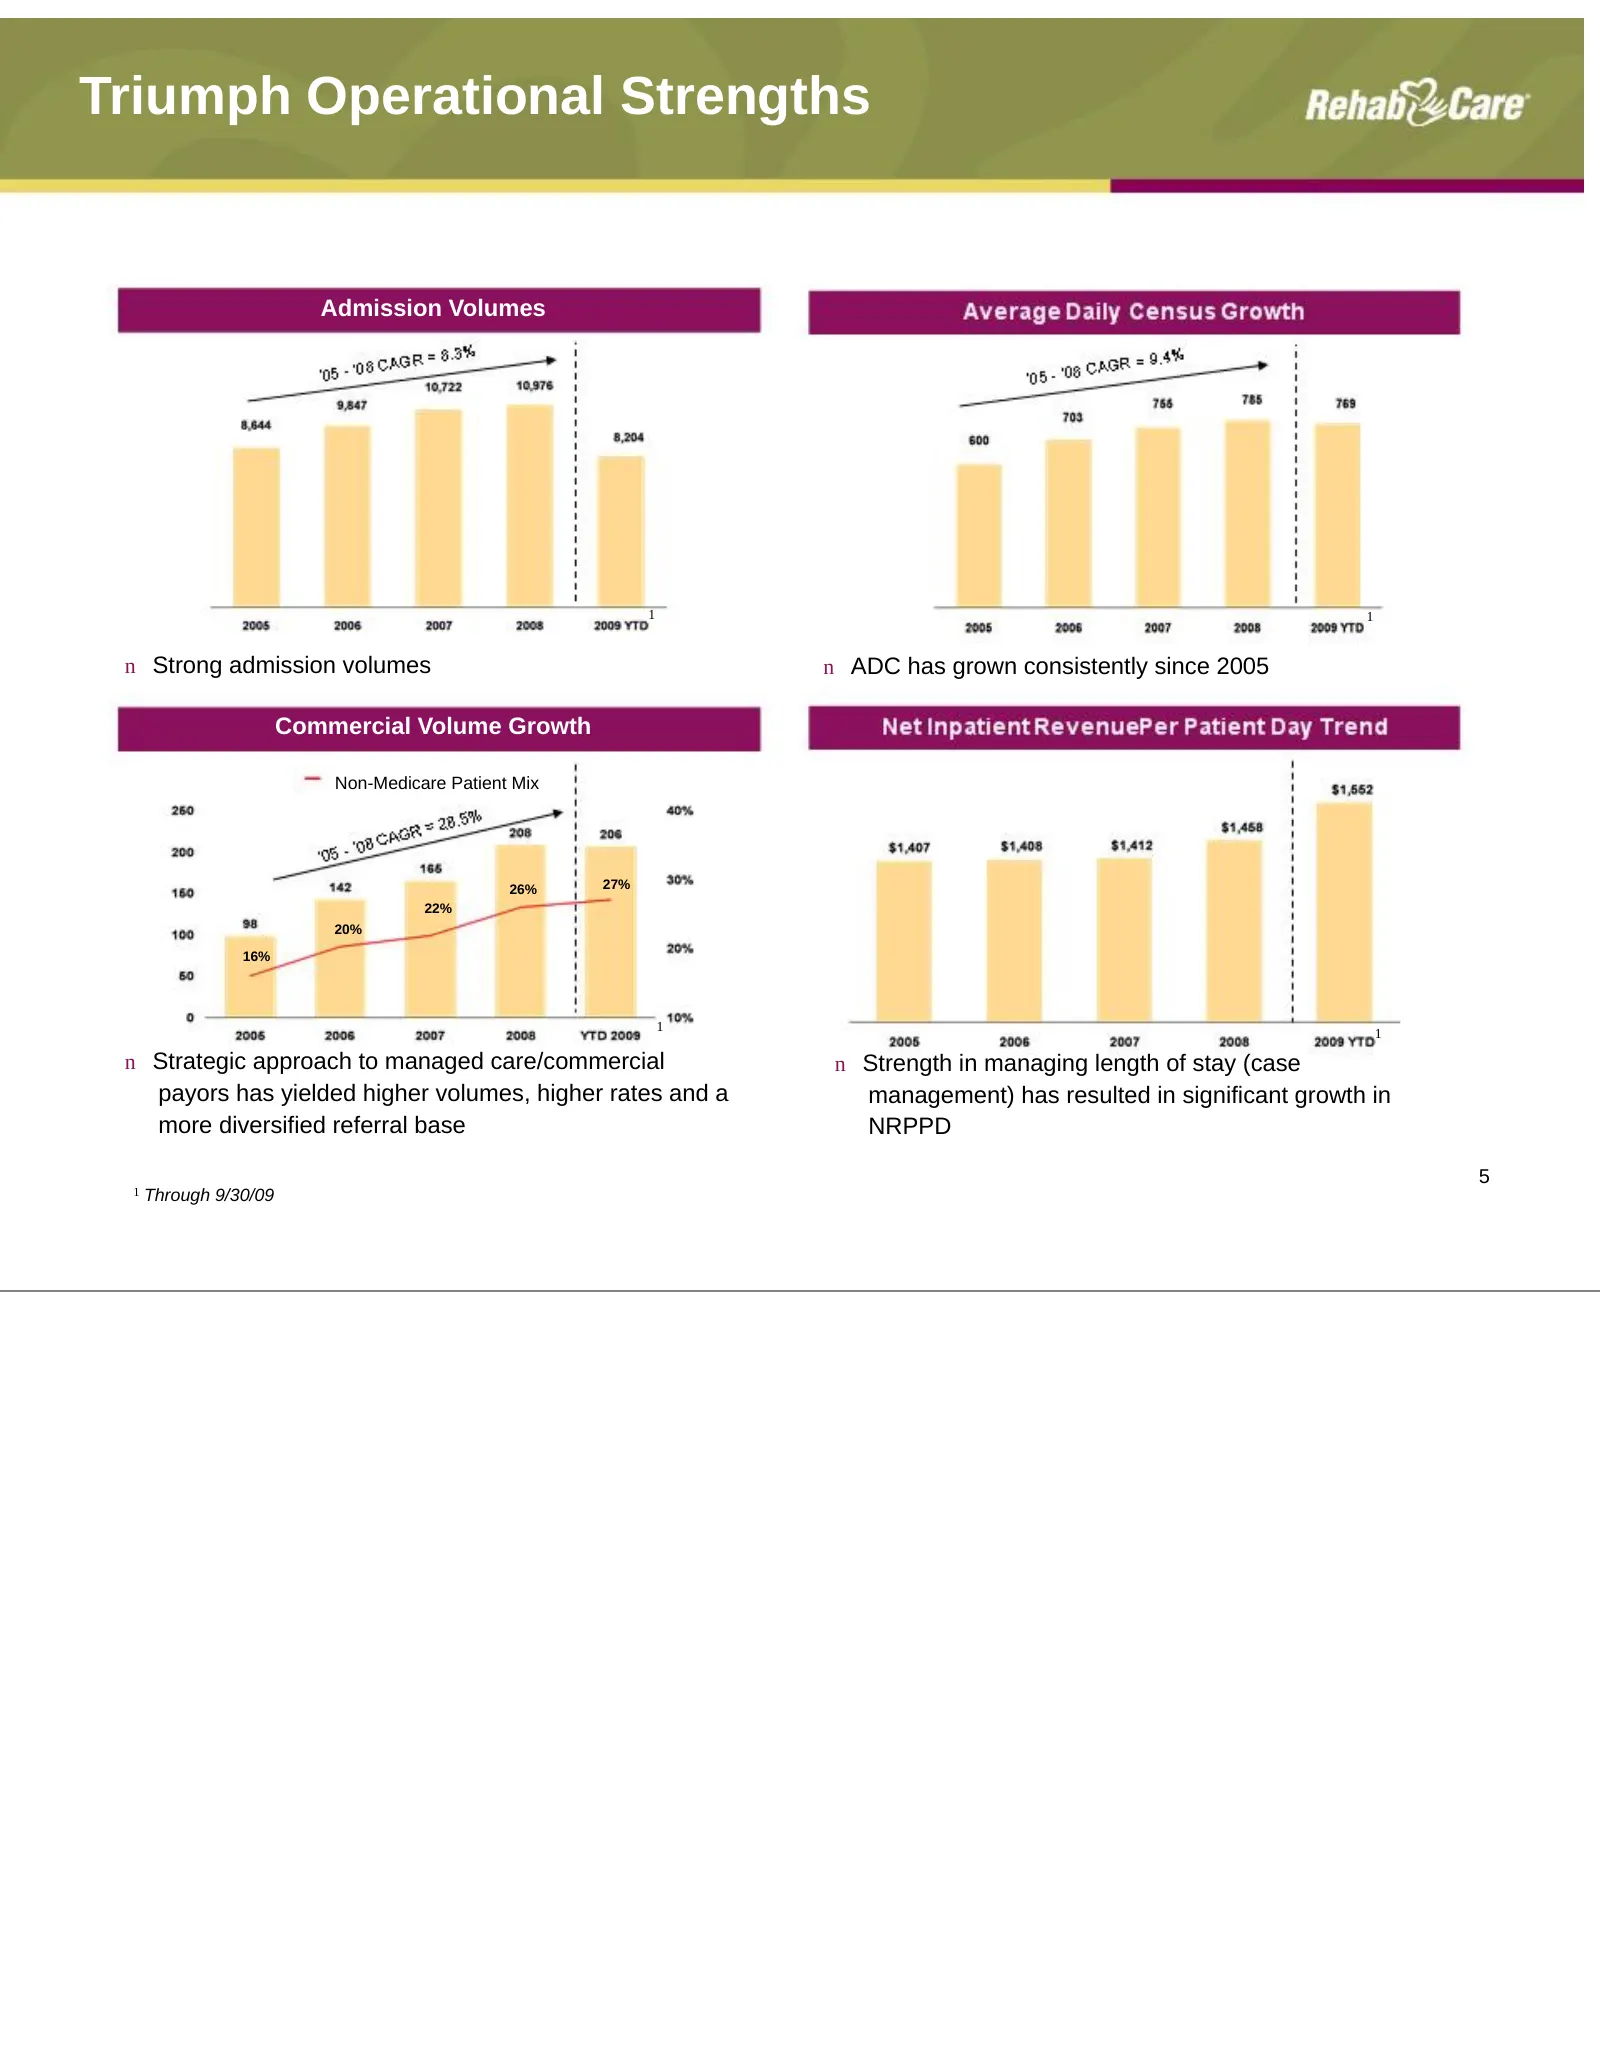
Triumph Operational Strengths Admission Volumes 1 1 n Strong admission volumes n ADC has grown consistently since 2005 Commercial Volume Growth Non-Medicare Patient Mix 26% 27% 22% 20% 16% 1 1 n Strategic approach to managed care/commercial n Strength in managing length of stay (case payors has yiel
Slide 7: Triumph Acquisition: Strategic rationale - financial
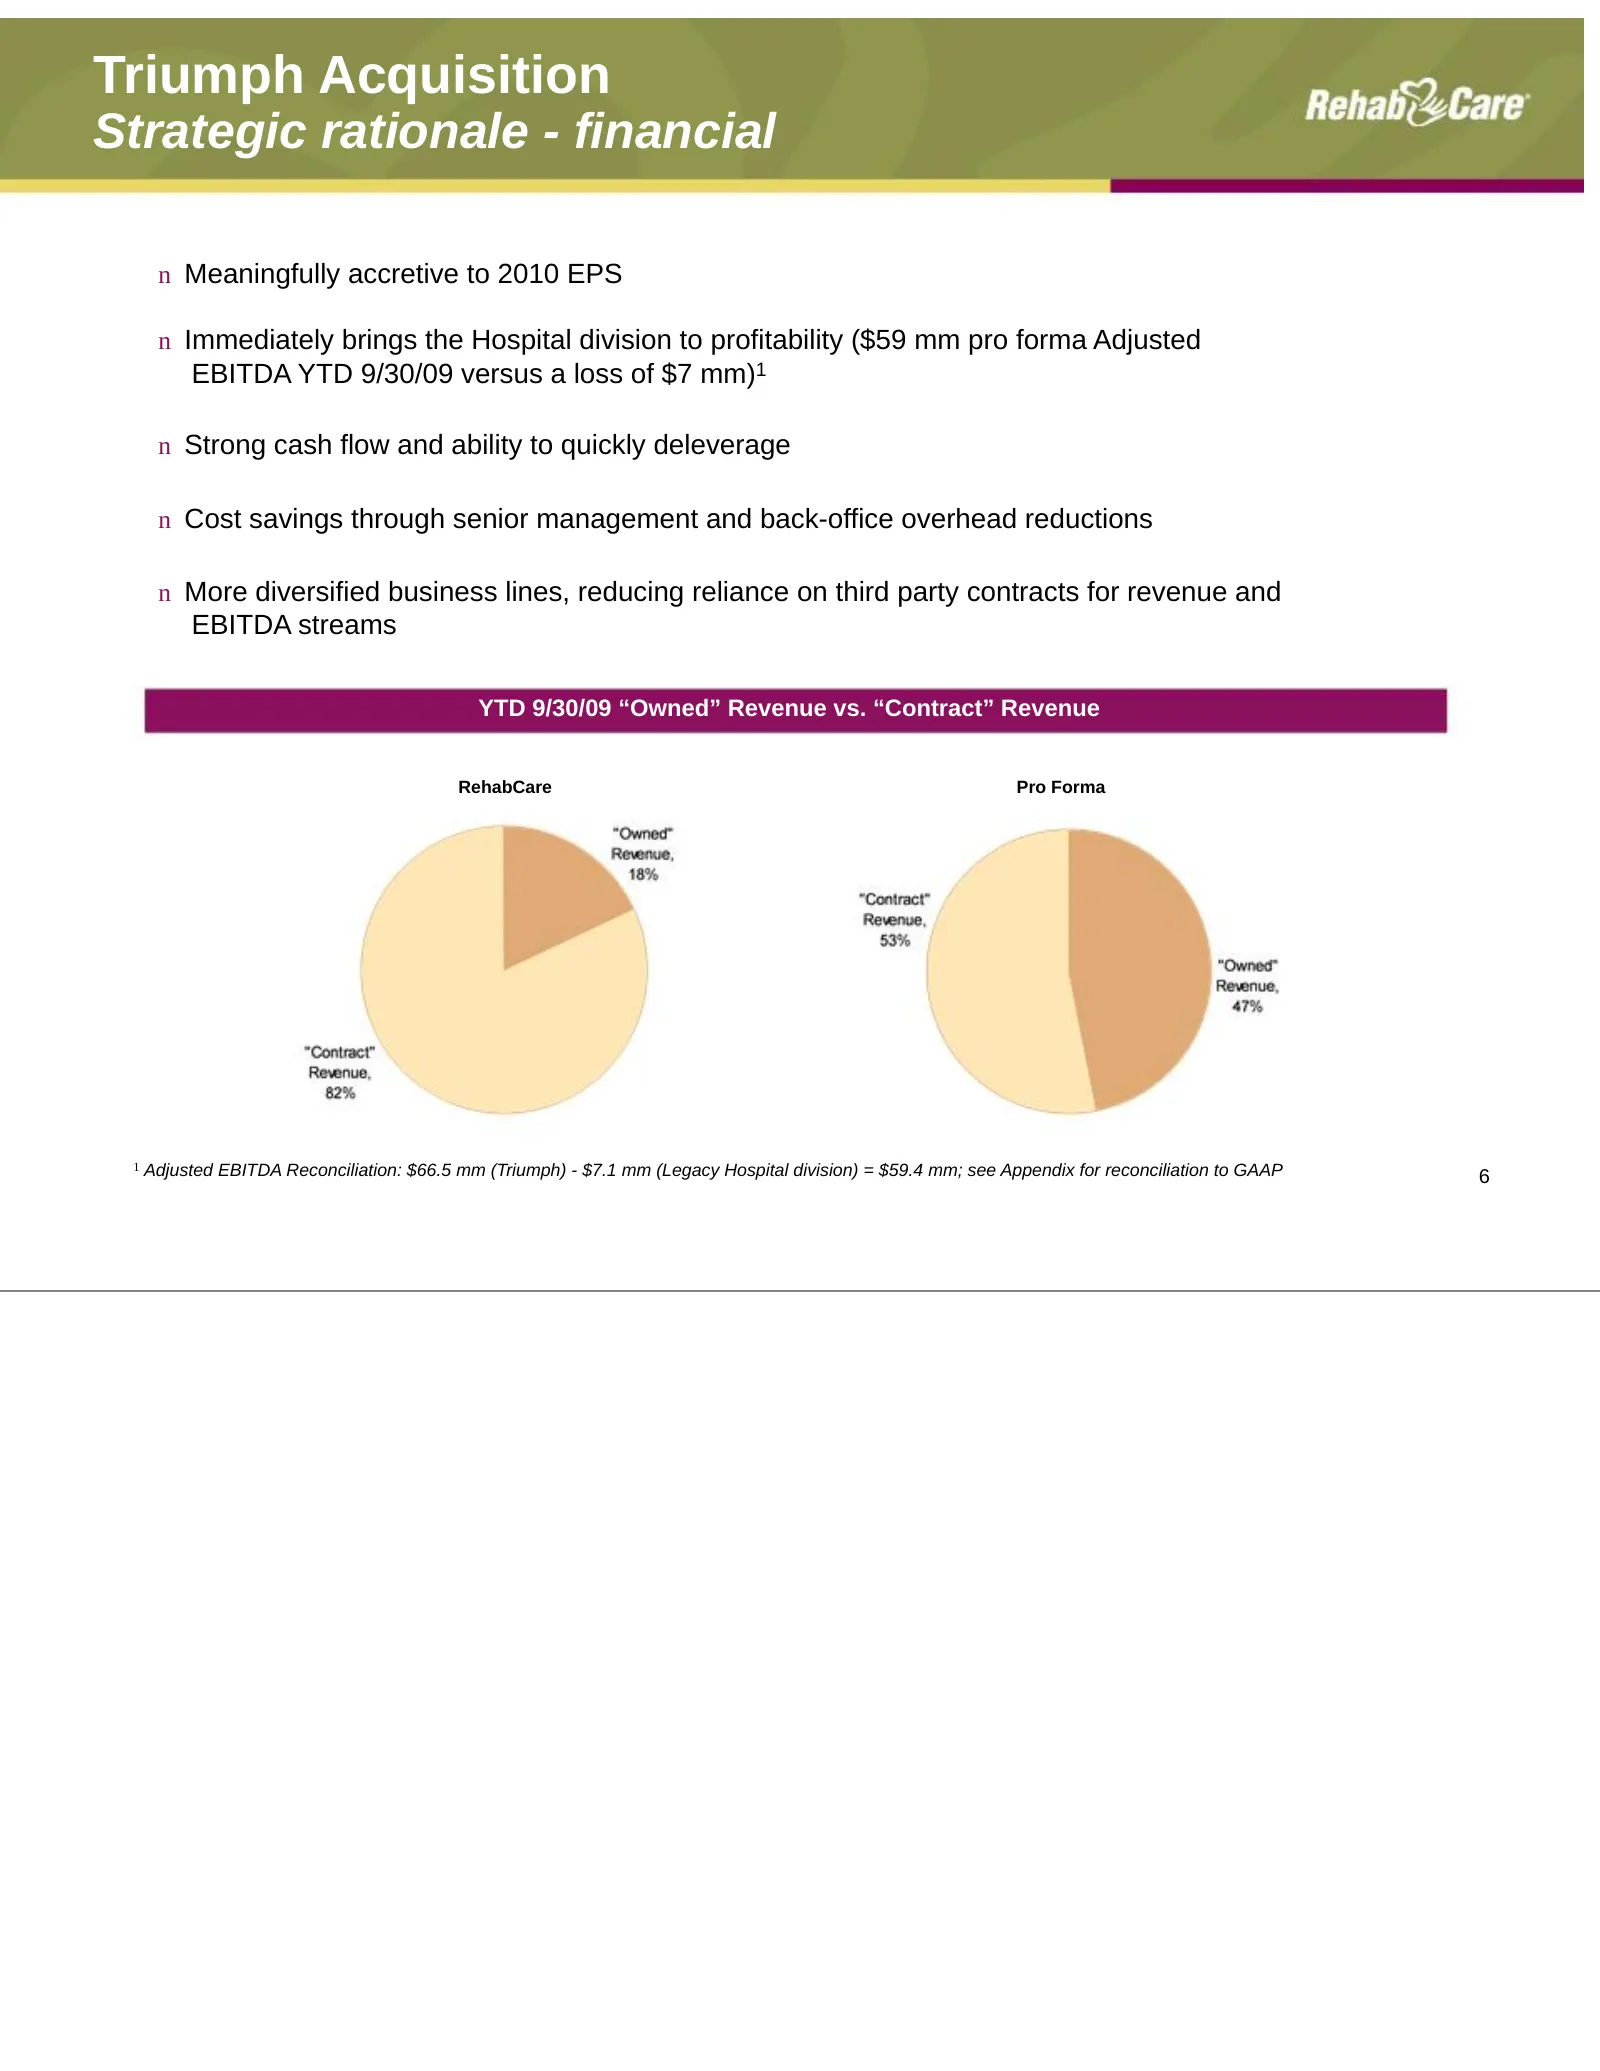
Triumph Acquisition Strategic rationale - financial n Meaningfully accretive to 2010 EPS n Immediately brings the Hospital division to profitability ($59 mm pro forma Adjusted EBITDA YTD 9/30/09 versus a loss of $7 mm)1 n Strong cash flow and ability to quickly deleverage n Cost savings through seni
Slide 8: Legacy Hospital Division Historical performance
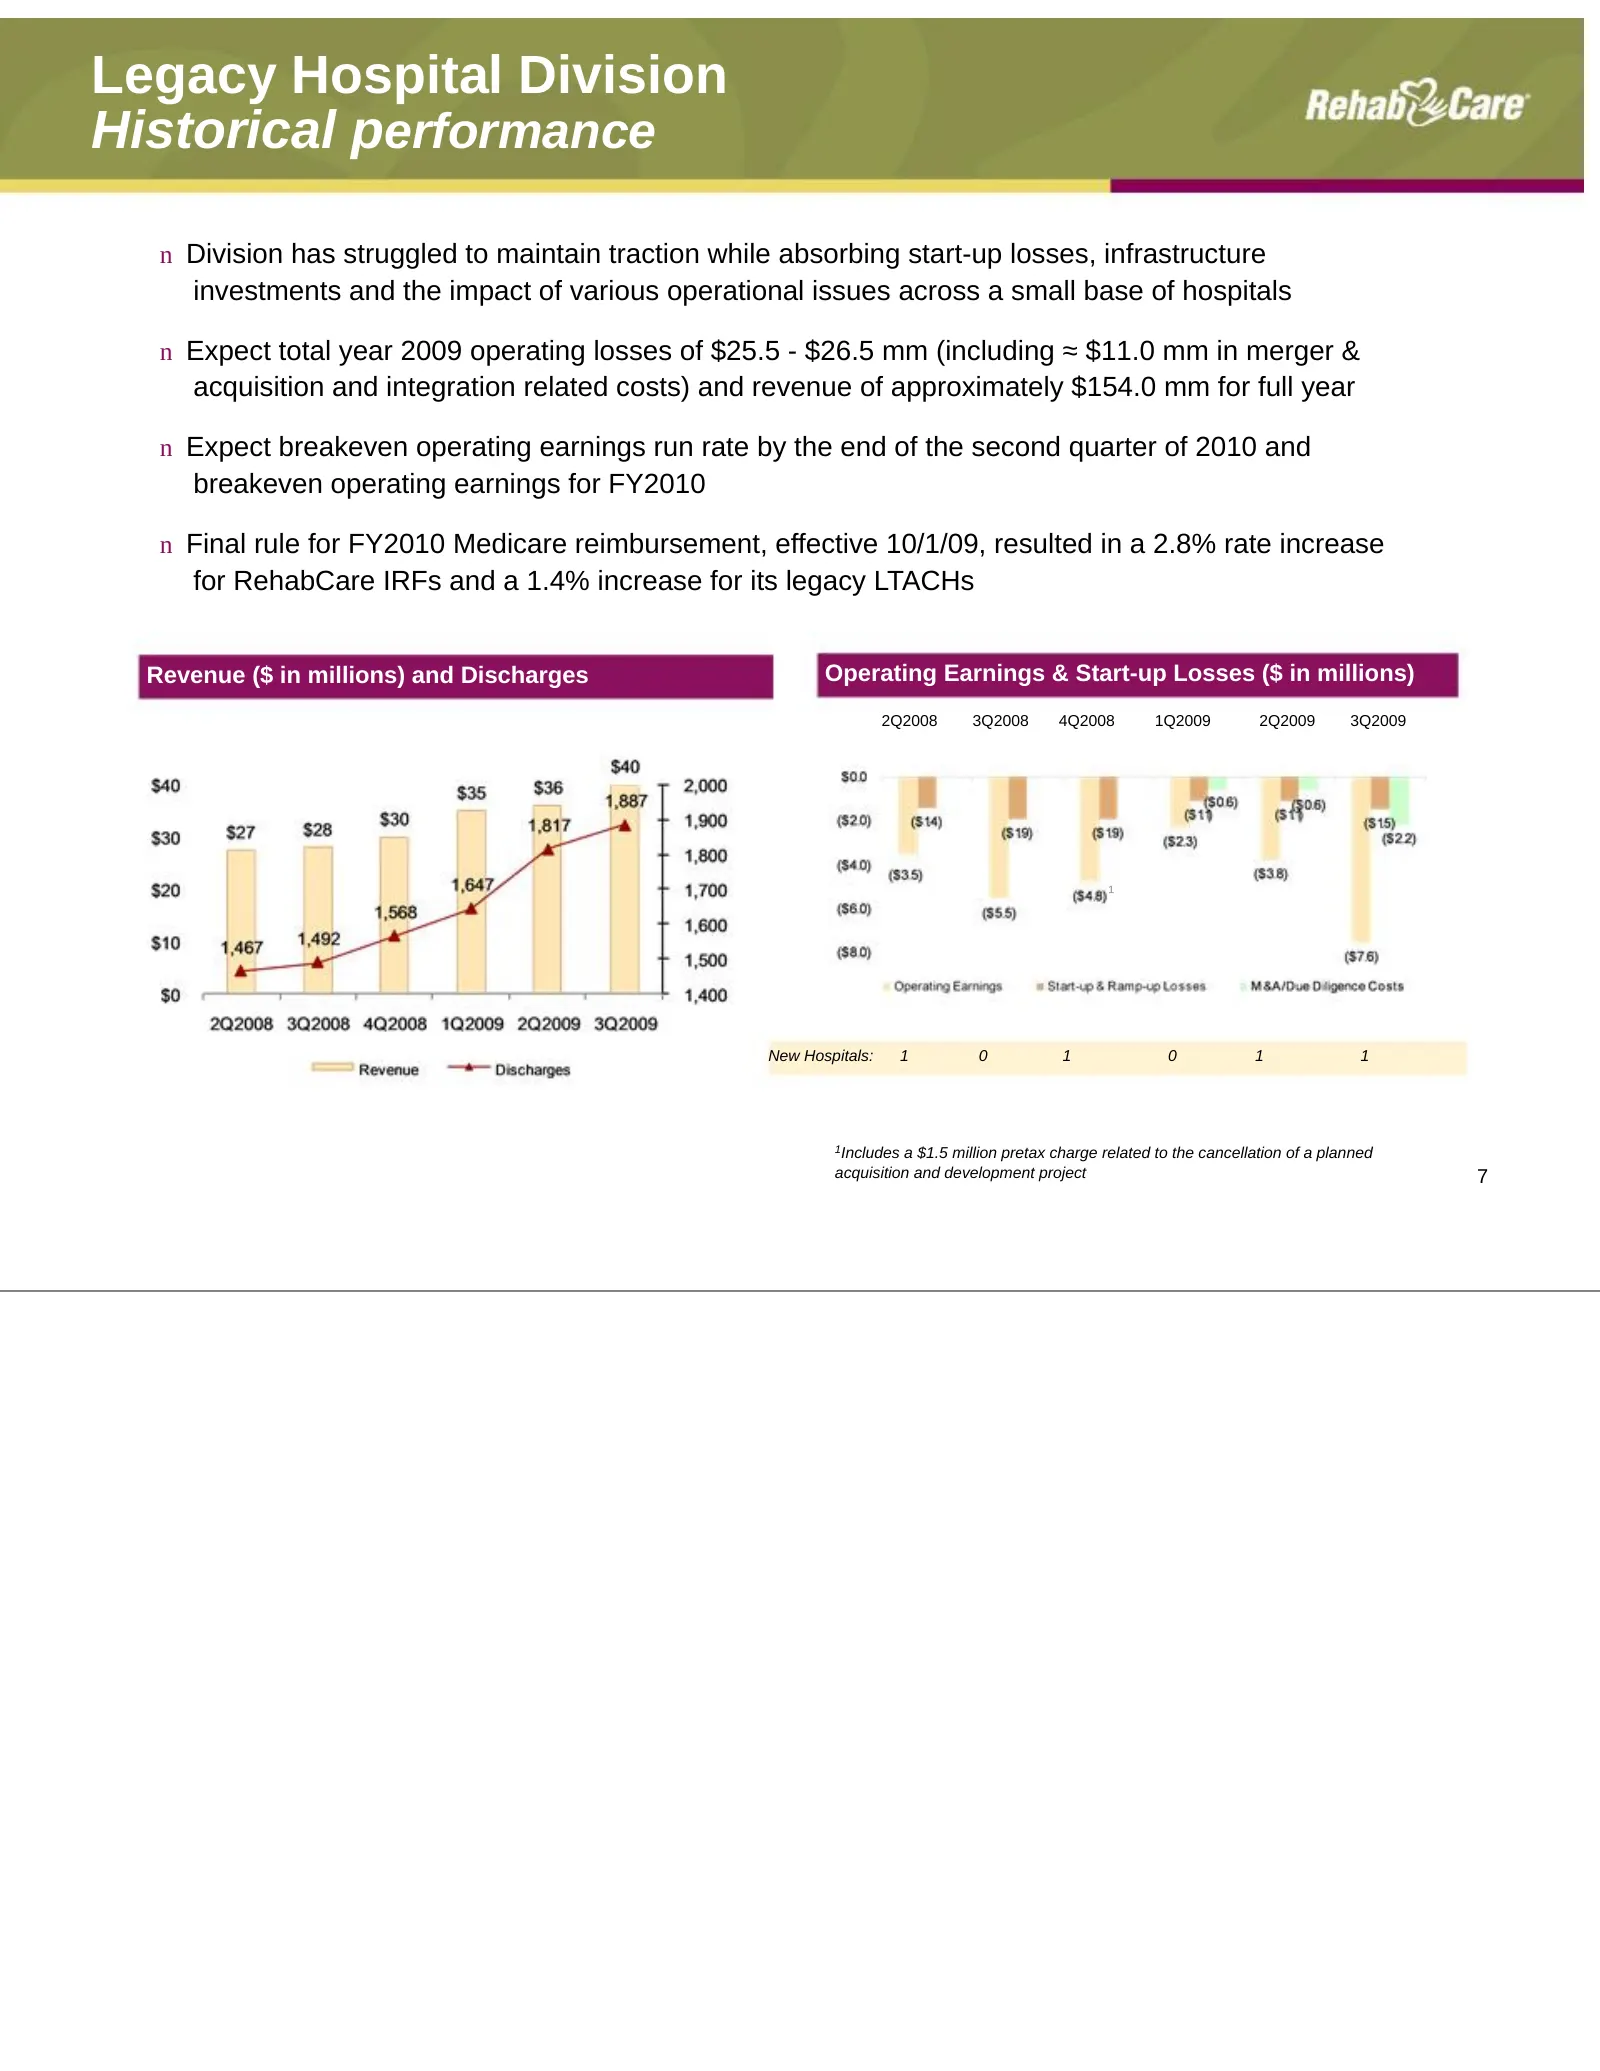
Legacy Hospital Division Historical performance n Division has struggled to maintain traction while absorbing start-up losses, infrastructure investments and the impact of various operational issues across a small base of hospitals n Expect total year 2009 operating losses of $25.5 - $26.5 mm (inclu
Slide 9: Skilled Nursing Rehabilitation Services (SRS) Division overview
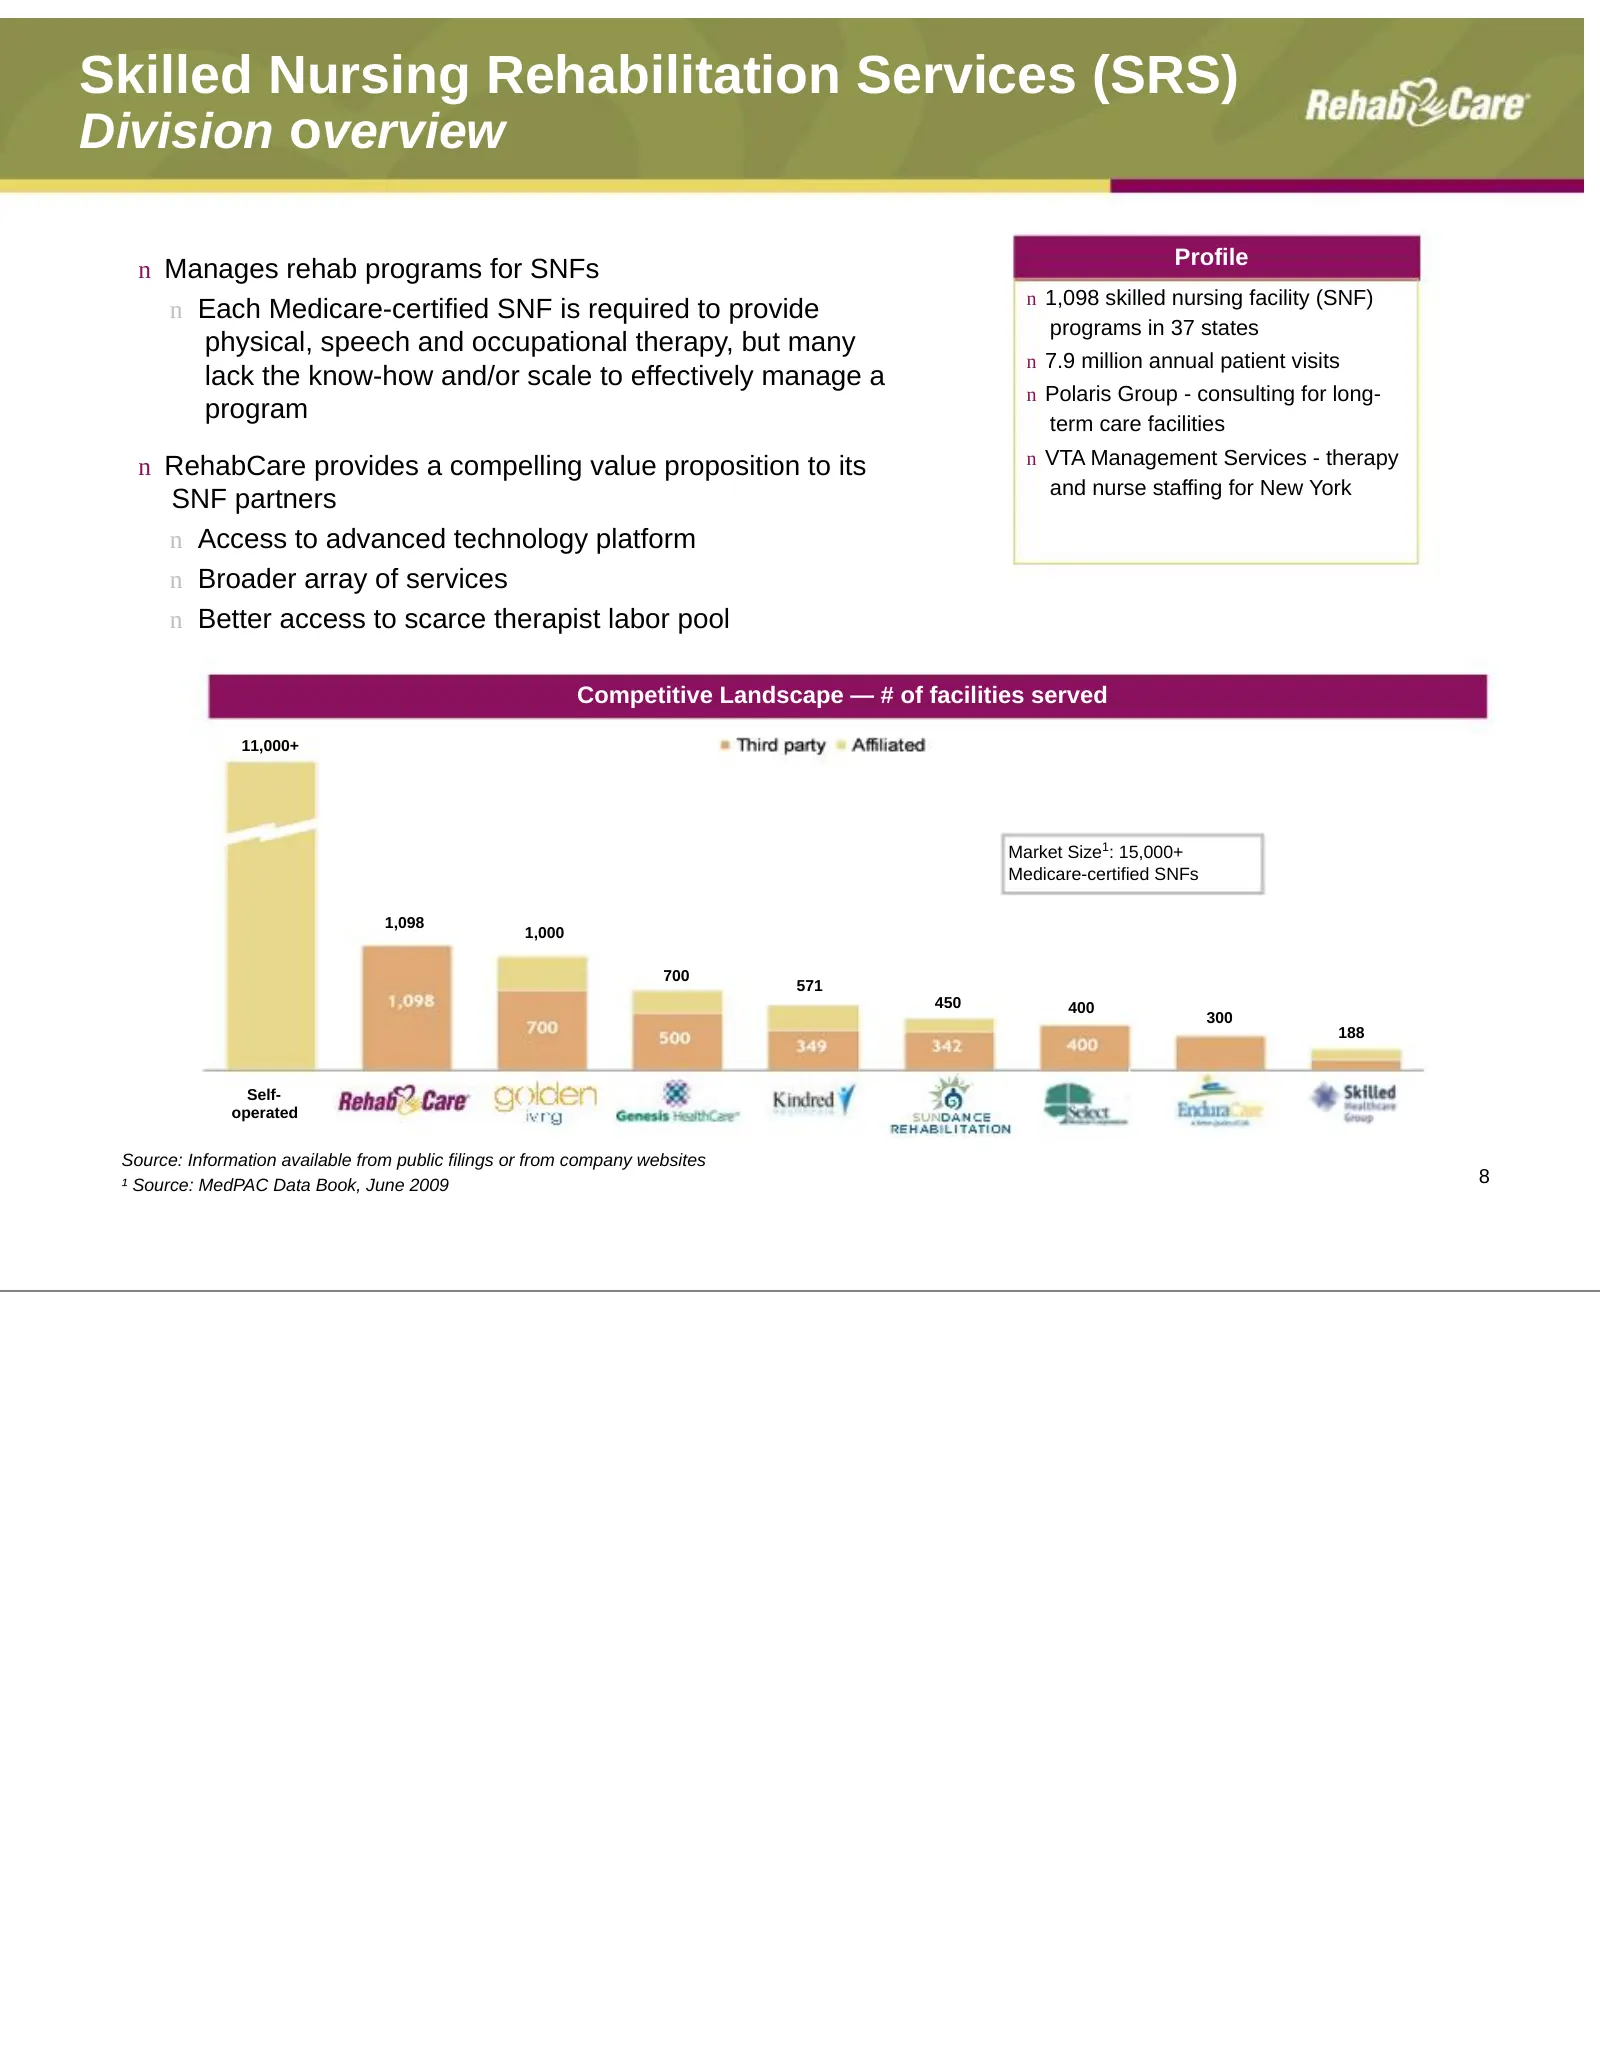
Skilled Nursing Rehabilitation Services (SRS) Division overview Profile n Manages rehab programs for SNFs n 1,098 skilled nursing facility (SNF) n Each Medicare-certified SNF is required to provide programs in 37 states physical, speech and occupational therapy, but many n 7.9 million annual patient
Slide 10: SRS Division Performance/outlook
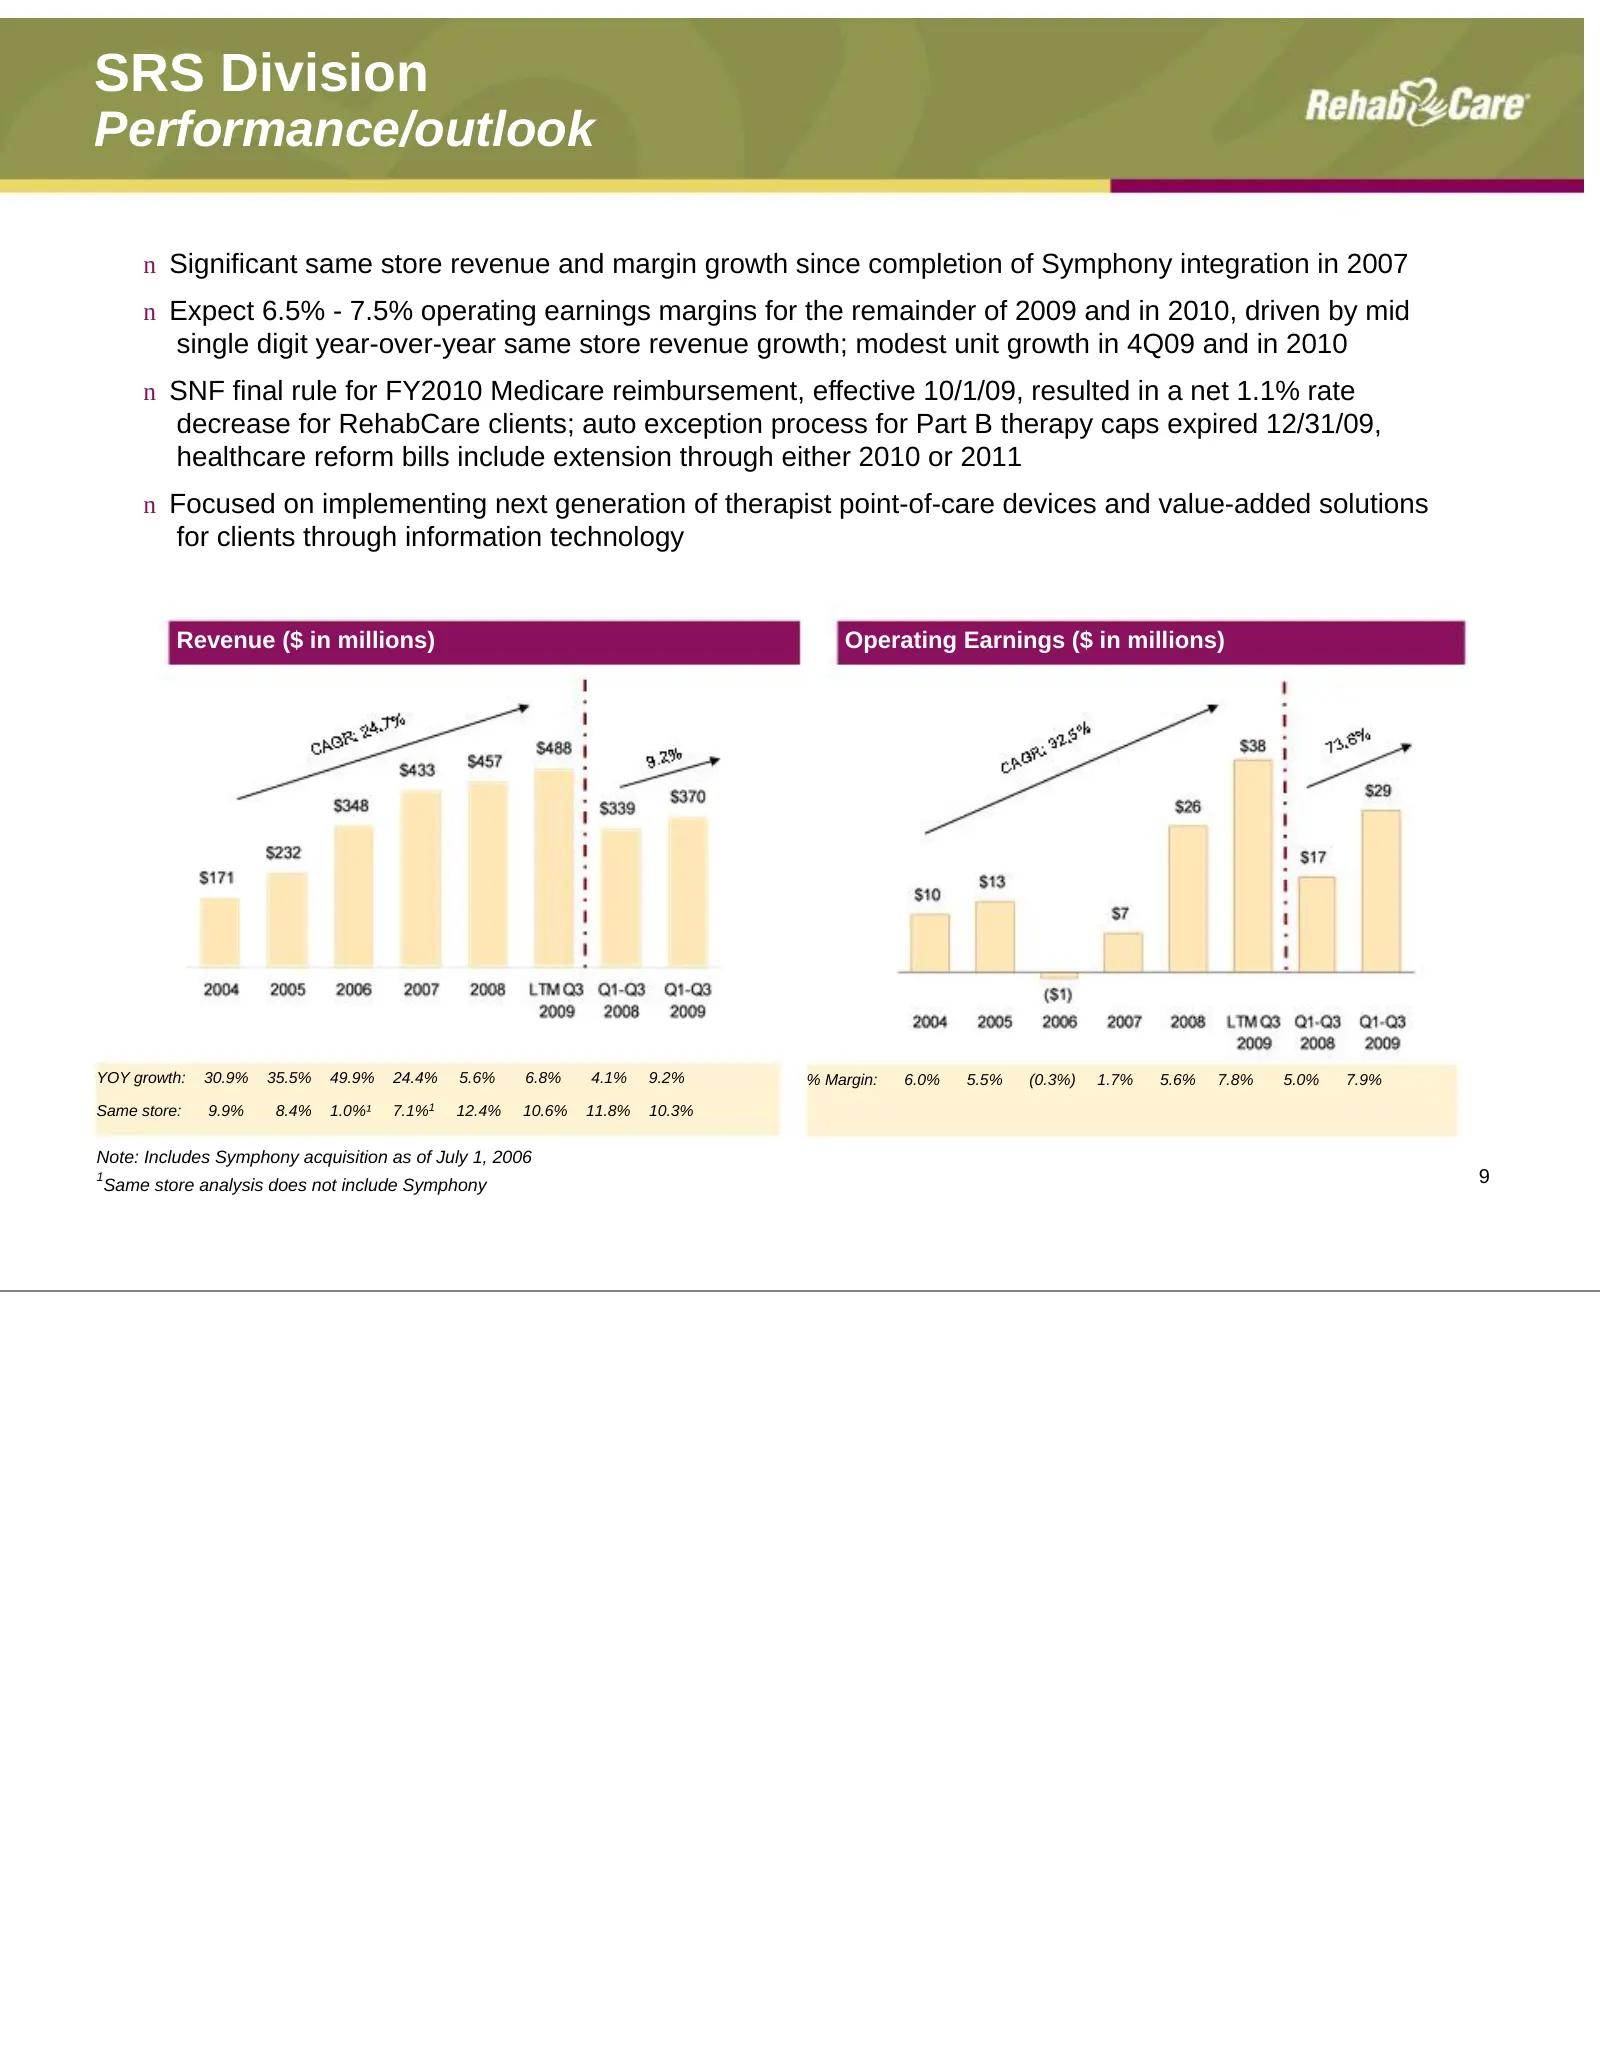
SRS Division Performance/outlook n Significant same store revenue and margin growth since completion of Symphony integration in 2007 n Expect 6.5% - 7.5% operating earnings margins for the remainder of 2009 and in 2010, driven by mid single digit year-over-year same store revenue growth; modest unit
Slide 11: Hospital Rehabilitation Services (HRS) Division overview
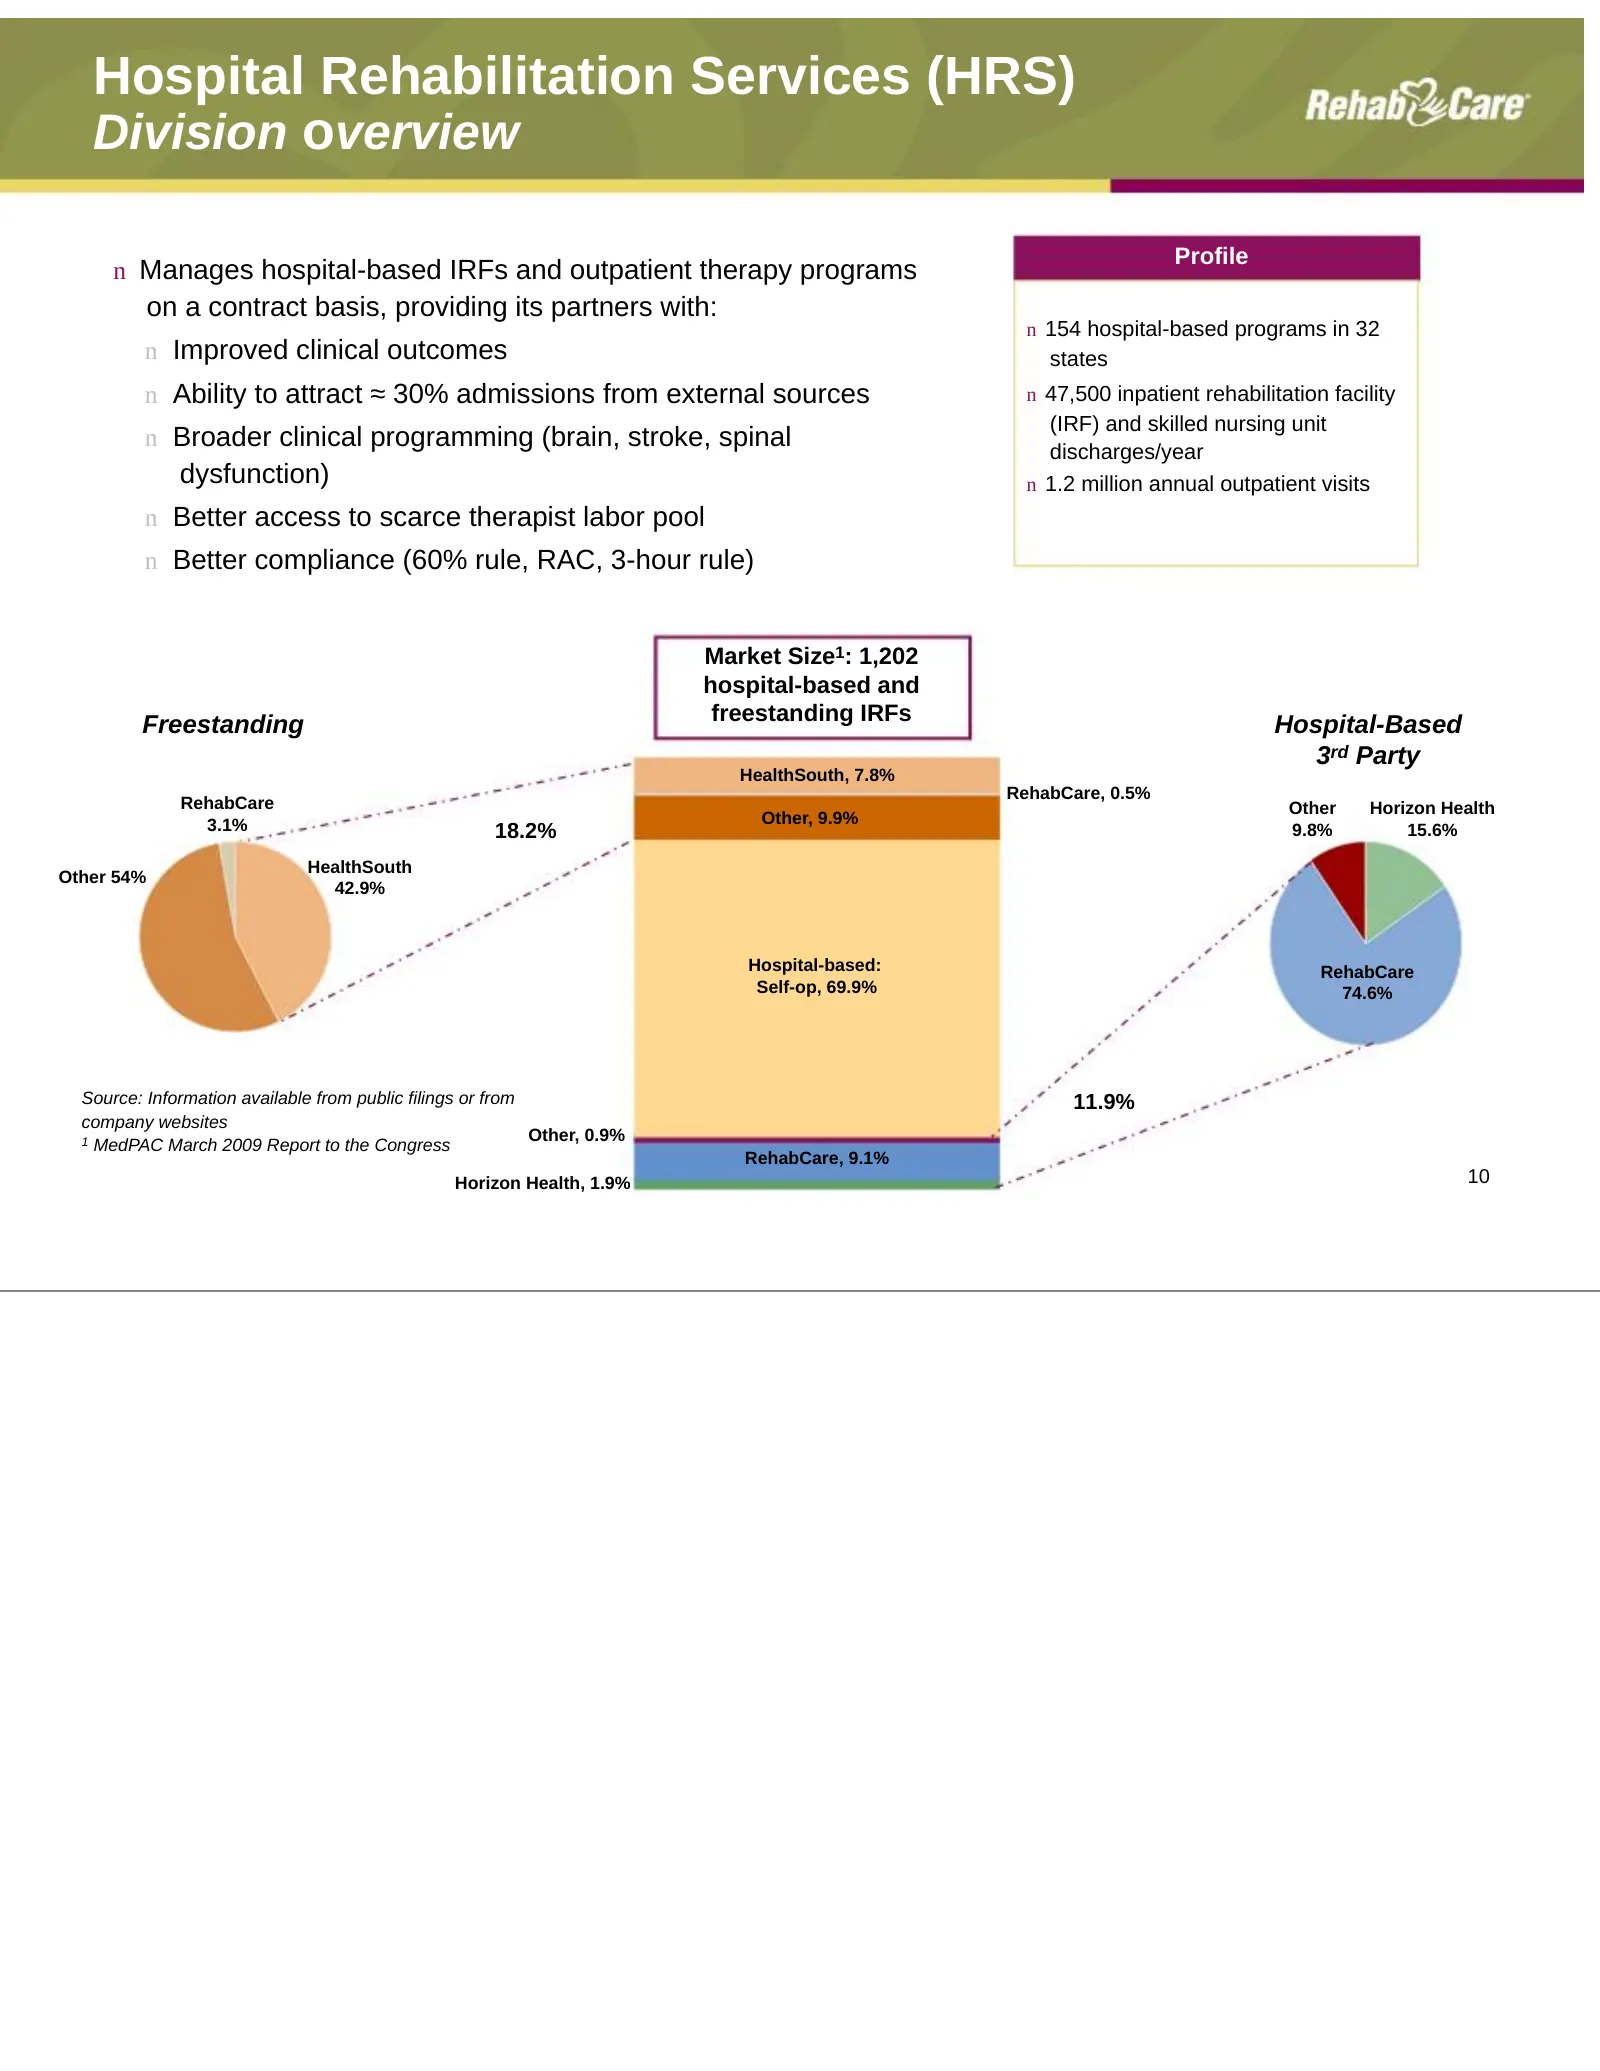
Hospital Rehabilitation Services (HRS) Division overview Profile n Manages hospital-based IRFs and outpatient therapy programs on a contract basis, providing its partners with: n 154 hospital-based programs in 32 n Improved clinical outcomes states n Ability to attract ≈ 30% admissions from external
Slide 12: HRS Division Performance/outlook
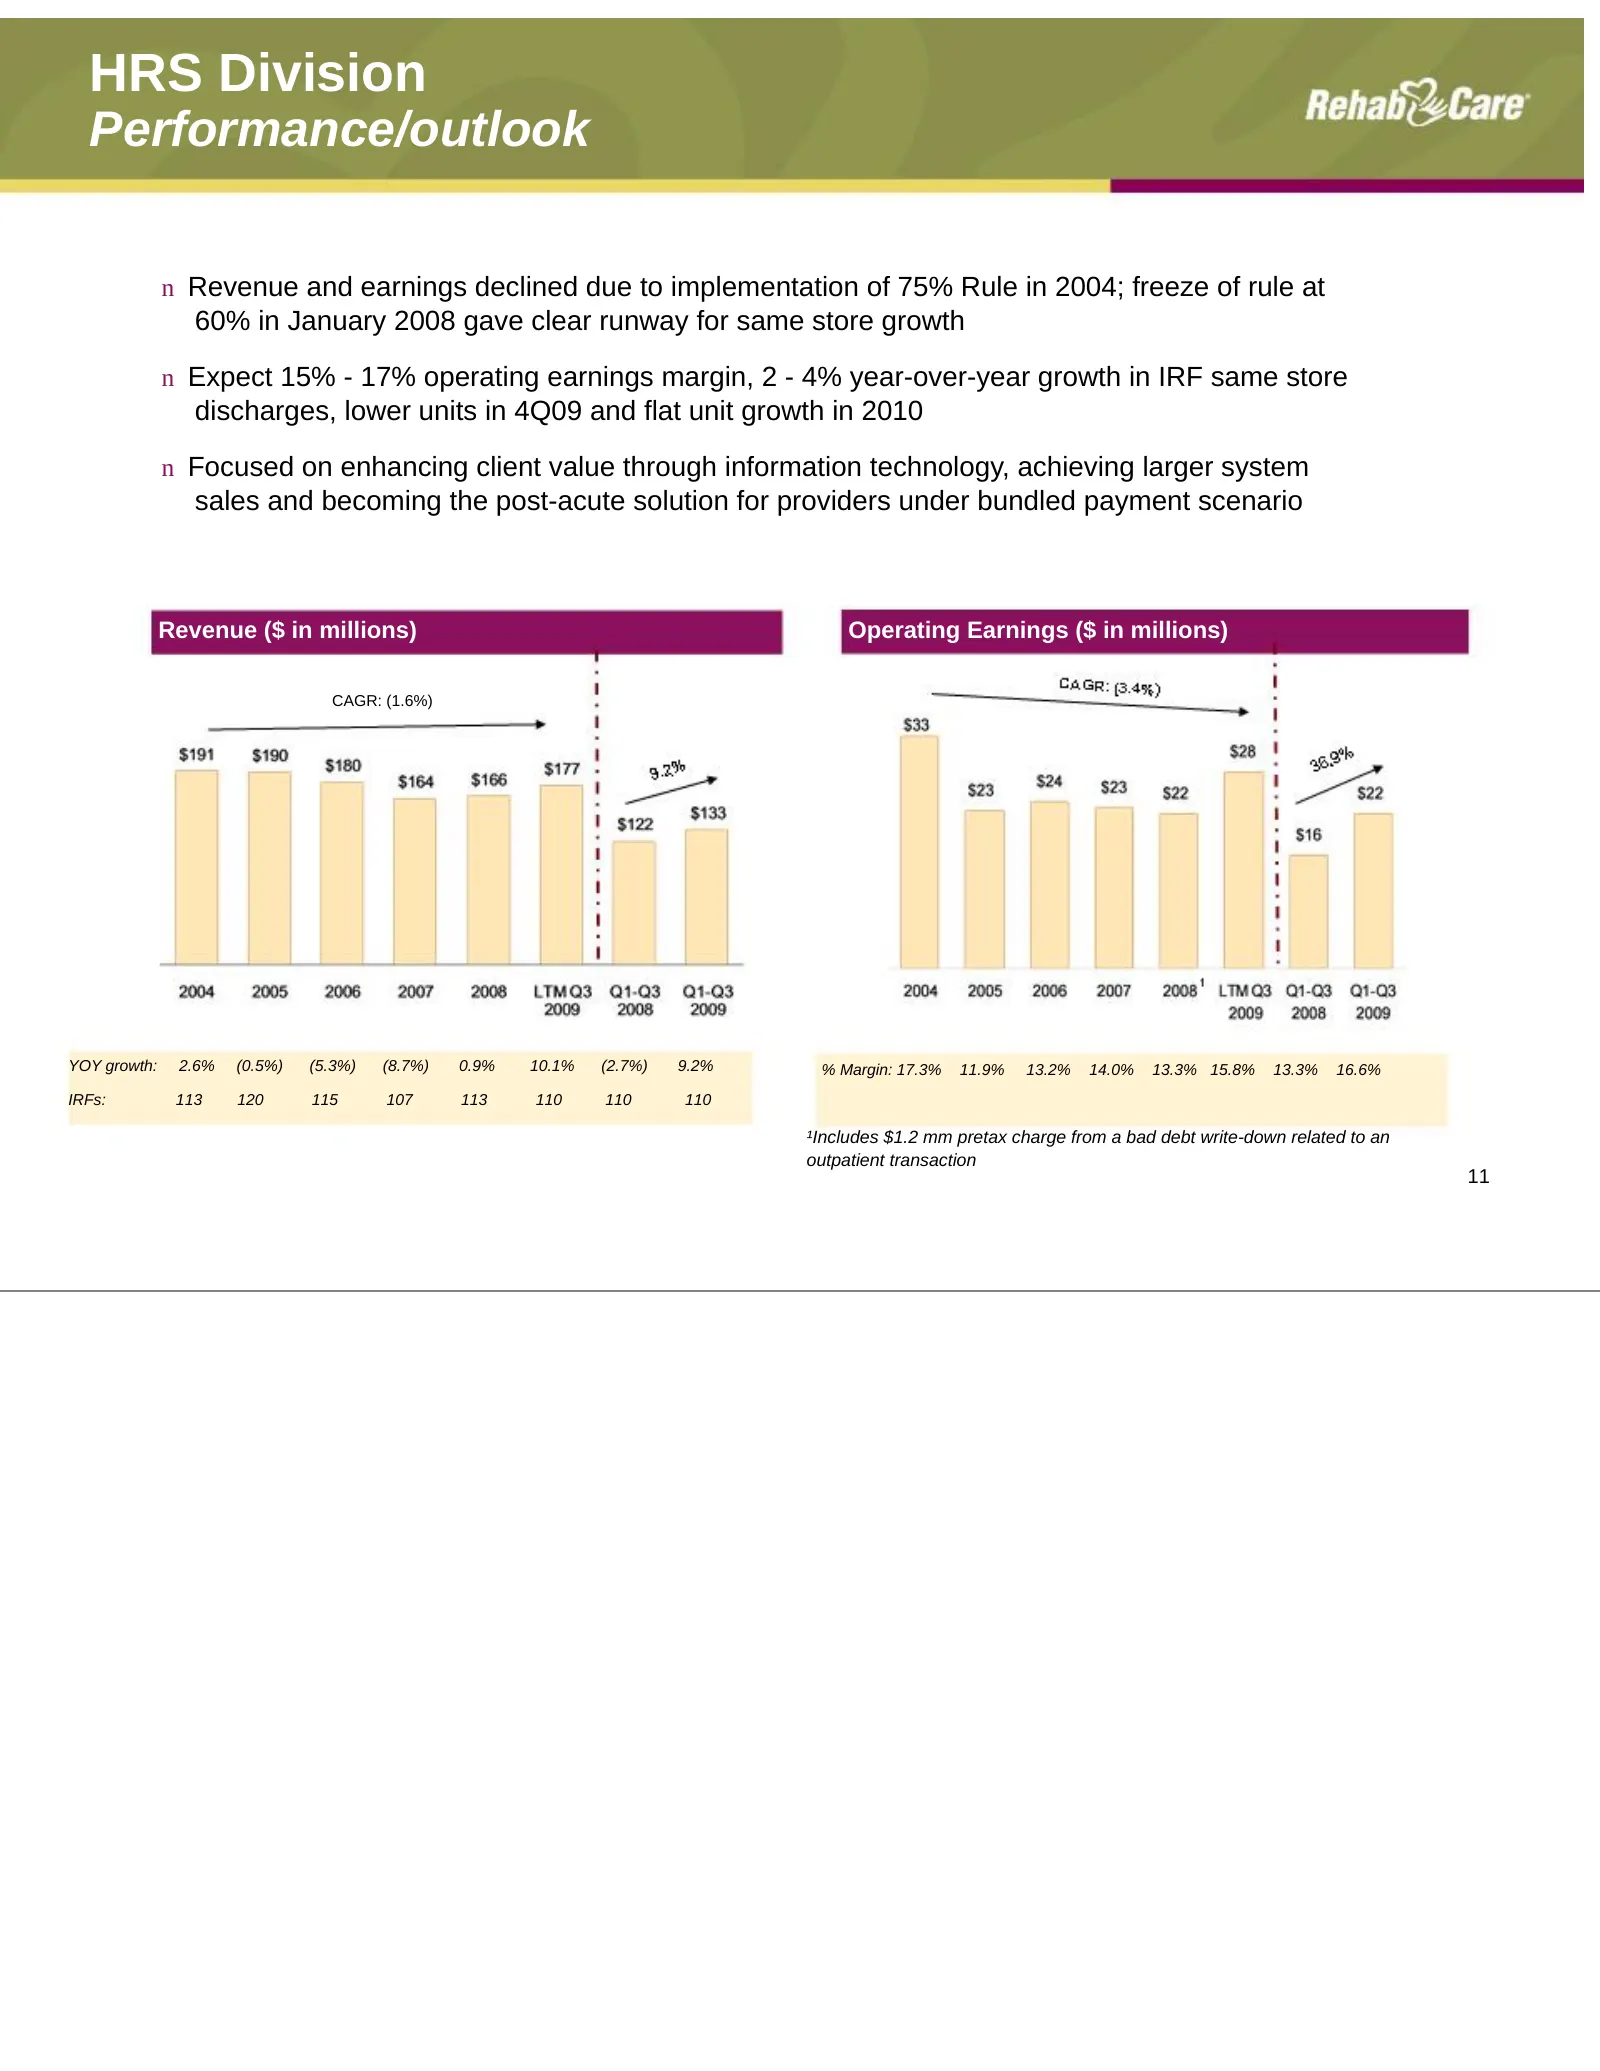
HRS Division Performance/outlook n Revenue and earnings declined due to implementation of 75% Rule in 2004; freeze of rule at 60% in January 2008 gave clear runway for same store growth n Expect 15% - 17% operating earnings margin, 2 - 4% year-over-year growth in IRF same store discharges, lower uni
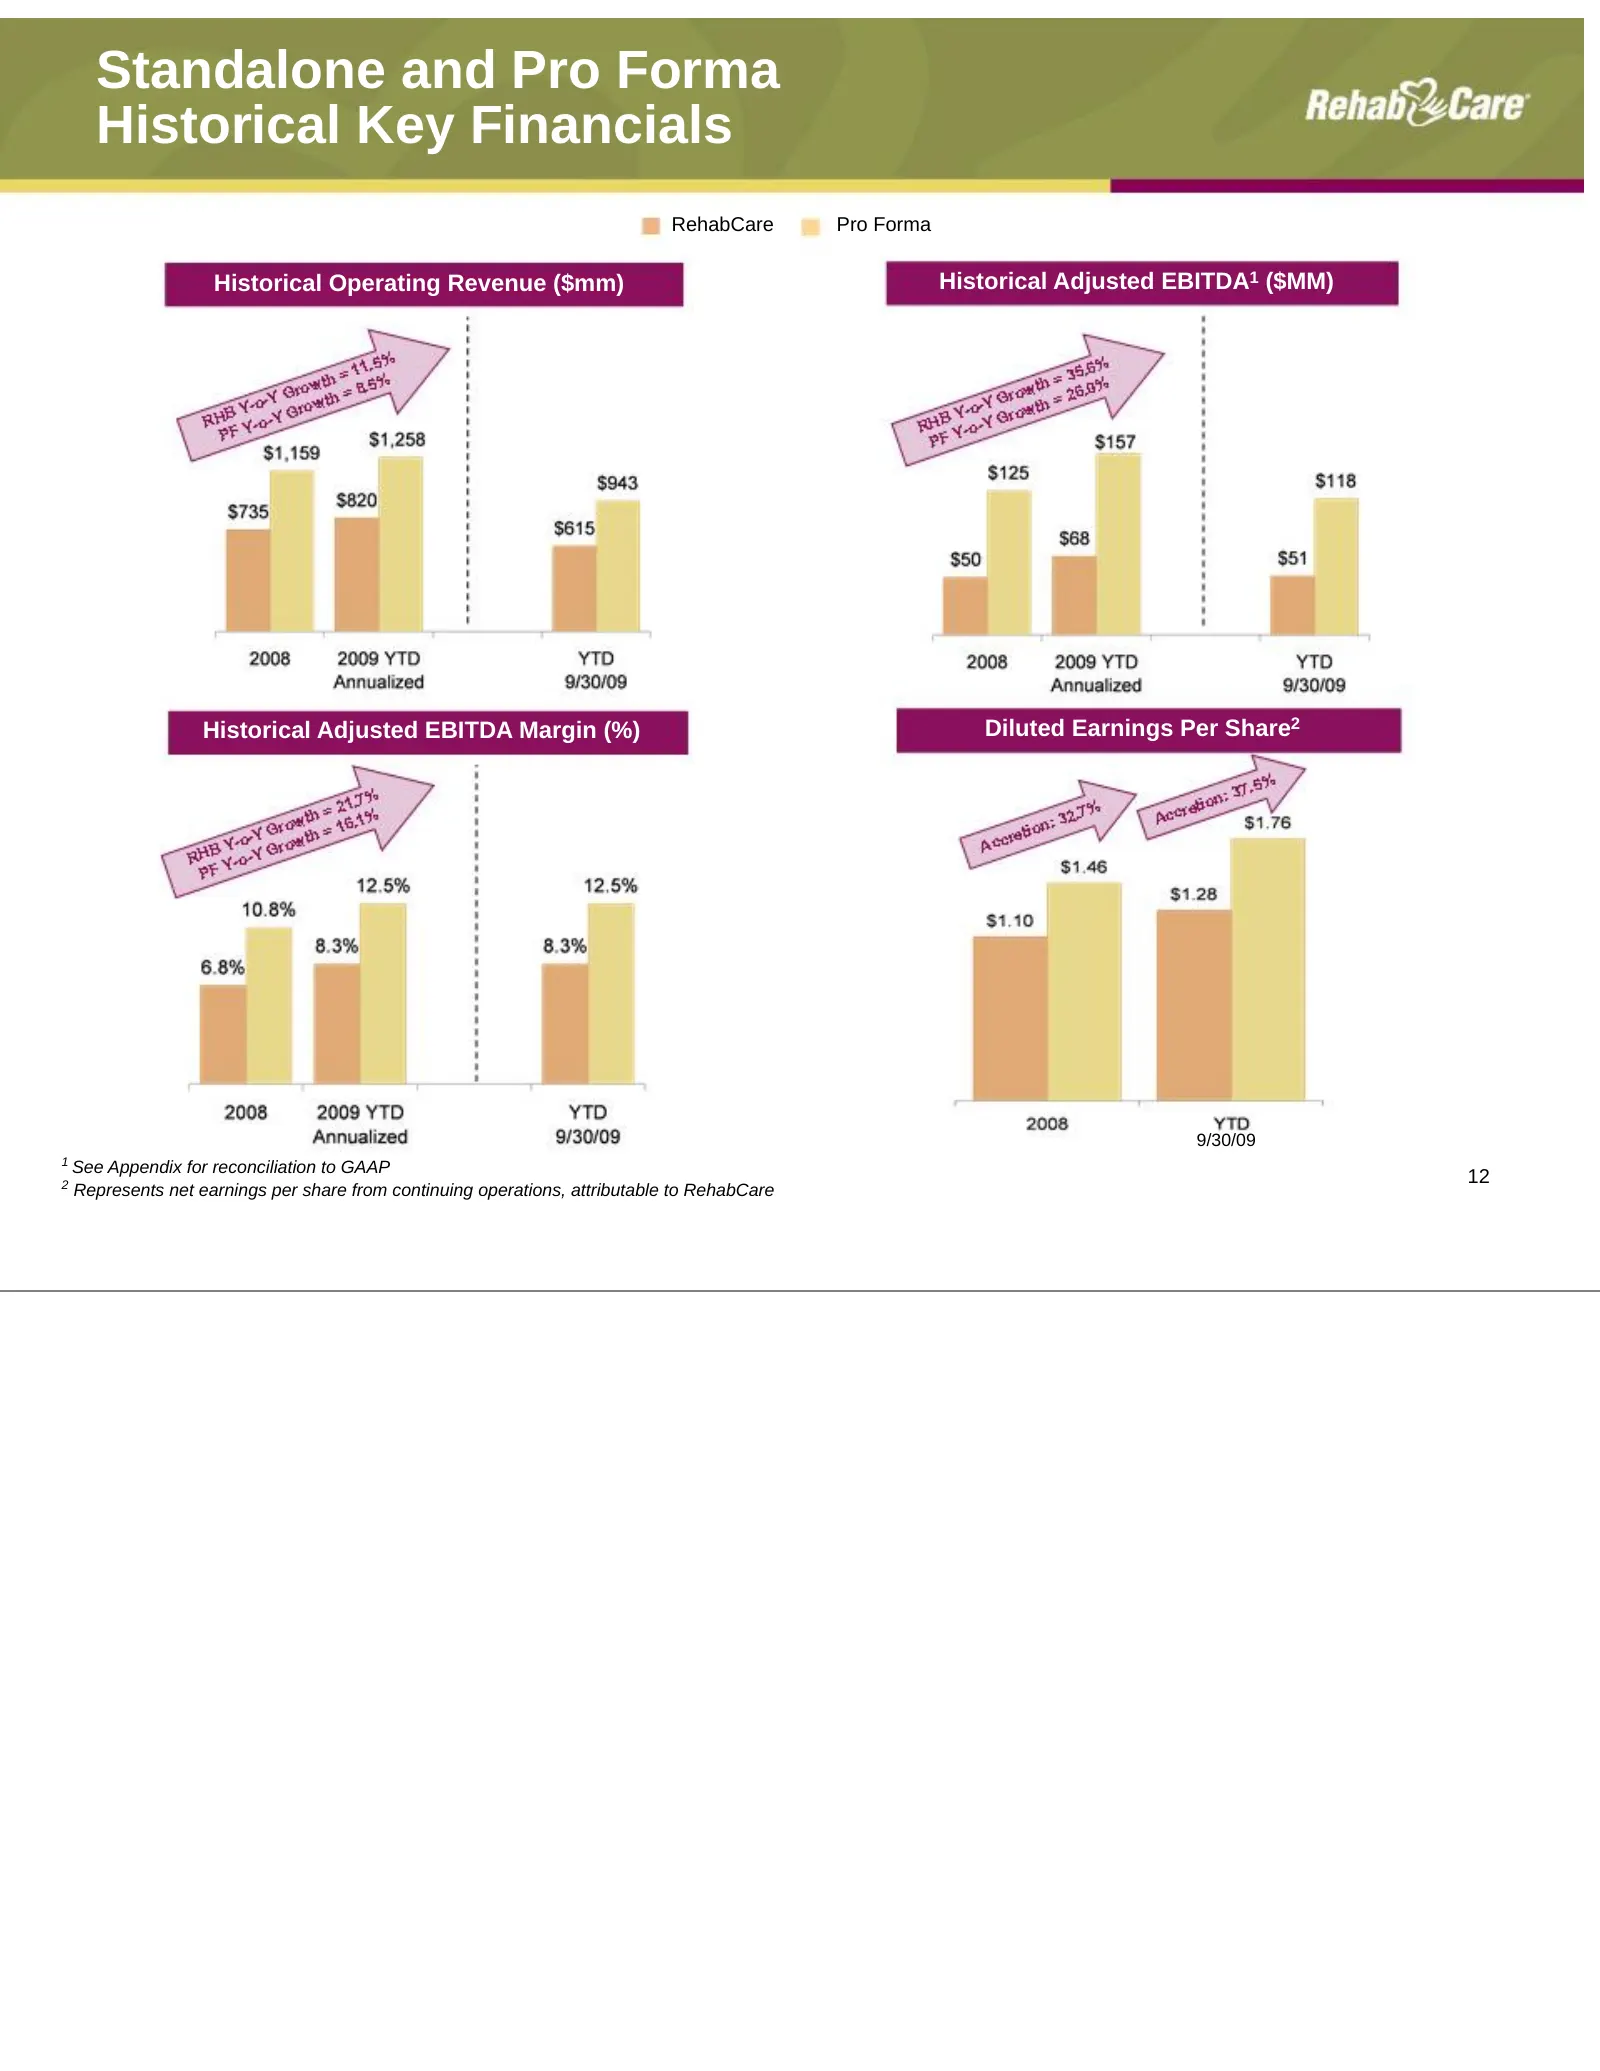
Slide 13: Standalone and Pro Forma Historical Key Financials
Standalone and Pro Forma Historical Key Financials RehabCare Pro Forma Historical Operating Revenue ($mm) Historical Adjusted EBITDA1 ($MM) Historical Adjusted EBITDA Margin (%) Diluted Earnings Per Share2 9/30/09 1 See Appendix for reconciliation to GAAP 2 12 Represents net earnings per share from
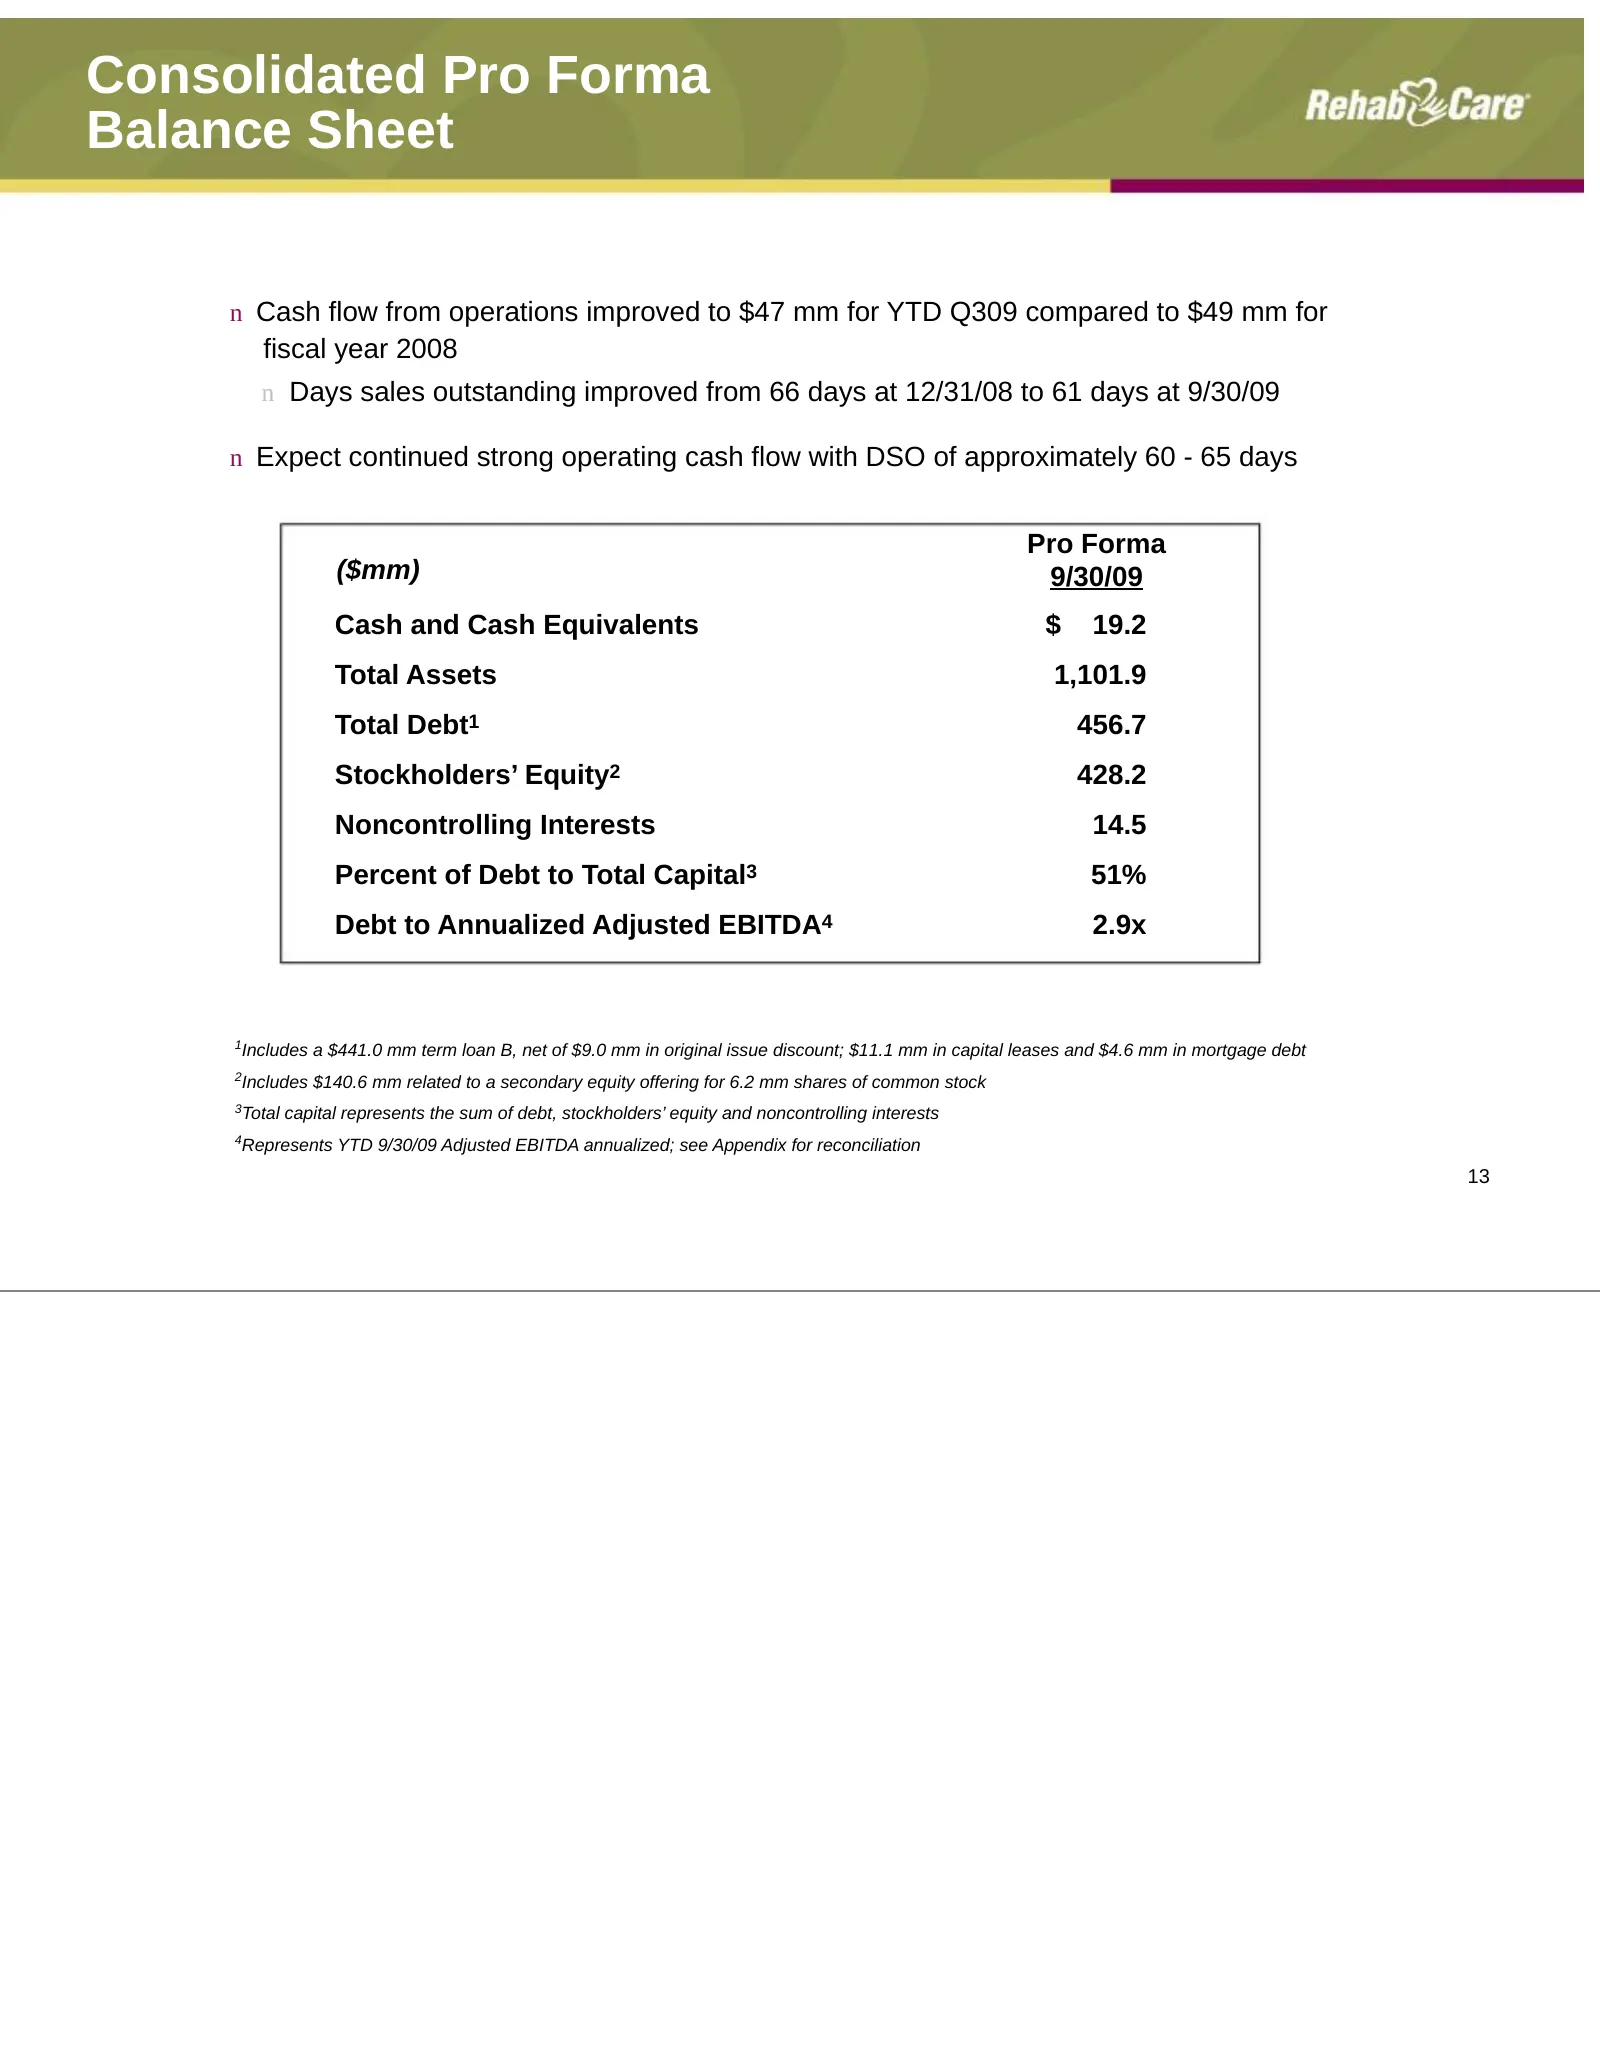
Slide 14: Consolidated Pro Forma Balance Sheet
Consolidated Pro Forma Balance Sheet n Cash flow from operations improved to $47 mm for YTD Q309 compared to $49 mm for fiscal year 2008 n Days sales outstanding improved from 66 days at 12/31/08 to 61 days at 9/30/09 n Expect continued strong operating cash flow with DSO of approximately 60 - 65 da
Slide 15: Strategic Direction
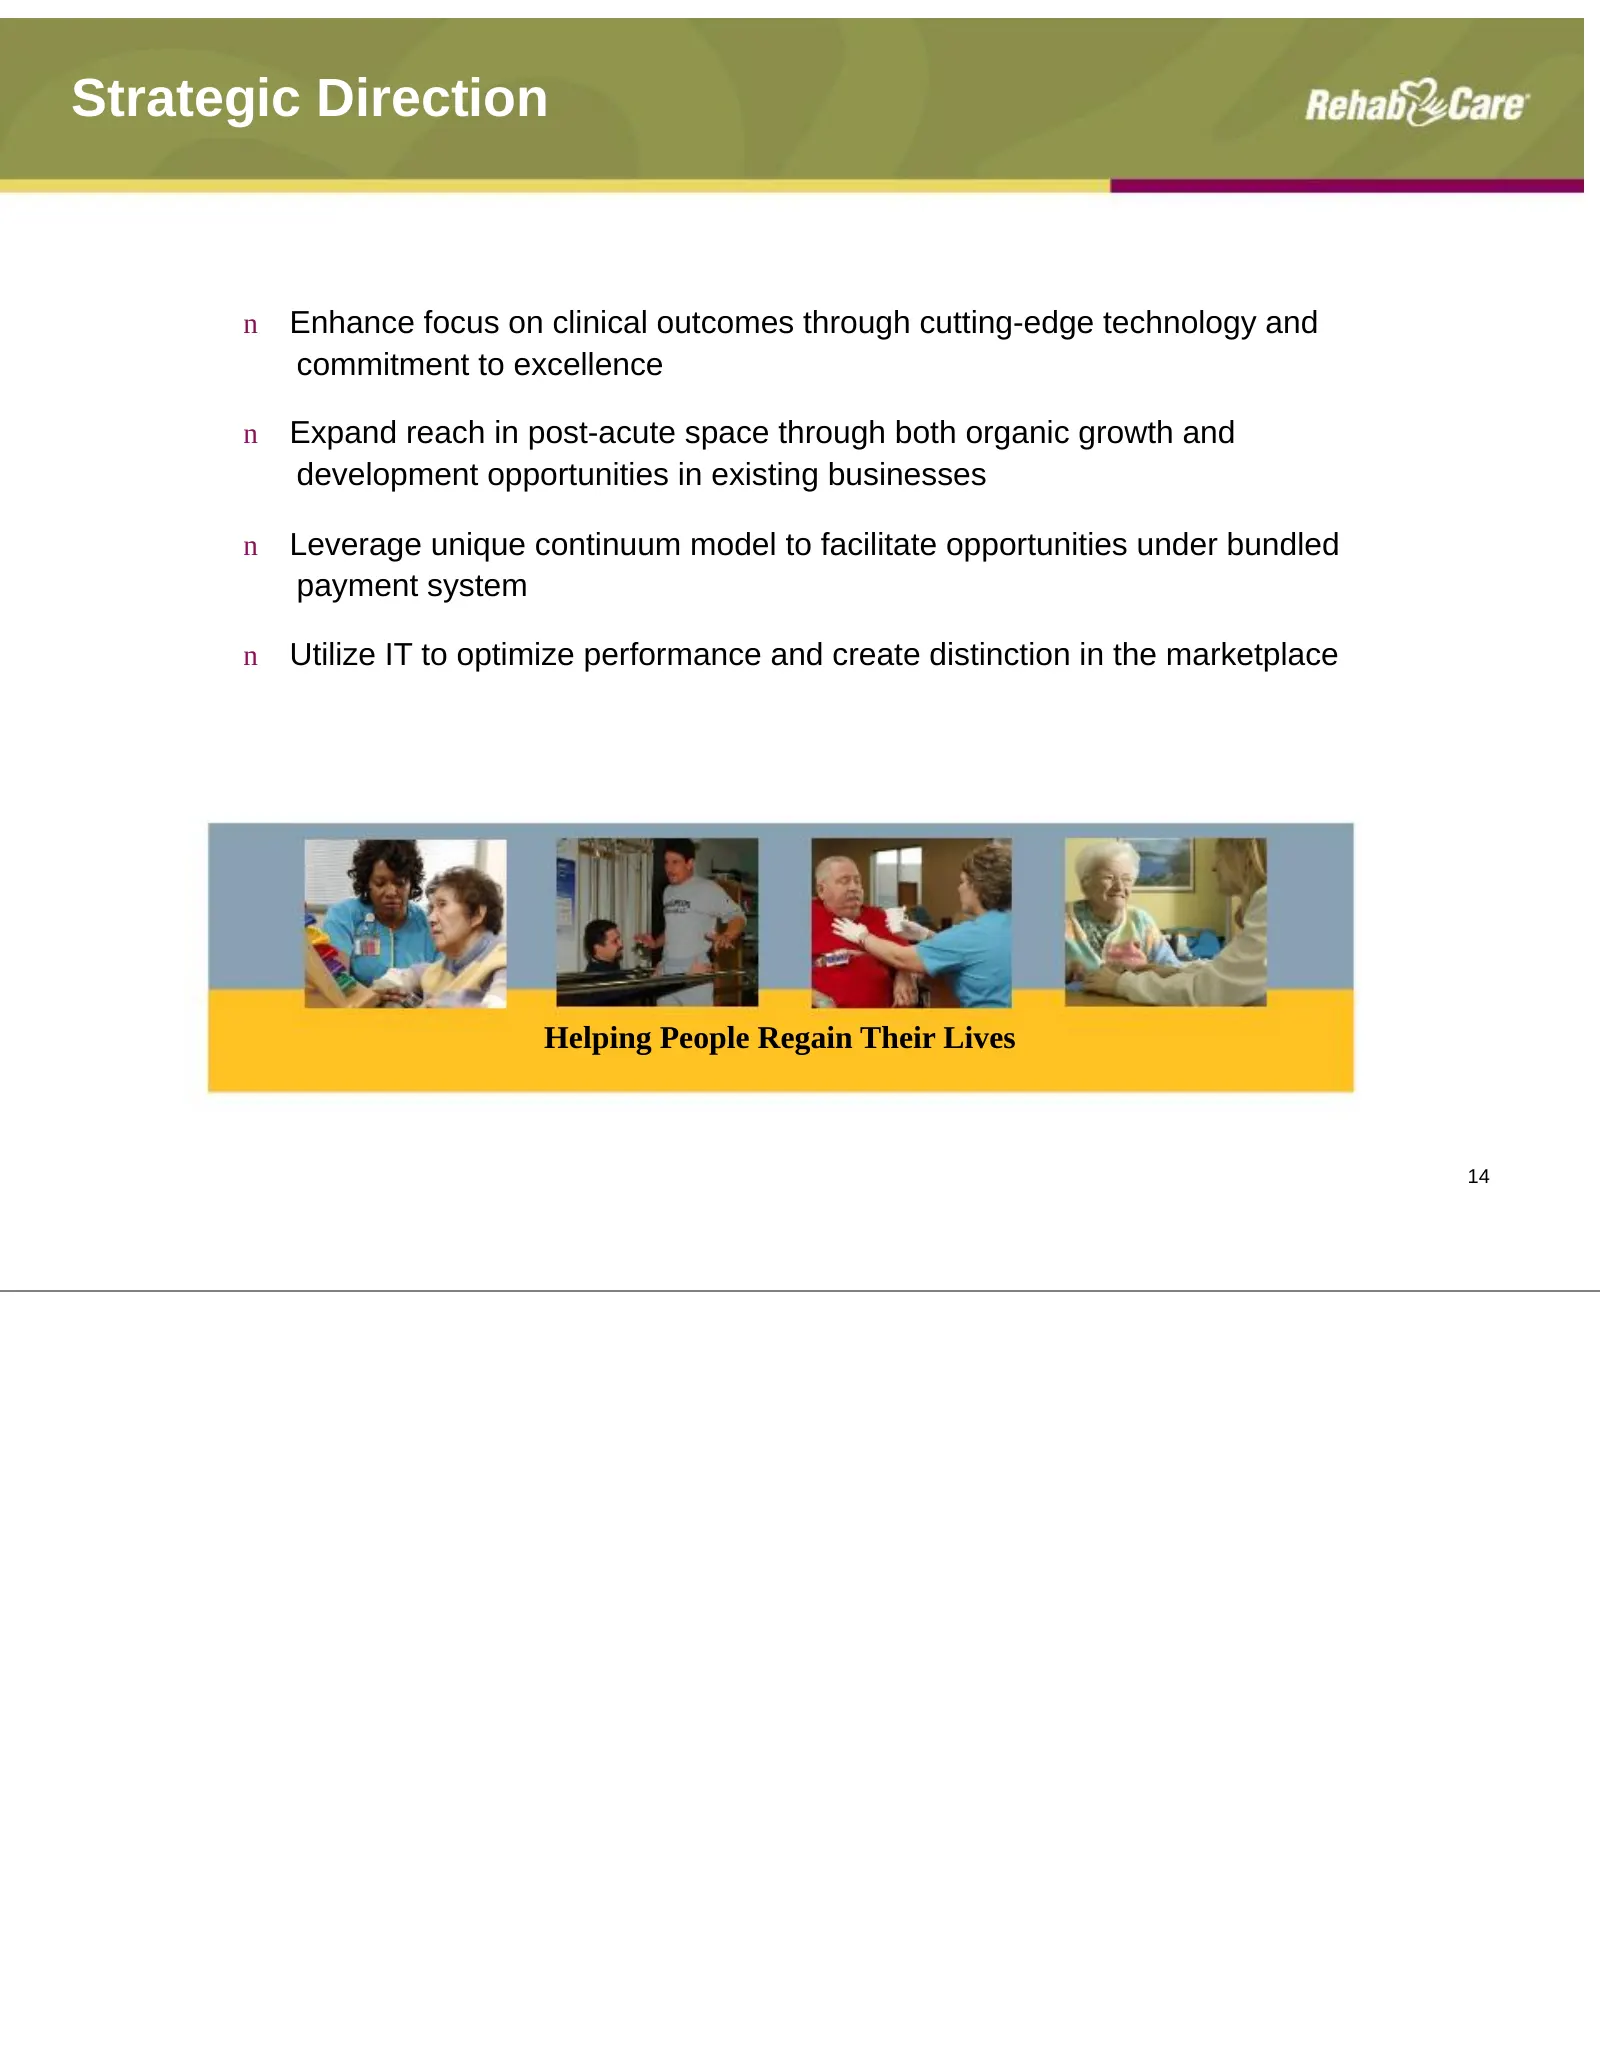
Strategic Direction n Enhance focus on clinical outcomes through cutting-edge technology and commitment to excellence n Expand reach in post-acute space through both organic growth and development opportunities in existing businesses n Leverage unique continuum model to facilitate opportunities unde

Slide 16: Safe Harbor
Safe Harbor Forward-looking statements have been provided pursuant to the safe harbor provisions of the Private Securities Litigation Reform Act of 1995. Such statements are based on the Company’s current expectations and could be affected by numerous factors, risks and uncertainties discussed in th
Slide 17: Appendix
RehalyZCare Appendix
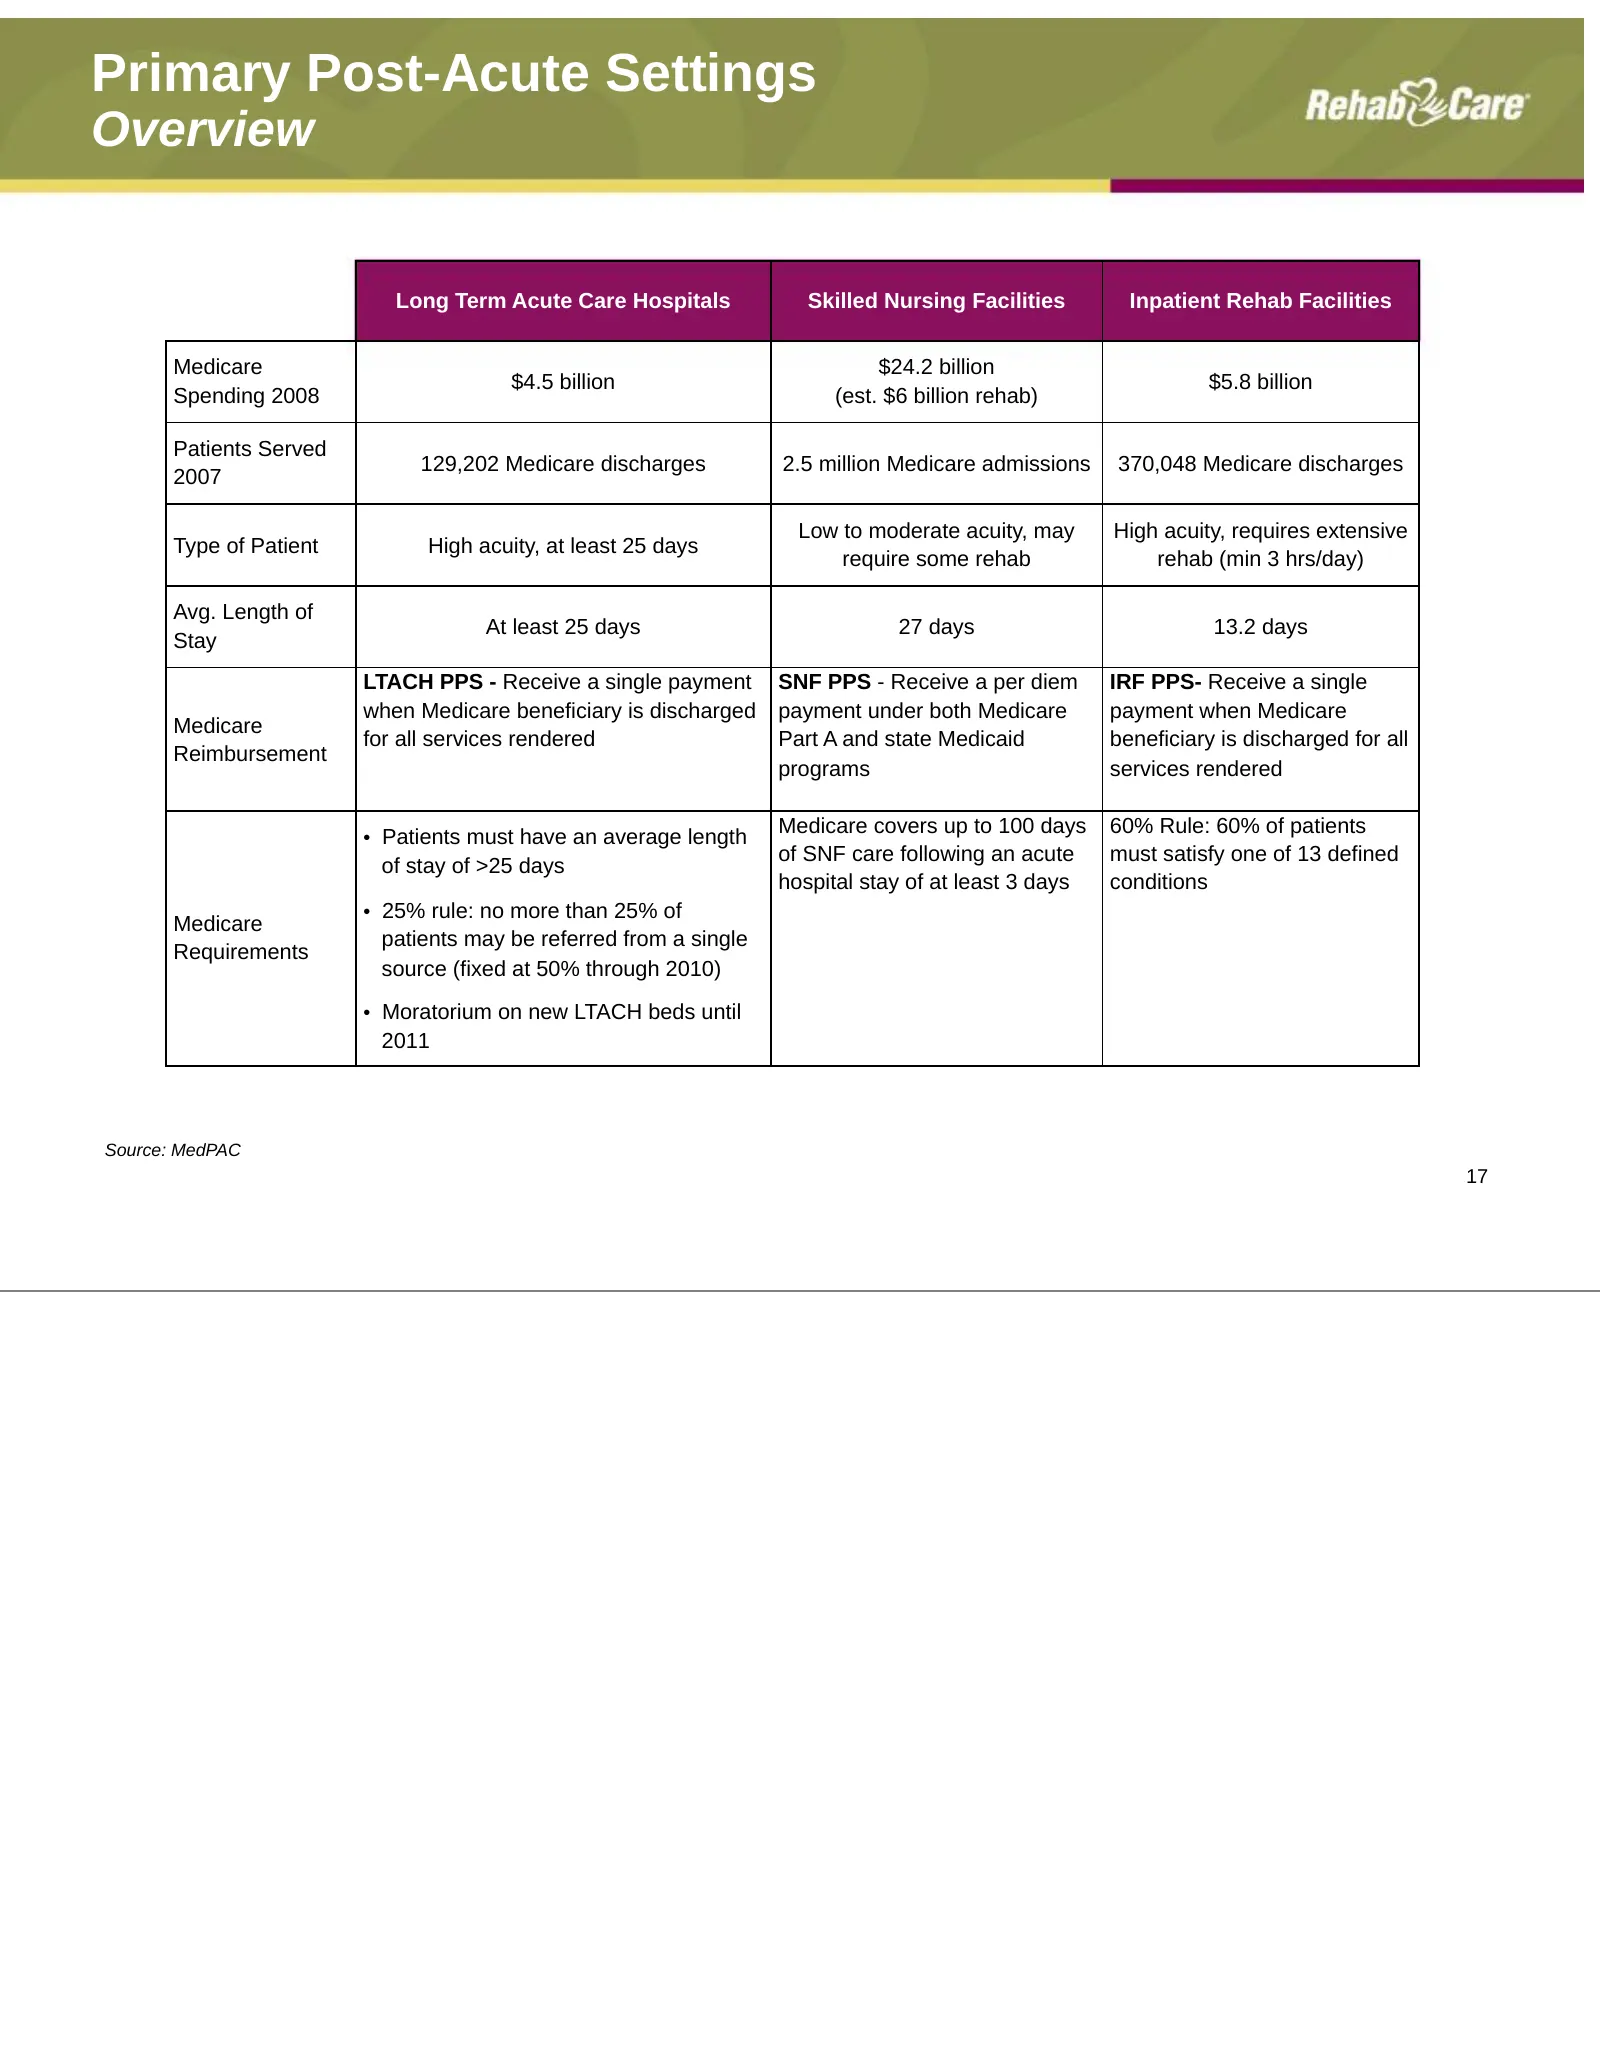
Slide 18: Primary Post-Acute Settings Overview
Primary Post-Acute Settings Overview Long Term Acute Care Hospitals Skilled Nursing Facilities Inpatient Rehab Facilities Medicare $24.2 billion $4.5 billion $5.8 billion Spending 2008 (est. $6 billion rehab) Patients Served 129,202 Medicare discharges 2.5 million Medicare admissions 370,048 Medicar
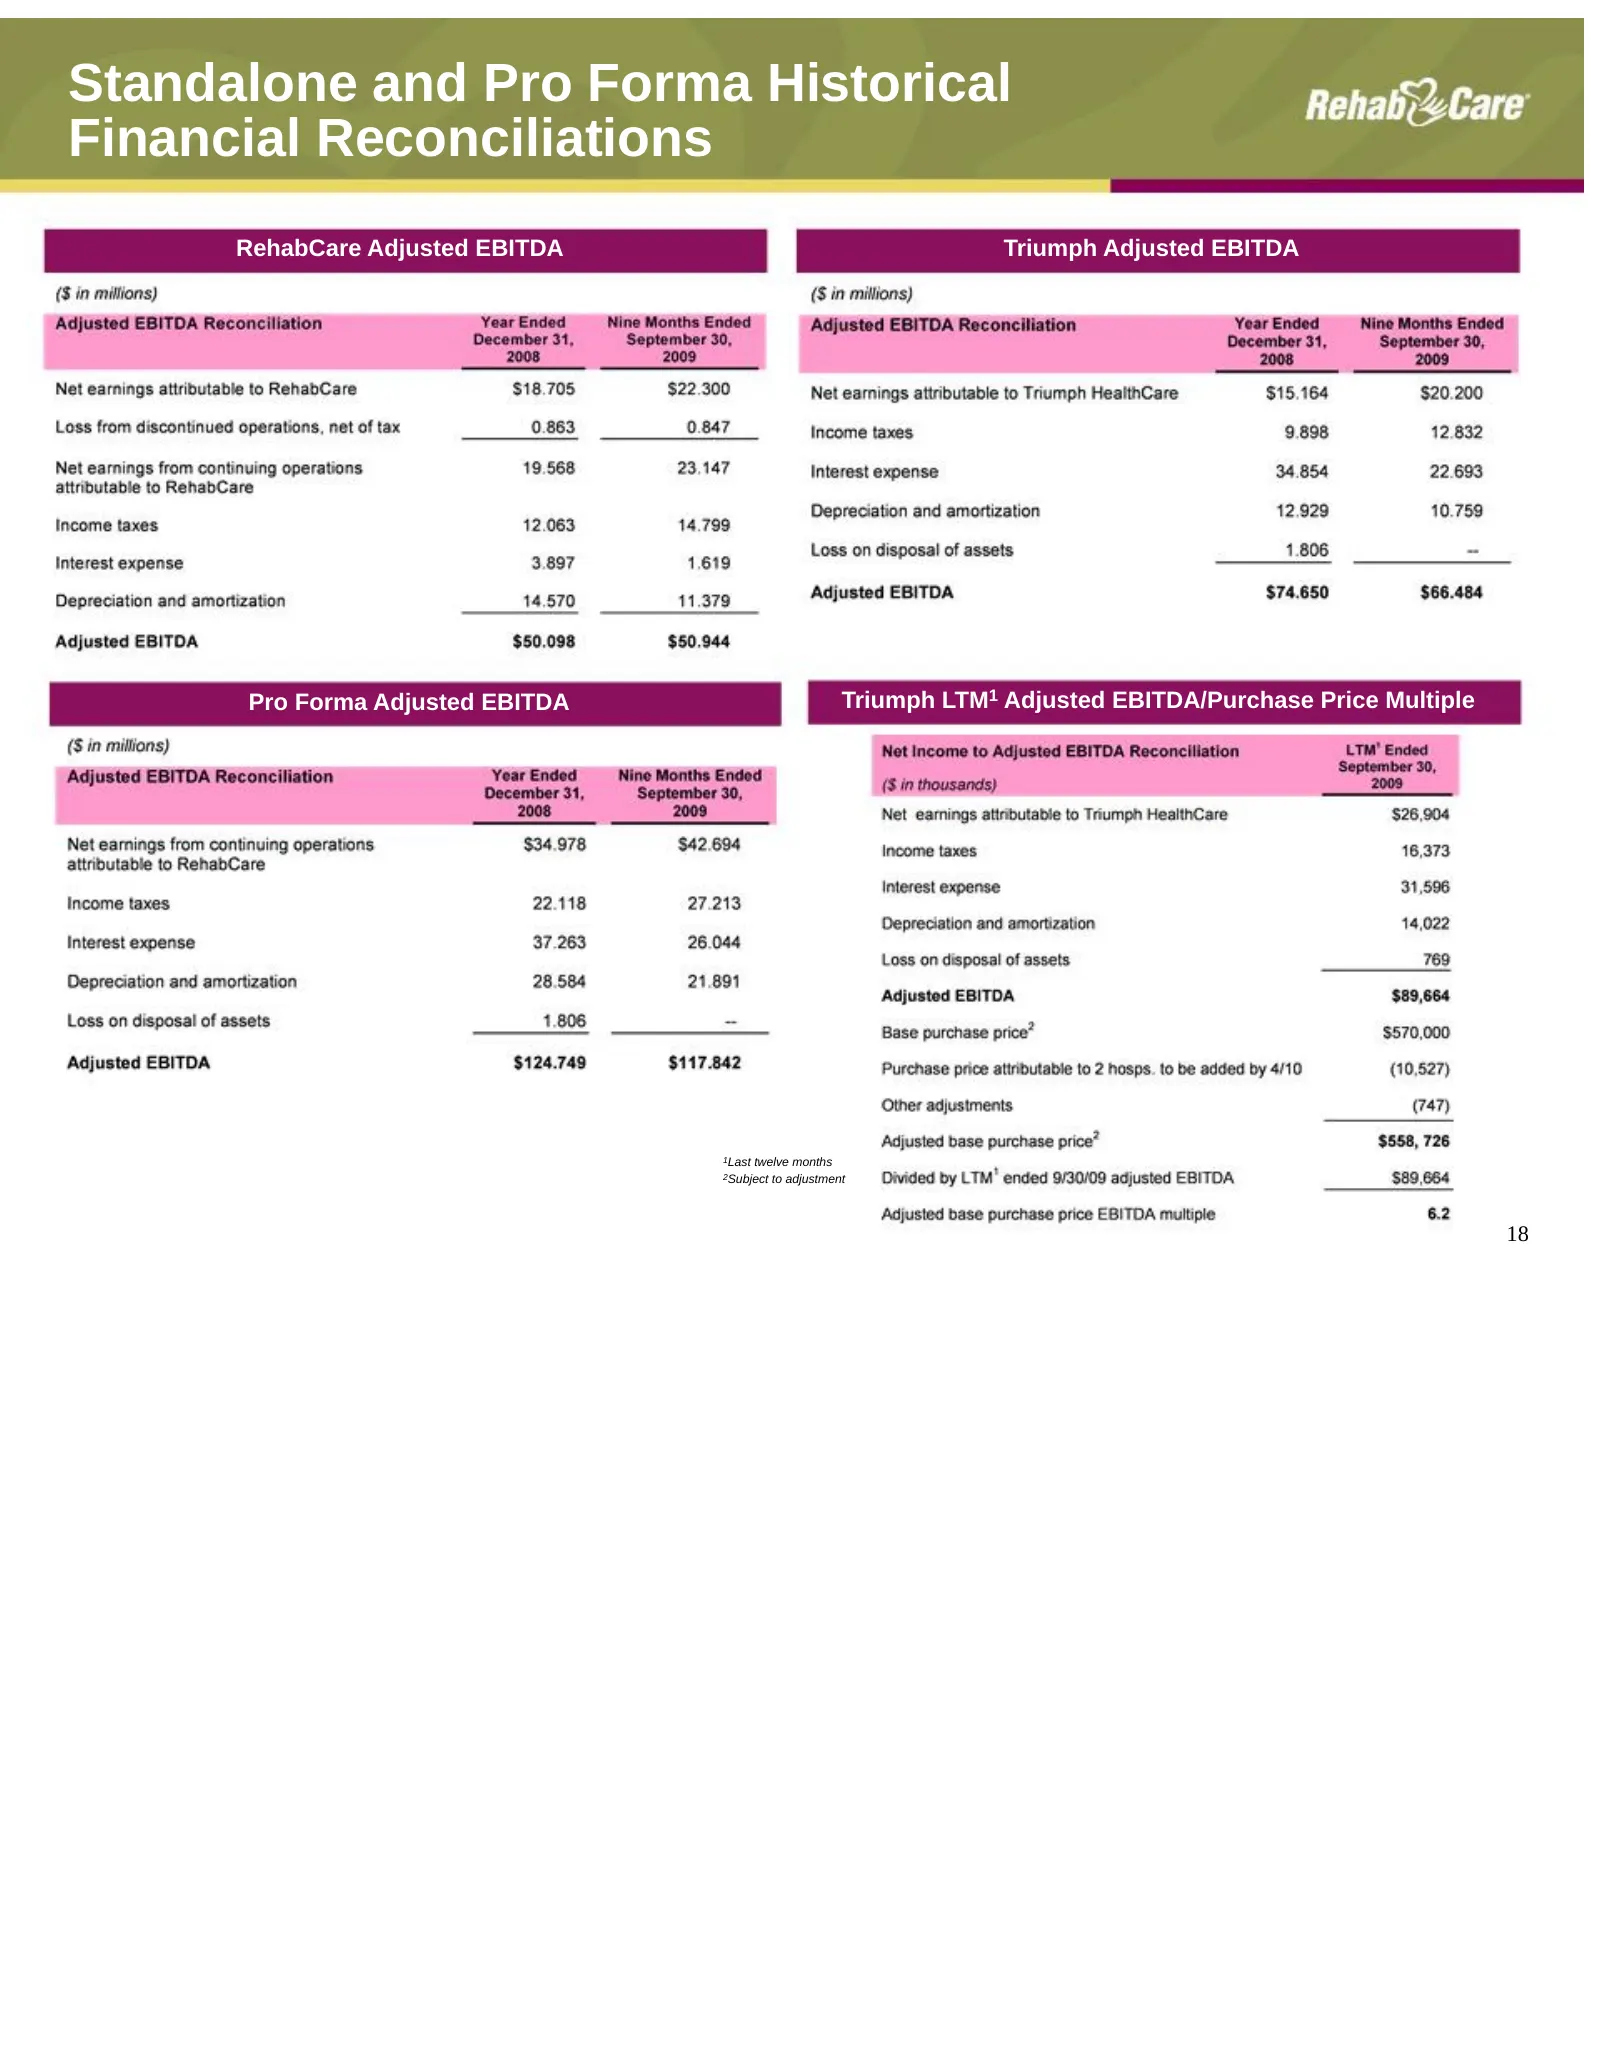
Slide 19: Standalone and Pro Forma Historical Financial Reconciliations
Standalone and Pro Forma Historical Financial Reconciliations RehabCare Adjusted EBITDA Triumph Adjusted EBITDA Pro Forma Adjusted EBITDA Triumph LTM1 Adjusted EBITDA/Purchase Price Multiple 1Last twelve months 2Subject to adjustment 18
Source: SEC EDGAR · 8-K filed Jan 12, 2010
More decks from Rehabcare Group Inc
 Merger or Acquisition (May 2011)42 slides · May 12, 2011
 Merger or Acquisition (March 2011)35 slides · Mar 16, 2011
 Merger or Acquisition (March 2011)28 slides · Mar 3, 2011
 Merger or Acquisition (February 2011)15 slides · Feb 10, 2011
 J.P. Morgan Healthcare Conference 201127 slides · Jan 10, 2011
 Q3 2010 Earnings Presentation26 slides · Nov 17, 2010