Sun Healthcare — Non-Deal Roadshow (August 2007)
22 slides from Sun Healthcare's roadshow presentation, Aug 6, 2007

Slide 1: Investor Relations Roadshow August 2007
Investor Relations Roadshow AUGUST 2007 Investment Bank Investor Relations Roadshow AUGUST 2007 UBS

Slide 2: Forward-looking statements
Statements made in this presentation may contain “forward-looking” information, such as forecasts of future financial performance. Such statements involve risks and uncertainties and are subject to change at any time. Factors that could cause actual results to differ materially include, but are not

Slide 3: Investment Highlights
Investment Highlights • Attractive industry fundamentals and reimbursement outlook • Nationally diversified portfolio of facilities • Focus on high-acuity patients • Harborside acquisition creates one of the largest U.S. operators • Demonstrated integration track record • Strong financial performanc
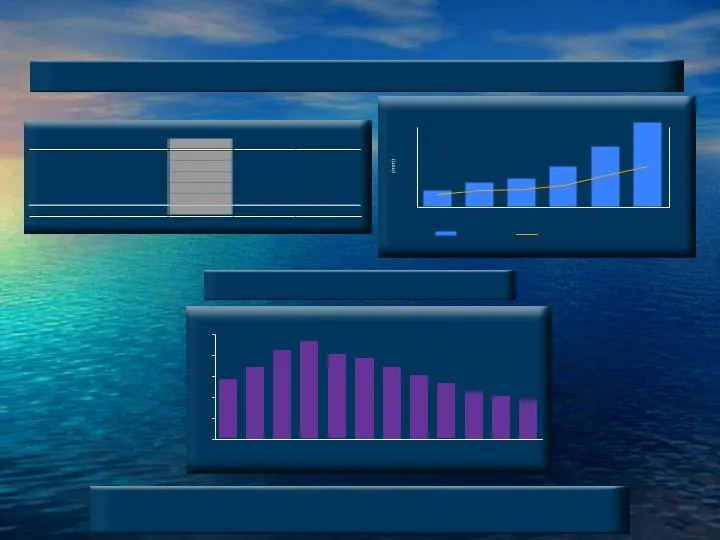
Slide 4: Attractive Industry Fundamentals
Source: CMS. (in thousands) SNFs- Lowest Cost Setting for Rehab and Recovery 85+ Population Growth Declining Number of Nursing Facilities Source: US Census Bureau. (in millions) 7 4 6 10 15 21 1.5% 2.0% 2.2% 2.6% 3.9% 5.0% 0 5 10 15 20 2000A 2010E 2020E 2030E 2040E 2050E 0% 2% 4% 6% 8% 10% 85+ Popul
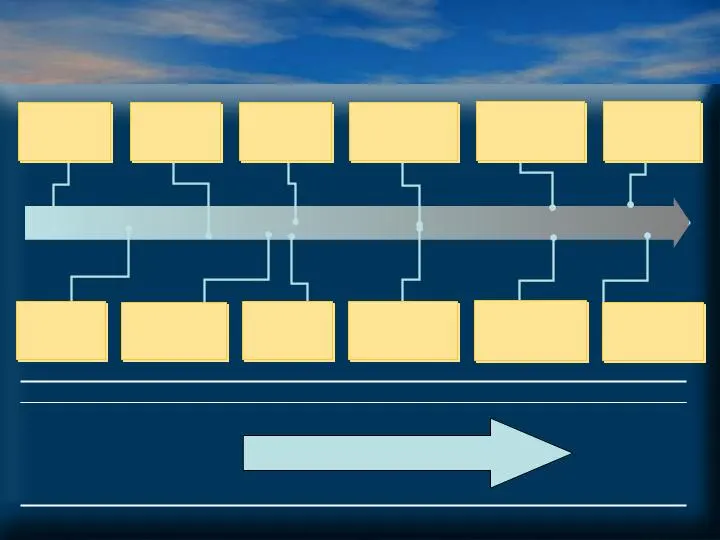
Slide 5: The Sun Story
(1) Includes revolving credit, synthetic L/C and delayed draw term loan facilities, all of which were undrawn at close. (2) Sun standalone. 2001 2002 2003 2004 2005 2006 ($ in millions) 2007 The Sun Story 2001 2002 2003 2004 2005 2006 November 2001 Rick Matros joined Sun as Chairman & CEO February 2

Slide 6: Harborside Healthcare Overview
Harborside Healthcare Overview
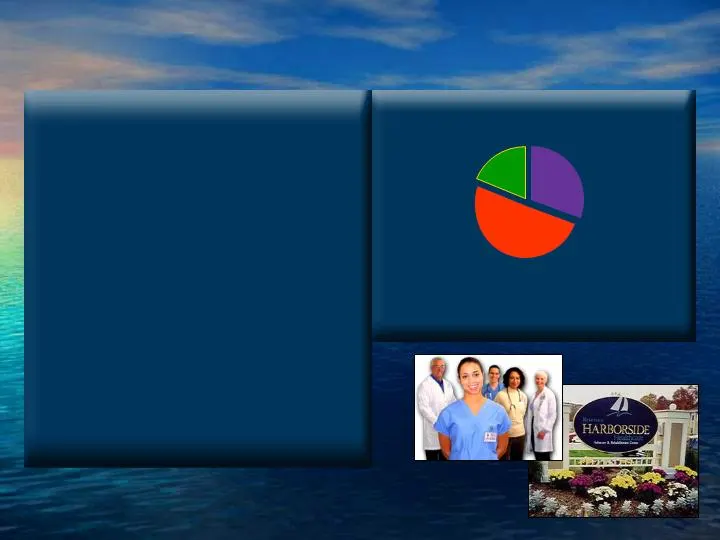
Slide 7: Harborside's High Quality Portfolio
t t 73 SNFs and 2 ALFs/ILFs located in 10 states 53 (1) owned and 22 leased 8,979 licensed beds 2006 pro forma revenues and Adjusted EBITDA of $653.2 million and $71.6 million, respectively FY 2006 occupancy of 91% t t FY 2006 Medicare revenue of 31% t t Strong Quality Results ($ in millions) (1) In
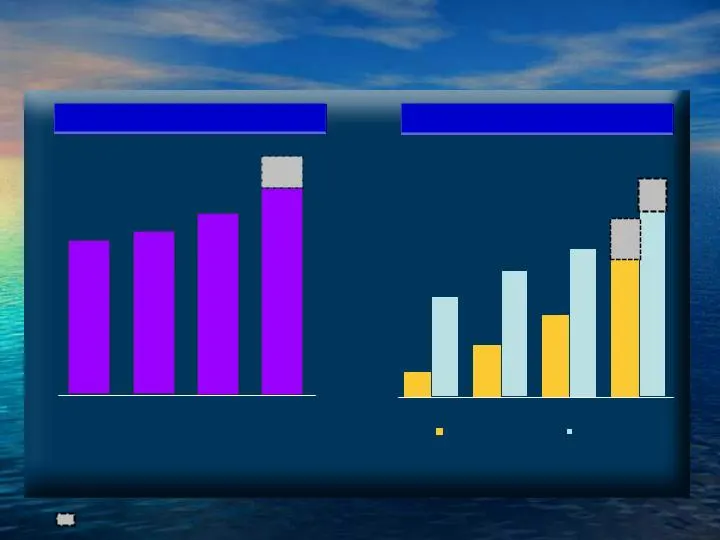
Slide 8: Harborside's Strong Financial Performance
($ in millions) Adjusted EBITDAR and EBITDA Revenues ($ in millions) Represents the full year impact of acquisitions completed during 2006 and the exercise of the Moffie and NHP purchase options. 2003 2004 2005 2006 $421.2 $447.4 $495.7 $653.2 $71.6 $32.8 $20.9 $9.9 $88.0 $60.3 $51.2 $40.6 Adj. EBIT

Slide 9: Combined Company Overview
Combined Company Overview
Slide 10: Sun Pro Forma for Harborside Acquisition
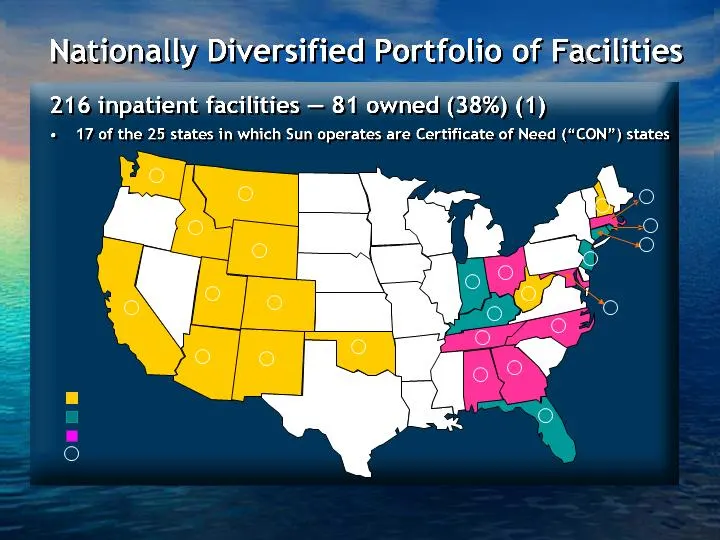
• Acquisition creates one of the largest long-term care operators in the U.S. • Strong asset base of 216 inpatient facilities across 25 states • High CON concentration provides barriers to entry – 17 of 25 states • Significant facility ownership – 81 Facilities (1) - 38% • Leverages existing Sun inf
Slide 11: Facilities and Licensed Beds in 25 States
6 5 10 17 3 1 9 1 12 12 4 20 3 19 10 1 15 2 17 7 9 9 8 9 7 Existing Sun State Harborside State Overlapping State # Number of Facilities 24,426 Licensed Beds in 25 States (1) Includes the exercise of Harborside’s purchase options on the Moffie portfolio (five facilities) and the NHP portfolio (four f
Slide 12: Consolidated Company Financials
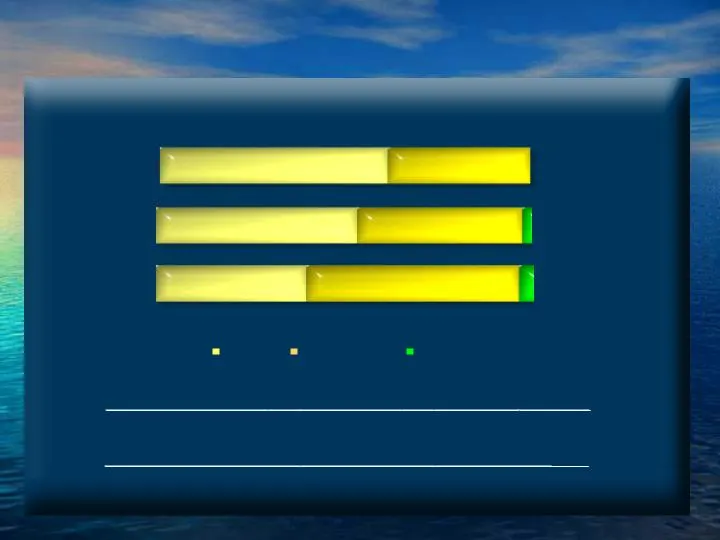
Consolidated Company Financials Adjusted Pro Forma for the Six Months ended June 30, 2007 $884.1 million Consolidated $104.3 million $60.7 million Note: Adjusted Pro Forma combines Sun and Harborside results for 2006 annualizing transactions that took place during the year, giving effect to the Moff
Slide 13: Improving Inpatient Performance Metrics
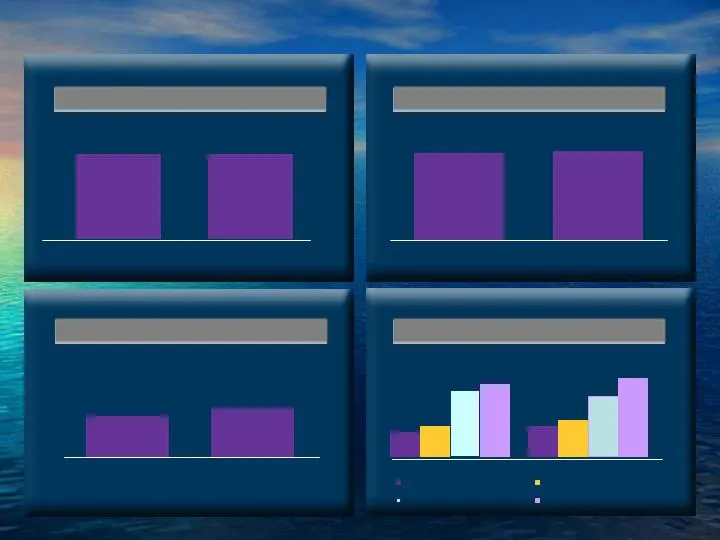
Medicare as a % of Revenue (2) Inpatient Revenue Quality Mix (3) Inpatient Revenue Per Patient Day Occupancy (1) (1) Quality mix includes all non-Medicaid inpatient revenues. Commercial Insurance Medicare [Part A] Q2 2006 Q2 2007 31.6% 31.0% Q2 2006 Q2 2007 88.6% 89.0% Q2 2006 Q2 2007 $378 $354 $408
Slide 14: Sun's High Acuity Strategy Drives Margins
The inpatient business has a continued opportunity to improve acuity and increase margins. REX Days as a % of Medicare Days Rehab Days as a % of Total Medicare Days 37.2% 35.0% Q2 2006 Q2 2007 82.4% 79.0% Q2 2006 Q2 2007 Sun’s High Acuity Strategy Drives Margins • Sun’s rehabilitation therapy segmen

Slide 15: Rehab Recovery Suites - Opportunity for Growth
Rehab Recovery Suites - Opportunity for Growth • 32 Centers currently have RRS • RRS Centers have demonstrated: – Higher Medicare occupancy • 18.6% vs. 15% in non RRS Centers – Higher Managed Care/Comm Ins occupancy • 3.5% vs. 2.6% in non RRS Centers – Higher Rehab RUGS • 89.8% vs. 79.8% – Higher RE

Slide 16: Harborside Integration Plan
Harborside Integration Plan • Sun management has the experience and skill necessary to integrate large multi-facility acquisitions without disrupting existing operations • Acquisition of Harborside resulted in the establishment of a third reporting division with its own dedicated management • Identi
Slide 17: Ancillary Businesses
One of the largest contract rehab companies, providing physical, occupational and speech rehab therapy services Specializes in temporary therapy, pharmacy, physician, and nursing staffing 39 States 21 States $31.1 $29.2 7.0% 6.5% $2.4 $2.3 7.8% 7.7% Sun’s ancillary businesses are complementary to it

Slide 18: Financial Performance
Financial Performance

Slide 19: 2007 Guidance
2007 Guidance Low High Revenue Sun $1,100.0 $1,110.0 Harborside 505.0 509.0 Total $1,605.0 $1,619.0 EBITDAR Sun 110.0 114.0 Harborside 71.0 73.0 Synergies 6.0 6.0 Total 187.0 193.0 EBITDA Sun 54.0 58.0 Harborside 51.0 53.0 Synergies 6.0 6.0 Total 111.0 117.0 Depreciation and amortization 33.0 34.0 I

Slide 20: Sun Pro Forma Six Months Results
Sun Pro Forma 6 Months Results • Margin -EBITDAR normalized • Income from continuing • Operations - normalized • Diluted earnings per share • Actual Results Pro Forma Six Months ended June 30 Six Months ended June 30 2007 2006 2007 2006 • Revenue $720,233 $515,215 $884,077 $833,626 • Depreciation an

Slide 21: Pro Forma Capitalization Table
Pro Forma Capitalization Table ($ in millions) 6/30/07 Pro Forma Cash $ 84.5(1) $ 25.0(1) Debt: Revolver 15.0 0.0 Mortgage Debt 83.0 83.0 Assumed Mortgage Debt 31.7 52.7 Clipper Debt 49.8 49.6 Senior Secured Debt 306.4 306.4 Senior Secured Delayed Draw 35.0 35.0 Subordinated Debt 200.0 200.0 Other L

Slide 22: Sun Healthcare Group
‘Sun Healthcare Group
Source: SEC EDGAR · 8-K filed Aug 6, 2007
More decks from Sun Healthcare Group Inc
 Jefferies 2012 Global Healthcare Conference17 slides · Jun 6, 2012
 J.P. Morgan Healthcare Conference 201219 slides · Jan 10, 2012
 Investor Presentation (March 2011)36 slides · Mar 29, 2011
 JPMorgan Healthcare Conference (January 2011)27 slides · Jan 10, 2011
 Non-Deal Roadshow (July 2010)33 slides · Jul 12, 2010
 Wells Fargo Securities 2010 Healthcare Conference25 slides · Jun 24, 2010