William Lyon Homes — Q4 2012 Earnings Presentation
11 slides from William Lyon Homes's earnings presentation, Mar 18, 2013
Slide 1: Q4 and Year-End Earnings Call
Q4 and Year-End Earnings Call March 14, 2013, 11:00am PST Exhibit 99.1

Slide 2: Disclosure Statement
Disclosure Statement Certain statements contained in this release that are not historical information contain forward looking statements. The forward-looking statements involve risks and uncertainties and actual results may differ materially from those projected or implied. Further, certain forward-
Slide 3: Key Highlights
1 3 2 4 Key Highlights The Company issued Common and Convertible Preferred Stock for $30 million in cash. Immediately began to operate as the Colorado division of the Company with operations in Denver and Fort Collins metropolitan areas. 9 closings, 13 orders, since acquisition on December 7 , 2012,
Slide 4: Q4 and YTD Operational Results
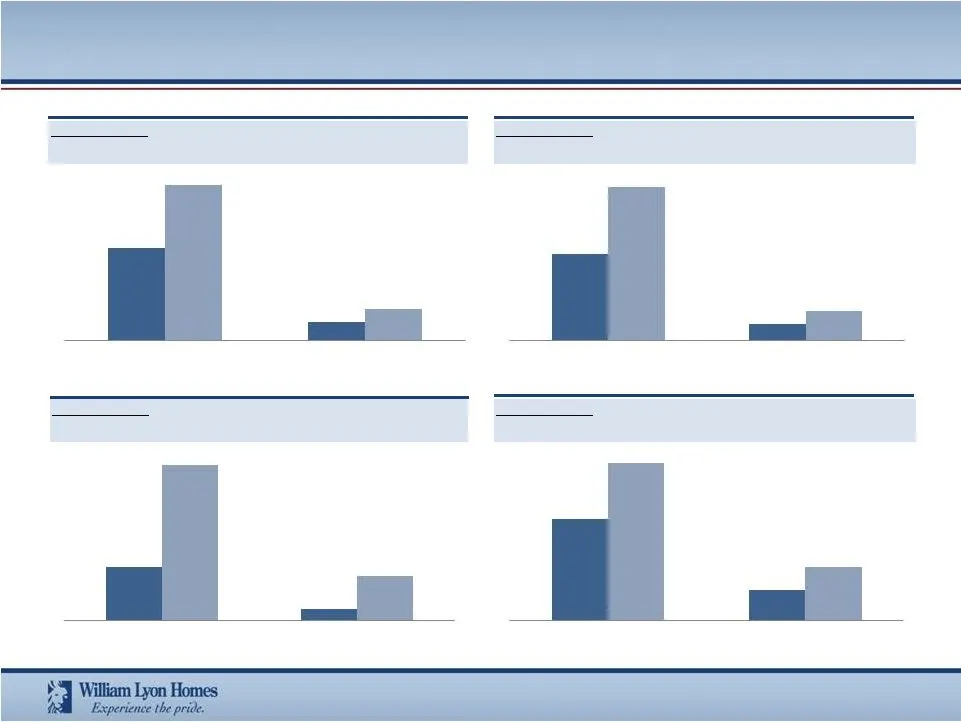
Q4 and YTD Operational Results % y-o-y change: +69% +76% % y-o-y change: +78% +85% % y-o-y change: +192% +294% % y-o-y change: +55% +76% Net New Home Orders (Units) Net Orders per Average Sales Location (Units) Backlog Homes Delivered (Units) 1,131 FY Q4 35.2 6.5 62.8 12.1 FY Q4 FY Q4 $29.3 $115.5 Y
Slide 5: Lot Count
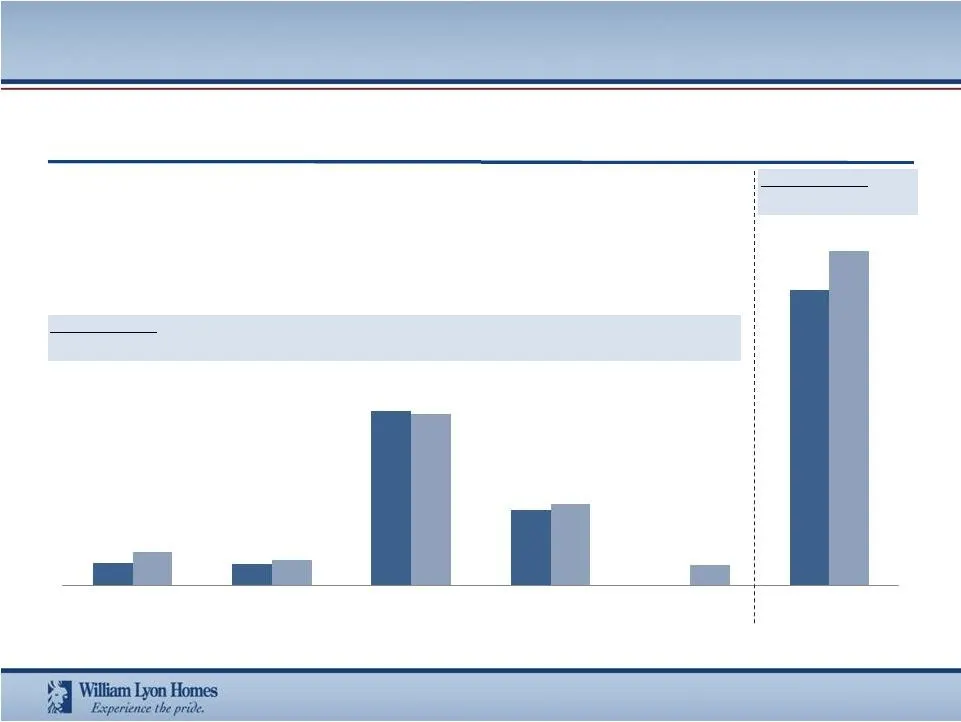
Lot Count Lots Owned and Controlled by Region (Units) % y-o-y change: +13% % y-o-y change: +46% +22% (2%) +8% 6,194 2,676 - 10,464 1,210 6,082 2,884 11,842 SoCal NoCal Arizona Nevada Colorado TOTAL
Slide 6: Q4 and YTD Financial Results
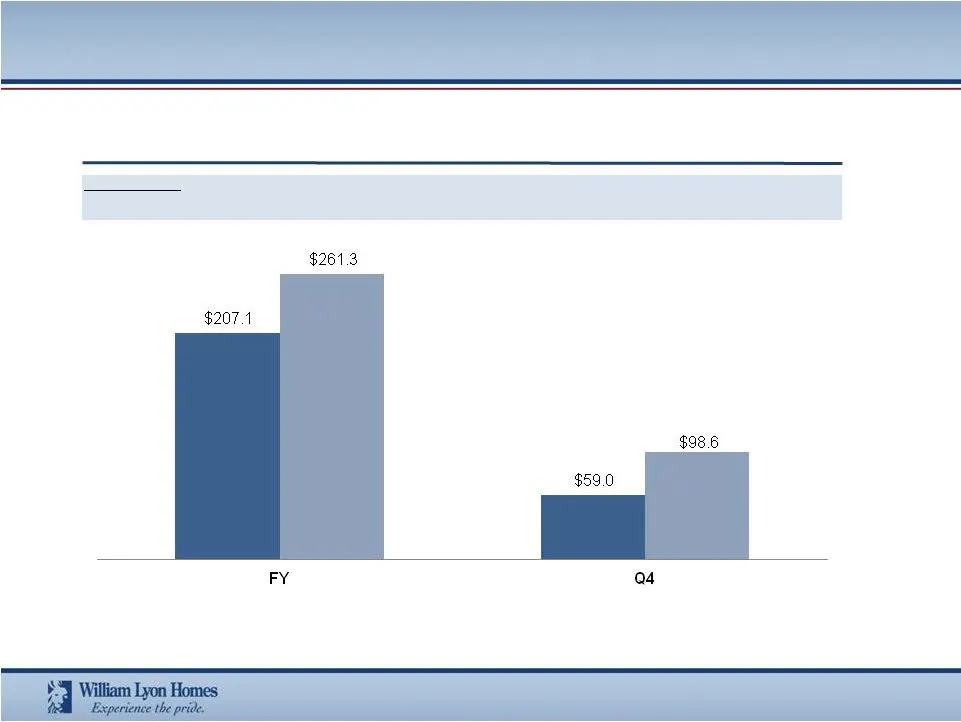
Q4 and YTD Financial Results Home Sales Revenue ($ Millions) % y-o-y change: +26% +67%
Slide 7: Average Sales Price
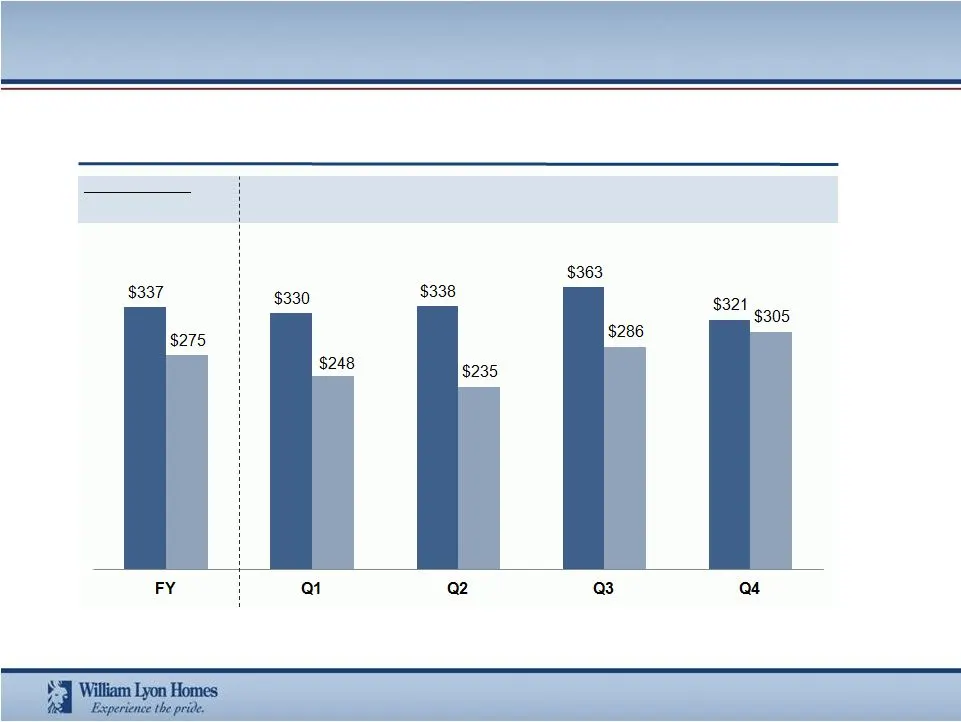
Average Sales Price Average Sales Price of Homes Delivered ($ Thousands) % y-o-y change: (18%) (25%) (31%) (21%) (5%)
Slide 8: Margins
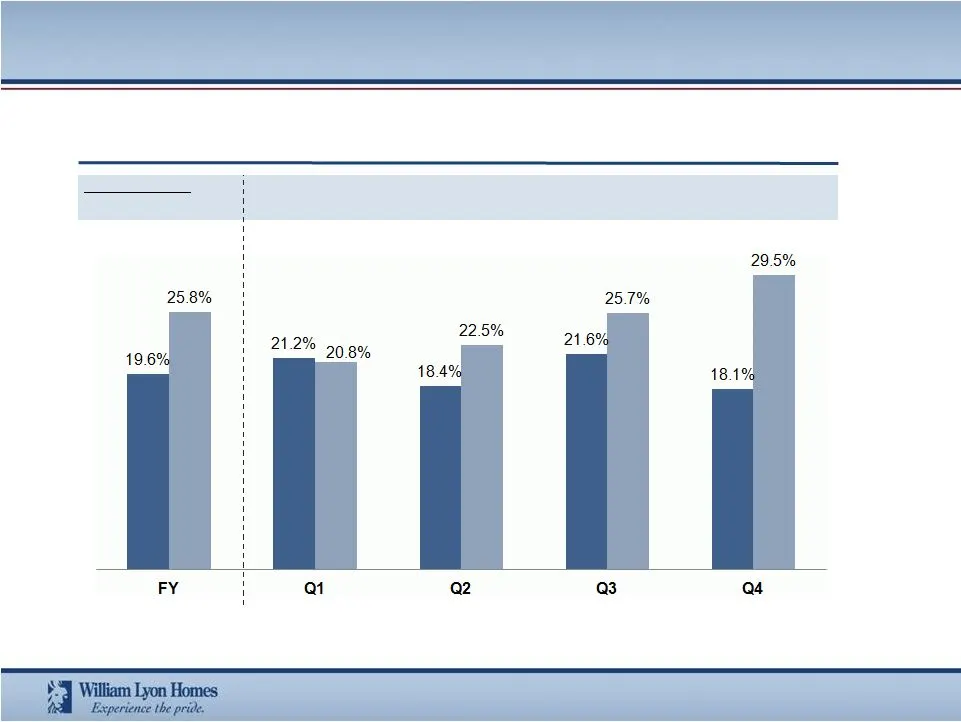
Margins Adjusted Homebuilding Gross Margin % y-o-y change: +620bps (40bps) +410bps +410bps +1,140bps
Slide 9: Selected Financial Data
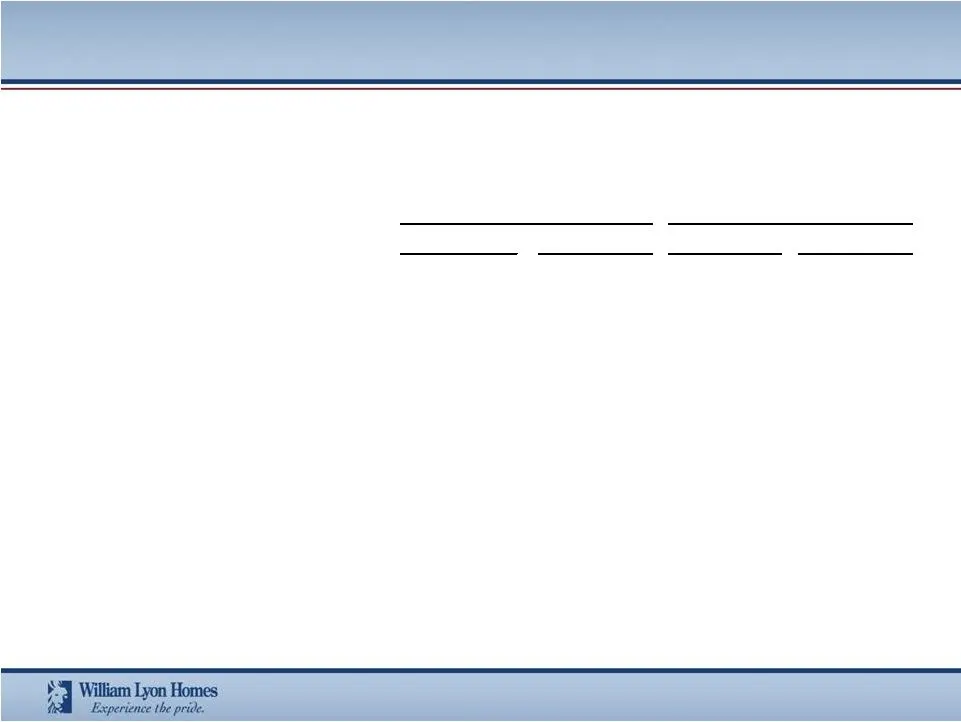
Selected Financial Data (1) SG&A excludes intangibles amortization and stock-based compensation expense. Selected Financial Data ($ Thousands) SG&A Expense (1) 13,564 $ 9,289 $ 41,570 $ 39,259 $ SG&A as a % of Homebuilding Revenue 13.8% 15.7% 15.9% 19.0% Interest Expense, net 1,800 $ 6,548 $ 11,634
Slide 10: Adjusted EBITDA
Adjusted EBITDA Net (loss) income attributable to William Lyon Homes (1,248) $ (131,300) $ 219,524 $ (193,330) $ Benefit from income taxes - - - Interest expense Interest incurred 8,192 15,701 37,672 61,464 Interest capitalized (6,391) (9,153) (26,037) (36,935) Amortization of capitalized interest i

Slide 11: 2012 Q4 and Year-End Earnings Call
2012 Q4 and Year-End Earnings Call March 14, 2013, 11:00am PST
Source: SEC EDGAR · 8-K filed Mar 18, 2013
More decks from William Lyon Homes
 Merger or Acquisition (November 2019)18 slides · Nov 6, 2019
 Q2 2019 Earnings Presentation15 slides · Aug 1, 2019
 Q1 2019 Earnings Presentation14 slides · May 2, 2019
 Q4 2018 Earnings Presentation18 slides · Feb 14, 2019
 Q3 2018 Earnings Presentation17 slides · Oct 30, 2018
 2018 Zelman Housing Summit31 slides · Sep 27, 2018