Western Sierra Bancorp — Sandler O'Neill 2005 West Coast Financial Services Conference
33 slides from Western Sierra Bancorp's conference presentation, Mar 10, 2005
Slide 1: Western Sierra Bancorp
Western Sierra Bancorp Sandler O’Neill 2005 West Coast Financial Services Conference March 9-11, 2005 Gary D. Gall President / CEO Phone (530) 677-5694 Email: [email protected]
Slide 2: Safe Harbor
SAFE HARBOR This presentation contains forward-looking statements within the meaning of the Private Securities Litigation Reform Act of 1995 regarding the future results and performance of WSBA. These forward-looking statements involve risks and uncertainties and actual results could differ material
Slide 3: Western Sierra Bancorp
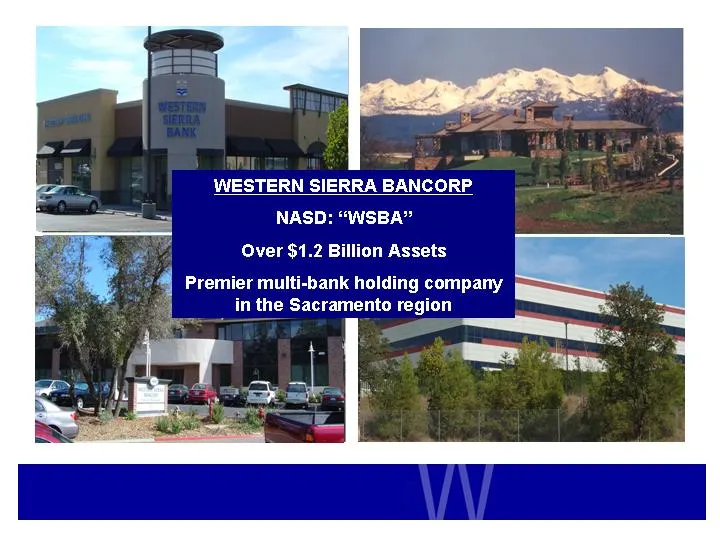
WESTERN SIERRA BANCORP NASD: “WSBA” Over $1.2 Billion Assets r multi-bank holding company in the Sacramento region
Slide 4: Western Sierra Bancorp subsidiary banks
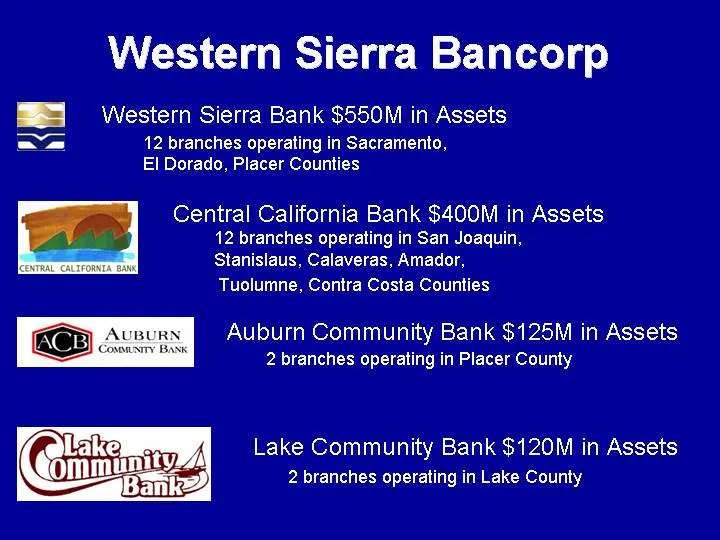
Western Sierra Bancorp HCC Western Sierra Bank $550M in Assets aa 12 branches operating in Sacramento, El Dorado, Placer Counties Central California Bank $400M in Assets ag 12 branches operating in San Joaquin, Stanislaus, Calaveras, Amador, Tuolumne, Contra Costa Counties Auburn Community Bank $125
Slide 5: Our Formula For Success
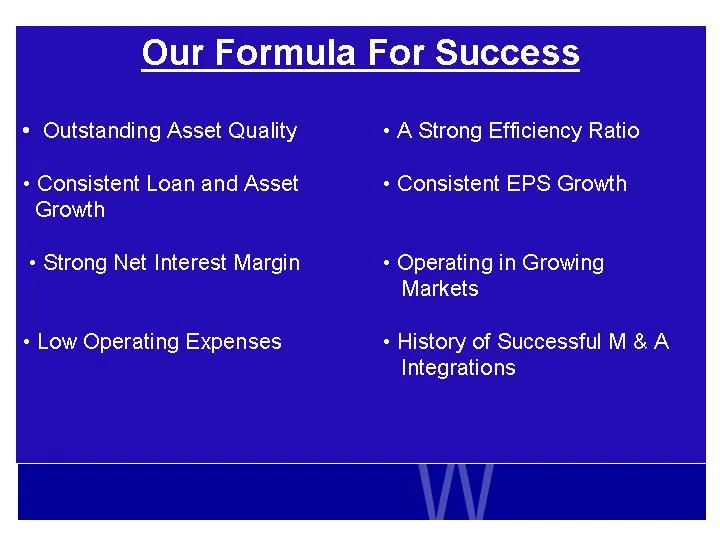
Our Formula For Success * Outstanding Asset Quality + A Strong Efficiency Ratio + Consistent Loan and Asset + Consistent EPS Growth Growth + Strong Net Interest Margin + Operating in Growing Markets + Low Operating Expenses + History of Successful M&A Integrations
Slide 6: Branch locations map
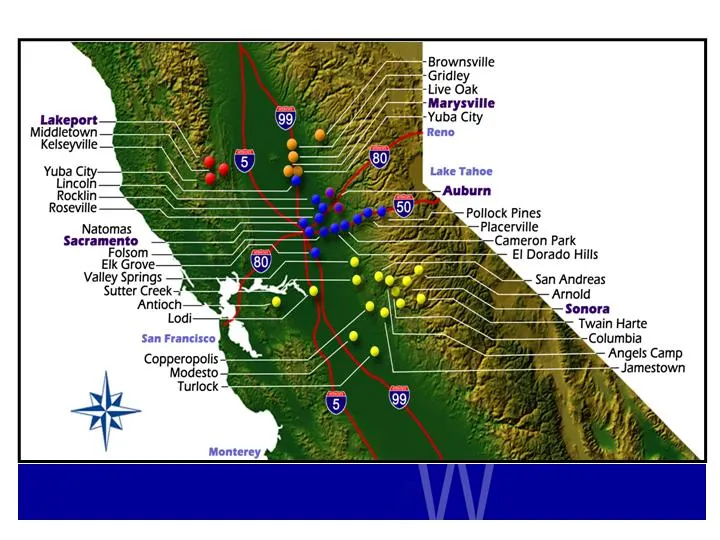
Lakeport Middletown —| Roseville Natomas Sacramento valley Springs —X Sutter Creek-/ Twain Harte Columbia
Slide 7: The Market Opportunity
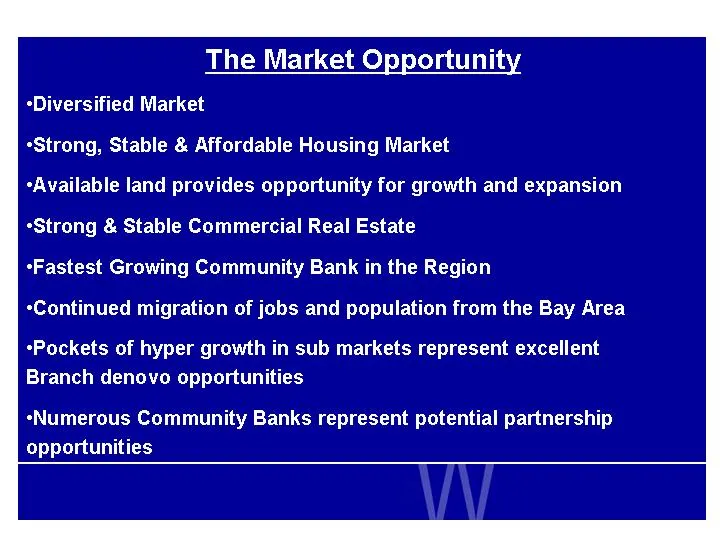
The Market Opportunity ‘Diversified Market *Strong, Stable & Affordable Housing Market ‘Available land provides opportunity for growth and expansion *Strong & Stable Commercial Real Estate ‘Fastest Growing Community Bank in the Region «Continued migration of jobs and population from the Bay Area «Po
Slide 8: Sacramento Regional Economy
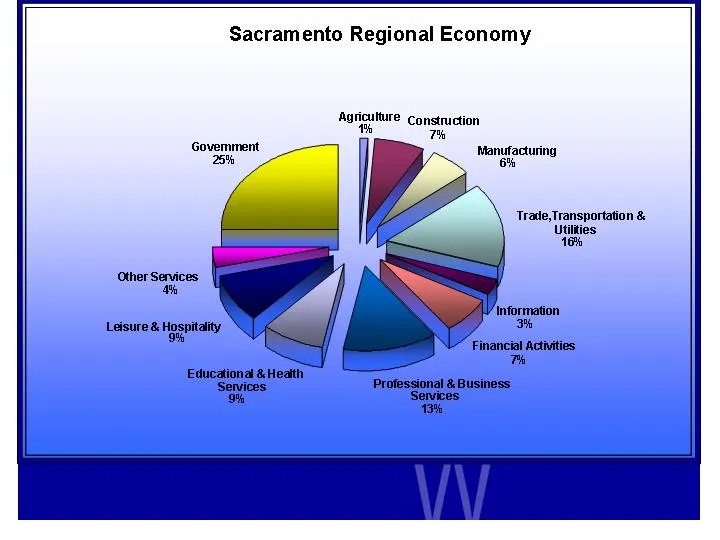
Sacramento Regional Economy Agricuture Construction a 7 Govemment seu Manufacturing Trade,Transportation & Utilities 16% Other Services cs oan Vintormasion Leisure & Hospit tospitalty
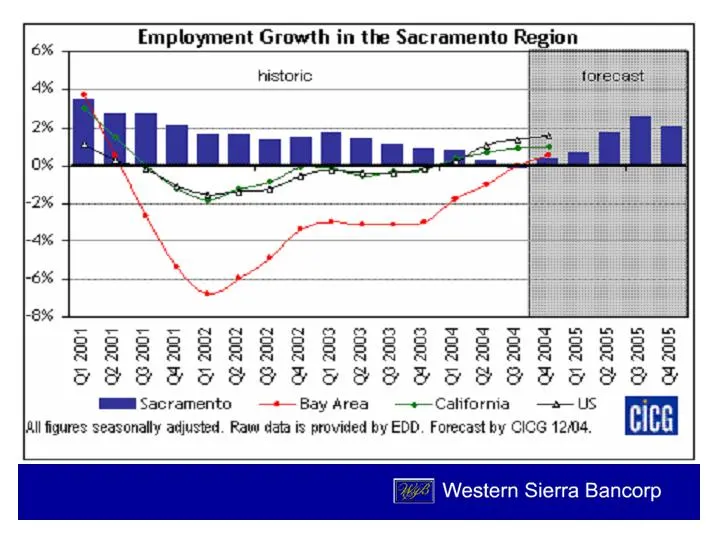
Slide 9: Employment Growth in the Sacramento Region
Employment Growth in the Sacramento Region historic forecast SSS SHAH BeBe eT TTITSE wee SBSEBBBSS8R8S88888 88838888 SB888S8S8S88 8888888888 SB RRRRRRRARRRRRRRARRRRRA SSS Gereeeregergas Mmm Sacramento —+—Bay Area —+—California —a—US eice jAll figures seasonally adjusted. Raw data is provided by EDD.
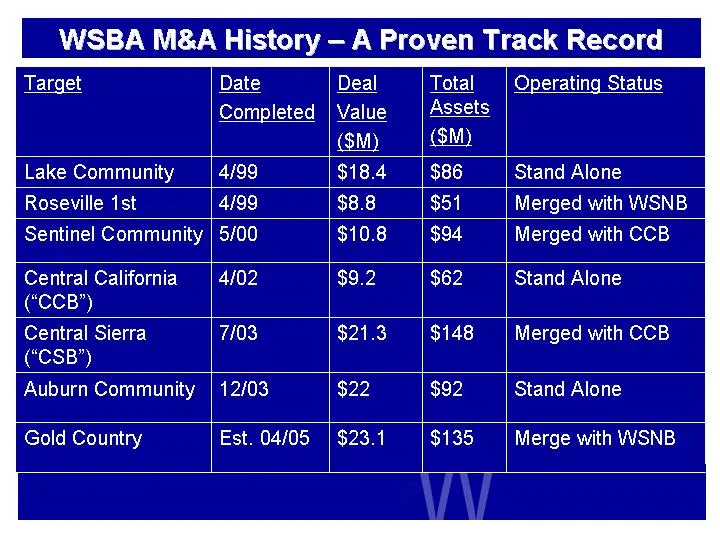
Slide 10: WSBA M&A History – A Proven Track Record
WSBA M&A ory — A Proven Track Record Target Date Operating Status Completed Lake Community 4/99 Stand Alone Roseville 1st 4/99 Merged with WSNB Sentinel Community | 5/00 Merged with CCB Central California 4102 Stand Alone (‘CCB’) Central Sierra 7103 Merged with CCB (‘CSB’) Auburn Community | 12/03 S
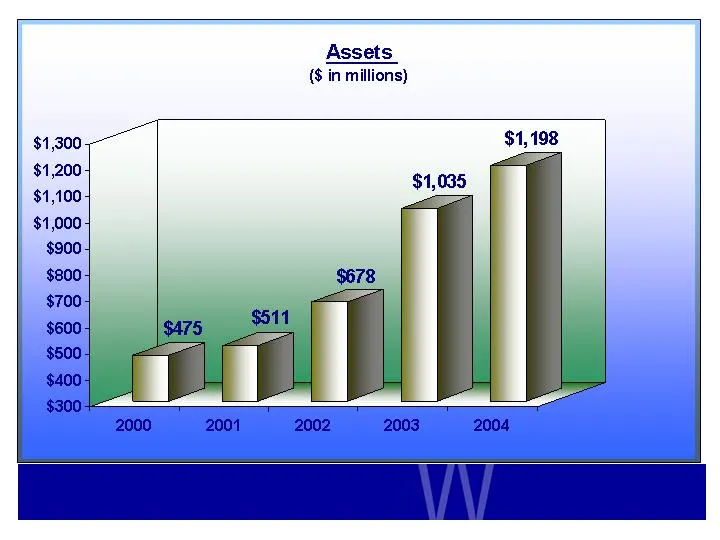
Slide 11: Assets
Assets ($ in millions) $1,085 2000 2001 2002 2003 2004
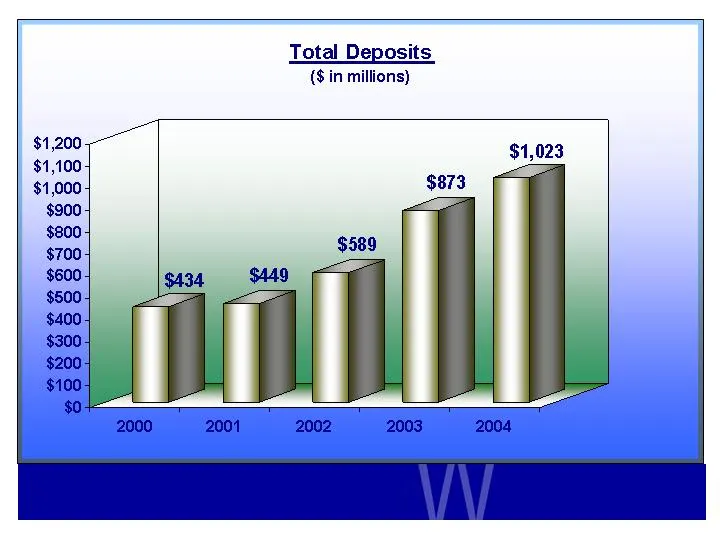
Slide 12: Total Deposits
Total Deposits ($ in millions) 2000 2001 2002 2003 2004
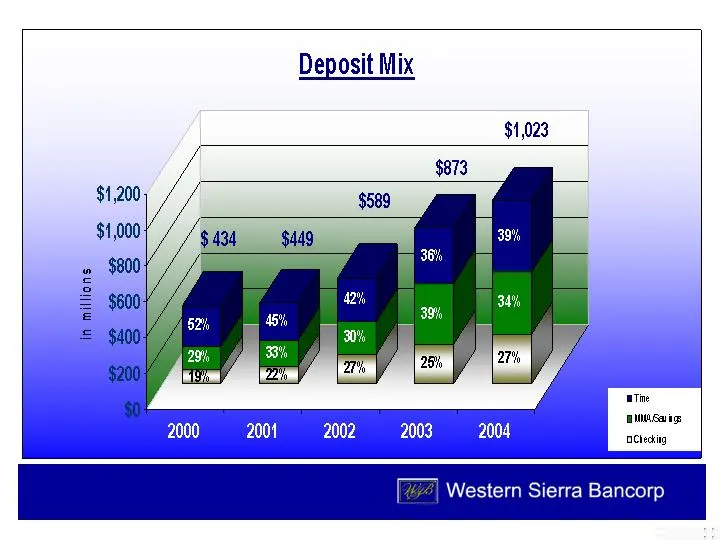
Slide 13: Deposit Mix
in millions Deposit Mix Tne mine saigs aCleckig jerra Bans
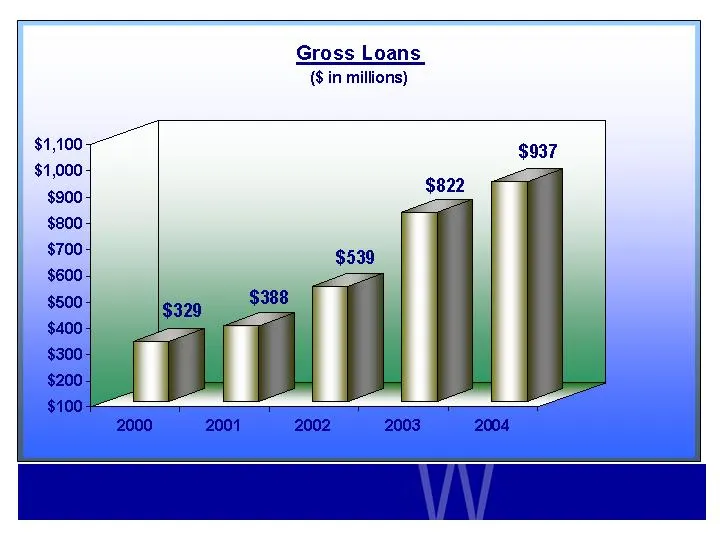
Slide 14: Gross Loans
Gross Loans (Sin millions) $822 ate 2000 2001 2002 2003 2004
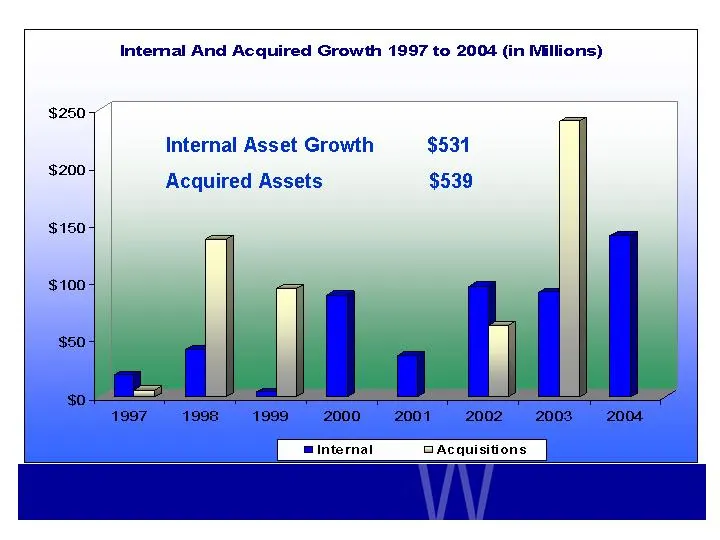
Slide 15: Internal And Acquired Growth 1997 to 2004
Intemal And Acquired Growth 1997 to 2004 (in Millions) Internal Asset Growth $531 Acquired Assets $539
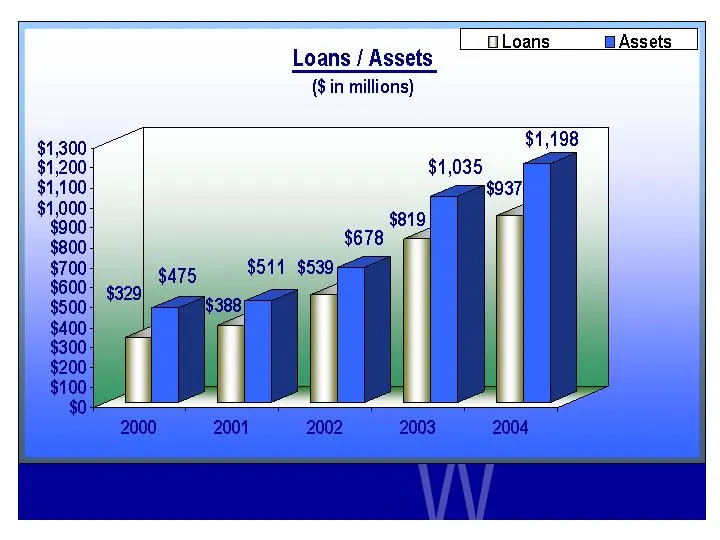
Slide 16: Loans / Assets
Loans / Assets (Sin millions) DLoans HAssets 2000 2001 2002 2003 2004
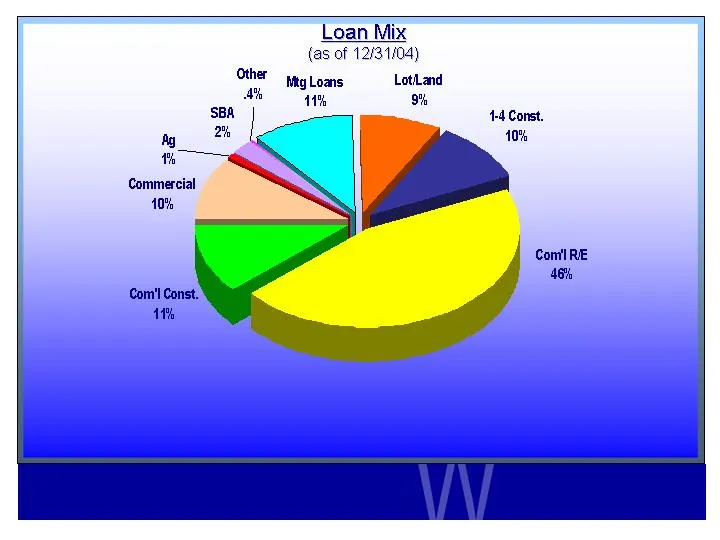
Slide 17: Loan Mix
Loan Mix {as of 12/31/04) Other Nag Loans LotiLand Ae ite 9% th Commercial 10% Com! RE 46% Com'l Const. 1%
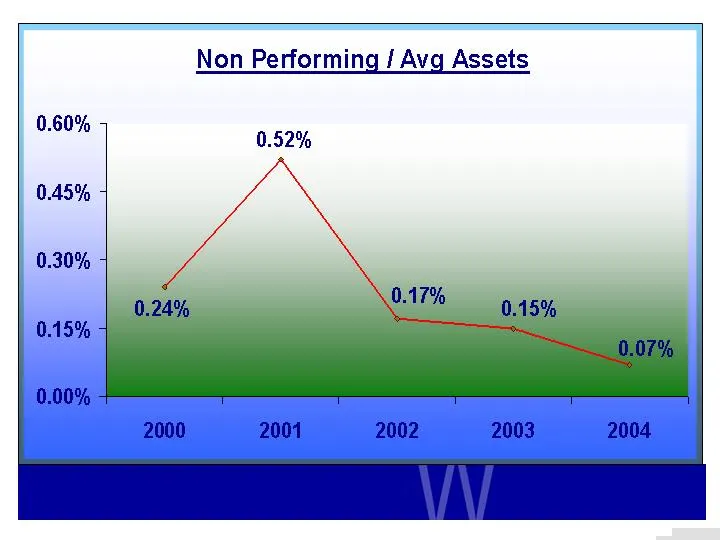
Slide 18: Non Performing / Avg Assets
Non Performing / Avg Assets 0.609 % 0.52% 0.45% 2000 2001 2002 2003 2004
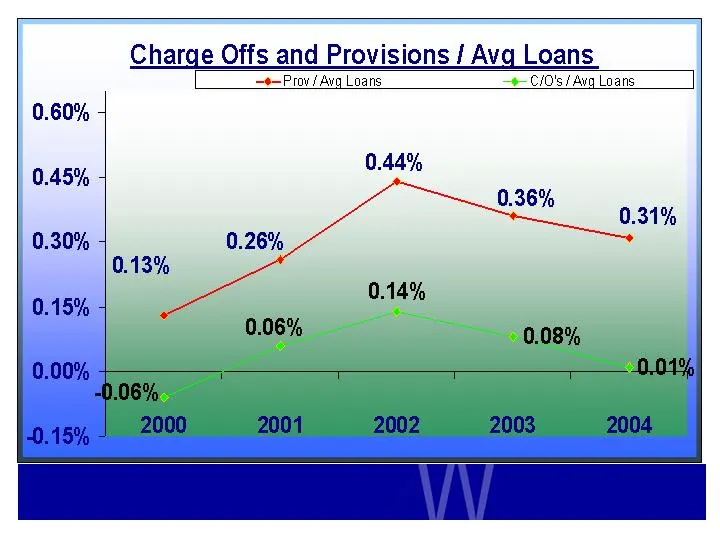
Slide 19: Charge Offs and Provisions / Avg Loans
e Offs and Provisions / Avg Loans —e—Prov / Avg Loans C/O's f Avg Loans 0.44%
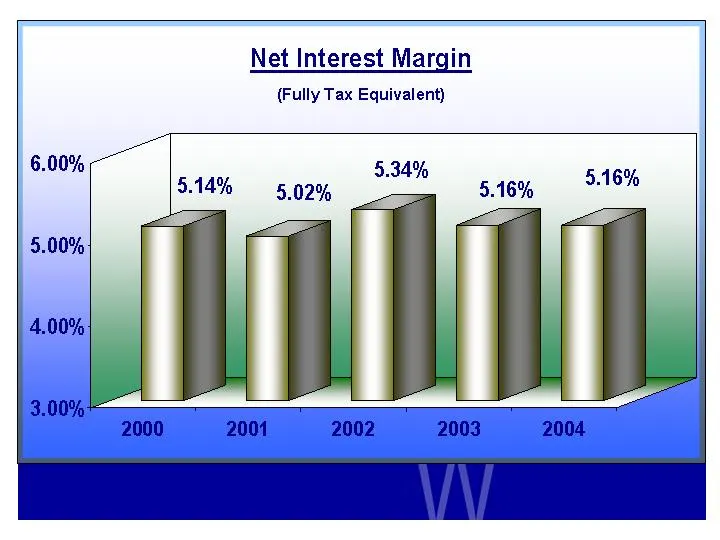
Slide 20: Net Interest Margin
Net Interest Margin (Fully Tax Equivalent) 5.34% 5.14% 5.02% 2000 2001 2002 2003 2004
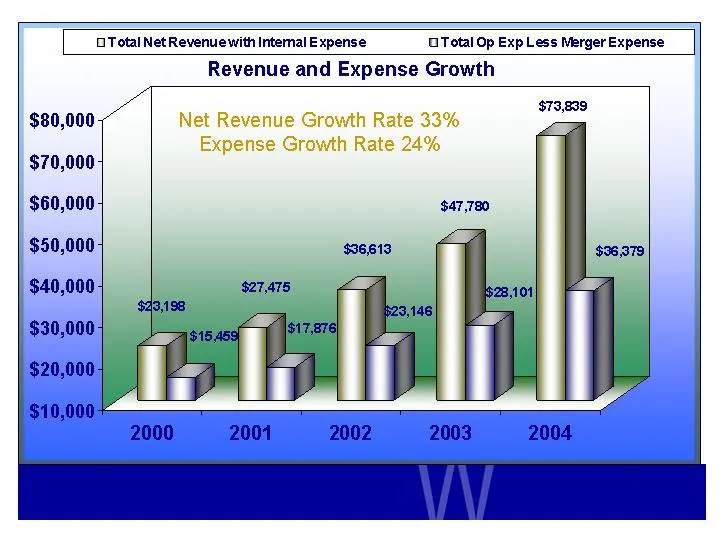
Slide 21: Revenue and Expense Growth
UTotal Net Revenuewith Intermal Expense Total Op Exp Less Merger Expense $80,000 $70,000 $60,000 $50,000 $40,000 Revenue and Expense Growth
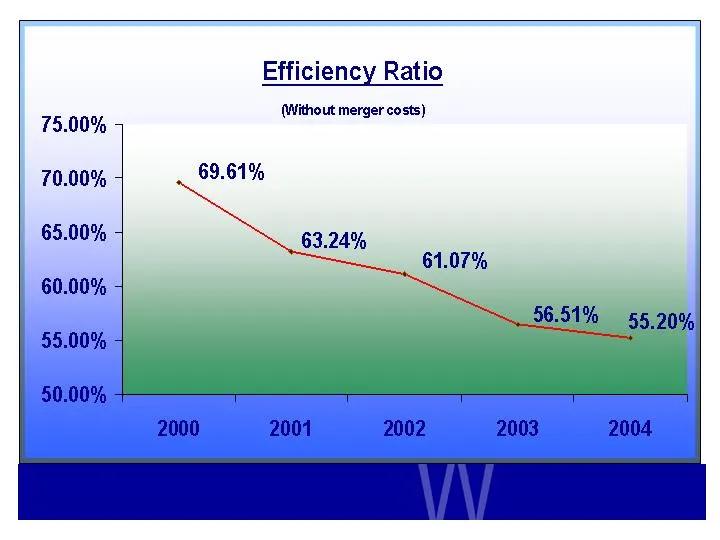
Slide 22: Efficiency Ratio
Efficiency Ratio (Without merger costs) 75.00% 70.00% 69.61% 65.00%, 63.24% 60.00% 56.51% 55.20%
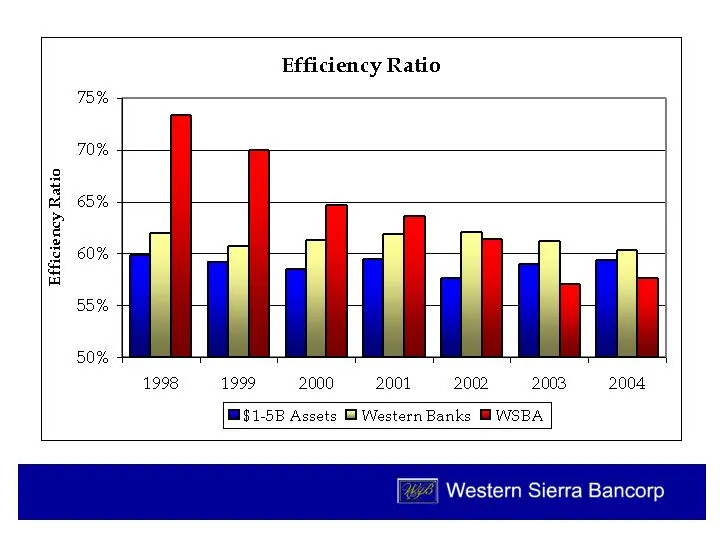
Slide 23: Efficiency Ratio vs. peers
Efficiency Ratio 75% 70% = 65% > 5 3 60% a 55% 50% 1998 1999 2000 2001 2002 2003 2004 S158 Assets Western Banks MWSBA Western Sierra Bancorp
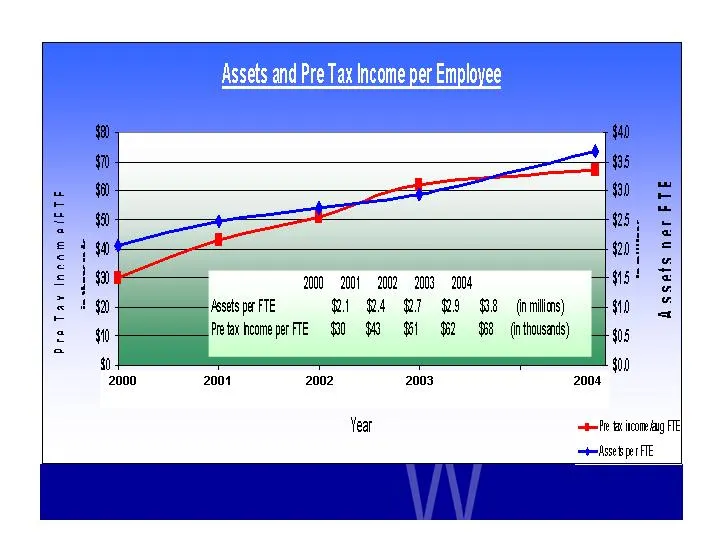
Slide 24: Income per Employee
ome per Emplovee ~ pal $35 3 5, i 2000 200 oman 5! Assets per FTE Qt G4 27 29 G8 (nmilins) 40 Pretax heome perFTE $30. SG GHZ $58 nthousnds) 05 0 Dra Tay Innam ei TE Assets ner FTE 2004 Year =e Fe ta ico ag FTE east er FTE
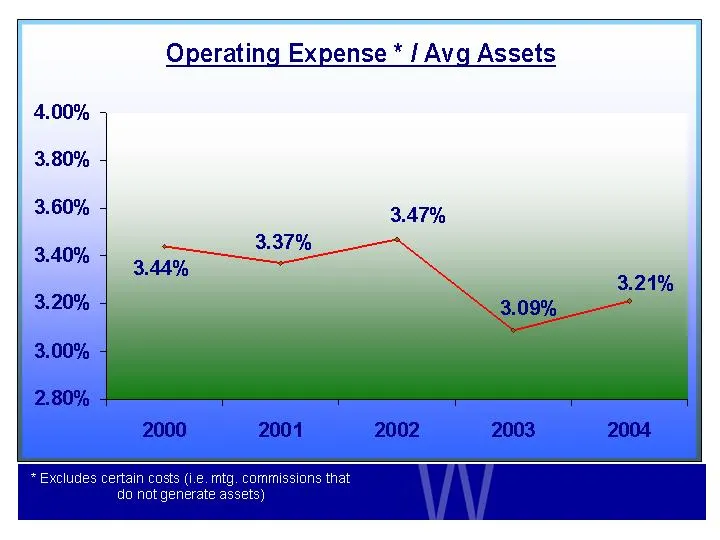
Slide 25: Operating Expense / Avg Assets
Operating Expense * / Avg Assets 4.00% 3.80% 3.60% 3.40% 3.20% 3.00% 2.80% 2000 2001 2002 2003 2004
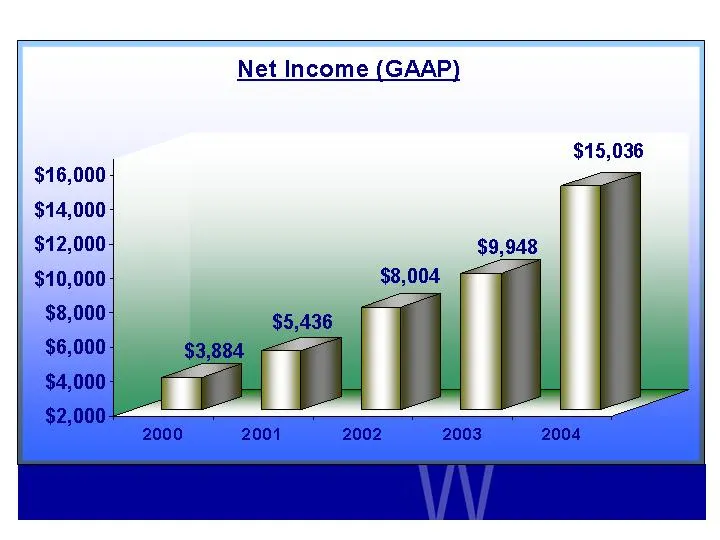
Slide 26: Net Income (GAAP)
Net Income (GAAP) $15,036 $16,000 $14,000 $12,000 $10,000 $8,000
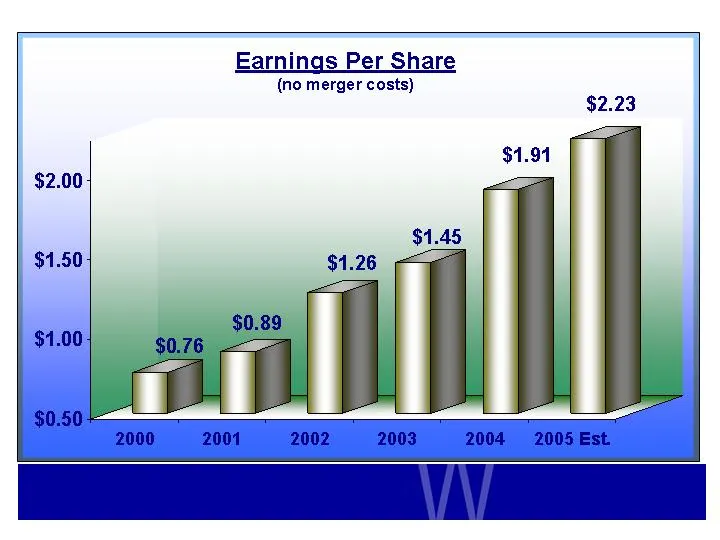
Slide 27: Earnings Per Share
Earnings Per Share (no merger costs)
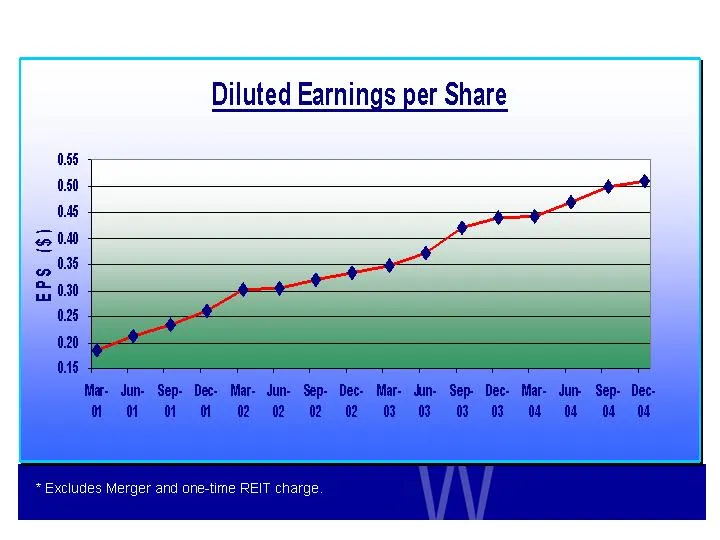
Slide 28: Diluted Earnings per Share
055 050 6 Pay) on 038 5 030 0.5 0.20 045 Diluted Earnings per Share Ma- Jun- Sep- Det Mar- Jun- Sep- Dec- Mar- dun- Sep» Dec- Mar- Jun Sep- Dec- M1 O O M 02 0 02 0 0 0 03 03 04 Of 04 04
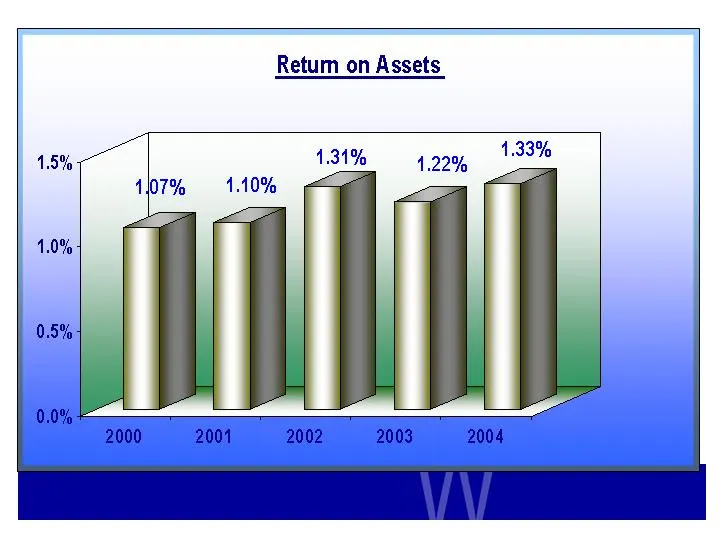
Slide 29: Return on Assets
Retum on Assets 2000 2001 2002 2003 2004
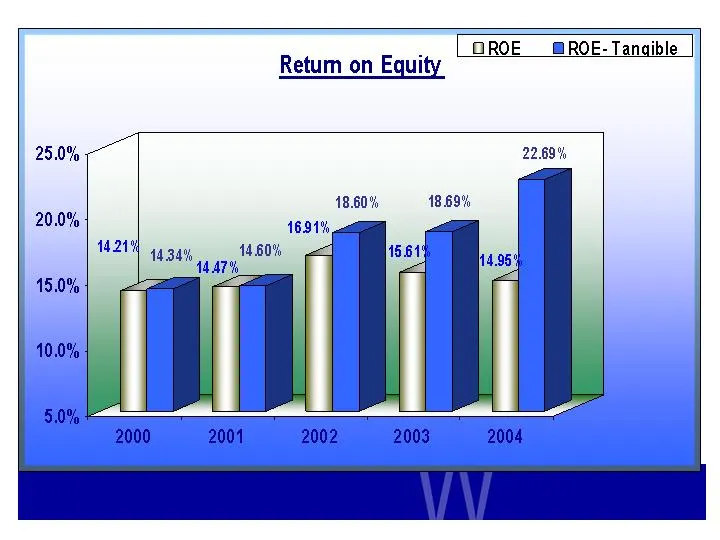
Slide 30: Return on Equity
GROE _@ROE- Tangible Retum on Equity 22.69% 18.60% 18.89% 16.31% 4434 14.80% —_ 4 A7% 2000 2001 2002 2003 2004
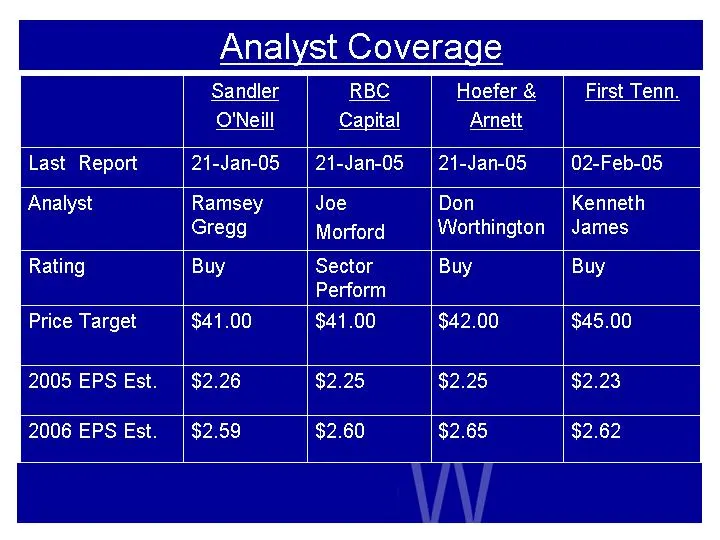
Slide 31: Analyst Coverage
Analyst Coverage RBC Hoefer & First Tenn. Capital Arnett Last Report 21-Jan-05 21-Jan-05 02-Feb-05 Analyst Joe Morford Don Worthington Kenneth James Rating Sector Perform Buy Buy Price Target $41.00 2005 EPS Est. $2.25 2006 EPS Est. $2.60
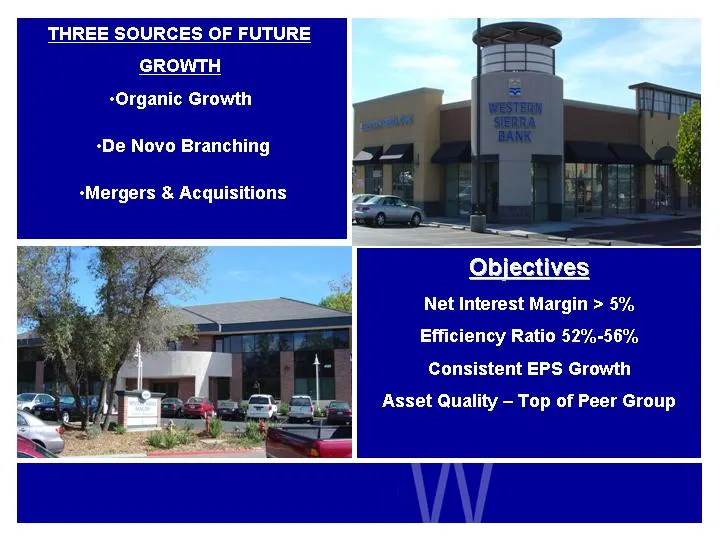
Slide 32: Three Sources of Future Growth
THREE SOURCES OF FUTURE GROWTH “Organic Growth -De Novo Branching -Mergers & Acquisitions Objectives Net Interest Margin > 5% Efficiency Ratio 52%-56% Consistent EPS Growth Asset Quality — Top of Peer Group
Slide 33: Searchable text section of graphics
Searchable text section of graphics shown above [ LOG O] Western Sierra Bancorp Sandler O’Neill 2005 West Coast Financial Services Conference March 9-11, 2005 Gary D. Gall President / CEO Phone (530) 677-5694 Email: [email protected] SAF E HARBOR This presentation contains forward-looking statements wi
Source: SEC EDGAR · 8-K filed Mar 10, 2005
More decks from Western Sierra Bancorp
 Keefe, Bruyette & Woods Community Bank Conference 200534 slides · Jul 26, 2005
 Merger or Acquisition (November 2004)10 slides · Nov 22, 2004
 Sandler O'Neill 2004 Financial Services Conference11 slides · Nov 10, 2004
 Investor Presentation (September 2004)34 slides · Sep 28, 2004
 Investor Presentation (May 2004)24 slides · May 5, 2004
 Investor Presentation (March 2004)7 slides · Mar 10, 2004