Arlington Asset Investment Corp
Arlington Asset Investment — Investor Presentation (March 2011)
14 slides from Arlington Asset Investment's investor presentation, Mar 16, 2011

Slide 1: Investor Presentation
ARLINGTON Investor Presentation ARLINGTON
Slide 2: Information Related to Forward-Looking Statements
Information Related to Forward-Looking Statements This presentation contains “forward-looking statements” within the meaning of the Private Securities Litigation Reform Act of 1995. These include statements regarding future results or expectations. Forward-looking statements can be identified by for
Slide 3: Arlington Asset Overview - Attractive Dividends Plus Growth
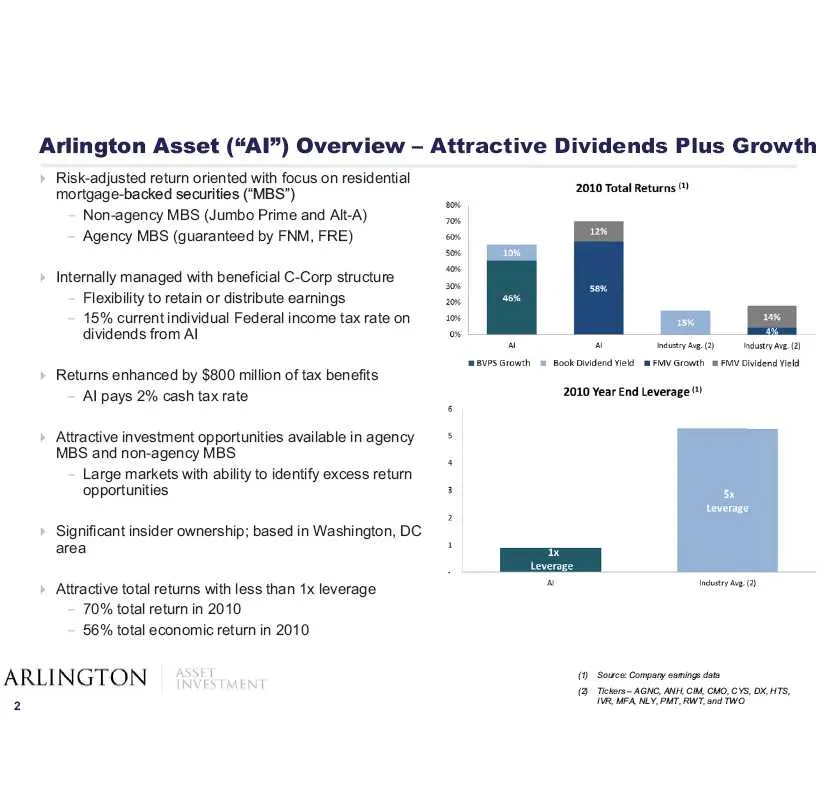
Arlington Asset (“Al”) Overview - Attractive Dividends Plus Growth Risk-adjusted return oriented with focus on residential ’ ‘i mortgage-backed securities ("MBS") 2010 Total Returns Non-agency MBS (Jumbo Prime and Alt-A) Agency MBS (guaranteed by FNM, FRE) sey seg) laduy Ae (2) ‘mEVPSGrowh = BockDWi
Slide 4: Compelling Investment Opportunity
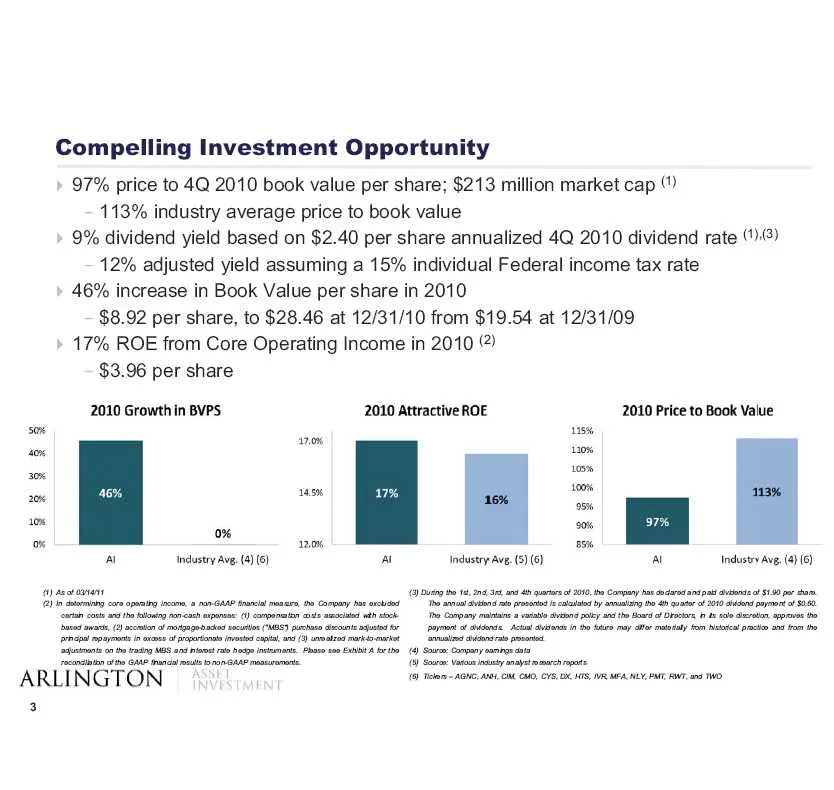
Compelling Investment Opportunity 97% price to 4Q 2010 book value per share; $213 million market cap 113% industry average price to book value 9% dividend yield based on $2.40 per share annualized 4Q 2010 dividend rate ().8) 12% adjusted yield assuming a 15% individual Federal income tax rate 46% in
Slide 5: Key Quarterly Investment Data
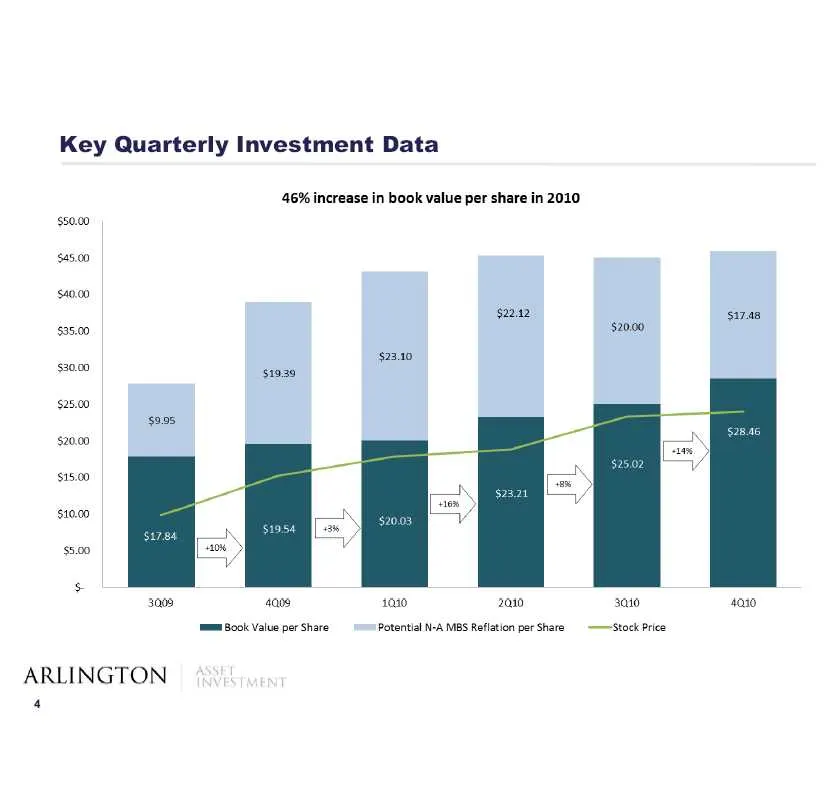
Key Quarterly Investment Data $50.00 $45.00 $905 3008 ARLINGTON 4 46% increase in book value per share in 2010 922.82 suas $2000 2310 4a08 1010 2010 300 4010 ‘mm Book Value per Share Potential NA MBS Reflation per Share —~Stock Price
Slide 6: MBS Portfolio Provides Attractive Risk-Adjusted Returns and Growth
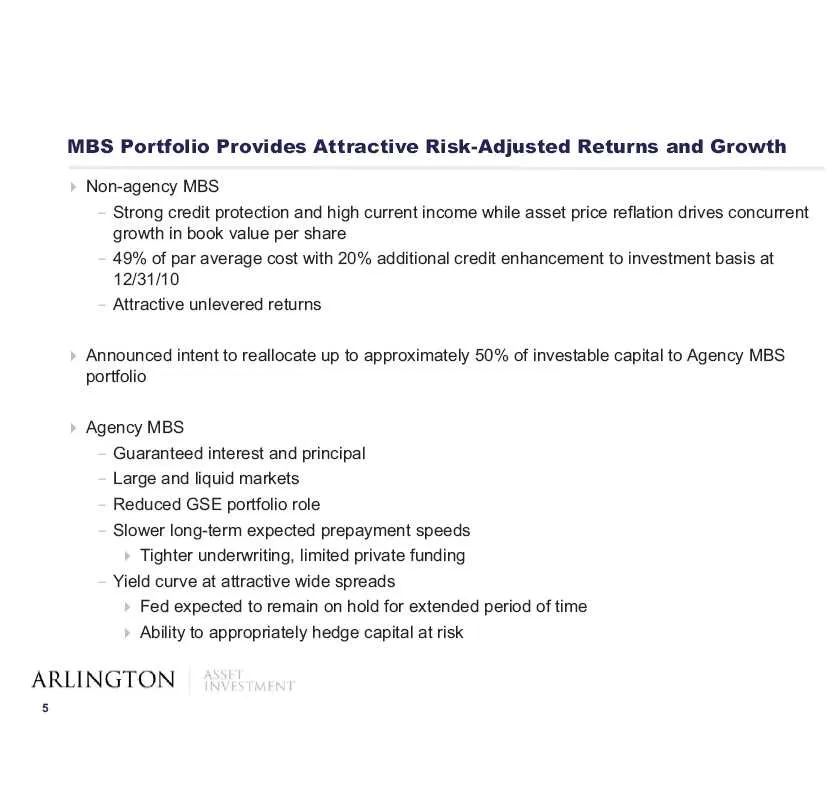
MBS Portfolio Provides Attractive Risk-Adjusted Returns and Growth Non-agency MBS Strong credit protection and high current income while asset price reflation drives concurrent growth in book value per share 49% of par average cost with 20% additional credit enhancement to investment basis at 12/34/
Slide 7: Housing Market - Key Historical Trends
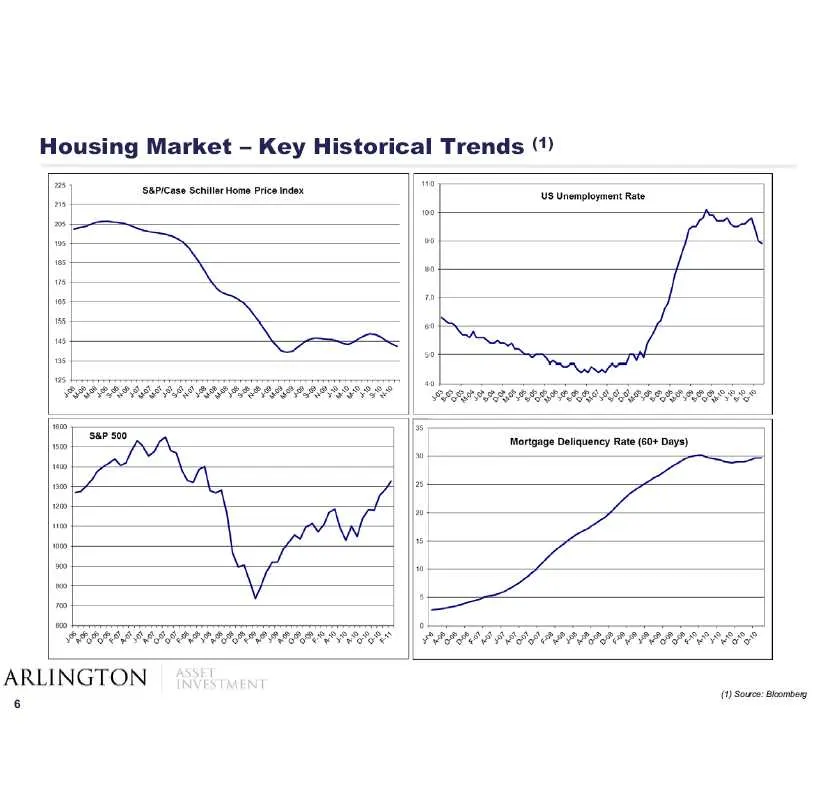
Housing Market - Key Historical Trends () 2 S8PICase Schiller Home Price index ‘te ‘Us Unemployment Rte _—— * roan PPR RES “PRP I EDIT IRR IRE IEE P IERIE IRIE all ae * ‘Morgoge Deiquency Rate (60+ Dey) : ak : = Az A bs Wa if 7 he V "PPP P OP RAD OP PPD RAPP ID POOROGDS || PAP RAA PDA PP APDIP PAPI
Slide 8: Non-Agency MBS Portfolio - Key Characteristics
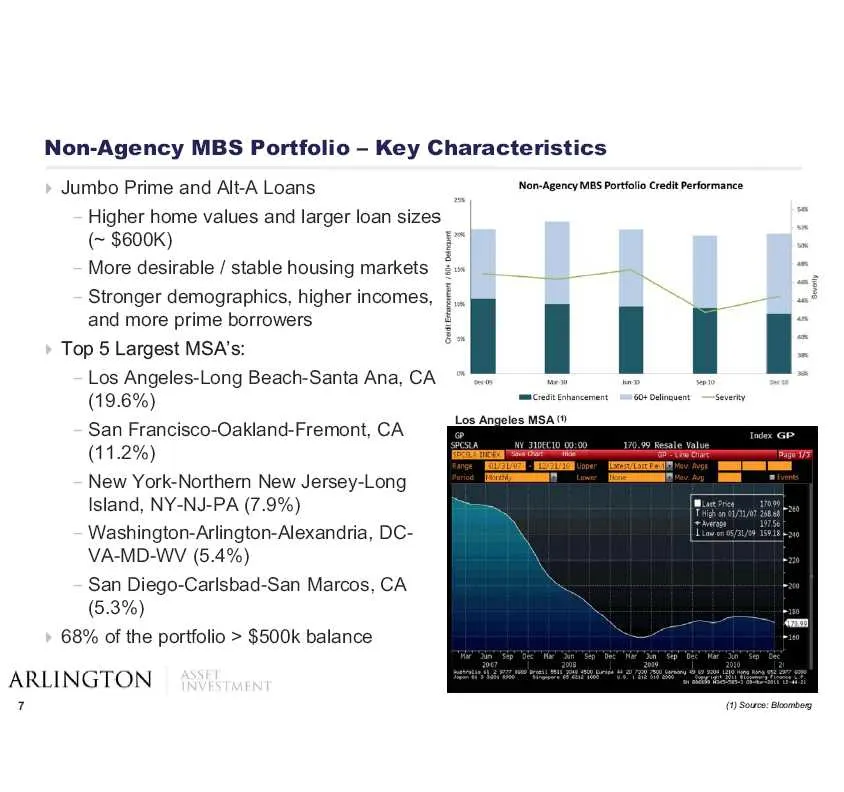
Non-Agency MBS Portfolio - Key Characteristics Jumbo Prime and Alt-A Loans ' Non-Agency MBS Portfolio Credit Performance Higher home values and larger loan sizes (~ $600k) i= More desirable / stable housing markets Stronger demographics, higher incomes, and more prime borrowers —_ « Top 5 Largest MS
Slide 9: Non-Agency MBS Portfolio Breakout
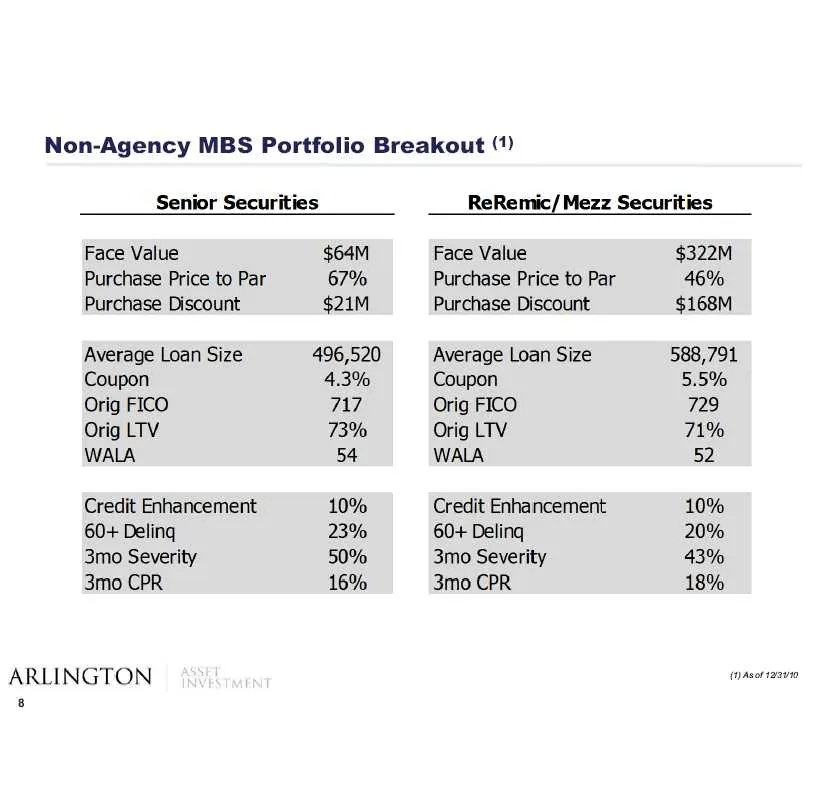
Non-Agency MBS Portfolio Breakout (1) Senior Securities ReRemic/Mezz Securities Face Value $64M Face Value $322M Purchase Price to Par 67% Purchase Price to Par 46% Purchase Discount $21M Purchase Discount $168M Average Loan Size 496,520 Average Loan Size 588,791 Coupon 4.3% Coupon 5.5% Orig FICO 71
Slide 10: Non-Agency MBS - Downside Protection, Upside Potential
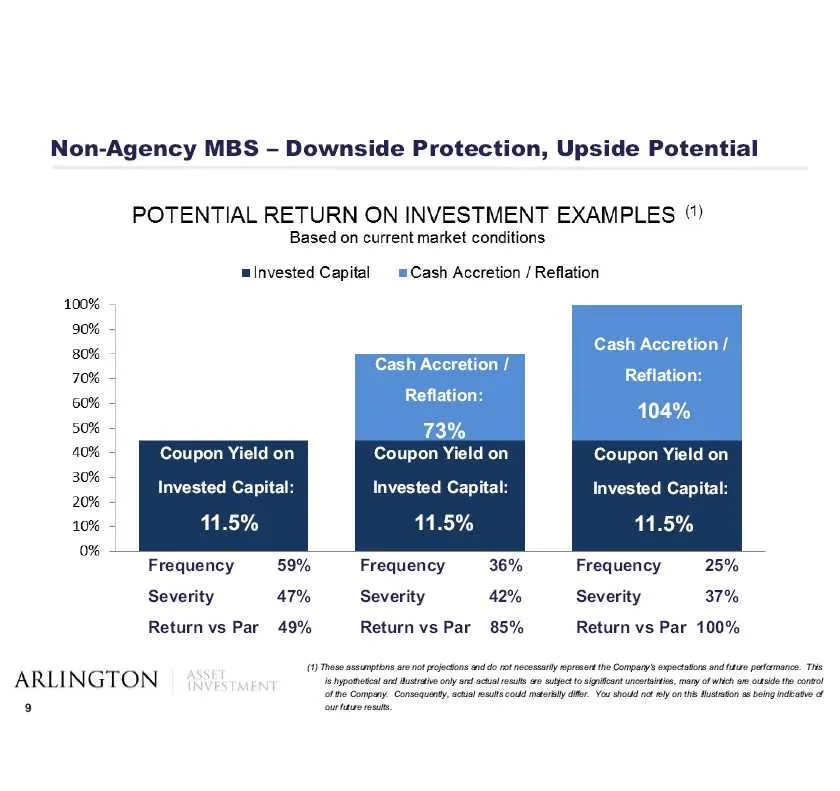
Non-Agency MBS - Downside Protection, Upside Potential POTENTIAL RETURN ON INVESTMENT EXAMPLES “) Based on current market conditions ulnvested Capital =Cash Accretion / Reflation 100% 90% 80% Cash Accretion / ae Cash Accretion / Reflation: Reflation: 50% 104% 50% 73% 40% Coupon Yield on Coupon Yield
Slide 11: Historical Agency MBS Spreads
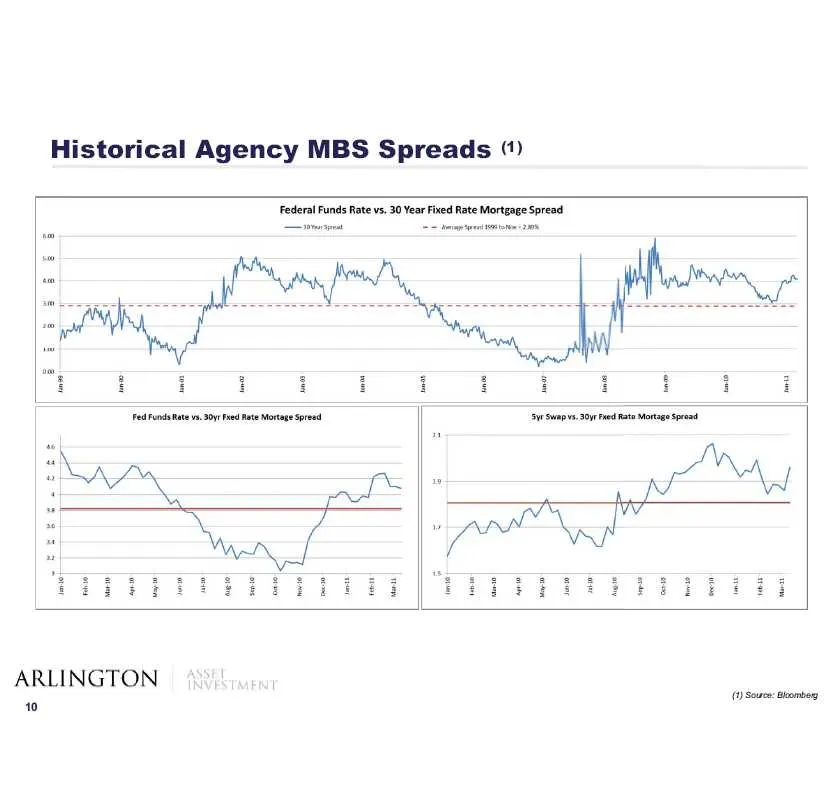
Historical Agency MBS Spreads “) Federal Funds Rate vs. 30 Year Fixed Rate Mortgage Spread A Fy ; a i a z A ; 2 Fi i i i i i i i i i i i i i Fed nds 39 Pod Rte Mota Sd sy Swap 30 Fe ate Morgen ARLINGTON FSTMENT 10 (2) Source: tombany
Slide 12: Attractive Potential Returns
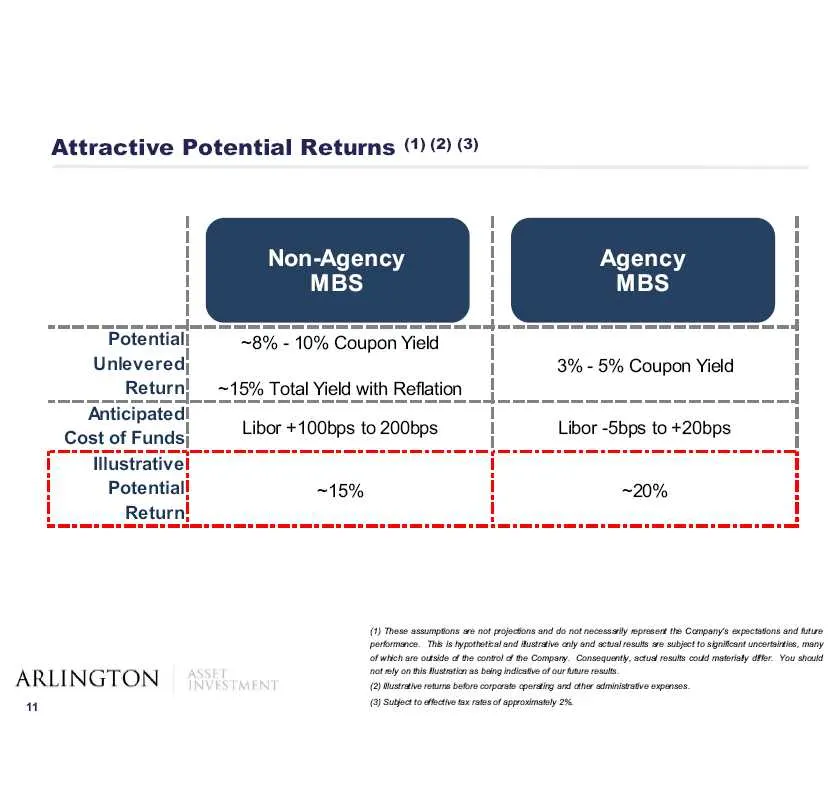
Attractive Potential Returns (1) (2) (3) Non-Agency Agency MBS MBS a Potential ~8% - 10% Coupon Yield Unlevered; 3% - 5% Coupon Yield ~15% Total Yield with Reflation (1) Tae assumptions ae not project and do not necestsly mprert ts Company’ epciond ad Aare povtsmance. The Is ypoteteal and udraive el
Slide 13: Potential Earnings Growth Scenario
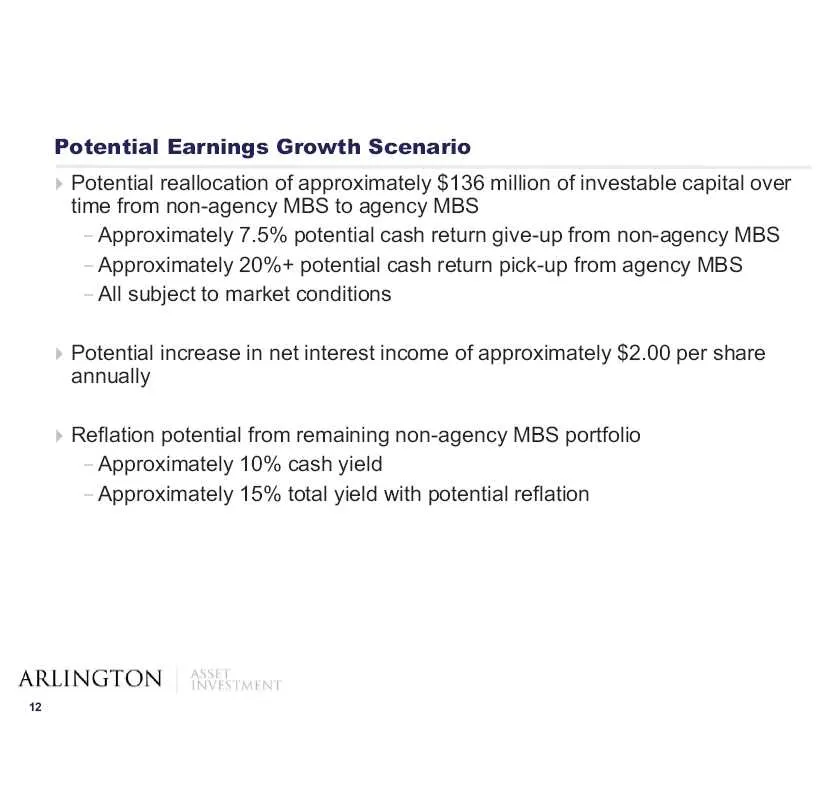
Potential Earnings Growth Scenario Potential reallocation of approximately $136 million of investable capital over time from non-agency MBS to agency MBS Approximately 7.5% potential cash return give-up from non-agency MBS Approximately 20%+ potential cash return pick-up from agency MBS All subject
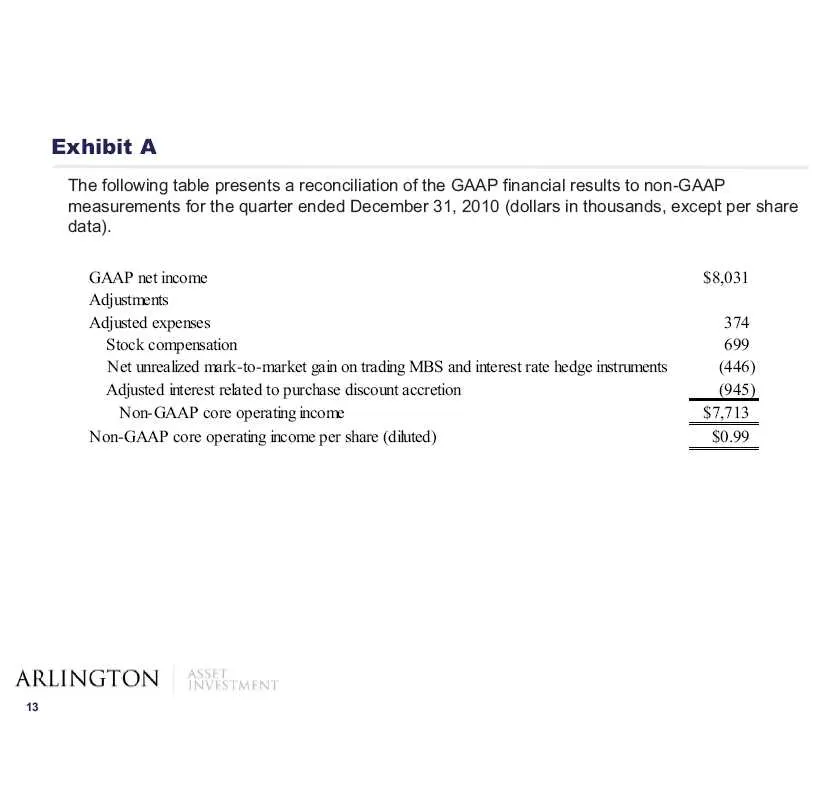
Slide 14: Exhibit A
Exhibit A The following table presents a reconciliation of the GAAP financial results to non-GAAP measurements for the quarter ended December 31, 2010 (dollars in thousands, except per share data). GAAP net income $8,031 Adjustments Adjusted expenses 374 Stock compensation 699 Net unrealized mark-to
Source: SEC EDGAR · 8-K filed Mar 16, 2011
More decks from Arlington Asset Investment Corp
 Q3 2023 Earnings Presentation12 slides · Nov 13, 2023
 Q2 2023 Earnings Presentation12 slides · Aug 14, 2023
 Q1 2023 Earnings Presentation16 slides · May 15, 2023
 Q4 2022 Earnings Presentation20 slides · Mar 31, 2023
 Q3 2022 Earnings Presentation29 slides · Nov 15, 2022
 Q2 2022 Earnings Presentation31 slides · Aug 10, 2022