Arena Resources — Merger or Acquisition (April 2010)
51 slides from Arena Resources's merger presentation, Apr 6, 2010
Slide 1: SandRidge: energy to go further
SandRidge a energy to go further
Slide 2: Disclaimer (Page 1 of 2)
Disclaimer (Page of 2) Safe Harbor Language on Forward Looking Statements: This presentation includes "forward-looking statements" within the meaning of Section 27A of the Securities Act of 1933, as amended, and Section 21E of the Securities Exchange Act of 1934, as amended. These statements express
Slide 3: Disclaimer (Page 2 of 2)
Disclaimer (Page 2 of 2) IMPORTANT ADDITIONAL INFORMATION WILL BE FILED WITH THE SEC This communication is being made in respect of the proposed business combination involving SandRidge Energy, Inc. and Arena Resources, Inc. In connection with the proposed transaction, SandRidge Energy, Inc. plans t
Slide 4: Transaction – Summary
Transaction – Summary Strategy: Why Arena? Increases exposure to oil (8,500 Boepd – 86% Oil) Single asset focus in the Central Basin Platform • Low risk drilling (2,700 locations) • Shallow vertical wells (less than 6,000 feet) • Proven production history (discovered in 1930) Seamless integration by
Slide 5: Transaction – Arena Key Attributes
Transaction – Arena Key Attributes Production/Reserves 86% Oil Concentrated, operated oil-weighted Permian Basin position March disclosed net production 8,500 Boepd with significant growth potential 69.3 Mmboe proven reserves YE 2009 Permian Basin Oil Approximately 67,600 Net Acres (85% Permian Basi
Slide 6: Central Basin Platform San Andres / Clear Fork Formations
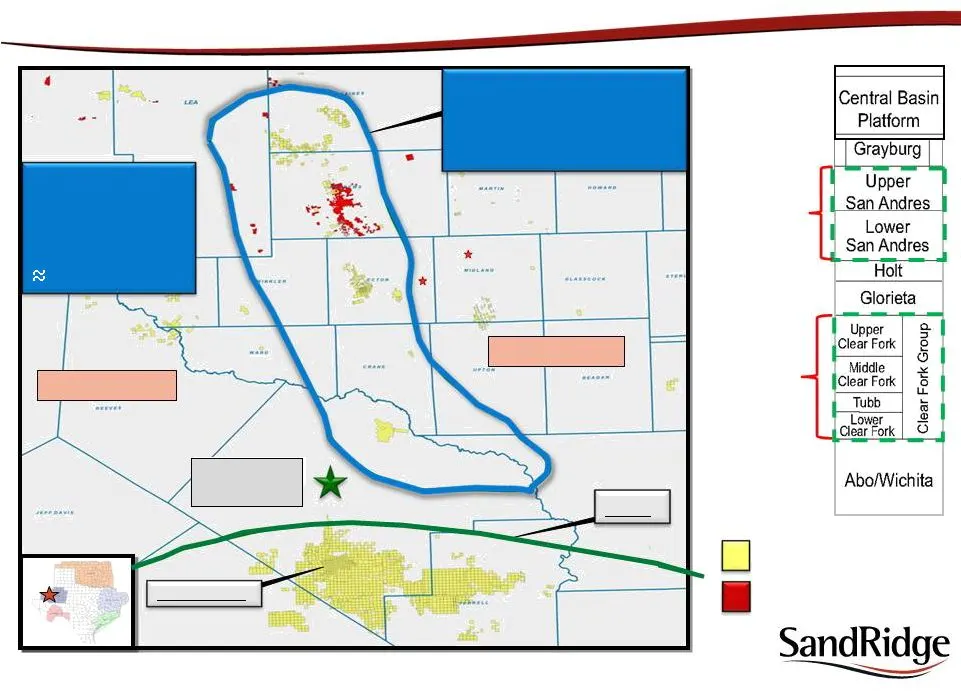
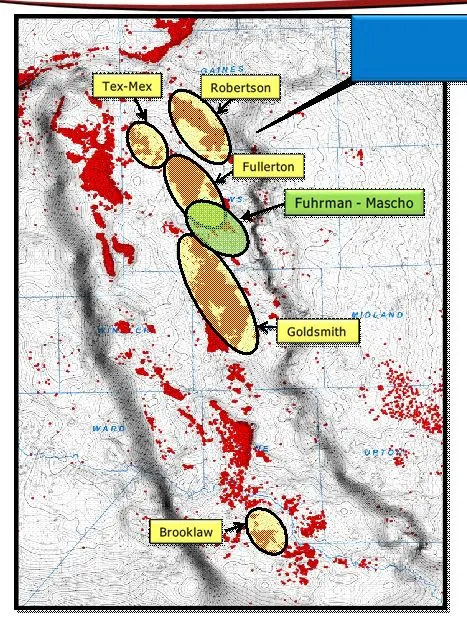
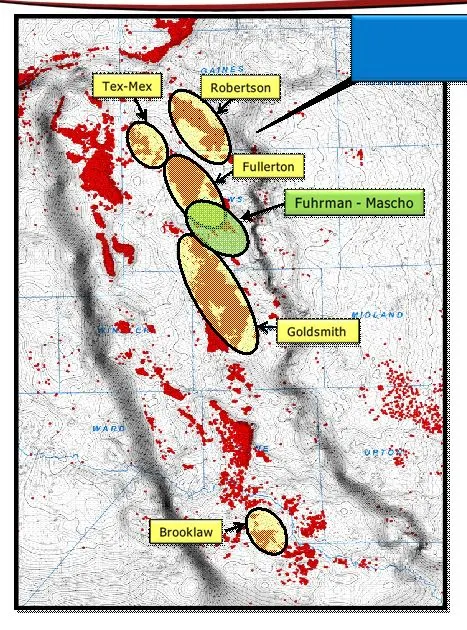
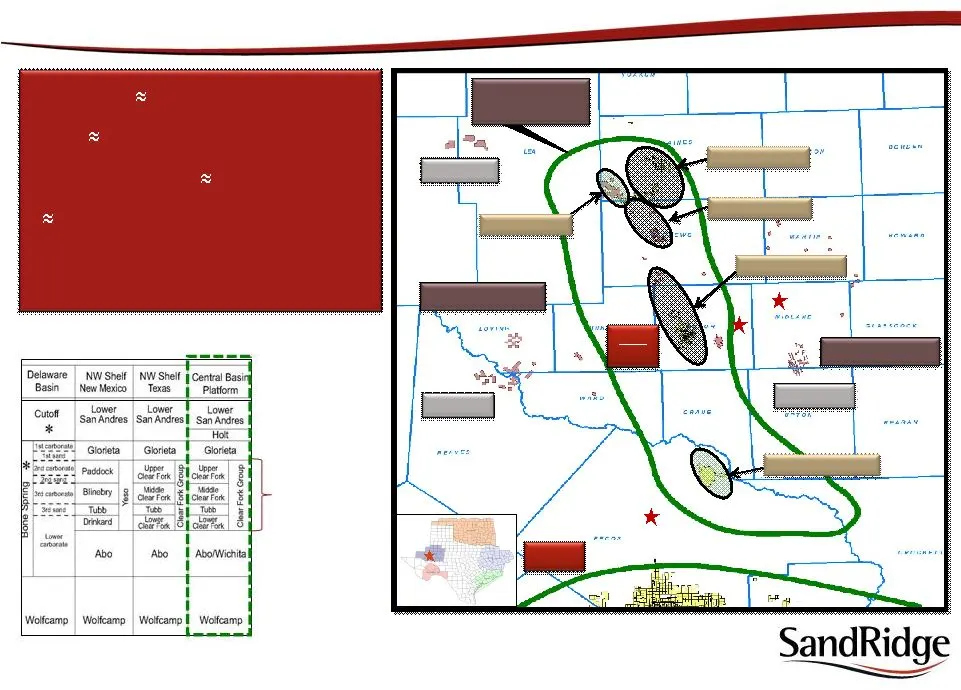
CENTRAL BASIN PLATFORM San Andres / Clear Fork Formations Combined West Texas Net Acreage Position 770,000 acres San Andres (4,300’) Clear Fork (6,000’) Concentrated West Texas Asset Base SandRidge Arena Delaware Basin Midland Basin MIDLAND Ft. Stockton Service Base (33 drilling rigs) ODESSA WTO PIÑ
Slide 7: SandRidge
SandRidge [=
Slide 8
Slide 9
Slide 10: Combined Asset Analysis
SandRidge Combined Asset Analysis (1) (1) (1) (4) (1) (2) (3) (1) 2009 SEC 12 month average; $3.87/Mcf, $57.65/Bbl (2) Dec. 31, 2009 spot prices; $5.79/Mcf, $79.34/Bbl (3) Average 10 year NYMEX strip; $6.94/Mcf, $92.24/Bbl (4) Dec. 2009 average for SD, Mar. 2, 2010 for ARD Post-Acquisition Total Pro
Slide 11: SandRidge leads Arena
SandRidge ——S SandRidge lead “>ARENA SandRidge —[—
Slide 12: Arena
4) ARENA
Slide 13: 12/09 Permian Acquisition
12/09 Permian Acquisition 12/09 Permian Acquisition Permian Production (MBoepd) 4.3 13.0 21.5 Net Acres (M Acres) Total Proven Reserves (MMBoe) Drilling Locations ( # ) 2,694 5,700 PV10 PROVEN (SEC) $MM $ $ 2,053 $ PV10 PROVEN (12/31 SPOT) $MM $ 1,823 $ 3,557 $ PV10 PROVEN (NYMEX 10 yr avg) $MM 1,02
Slide 14: Acquisition Financial Review
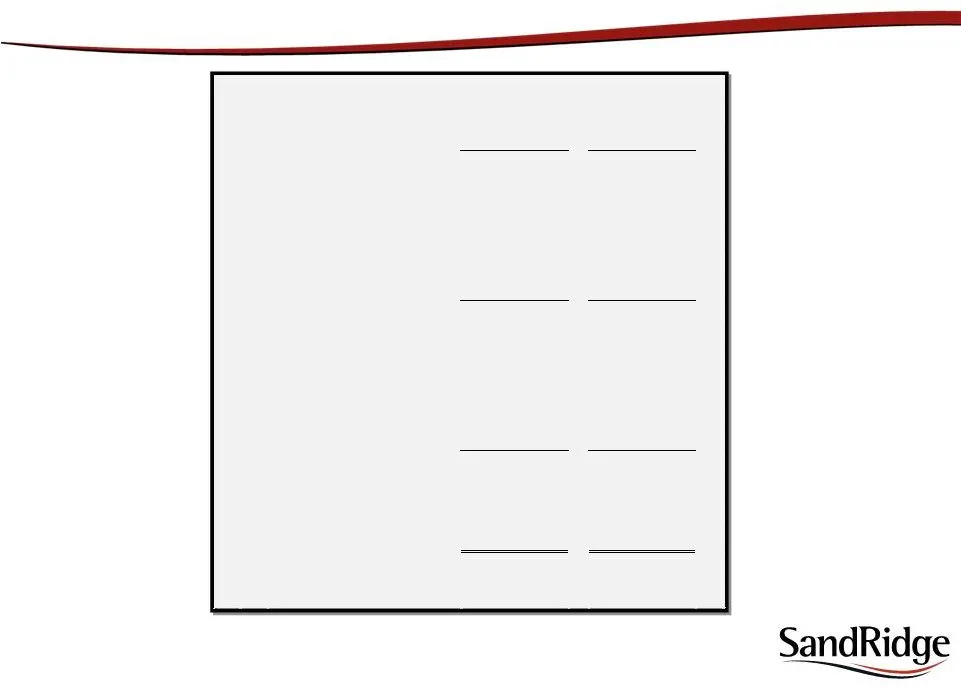
Acquisition Financial Review Goals of Transaction Increase exposure to oil Hedge significant amount of production through 2013 Cash flow per share accretion Balance sheet improvement Major Steps to Complete File S-4 File HSR Shareholder Vote (both SD and ARD) Expected Closing: June/July
Slide 15: Transaction – Hedge Review
Transaction – Hedge Review Q3 & Q4 2H10 -2013 2010 TOTAL Current SandRidge Crude Oil (Mmbo) 2.3 14.8 Price $82.08 $85.88 Natural Gas (Bcf) 40.0 40.0 Price $7.76 $7.76 Total Revenue Hedged $499 $1,578 Arena Crude Oil (Mmbo) 0.6 0.6 Price (Floor) $66.67 $66.67 Natural Gas (Bcf) 0.9 0.9 Price (Floor) $
Slide 16: SandRidge
SandRidge ——
Slide 17: Transaction – Share Analysis
Transaction – Share Analysis SandRidge SandRidge Pre-Acquisition Arena Post-Acquisition SD Shares Outstanding - March 26, 2010 210,797,254 SD 8.5% Preferred Stock 33,083,645 SD 6.0% Preferred Stock 18,416,206 Total SD Fully Diluted 262,297,105 262,297,105 ARD Shares Outstanding - March 15, 2010 39,0
Slide 18: SandRidge
SandRidge ——
Slide 19: Transaction – Balance Sheet
Transaction – Balance Sheet (as of December 31, 2009) SandRidge Estimated SandRidge Pre-Acquisition Arena Adjustments Post-Acquisition Cash $7.9 $63.6 -$15.0 $56.5 Debt Bank Debt $0.0 $0.0 $100.0 $100.0 Other Senior Debt 35.3 35.3 Floating Senior Notes 350.0 350.0 8.625% Senior Notes 650.0 650.0 9.8
Slide 20: SandRidge – Who We Are
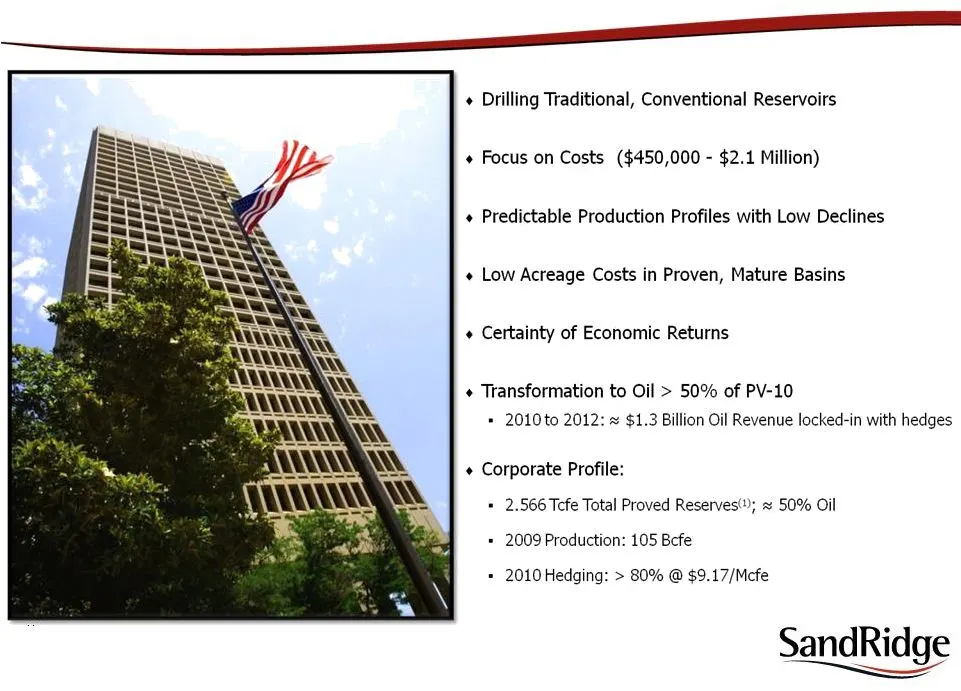
SandRidge – Who We Are (1) Using December 31, 2009 Pricing
Slide 21: Vertical / Fracturing; Horizontal Drilling
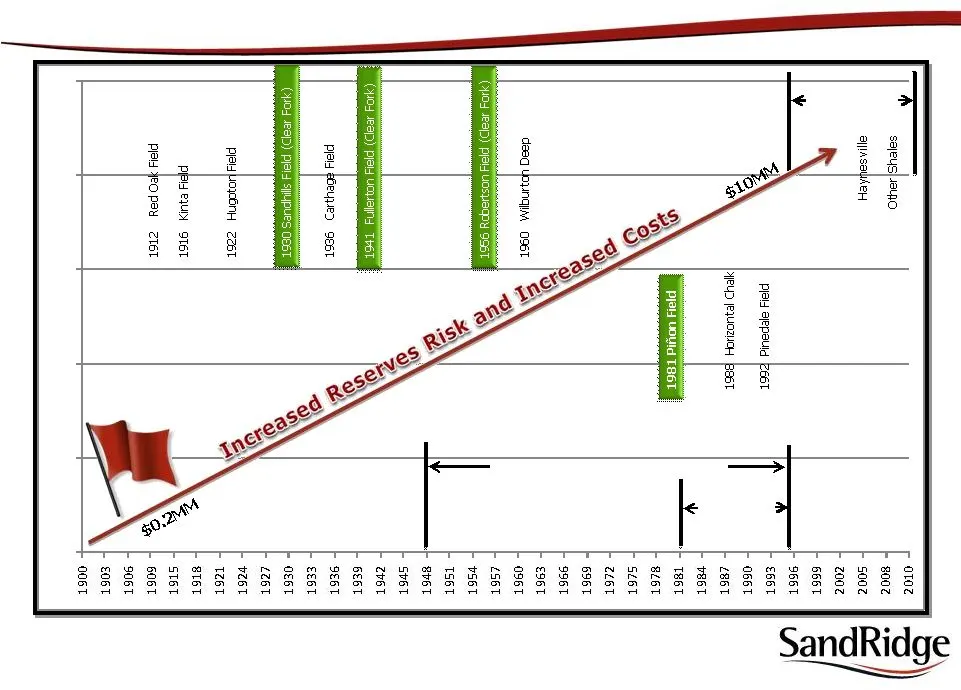
Vertical / Fracturing Horizontal Drilling Horizontal w/ Fracing Is There Risk?
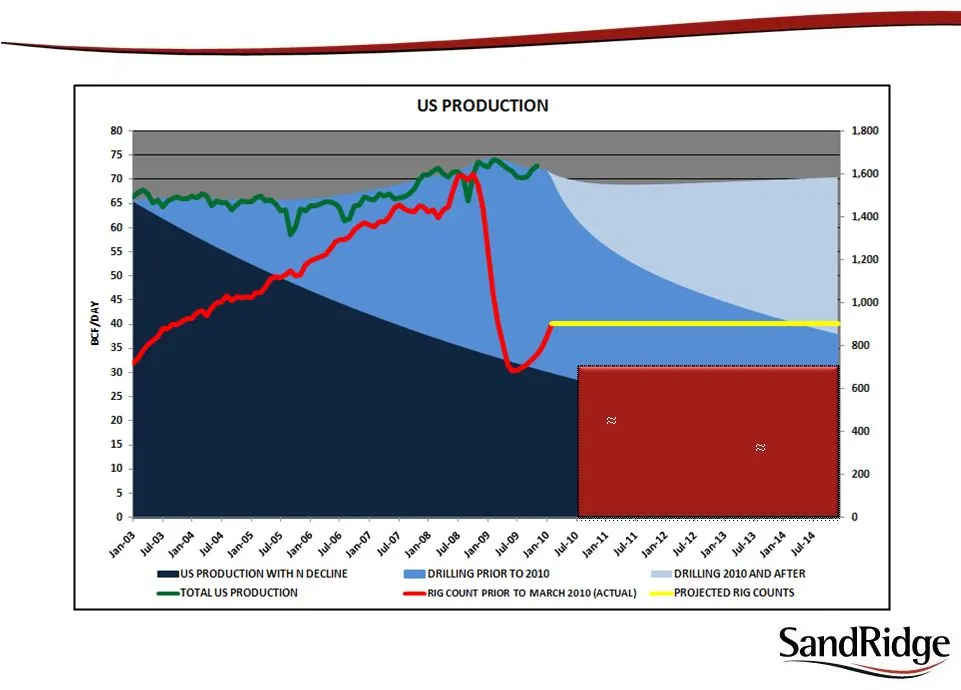
Slide 22: US Natural Gas Drilling Activity Will Challenge Natural Gas Price
• Assumes 22% US decline • 900 – 950 Current Gas Rigs • Horizontal Drilling 60% efficiency increase • Rig count continues to increase US Natural Gas Drilling Activity Will Challenge Natural Gas Price
Slide 23: Simple Macro Oil Theory on “Why?”
Simple Macro Oil Theory on “Why?” • BG • BP • Devon • Exxon-Mobil • Mitsui • StatOil • Total Oil is difficult to find. Companies Focusing on North American Gas:
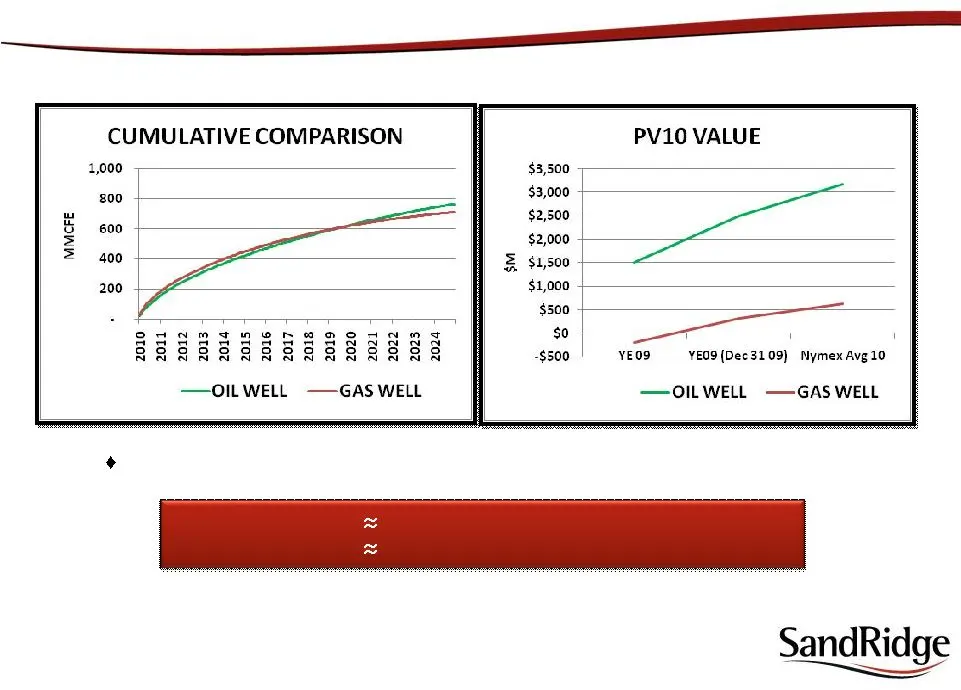
Slide 24: Cumulative Comparison PV10 Value
a CUMULATIVE COMPARISON PV10 VALUE 1,000 $3,500 00 $3,000 BS iges $2,500 s $2,000 = 400 = $1,500 200 $1,000 $500 BERRSRSESSSRNAS » j ! ; RAESRAERRARSRRRRRAR -$500 YEOS YEO9(Dec3109) Mymex Avg 10 —OILWELL ——GAS WELL —OILWELL ——GAS WELL + SandRidge [=
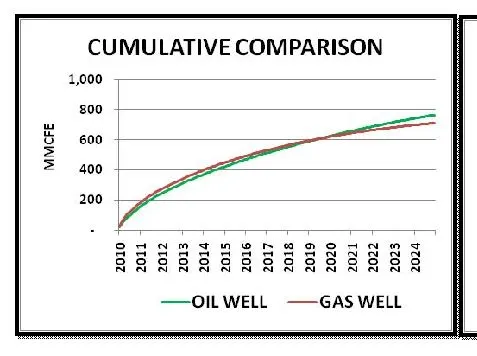
Slide 25: Gas Well vs Oil Well
‘GAS WELL OIL WELL z jo} 2 = Bd 2 j=} S) Ww 2 & s 5 = 5 rs) 2OWW
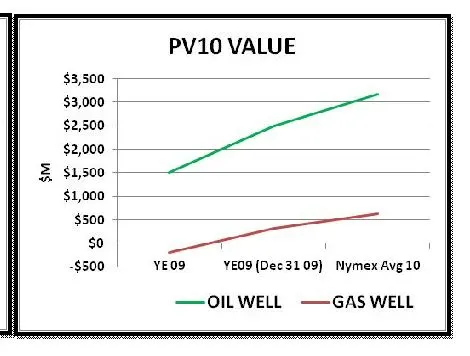
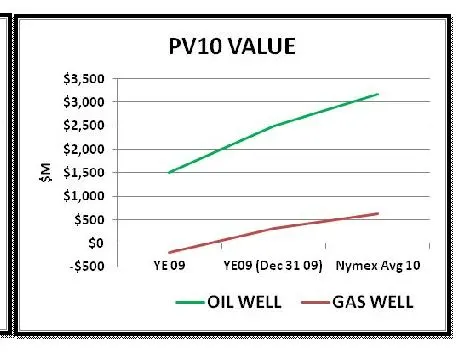
Slide 26: PV10 Value
PV10 VALUE YEO9 —-YEU9{Dec3109) Nymex Avg10 —OILWELL ——GAS WELL
Slide 27: Oil Delivers 10X More Value
Oil Well .77 Bcfe Reserves $950M Capex Gas Well .77 Bcfe Reserves $950M Capex Oil Delivers 10X More Value Oil wells are significantly “VALUE” advantaged in today’s pricing environment
Slide 28: Hedging
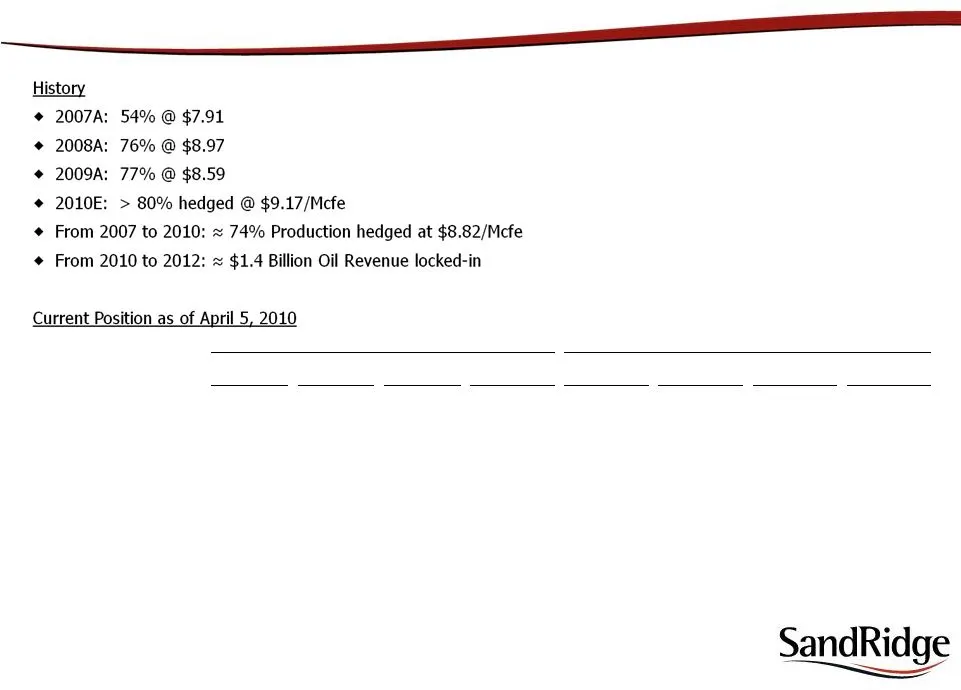
(a) Includes WAHA and HSC Basis Swaps in 2011 and 2012 Natural Gas Swaps assume a ratio of 1:1 for Mcf to MMBtu Hedging Quarter Ending Ending 3/31/2010 6/30/2010 9/30/2010 12/31/2010 12/31/2010 12/31/2011 12/31/2012 12/31/2013 Natural Gas Swaps: Volume (Bcf) 20.48 19.79 20.01 20.01 80.29 0.00 0.00 0
Slide 29: Operating Areas
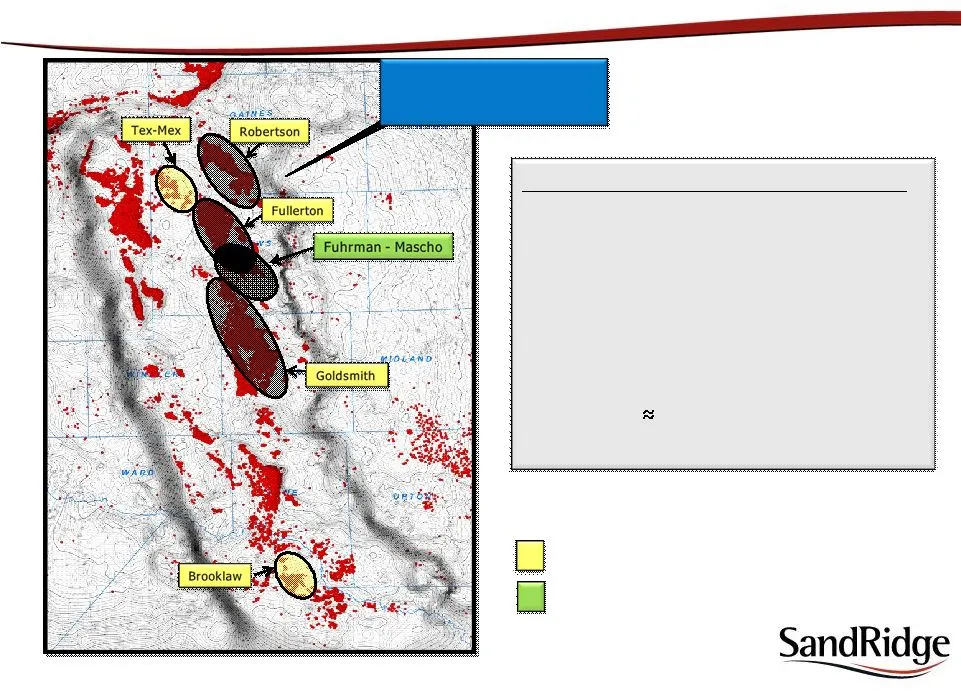
SandRidge Operating Areas West Texas Overthrust Over 550,000 acres 5,500 drilling locations Exploration Permian Basin – Oil Over 150,000 acres 2,700 drilling locations 4 Main oil plays: • Clear Fork (CBP) • San Andres (CBP) • Wolfberry • Delaware Group (Bone Springs / Bell Canyon / Cherry Canyon) Ok
Slide 30: SandRidge
\ SandRidge
Slide 31
Slide 32
Slide 33: Piñon Development: Century Plant
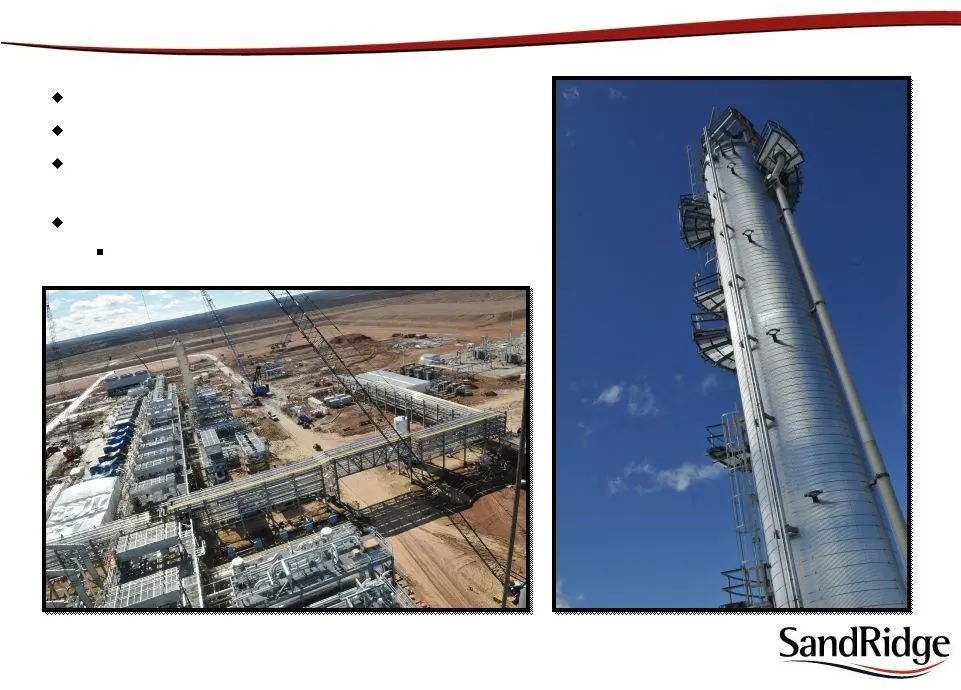
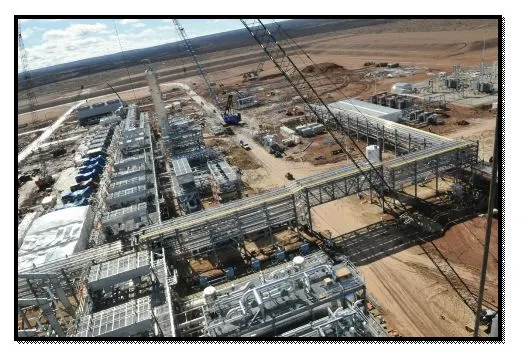
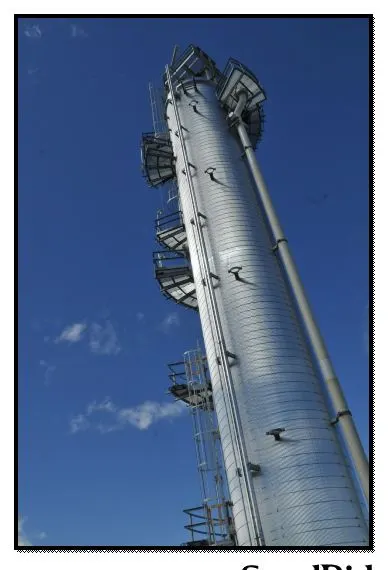
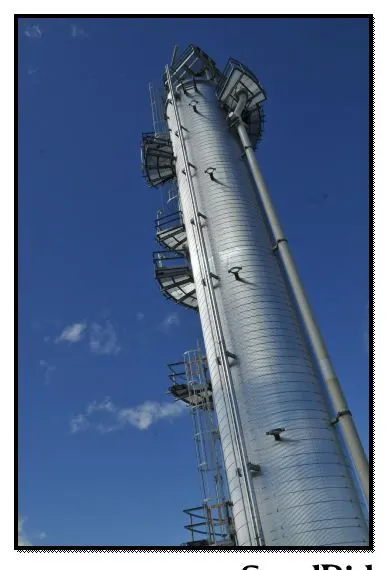
Piñon Development: Century Plant Phase I Completion: July – August 2010 Triple Treating Capacity Largest Single Industrial Source CO Capture Facility in North America Currently Qualifies for Tax Credits Will Benefit from Most Cap & Trade Proposals *Century Plant in partnership with Occidental Petrol
Slide 34: Piñon Compares Favorably Against ANY U.S. Gas Play
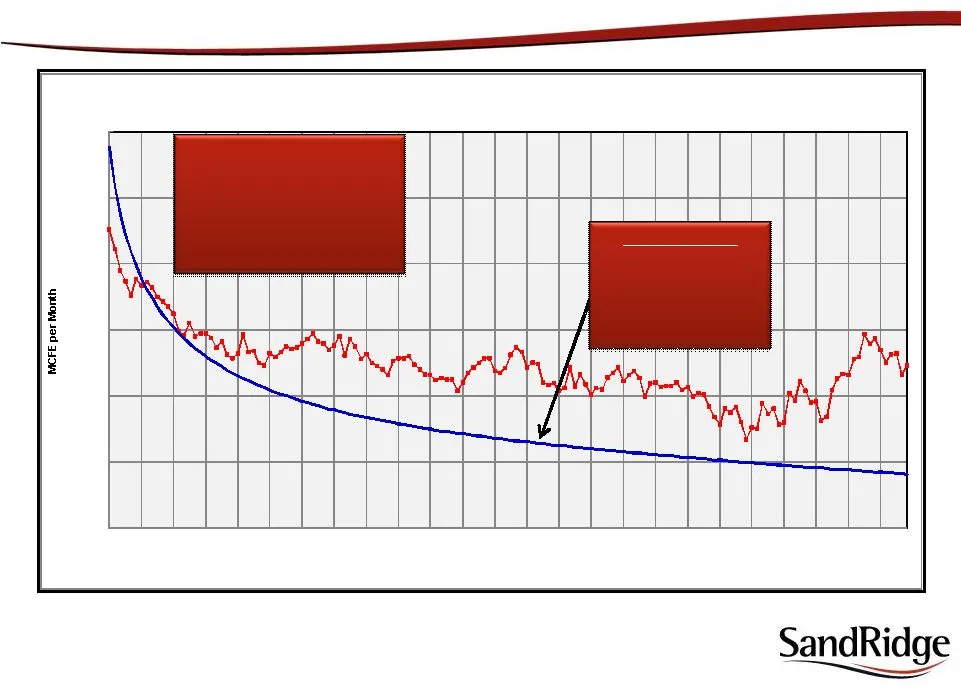
MCFE per Month Warwick/Tesnus 7.3 Bcfe wet gas 2.46 Bcfe net *53% ROR Finding Costs $.99/Mcfe • Tier 1 Economics • All HBP • Mature Field • High Perm Reservoir • In-Fill Development - 20,000 40,000 60,000 80,000 100,000 120,000 MONTHS SandRidge Energy Average for Formation vs. Type Curve Warwick Typ
Slide 35: Gross Thickness Map of the Warwick Caballos
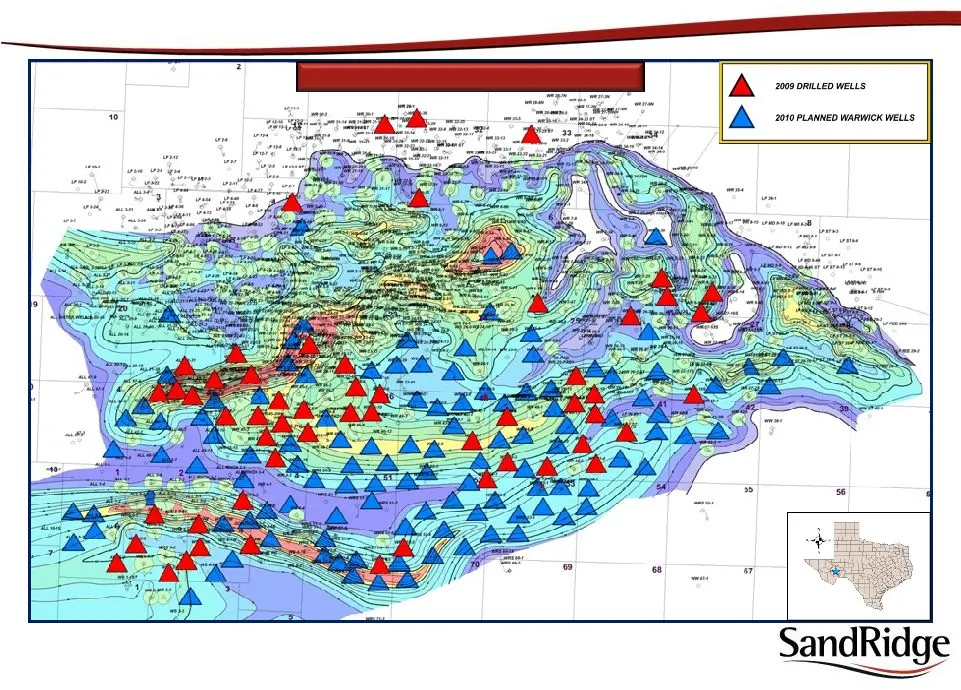
Gross Thickness Map of the Warwick Caballos Piñon Field: 2009 Wells Drilled / 2010 Development Drilling
Slide 36: Central Basin Platform stratigraphy
T Delaware | NW She | NW Shel | Cental Basi Basin |New Mexico | Texas Platform: Lower | Lower T Lower Cute —sanAndres San Andres] San Andres * 1 Hae Goreta T Glorieta 1 onten | Bl oktiten cafe E oumter as B Woifeamp | Woltamp | Wotteamp I Wotteamp al SandRidge ——
Slide 37: a a m7 o a = Zz PEA PCL EPP ERP ER ORE SandRidge
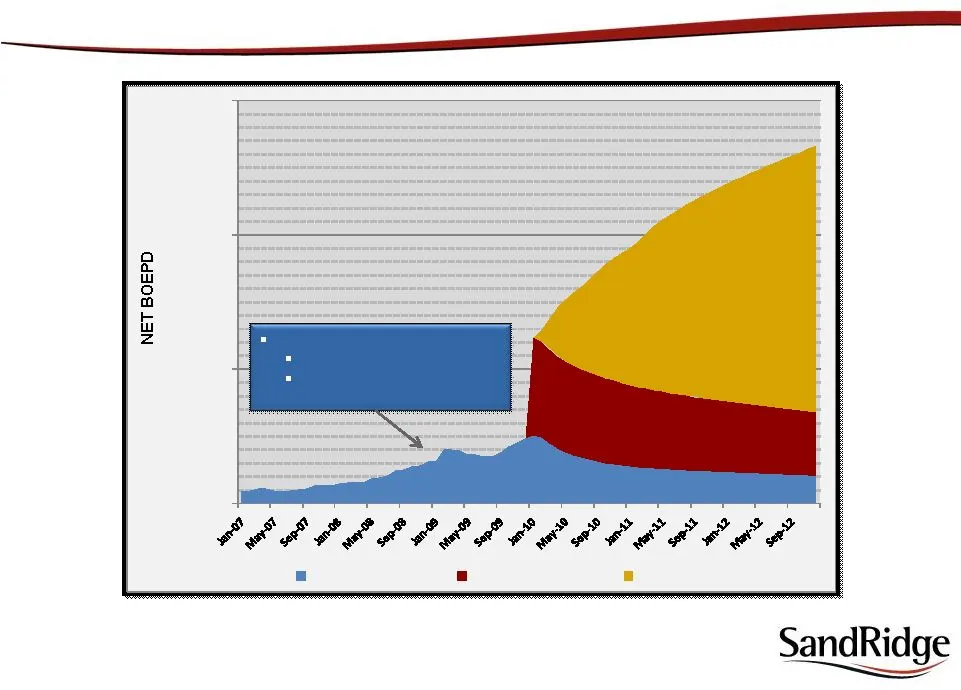
a a m7 o a = 7 Zz PEA PCL EPP ERP ER ORE SandRidge ——
Slide 38: Permian Production Forecast
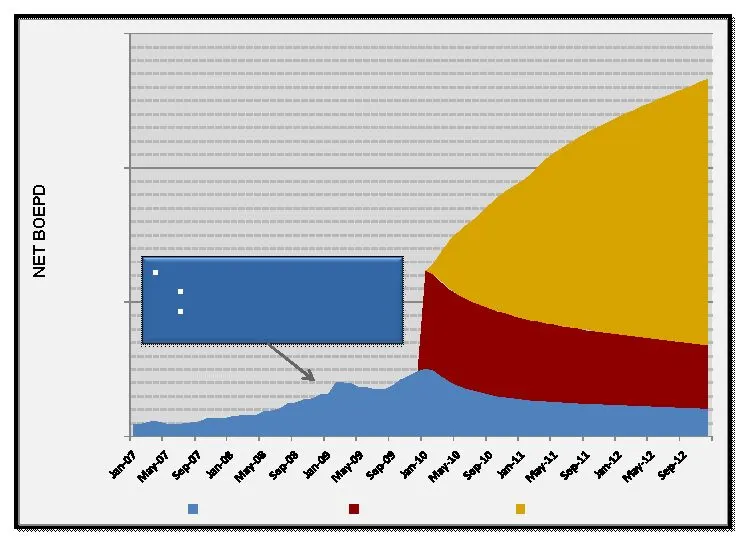
Jan 07 to Feb 09 1.5 Rigs Drilling Program Production Increased from 900 Boe/d to 4100 Boe/d Permian Production Forecast - 10,000 20,000 30,000 SandRidge PDP Acquisition PDP Drilling
Slide 39: SandRidge
SandRidge
Slide 40: NW Oklahoma – Mississippian Horizontal Play
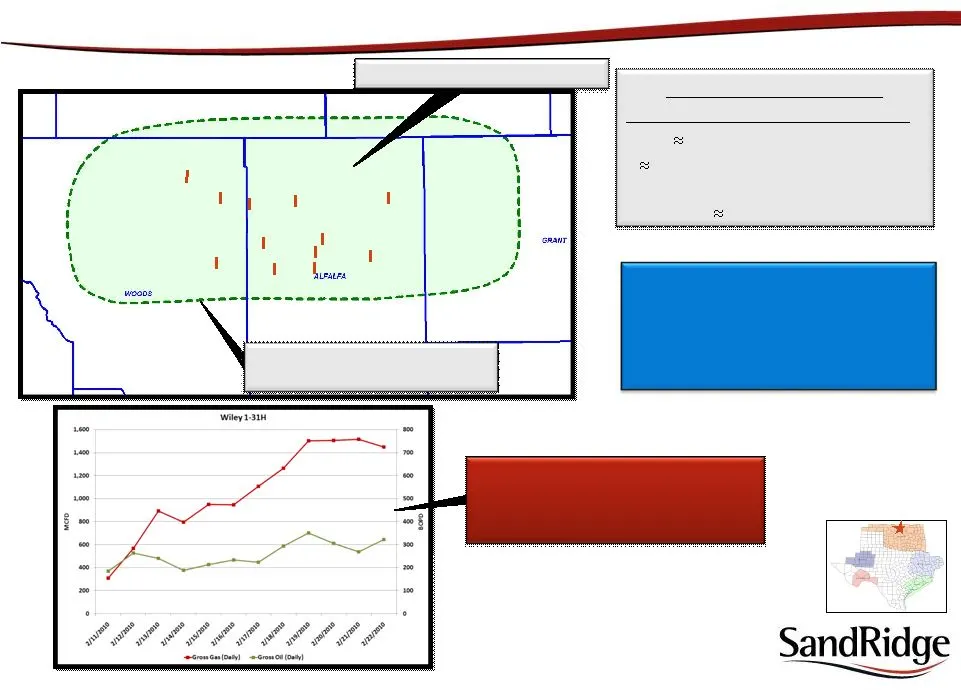
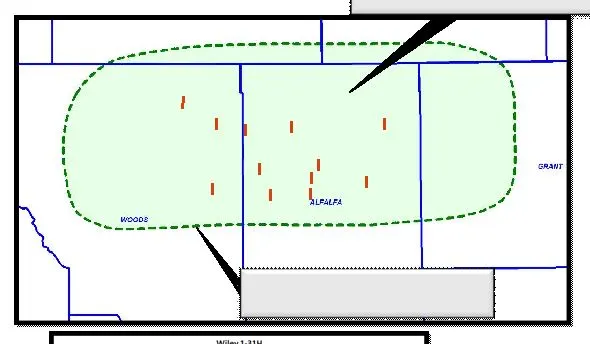
SandRidge Operated • WILEY 1 - 32H 350 Bopd , 1,500 Mcfpd • TALON 1 - 6H Waiting on Completion Non Op / Industry Activity 12 wells producing Avg First Month IP - 150 Bopd, 400 Mcfpd SandRidge Potential MISSISSIPPIAN HORIZONTAL POTENTIAL • Land 115,000 acres (net) • 280 drilling locations • > 320 acr
Slide 41: Western Oklahoma – Woodford Play
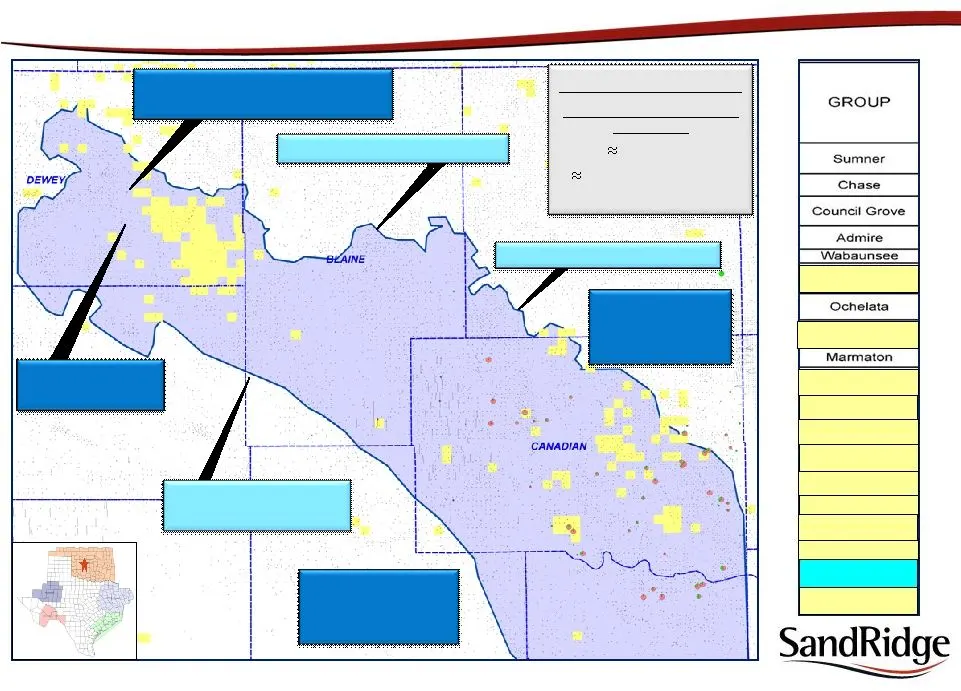
DEVON ACTIVITY 109,000 net acres 6 Tcfe potential CIMAREX ACTIVITY 94,000 net acres 2-3 Tcfe potential CLR: Brown 1-2H 7 day test: 4,200 Mcfpd , 100 Bopd CLR: Doris 1-25H Currently Drilling SandRidge Position WOODFORD HORIZONTAL POTENTIAL • Land 45,000 acres • drilling locations • 5-8 Bcfe/well WOOD
Slide 42: WTO Exploration: Prospects and Leads
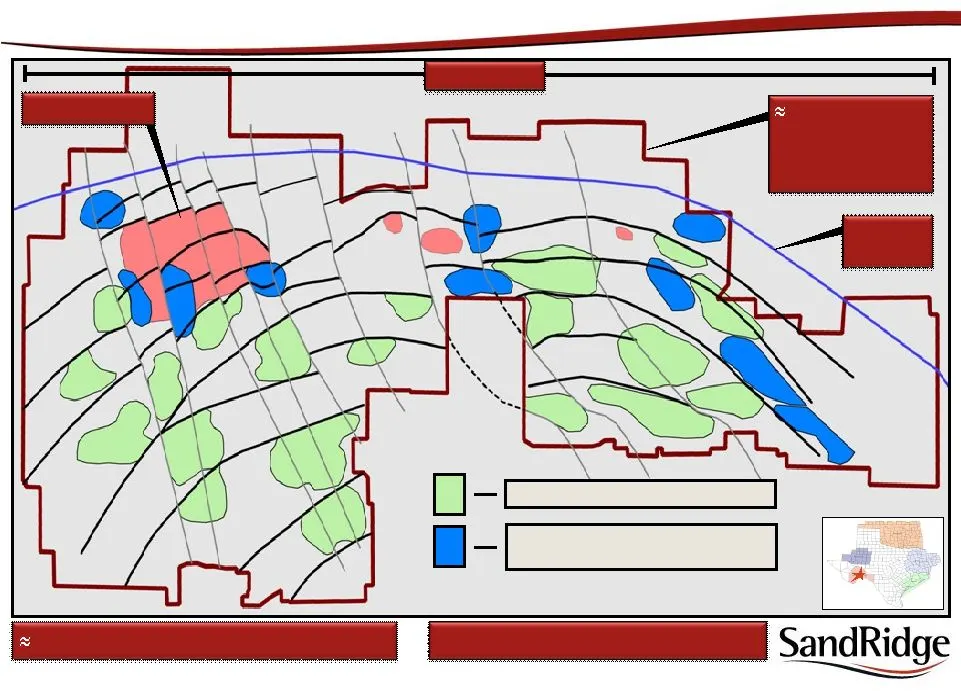
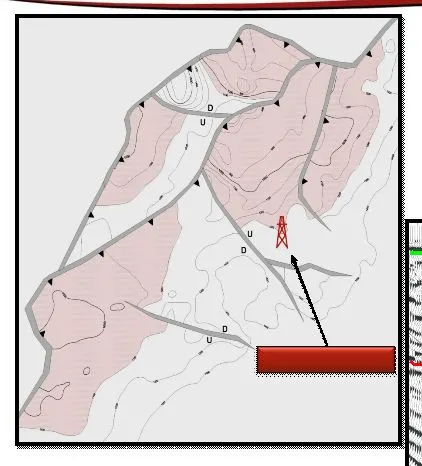
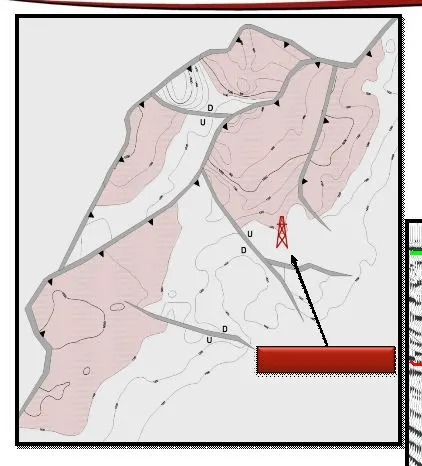
SD Controls > 550,000 Net Acres $20MM – $25MM Drilling Budget in 2010 Piñon Field 65 MILES 1,300 SQUARE MILES OF 3-D SEISMIC COVERAGE Leading Edge WTO Exploration: Prospects and Leads Warwick Caballos Prospects / Leads Sub-Thrust Prospects / Leads (Fusselman & Ellenburger) Note: Diagram is not to sc
Slide 43: Exploration Risks in WTO / High Reward
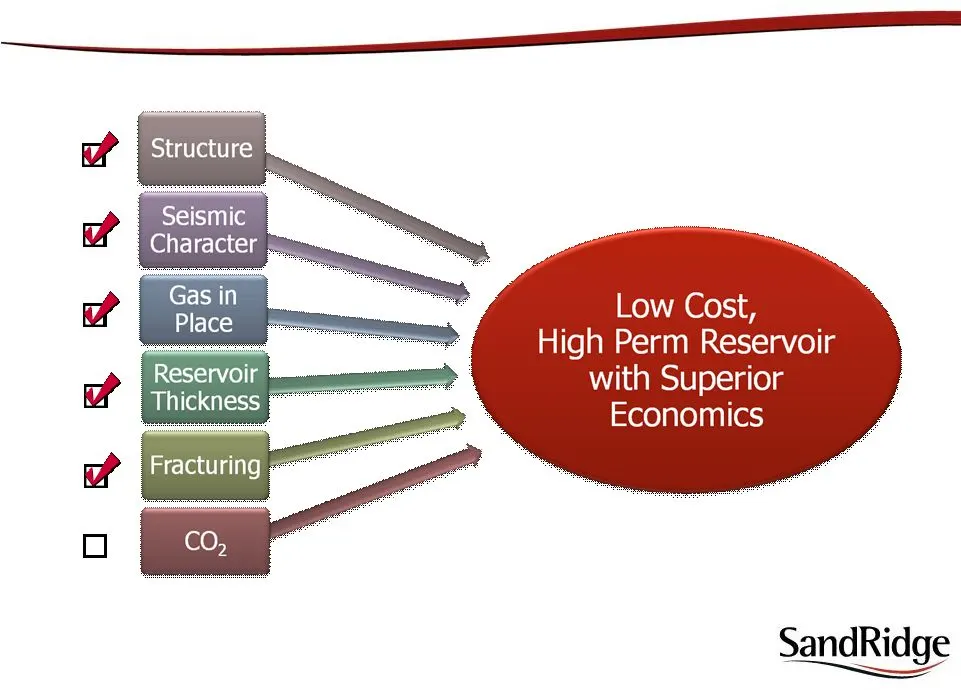
6 Exploration Risks in WTO / High Reward
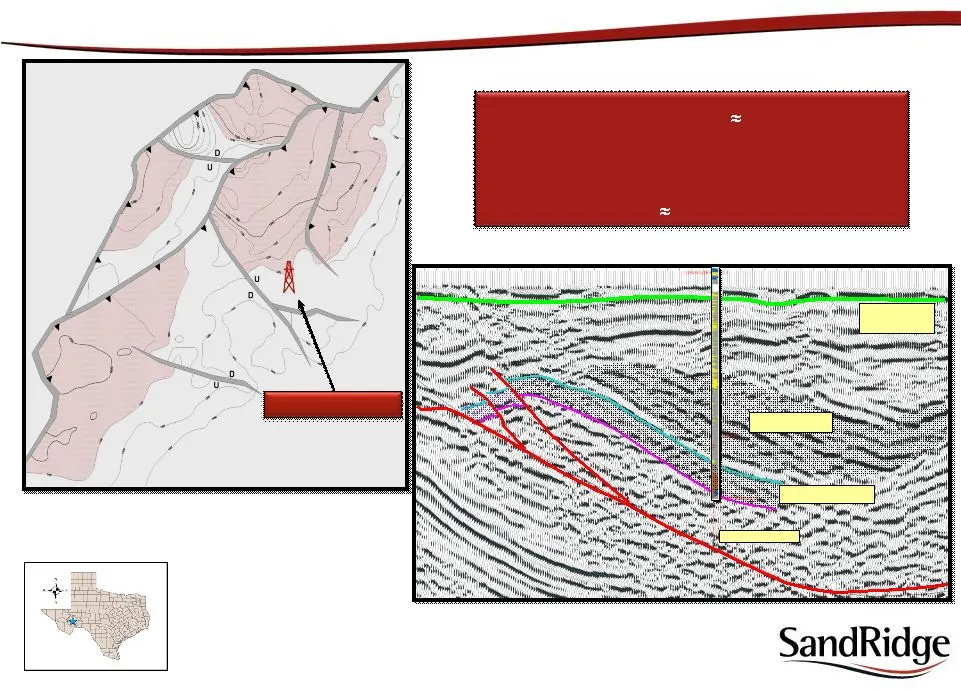
Slide 44: zi i
zi i secant Leduc "hog wii "ony om or se ah ne mer rho SandRitige
Slide 45
Slide 46
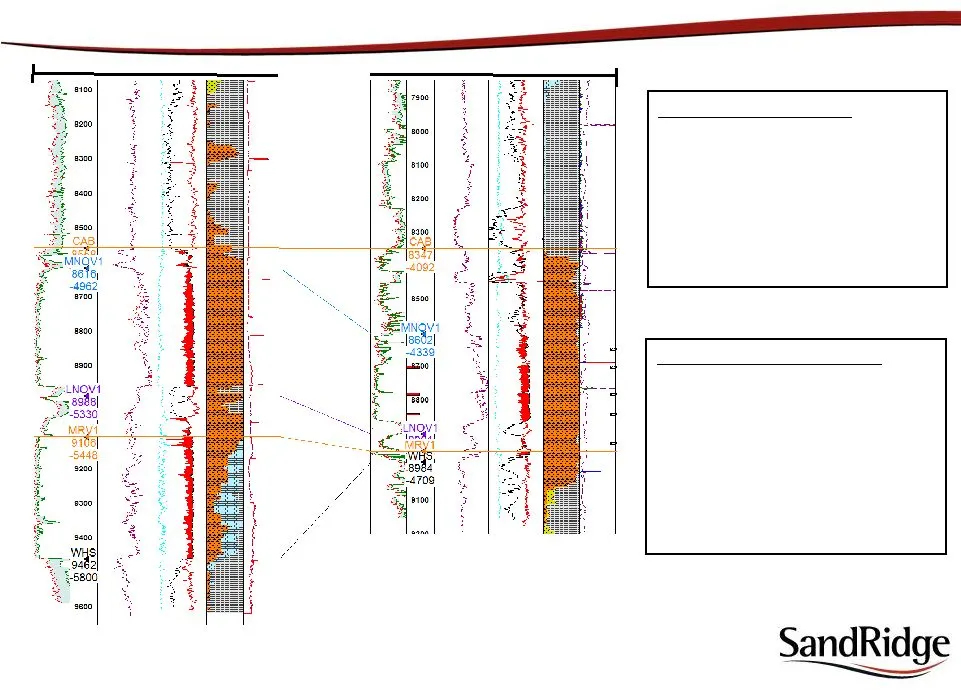
Slide 47: Reservoir Comparison: Piñon Field to Exploration Well #1
Type Well (Piñon Field) • Top of Cab 8,357 ’ • Gross interval thickness 637 ’ • Avg x-plot porosity of 2-3% • High Resistivity in the Chert • On the back - limb of a structural high • Down dip from the crest of a structure • Background gas to 70 units • Production from the Chert • EUR 7.5B wet 18 Mi
Slide 48: SandRidge
SandRidge ——[—
Slide 49: Eastern WTO: Warwick Caballos Prospect
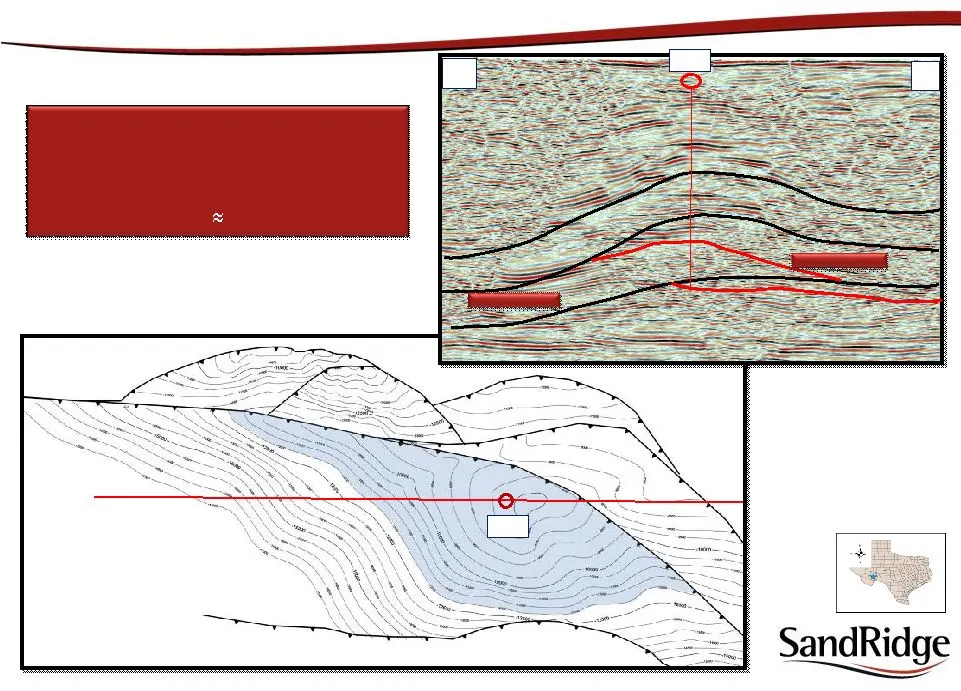
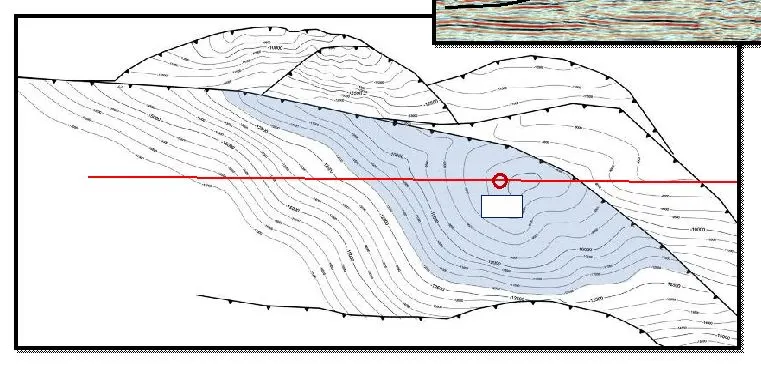
• Warwick Prospect – 23,000 Acres • Drill Depth – 9,000 – 11,000 Feet • 5000’ of Structural Closure • Unrisked Potential 16 Tcfe Thrust Fault Top Cab Interval W E Eastern WTO: Warwick Caballos Prospect Top Caballos Interval Depth Structure Map C. I. = 500 ft E W Note: Diagram is not to scale and is
Slide 50: Reservoir Sand Comparison: Piñon Field to Exploration Well #2
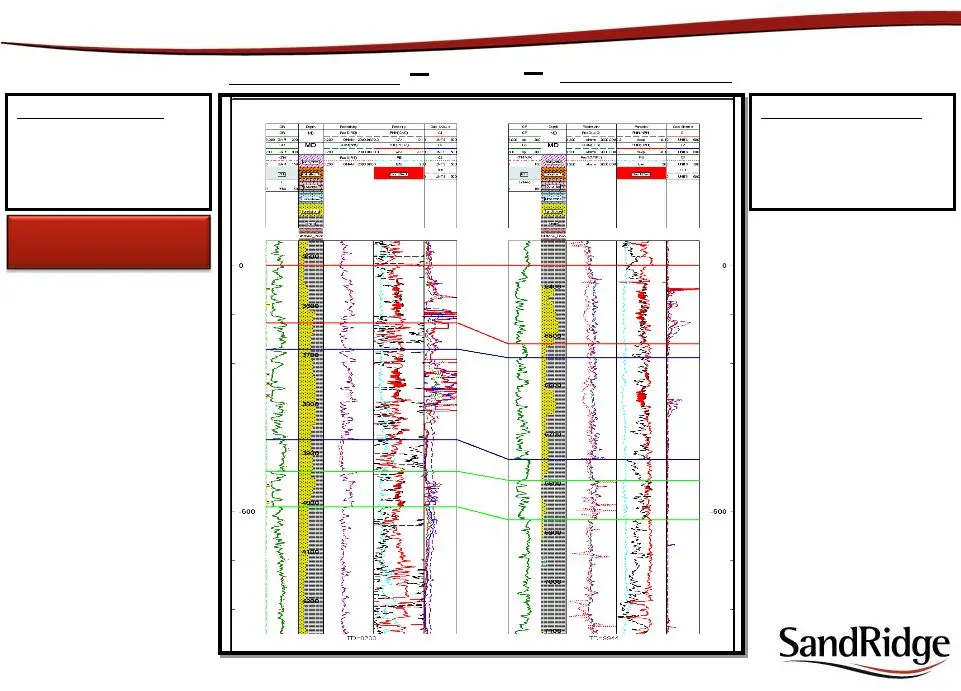
IP: 2,200 MCF EUR: 1.5 BCF 35 Miles Exploration Well #2 Piñon Tesnus Well Tesnus Reservoir Sand Comparison: Piñon Field to Exploration Well #2 Exploration Well #2 • 419 ’ Gross Section • 177 ’ Net Pay • 10% Avg X-Plot Porosity • 1597u Max Gas Piñon Tesnus Well • 464 ’ Gross Section • 190 ’ Net Pay •
Slide 51: SandRidge: energy to go further
. SandRidge energy to go further
Source: SEC EDGAR · 425 filed Apr 6, 2010