Gulfmark Offshore — Barclays Emerging Growth Company One-on-One Forum 2014
28 slides from Gulfmark Offshore's conference presentation, Mar 11, 2014
Slide 1: Barclays Emerging Growth Company One-on-One Forum
Barclays Emerging Growth Company One-on-One Forum GULEMARK MARCH 2014 OFFSHORE GulfMark Offshore, Inc. NYSE:GLF GULFMARK.COM
Slide 2: Forward Looking Statements
FORWARD LOOKING STATEMENTS f 1995. The words “believe,” “expect,” “anticipate “could” or other similar expressions are intended to identify ther i Palate materially from our historical experience and o} present expectations or projections. Among the important factors that could cause actual results
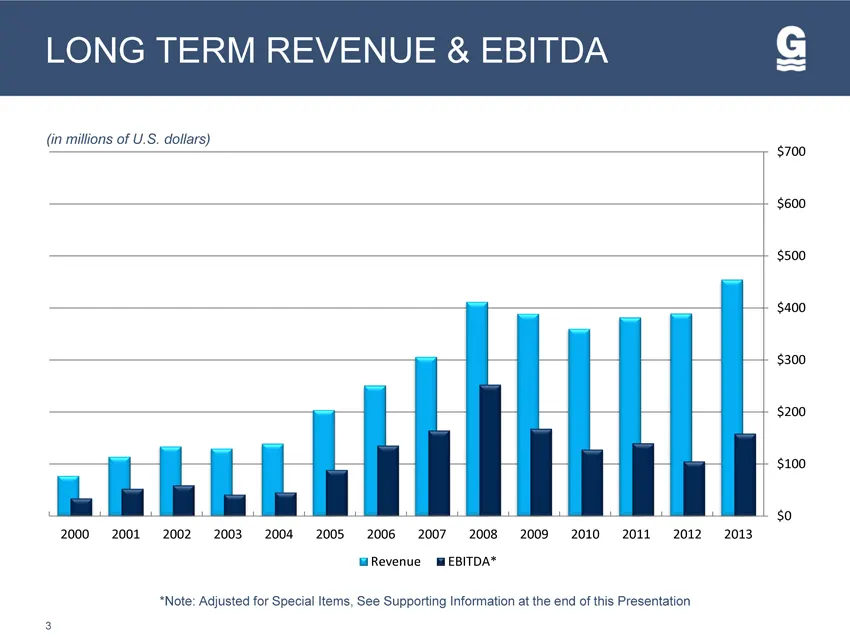
Slide 3: Long Term Revenue & EBITDA
LONG TERM REVENUE & EBITDA $300 $200 Leuba “ alk : 2010 2011 2012-2013 Revenue MEBITDA*
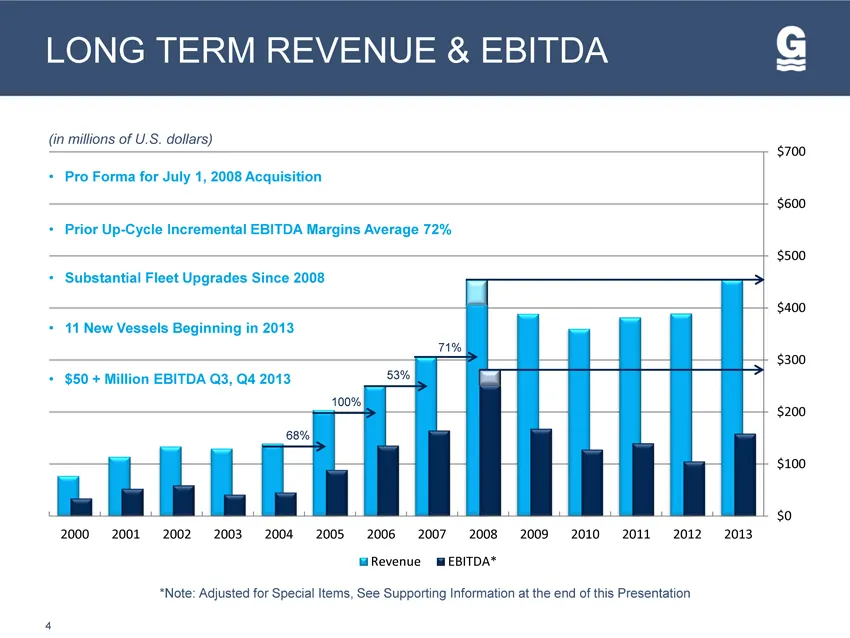
Slide 4: Long Term Revenue & EBITDA
LONG TERM REVENUE & EBITDA $700 + Pro Forma for July 1, 2008 Acquisition $600 $500 $400 > $300 $200 | “ | L | L - rl « 2000 «2001 «2002 = 2003 |S 2004 «= 2005 2006 )«= 2007. «2008 )39= 2009 2010 2011 2012 2013 Revenue MEBITDA*
Slide 5: Total Revenue in Backlog
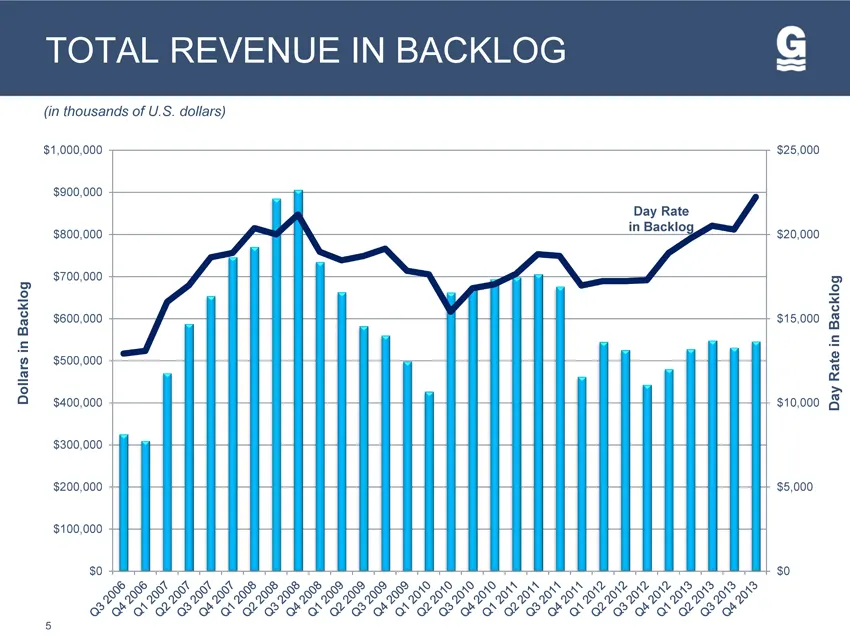
Dollars in Backlog TOTAL REVENUE IN BACKLOG (in thousands of U.S. dollars) Day Rate in Backlo, / ao A \ ( -— 400,000 $10,000 $200,000 $200,000 $5000 $100,000 wy ° She COE So's 3 3 Sos Day Rate in Backlog
Slide 6: Global Vessel Diversification
Slide 7: The GulfMark Fleet
THE GULFMARK FLEET
Slide 8: Revenue by Region
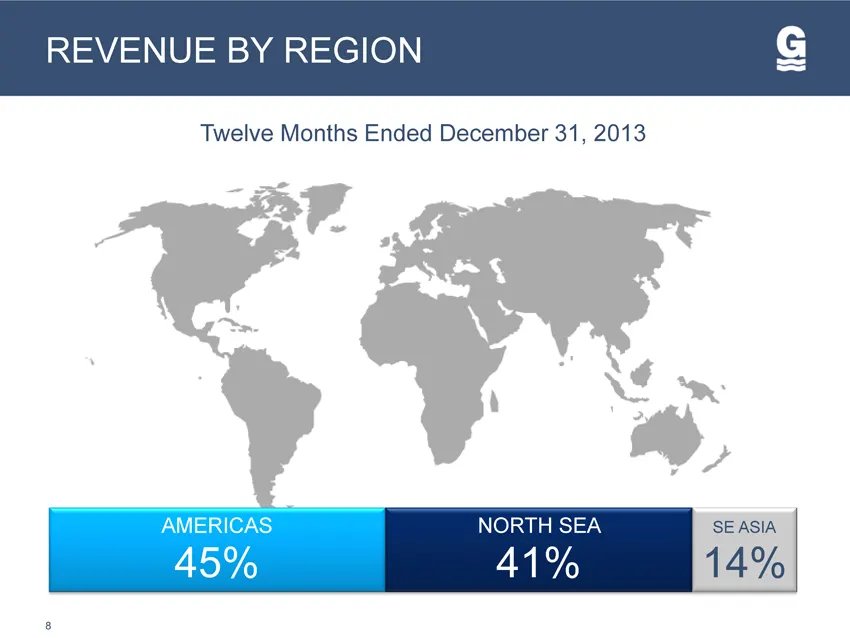
REVENUE BY REGION Twelve Months Ended December 31, 2013 AMERICAS NORTH SEA SEASIA 45% 41% 14%
Slide 9: Young & Versatile Fleet
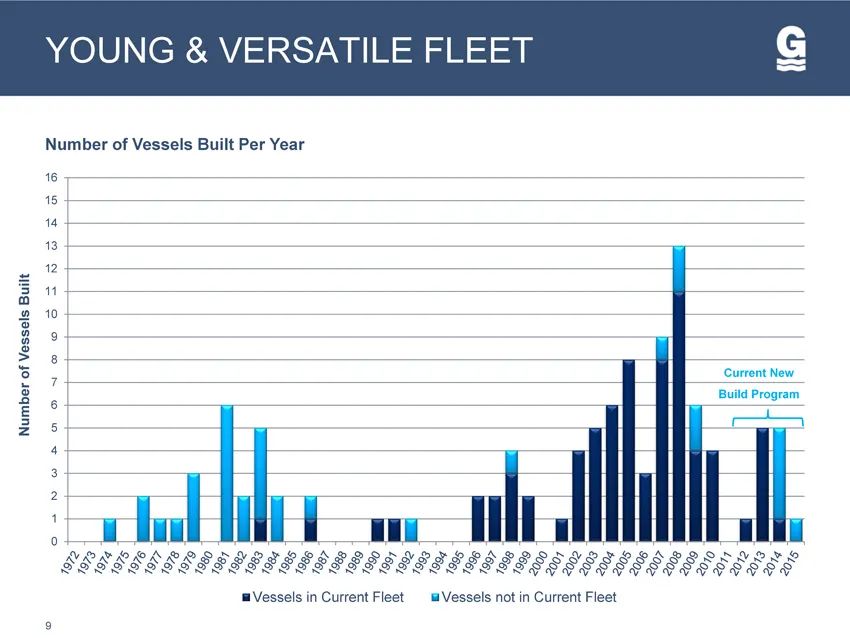
Number of Vessels Built YOUNG & VERSATILE FLEET Number of Vessels Built Per Year
Slide 10: A Changing Environment
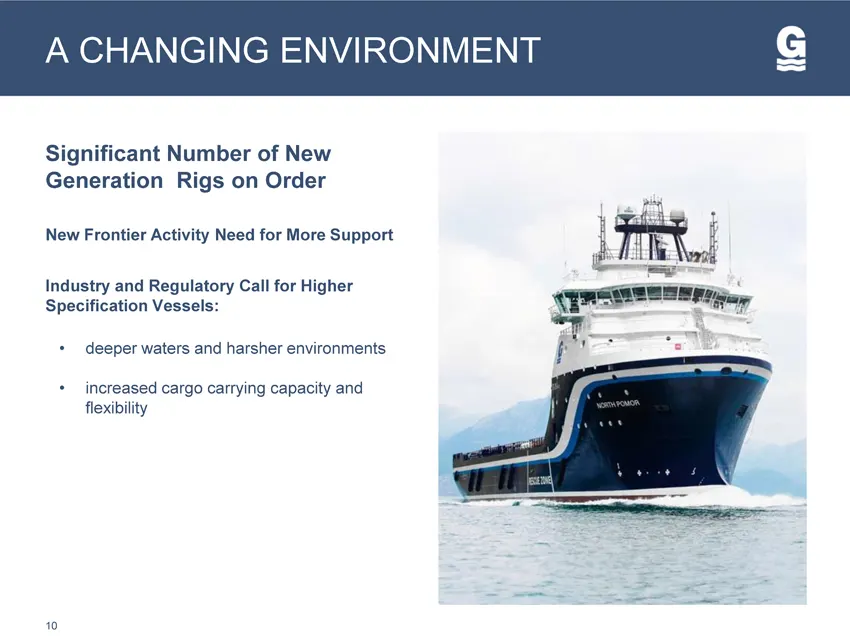
A CHANGING ENVIRONMENT Significant Number of New Generation Rigs on Order Specification Vessels: deeper waters and harsher environments increased cargo carrying capacity and flexibility
Slide 11: New Build Program Overview
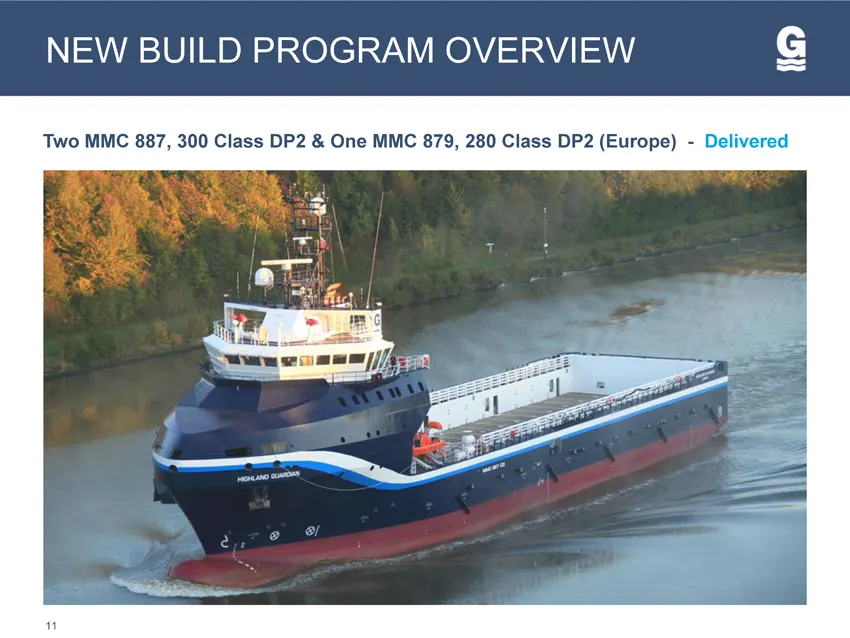
NEW BUILD PROGRAM OVERVIEW G Two MMC 887, 300 Class DP2 & One MMC 879, 280 Class DP2 (Europe) - ¥
Slide 12: New Build Program Overview
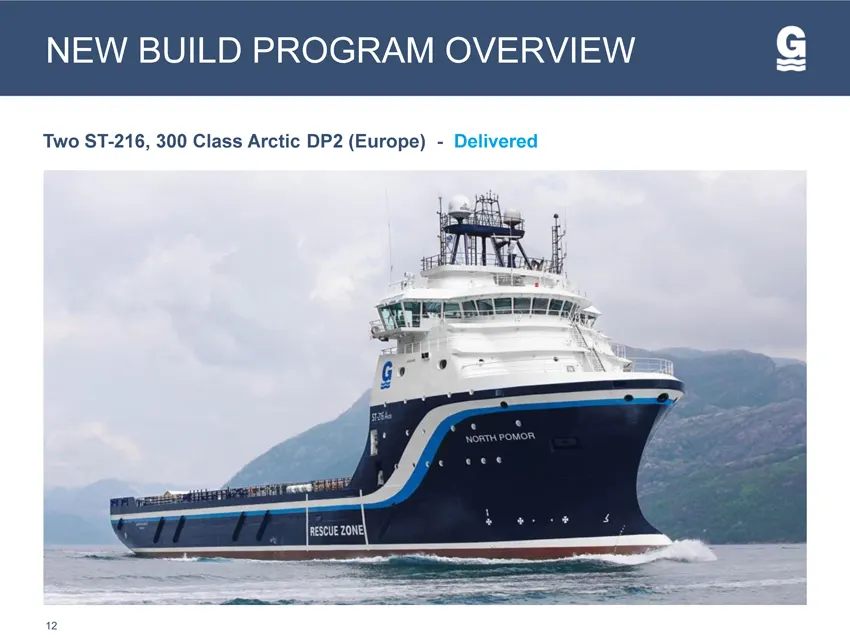
NEW BUILD PROGRAM OVERVIEW Two ST-216, 300 Class Arctic DP2 (Europe) -
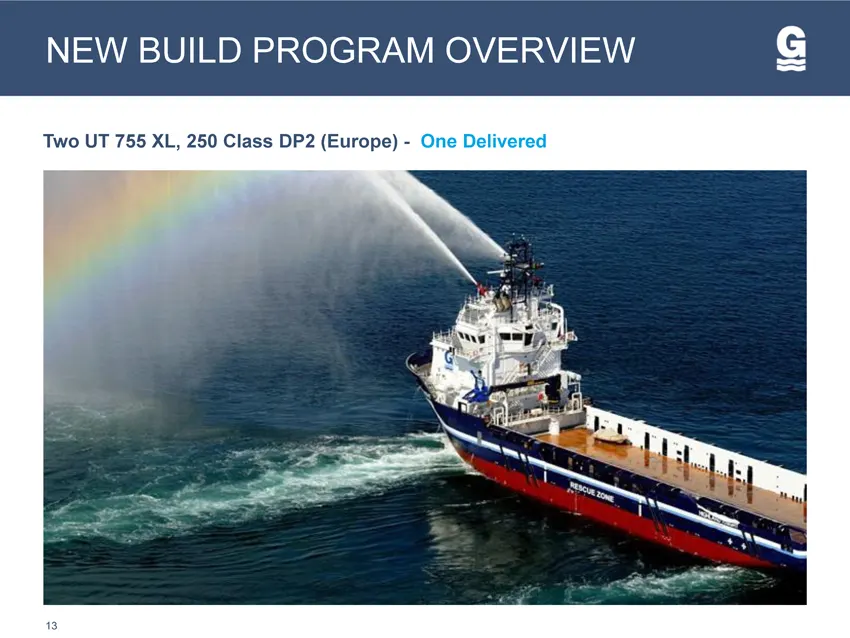
Slide 13: New Build Program Overview
NEW BUILD PROGRAM OVERVIEW G Two UT 755 XL, 250 Class DP2 (Europe) -
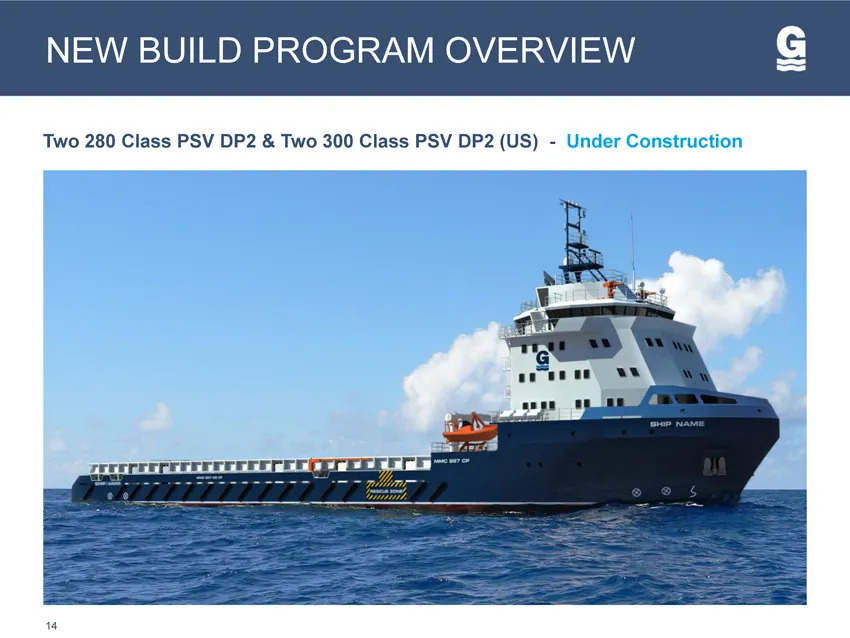
Slide 14: New Build Program Overview
NEW BUILD PROGRAM OVERVIEW G Two 280 Class PSV DP2 & Two 300 Class PSV DP2 (US) - Under Construction
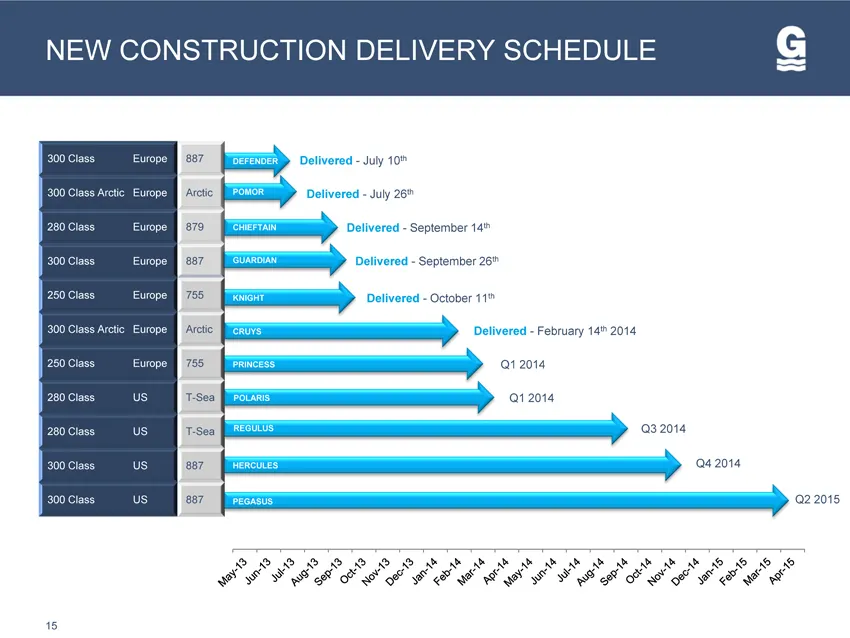
Slide 15: New Construction Delivery Schedule
NEW CONSTRUCTION DELIVERY SCHEDULE ==> = sy 108 Arbor > + uly 268 > = September 14% > = September 26% y October 11" > February 1482014 > orzo > o1201 as2014 a4 2014 022015 2 2 BPP eh ah ah Ob ae ah ah Ob PO 2 PEK SEPP LI ELLE I I GLEE IEEE
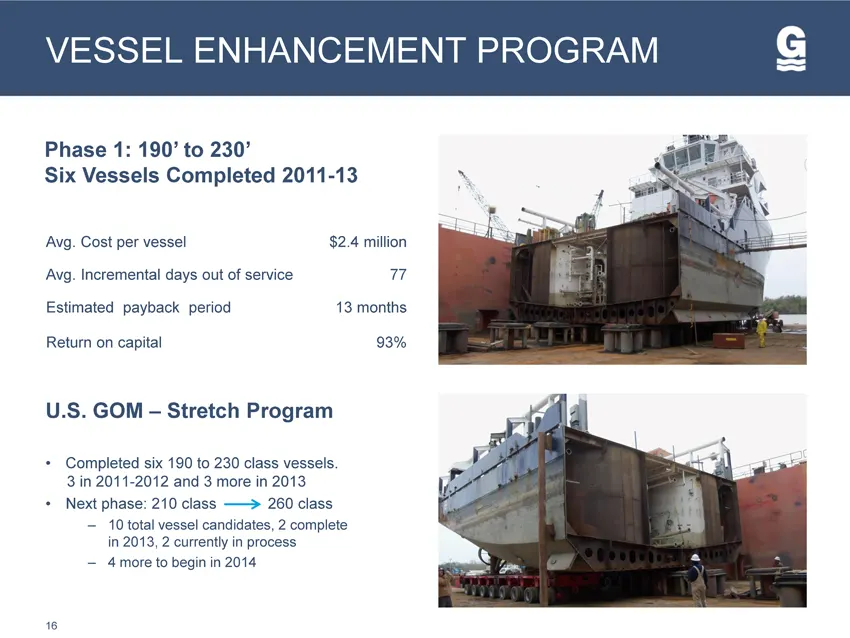
Slide 16: Phase 1: 190' to 230'
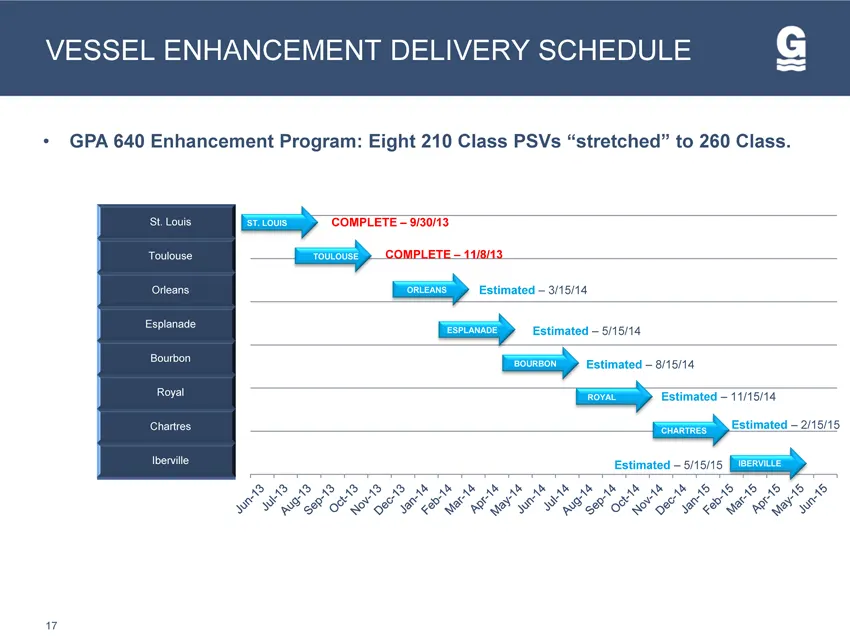
Phase 1: 190’ to 230’ Six Ve I: 13 Avg. Cost per vessel $2.4 million Avg. Incremental days out of service Estimated payback period 13 months Return on capital 93% U.S. GOM - Stretch Program Completed six 190 to 230 class vessels. 3 in 2011-2012 and 3 more in 2013 Next phase: 210 class 260 class = 10
Slide 17: Vessel Enhancement Delivery Schedule
VESSEL ENHANCEMENT DELIVERY SCHEDULE A] tretched” to 260 Class. ==» COMPLETE - 973013 COMPLETE — 11/8/13 ==> Estimated 316/14 => Estimated ~ 516/14 Estimated - 8/15/14 Estimated — 11/16/14 Estimated — 2/15/15 PO ge OP gO gh ge gh ah gh we Ue We A wo I IG 6 0 2 2 Ie SKF HH KEM Ce FY Mo VK KTH CHK
Slide 18: Demand Drivers
DEMAND DRIVERS
Slide 19: Rig Count Growth in the North Sea
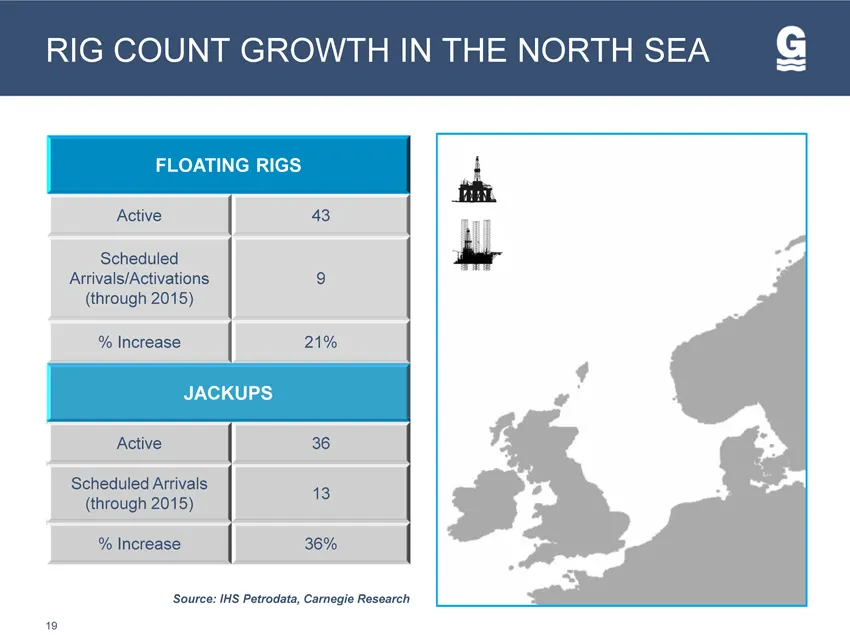
RIG COUNT GROWTH IN THE NORTH SEA G FLOATING RIGS t Active | 43 led Aralsevatons (through 9 2015) % Increase | 21% | JACKUPS Active 36 | Scheduled Arrivals o (through 2015) % Increase 36%
Slide 20: Floating Rig Count Growth in the U.S. GOM
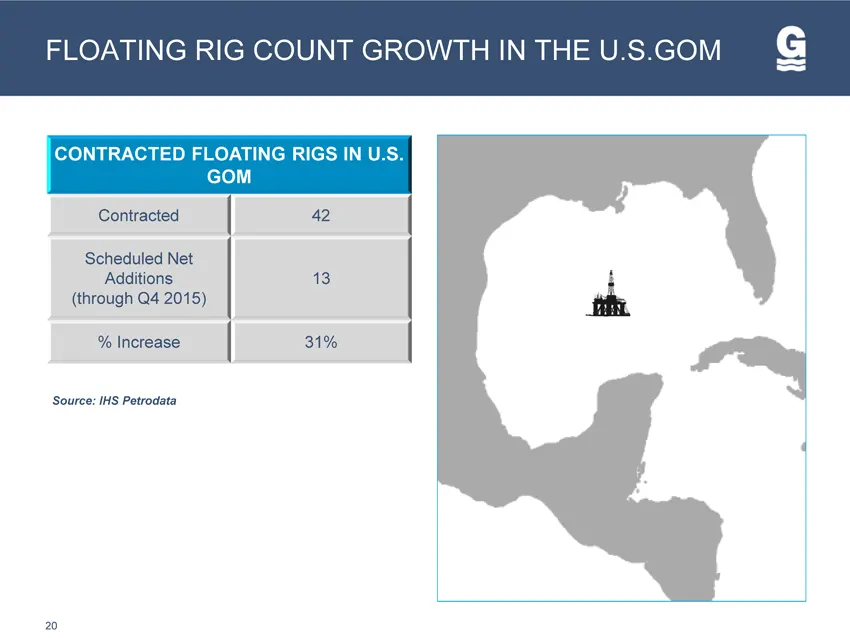
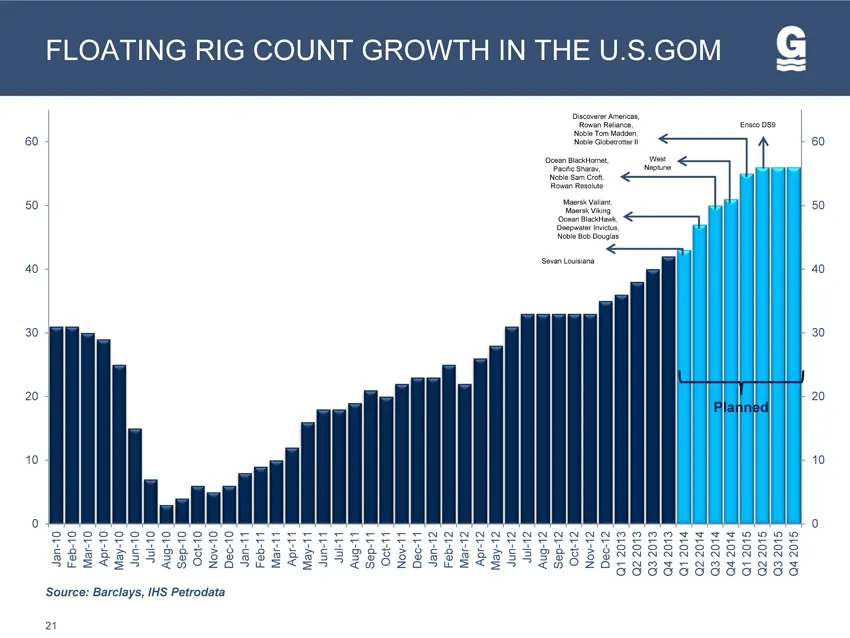
FLOATING RIG COUNT GROWTH IN THE U.S.GOM CONTRACTED FLOATING RIGS IN GOM | # | Contracted Scheduled Net ‘Additions 13 (through Q4 2015) tis. | 31% | % Increase Source: IHS Petrodata
Slide 21: Floating Rig Count Growth in the U.S. GOM
FLOATING RIG COUNT GROWTH IN THE U.S.GOM G 2888S PELE Source: Barclays, IHS Petrodata a
Slide 22: Projected Subsea Spending
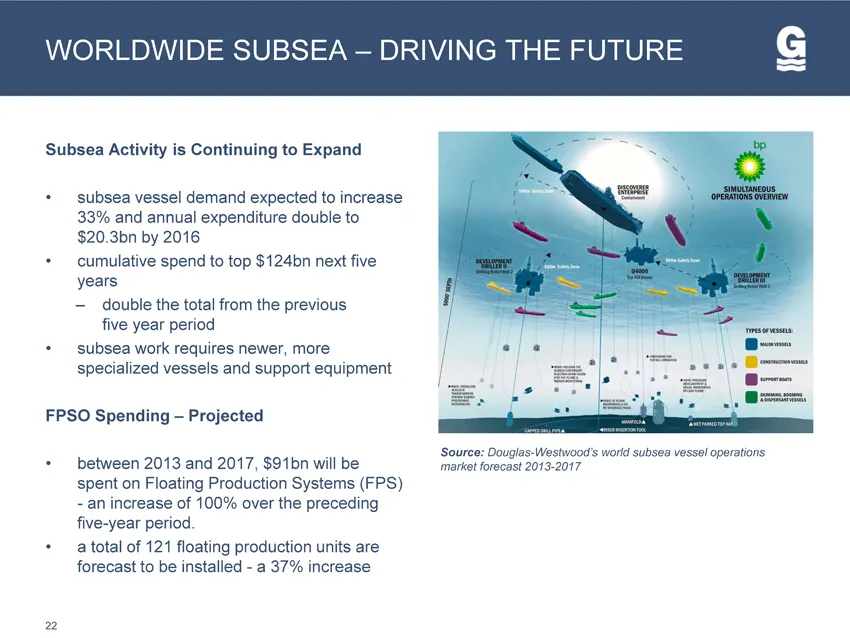
33% and annual expenditure double to $20.3bn by 2016 cumulative spend to top $124bn next five ears — double the total from the previous five year period subsea work requires newer, more PSO Spending — Projected between 2013 and 2017, $91bn will be - an increase of 100% over the preceding five-year p
Slide 23: Financial Information
FINANCIAL INFORMATION
Slide 24: Net Debt Position
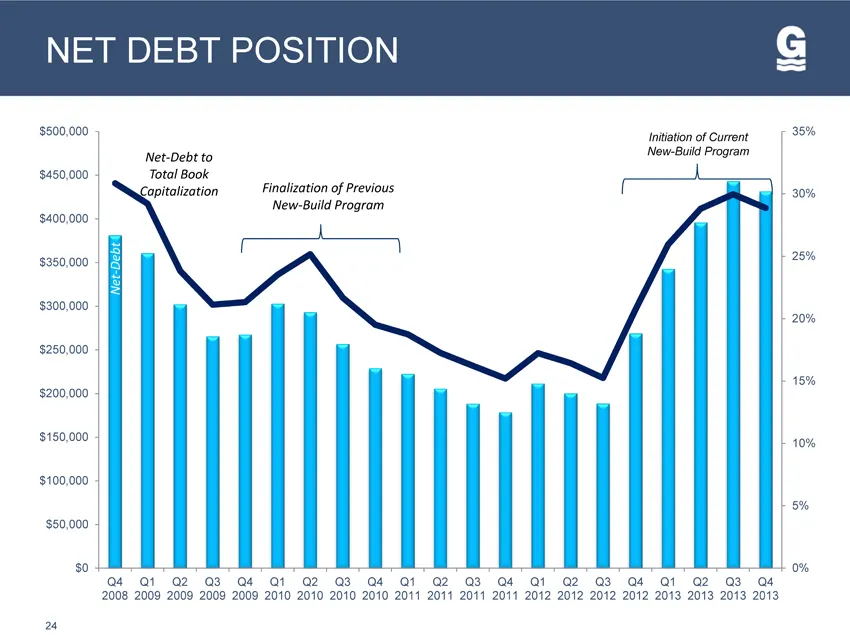
NET DEBT POSITION $500,000 $450,000 $400,000 $350,000 $300,000 $250,000 $200,000 $150,000 $100,000 $60,000 $0 Net-Debt to Total Book ‘apitalization Finalization of Previous ‘New-Build Program Q2 3 a4 ai a2 a3 a4 5 35% Initiation of Current New-Build Program + 30% } 25% + 20% 15% } 10% 0%
Slide 25: Investment Highlights
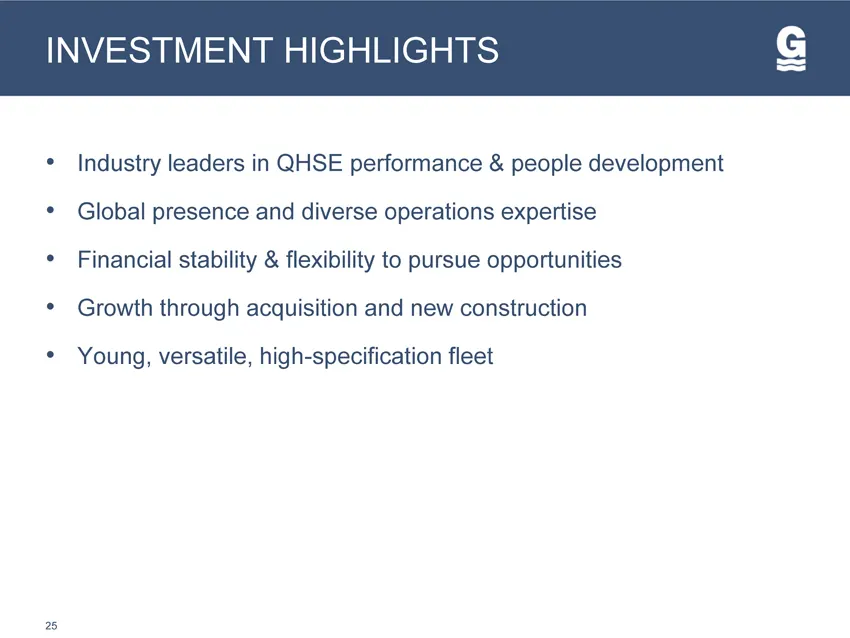
INVESTMENT HIGHLIGHTS * Industry leaders in QHSE perf & peopl * Global p d di perati pert * Financi ility & flexibility to p pportuniti . acquisition and new construction ¢ Young, versatile, high-specification fleet
Slide 26: Reconciliation of Adjusted EBITDA
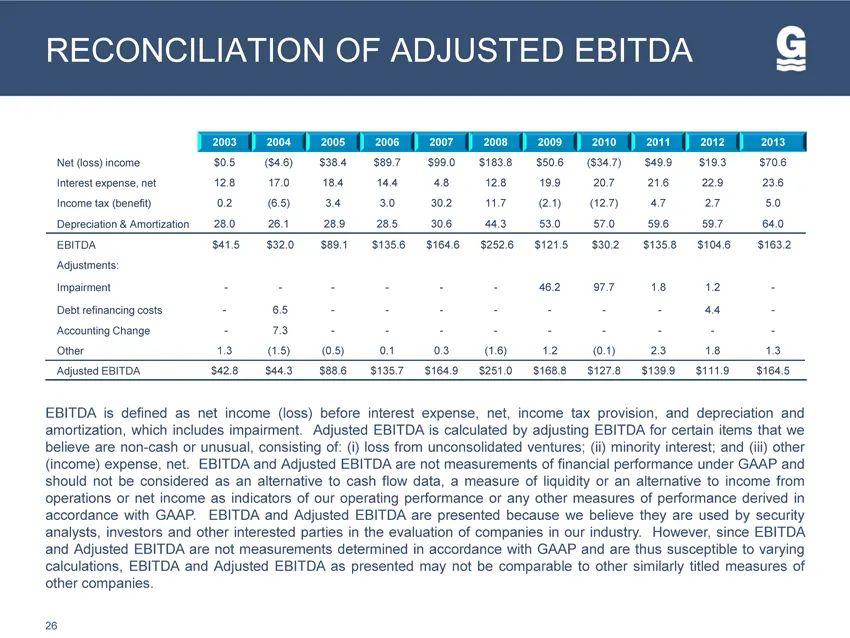
RECONCILIATION OF ADJUSTED EBITDA 2003} 2004 | 2005 } 2006 2008} 2009 010 1 | 2012 01 Net (loss) income $05 ($48) $384 $897 $98.0 $1838 $508, os 7) $498 $193 $708 Interest expenss 128 0 17018. 44 «48128 199 07 188 Income tax (benefit) 02 65) 34S. 32 117 a) (a7) 47 aT 50 Depreciation & Amortization 2
Slide 27: Leaders in Global Offshore Marine Services
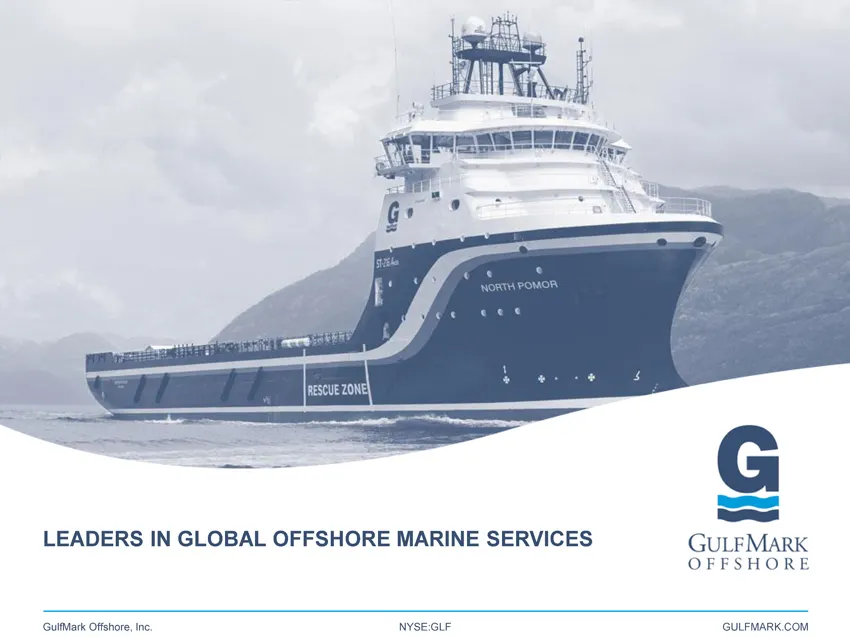
LEADERS IN GLOBAL OFFSHORE MARINE SERVICES GULEMARK FS RE GulfMark Offshore, Inc. NYSE:GLF GULFMARK.COM
Slide 28: Leaders in Global Offshore Marine Services
Gi GULEMARK OFFSHORE LEADERS IN GLOBAL OFFSHORE MARINE SERVICES GULFMARK.COM
Source: SEC EDGAR · 8-K filed Mar 11, 2014
More decks from Gulfmark Offshore Inc
 Merger or Acquisition (July 2018)11 slides · Jul 16, 2018
 Merger or Acquisition (July 2018)15 slides · Jul 16, 2018
 Investor Presentation (March 2018)22 slides · Mar 6, 2018
 Debt Investor Presentation (October 2017)16 slides · Oct 2, 2017
 Debt Investor Presentation (May 2017)41 slides · May 18, 2017
 Debt Investor Presentation (November 2016)28 slides · Nov 28, 2016