Kimball International — CJS Securities Investor Conference (July 2018)
15 slides from Kimball International's conference presentation, Jul 6, 2018
Slide 1: Investor Presentation - CJS Securities Investor Conference
Exhibit 99.1 Investor Presentation CJS Securities Investor Conference
Slide 2: Safe Harbor Statement
Safe Harbor Statement Certain statements contained within this release are considered forward-looking under the Private Securities Litigation Reform Act of 1995 and are subject to risks and uncertainties including, but not limited to, the risk that any projections or guidance, including revenues, ma
Slide 3: Who We Are
Who We Are Kimball International, Inc. creates design driven, innovative furnishings sold through our family of brands: Kimball, National, and Kimball Hospitality. Our diverse portfolio offers solutions for the workplace, learning, healing, and hospitality environments. Dedicated to our Guiding Prin
Slide 4: Why Invest in Us
Why Invest in Us • Size and Focus Enabling Response to Changing Market • Design Driven New Products Fueling Growth • Strong Return on Capital Relative to Competitors • Capital Available for Accelerated Growth 3
Slide 5: Office Furniture New Products
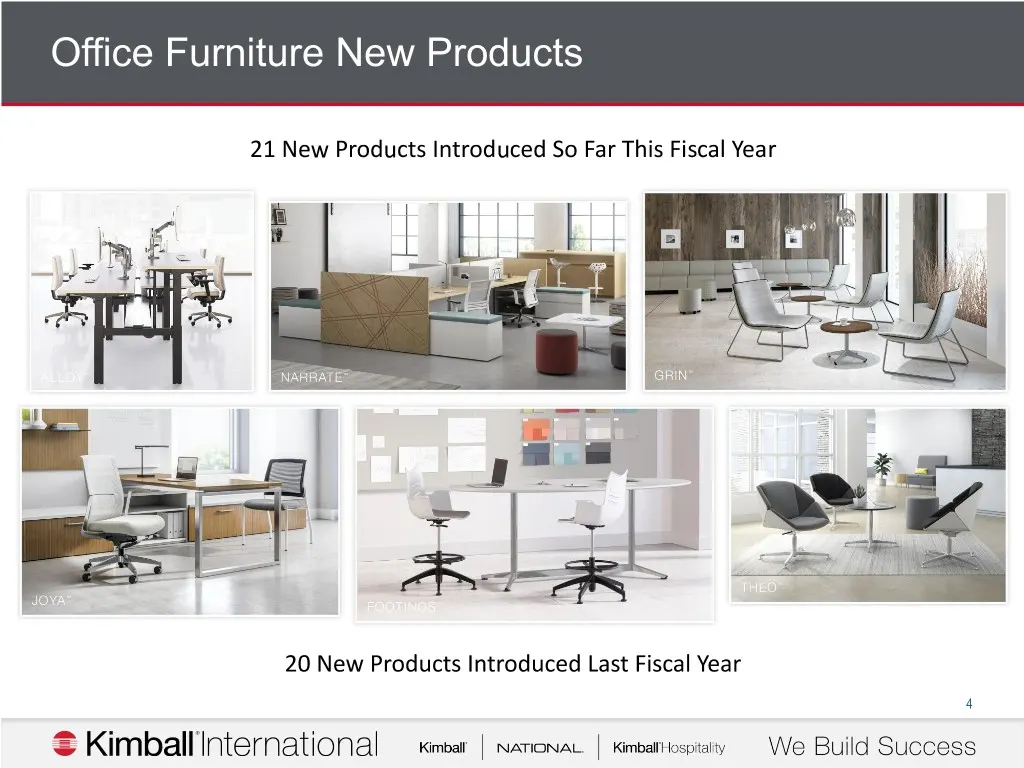
Office Furniture New Products 21 New Products Introduced So Far This Fiscal Year 20 New Products Introduced Last Fiscal Year 4
Slide 6: Sales Diversification
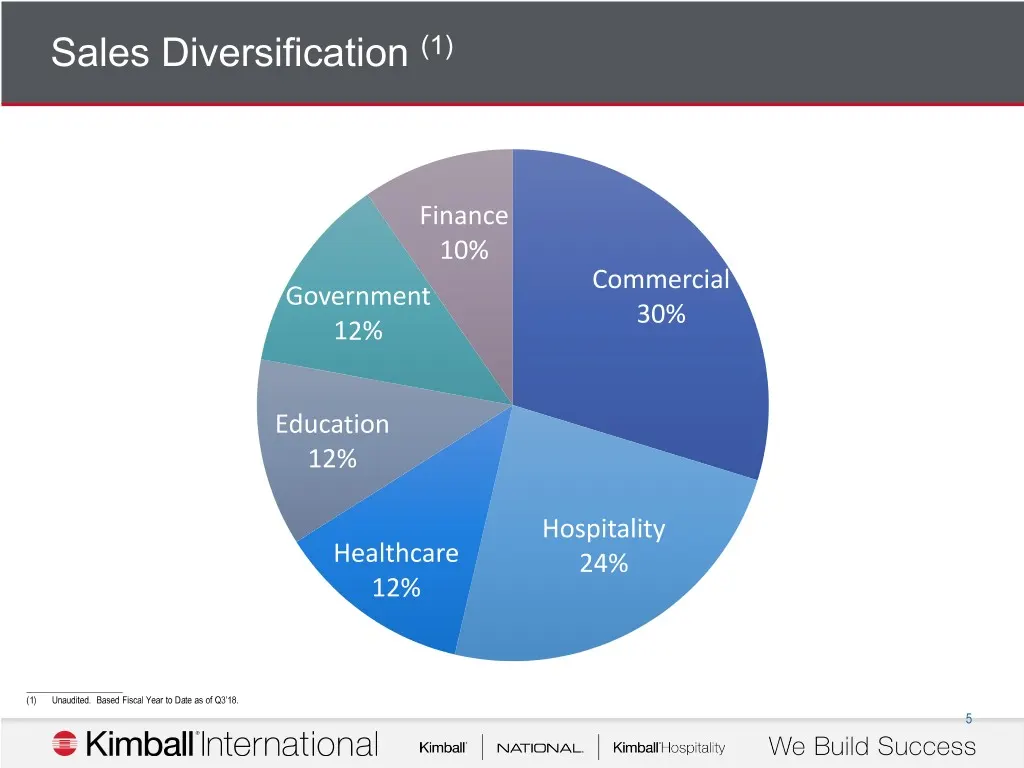
Sales Diversification (1) Finance 10% Commercial Government 30% 12% Education 12% Hospitality Healthcare 24% 12% _____________________ (1) Unaudited. Based Fiscal Year to Date as of Q3’18. 5
Slide 7: Financial Performance
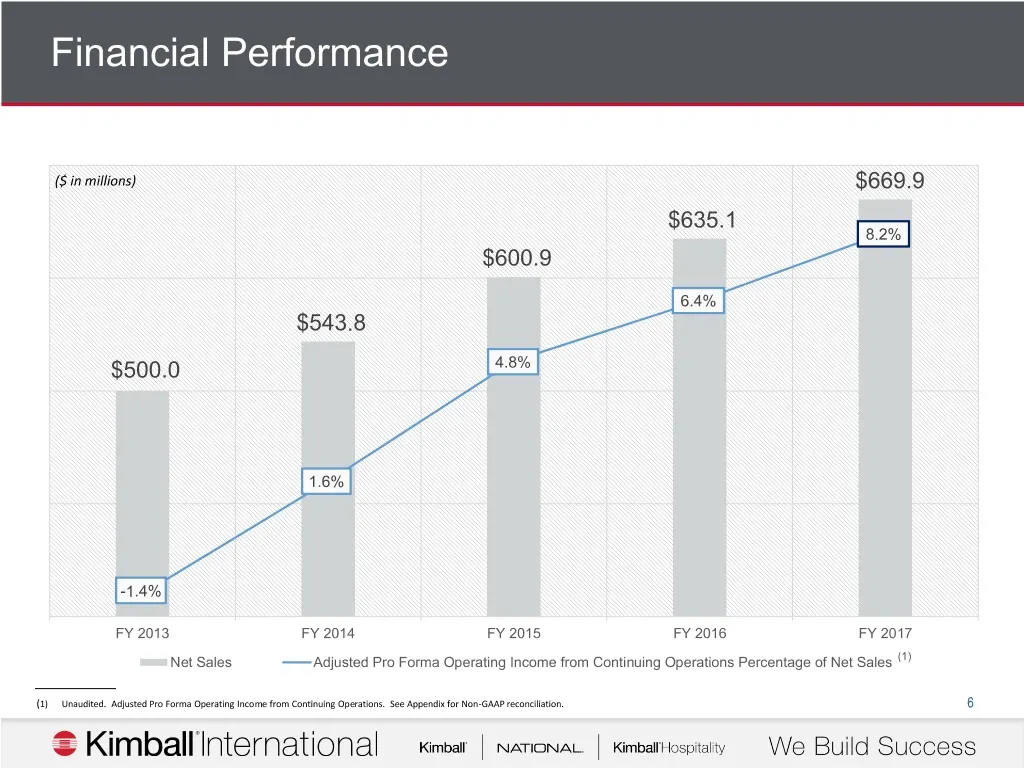
Financial Performance ($ in millions) $669.9 $635.1 8.2% $600.9 6.4% $543.8 $500.0 4.8% 1.6% -1.4% FY 2013 FY 2014 FY 2015 FY 2016 FY 2017 Net Sales Adjusted Pro Forma Operating Income from Continuing Operations Percentage of Net Sales (1) (1) Unaudited. Adjusted Pro Forma Operating Income from Cont
Slide 8: Order Trend Relative to Office Furniture Market
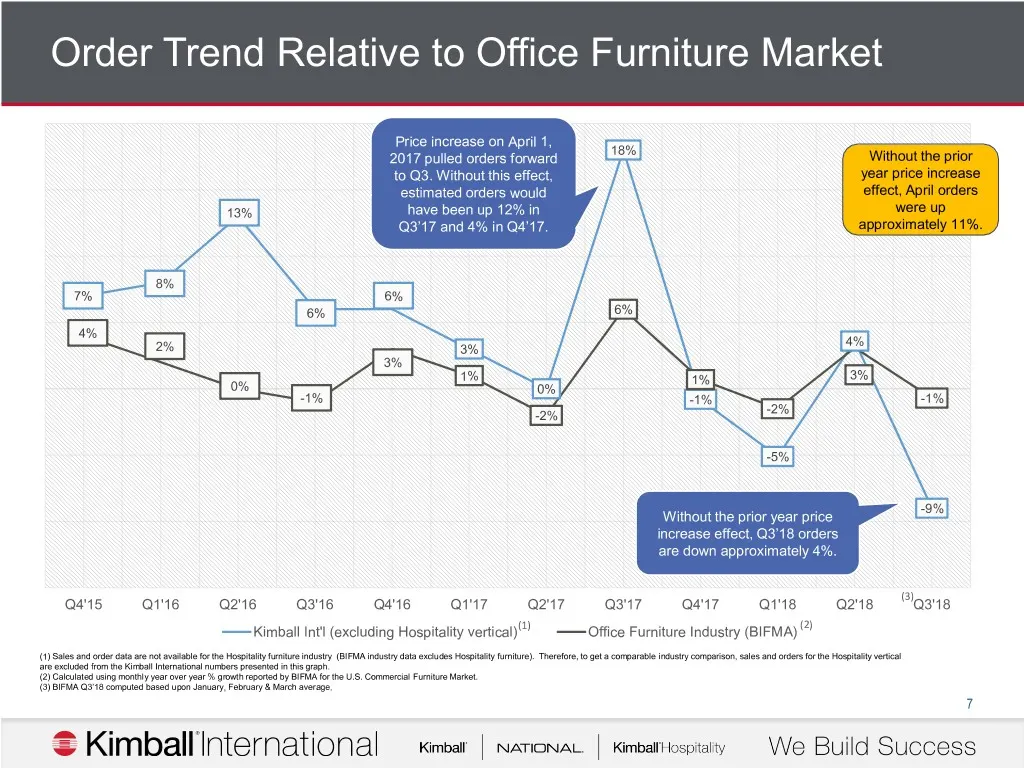
Order Trend Relative to Office Furniture Market Price increase on April 1, 18% 2017 pulled orders forward Without the prior to Q3. Without this effect, year price increase estimated orders would effect, April orders 13% have been up 12% in were up Q3’17 and 4% in Q4’17. approximately 11%. 8% 7% 6% 6
Slide 9: Operating Income
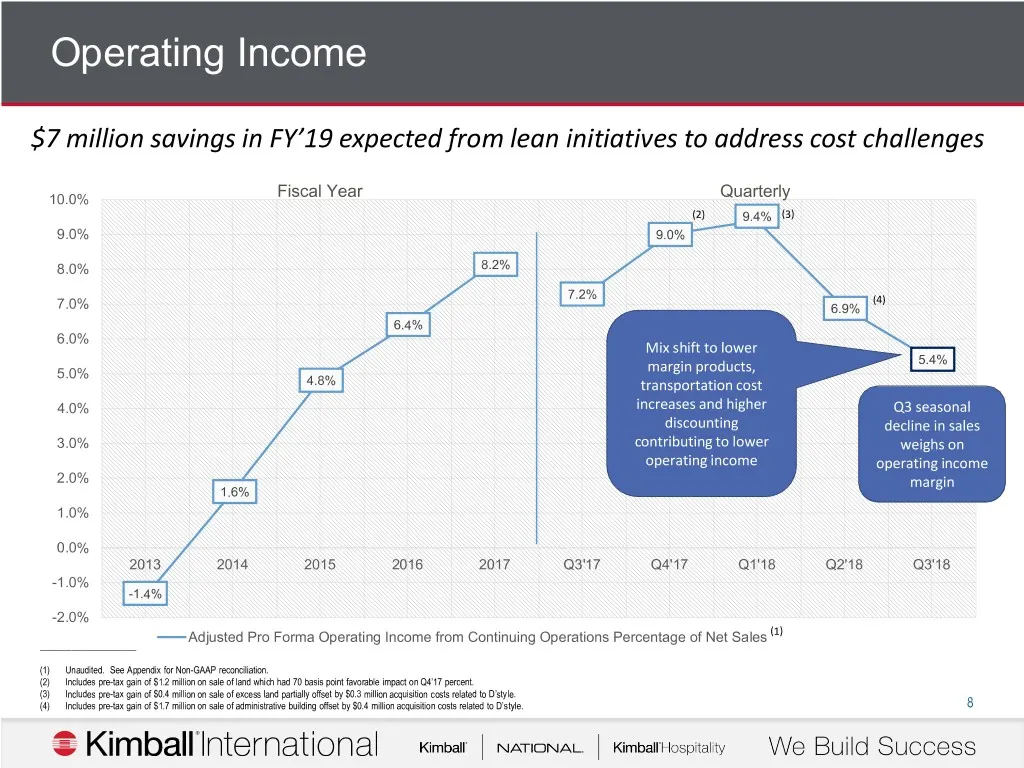
Operating Income $7 million savings in FY’19 expected from lean initiatives to address cost challenges 10.0% Fiscal Year Quarterly (2) 9.4% (3) 9.0% 9.0% 8.0% 8.2% 7.2% (4) 7.0% 6.9% 6.4% 6.0% Mix shift to lower 5.4% 5.0% margin products, 4.8% transportation cost 4.0% increases and higher Q3 seasona
Slide 10: Adjusted Return on Capital
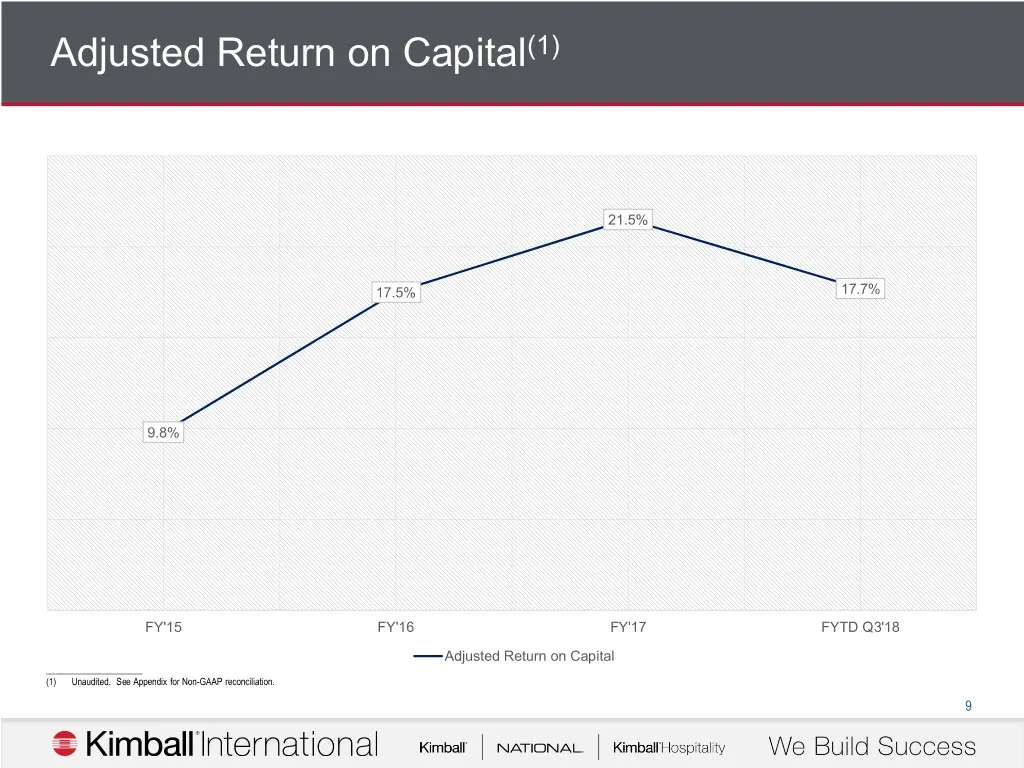
Adjusted Return on Capital(1) 21.5% 17.5% 17.7% 9.8% FY'15 FY'16 FY'17 FYTD Q3'18 Adjusted Return on Capital _____________________ (1) Unaudited. See Appendix for Non-GAAP reconciliation. 9
Slide 11: Capital Available for Growth
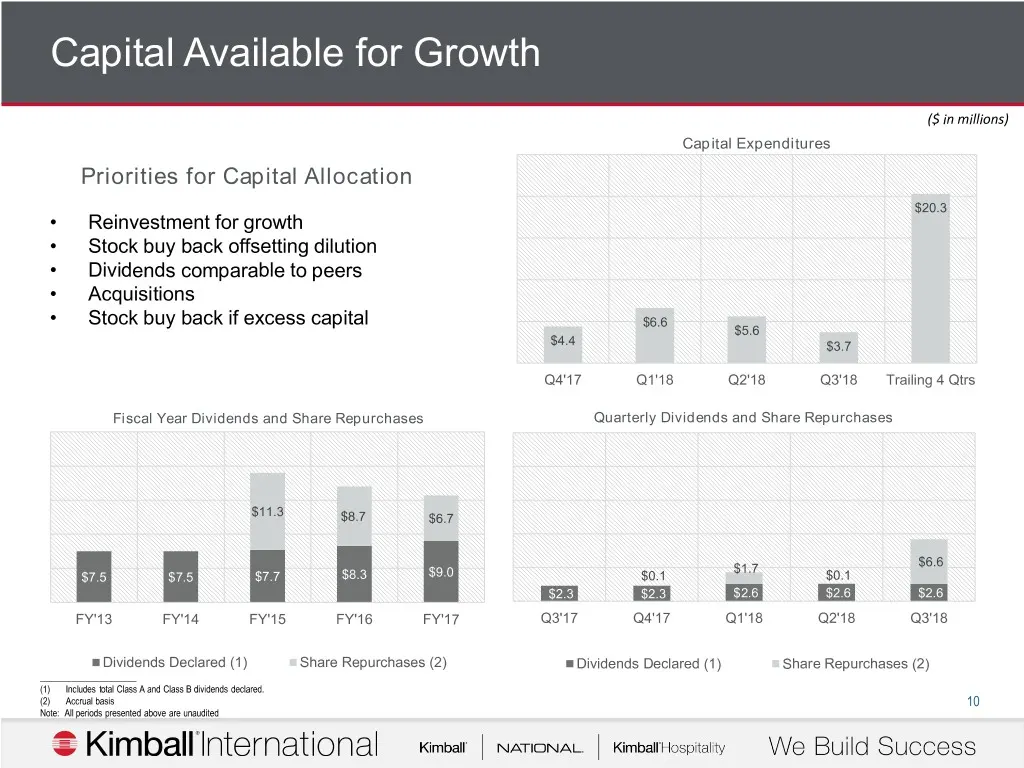
Capital Available for Growth ($ in millions) Capital Expenditures Priorities for Capital Allocation $20.3 • Reinvestment for growth • Stock buy back offsetting dilution • Dividends comparable to peers • Acquisitions • Stock buy back if excess capital $6.6 $5.6 $4.4 $3.7 Q4'17 Q1'18 Q2'18 Q3'18 Trail
Slide 12: Free Cash Flow
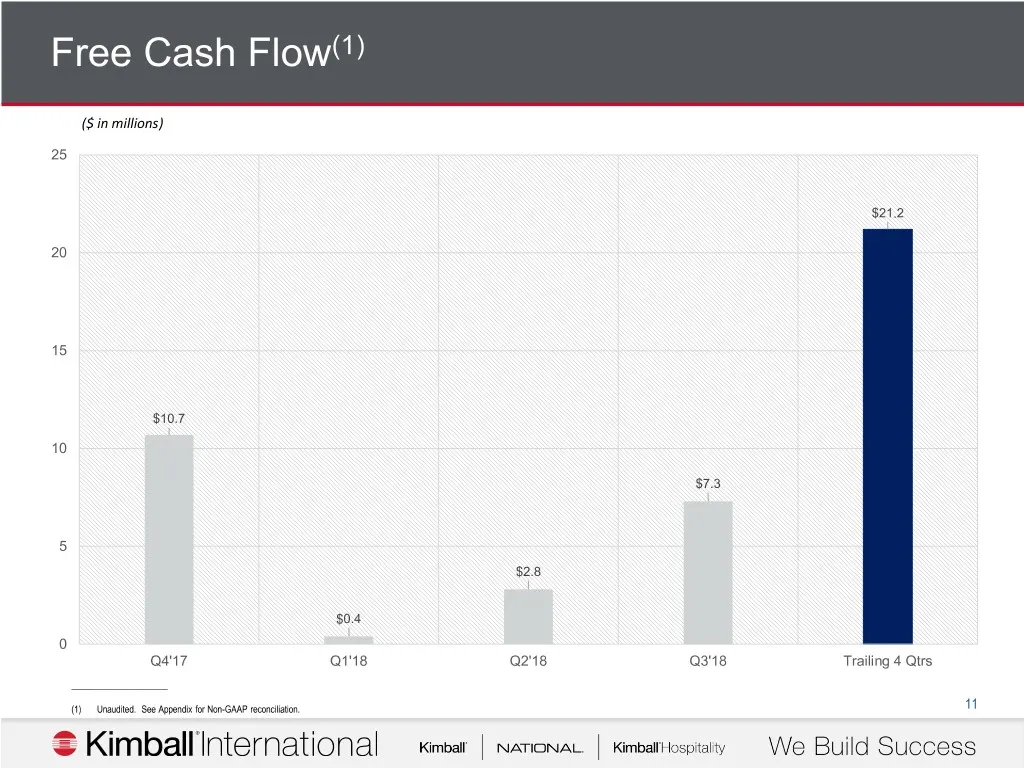
Free Cash Flow(1) ($ in millions) 25 $21.2 20 15 $10.7 10 $7.3 5 $2.8 $0.4 0 Q4'17 Q1'18 Q2'18 Q3'18 Trailing 4 Qtrs _____________________ (1) Unaudited. See Appendix for Non-GAAP reconciliation. 11
Slide 13: Appendix
Appendix S Kimball International — kimbar | wanonat. | kimbatiiospiaiy — We Build Success
Slide 14: Non-GAAP Reconciliation (Unaudited)
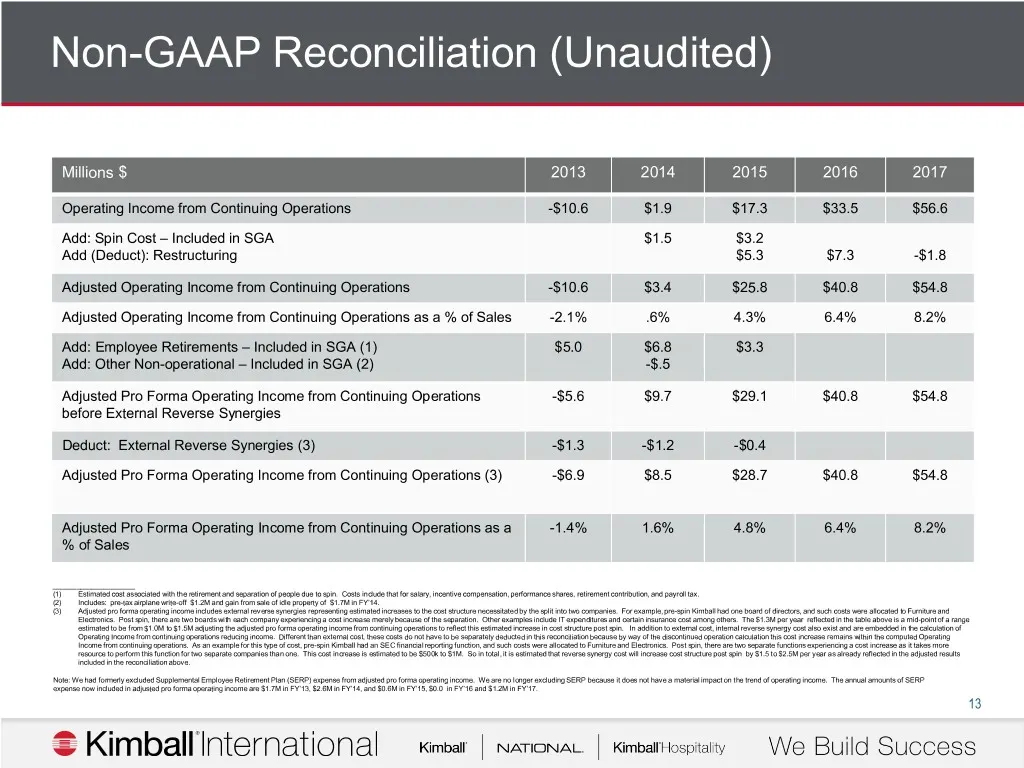
Non-GAAP Reconciliation (Unaudited) Millions $ 2013 2014 2015 2016 2017 Operating Income from Continuing Operations -$10.6 $1.9 $17.3 $33.5 $56.6 Add: Spin Cost – Included in SGA $1.5 $3.2 Add (Deduct): Restructuring $5.3 $7.3 -$1.8 Adjusted Operating Income from Continuing Operations -$10.6 $3.4 $2
Slide 15: Non-GAAP Reconciliation (Unaudited)
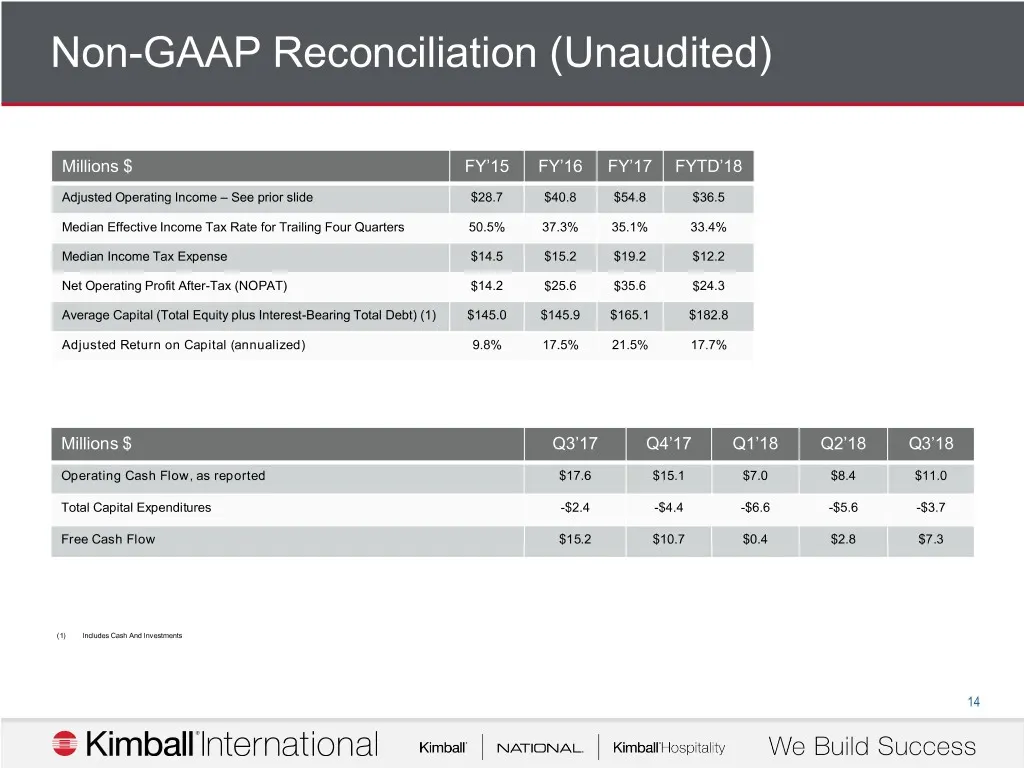
Non-GAAP Reconciliation (Unaudited) Millions $ FY’15 FY’16 FY’17 FYTD’18 Adjusted Operating Income – See prior slide $28.7 $40.8 $54.8 $36.5 Median Effective Income Tax Rate for Trailing Four Quarters 50.5% 37.3% 35.1% 33.4% Median Income Tax Expense $14.5 $15.2 $19.2 $12.2 Net Operating Profit Afte
Source: SEC EDGAR · 8-K filed Jul 6, 2018
More decks from Kimball International Inc
 Merger or Acquisition (May 2023)30 slides · May 23, 2023
 Merger or Acquisition (March 2023)15 slides · Mar 8, 2023
 Q2 FY2023 Earnings Presentation16 slides · Feb 2, 2023
 Q1 FY2023 Earnings Presentation17 slides · Nov 3, 2022
 Q4 FY2022 Earnings Presentation18 slides · Aug 4, 2022
 Q3 FY2022 Earnings Presentation17 slides · May 3, 2022