Endurance Specialty Holdings Ltd
Endurance Specialty — Investor Presentation (November 2011)
24 slides from Endurance Specialty's investor presentation, Nov 17, 2011

Slide 1: Endurance Specialty Holdings Investor Presentation
Endurance Specialty Holdings Investor Presentation
Slide 2: Forward looking statements & Regulation G disclaimer
Forward looking statements & regulation G disclaimer Safe Harbor for Forward Looking Statements Some of the statements in this presentation include forward-looking statements which reflect our current views with respect to future events and financial performance. Such statements include forward-look
Slide 3: Introduction to Endurance Specialty Holdings
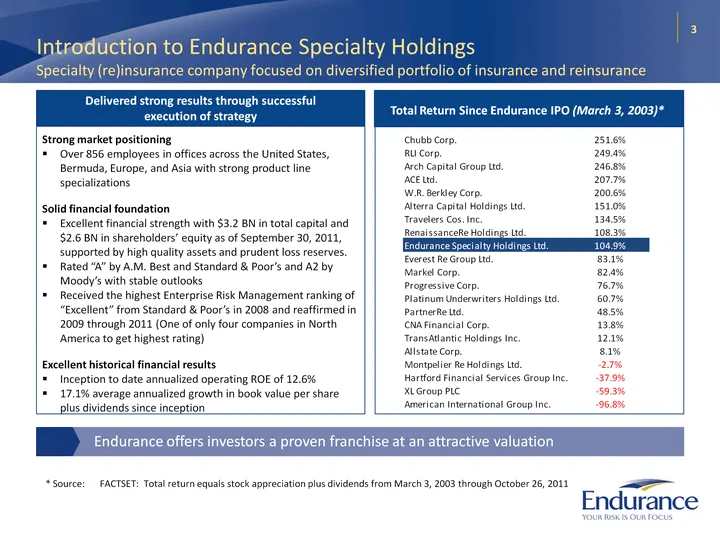
3 Introduction to Endurance Specialty Holdings Specialty (re)insurance company focused on diversified portfolio of insurance and reinsurance Strong market positioning Over 856 employees in offices across the United States, Bermuda, Europe, and Asia with strong product line specializations Solid fina
Slide 4: Specialty Focused, Diversified Portfolio of Businesses
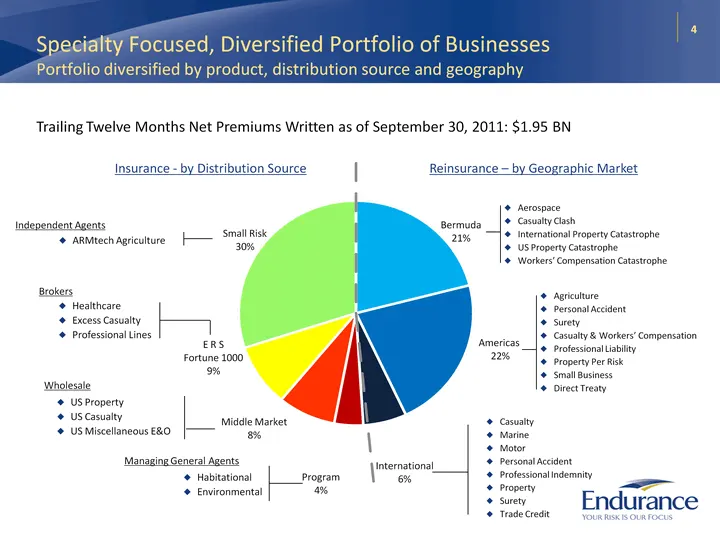
4 Specialty Focused, Diversified Portfolio of Businesses Portfolio diversified by product, distribution source and geography Trailing Twelve Months Net Premiums Written as of September 30, 2011: $1.95 BN Reinsurance - by Geographic Market Insurance - by Distribution Source Agriculture Personal Accid
Slide 5: Specialty Focused, Diversified Portfolio of Businesses
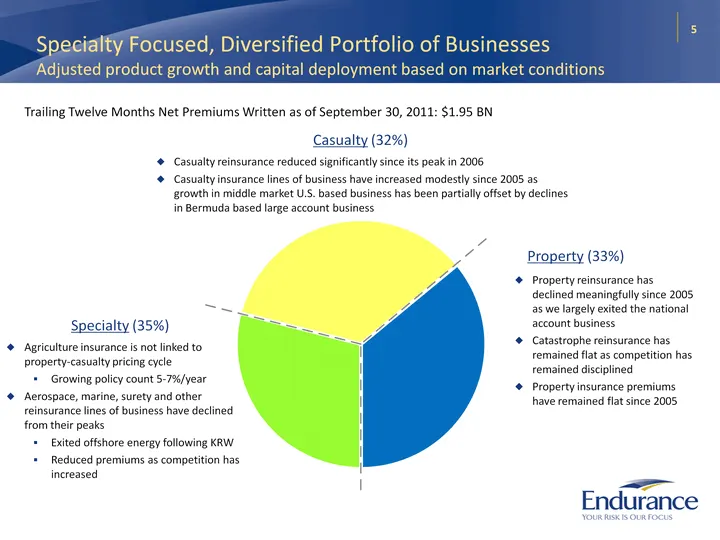
5 Specialty Focused, Diversified Portfolio of Businesses Adjusted product growth and capital deployment based on market conditions Trailing Twelve Months Net Premiums Written as of September 30, 2011: $1.95 BN Property (33%) Casualty (32%) Property reinsurance has declined meaningfully since 2005 as
Slide 6: Disciplined Reinsurance Portfolio Management
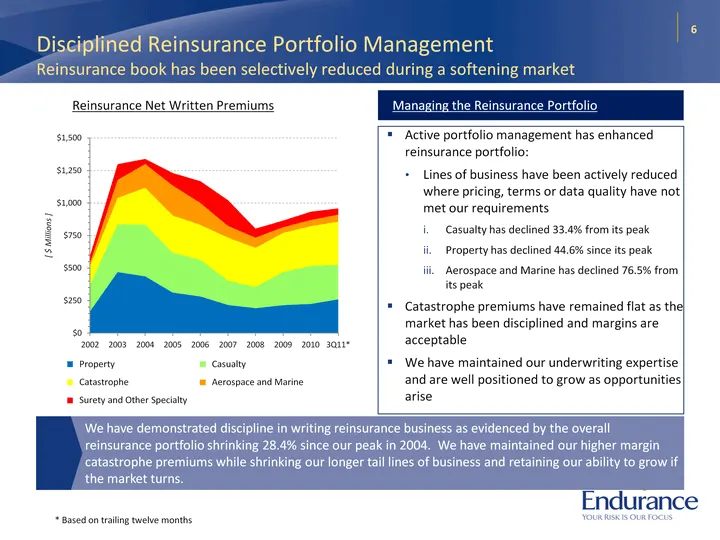
Disciplined Reinsurance Portfolio Management Reinsurance book has been selectively reduced during a softening market Reinsurance Net Written Premiums Reinsurance Net Written Premiums Managing the Reinsurance Portfolio 6 We have demonstrated discipline in writing reinsurance business as evidenced by
Slide 7: Diversified Insurance Portfolio
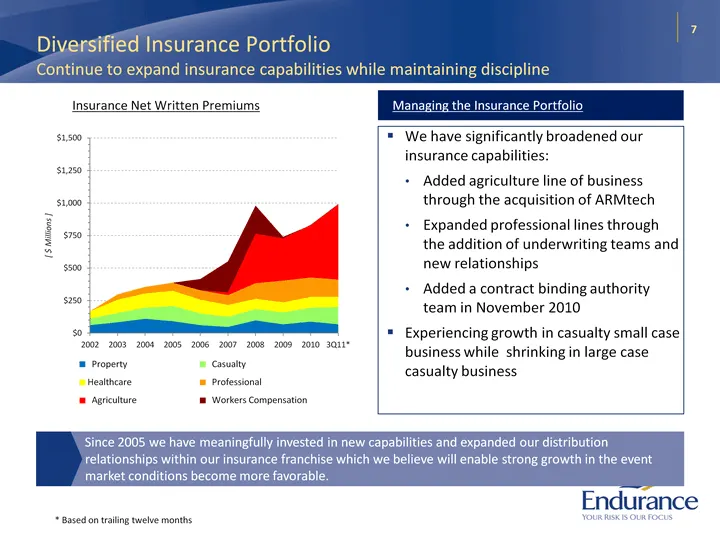
Diversified Insurance Portfolio Continue to expand insurance capabilities while maintaining discipline Insurance Net Written Premiums Insurance Net Written Premiums Managing the Insurance Portfolio 7 Since 2005 we have meaningfully invested in new capabilities and expanded our distribution relations
Slide 8: Endurance is World Class at Risk Management
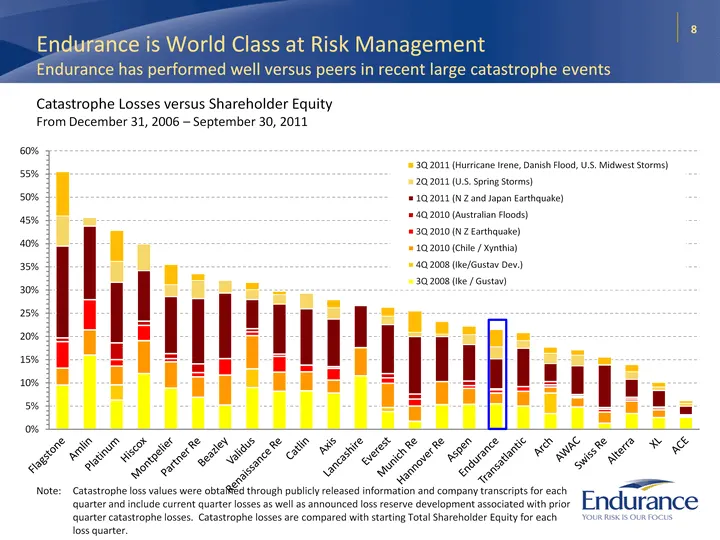
Endurance is World Class at Risk Management Endurance has performed well versus peers in recent large catastrophe events 8 Catastrophe Losses versus Shareholder Equity From December 31, 2006 - September 30, 2011 (CHART) Note: Catastrophe loss values were obtained through publicly released informatio
Slide 9: Endurance's Financial Results
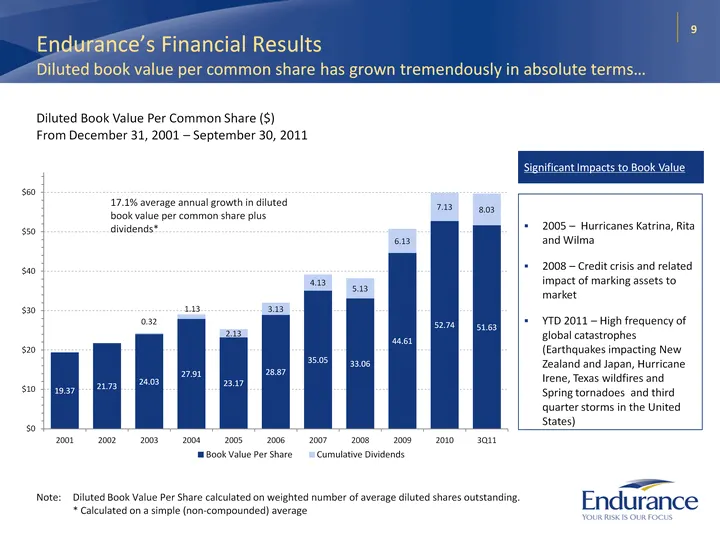
(CHART) 9 Endurance's Financial Results Diluted book value per common share has grown tremendously in absolute terms... Diluted Book Value Per Common Share ($) From December 31, 2001 - September 30, 2011 Note: Diluted Book Value Per Share calculated on weighted number of average diluted shares outst
Slide 10: Endurance's Financial Results versus peers
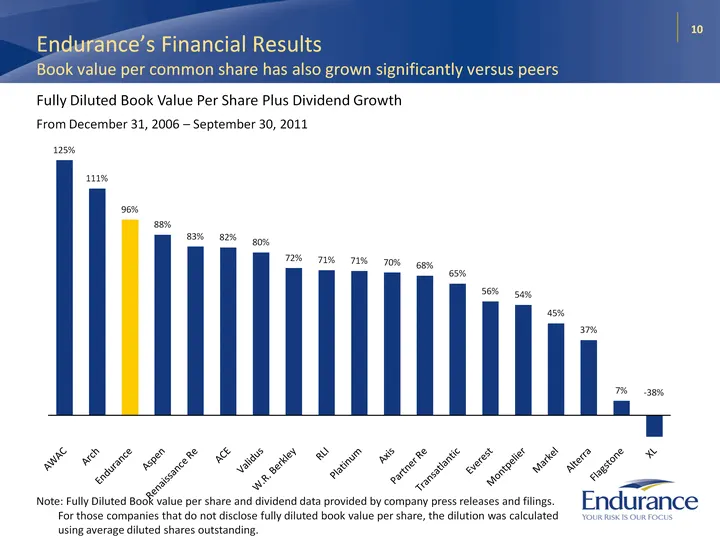
Endurance's Financial Results Book value per common share has also grown significantly versus peers 10 Fully Diluted Book Value Per Share Plus Dividend Growth From December 31, 2006 - September 30, 2011 (CHART) Note: Fully Diluted Book value per share and dividend data provided by company press rele
Slide 11: Growing Capital Base while returning Capital to Investors
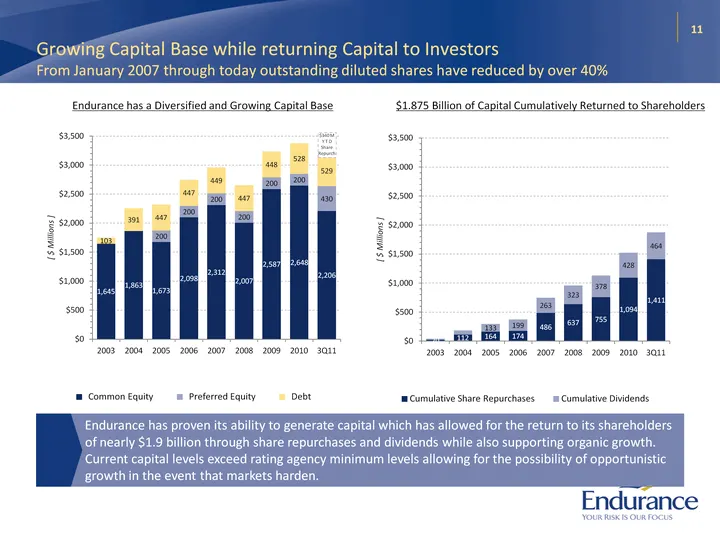
Growing Capital Base while returning Capital to Investors From January 2007 through today outstanding diluted shares have reduced by over 40% Endurance has a Diversified and Growing Capital Base Endurance has a Diversified and Growing Capital Base $1.875 Billion of Capital Cumulatively Returned to S
Slide 12: Strong Balance Sheet
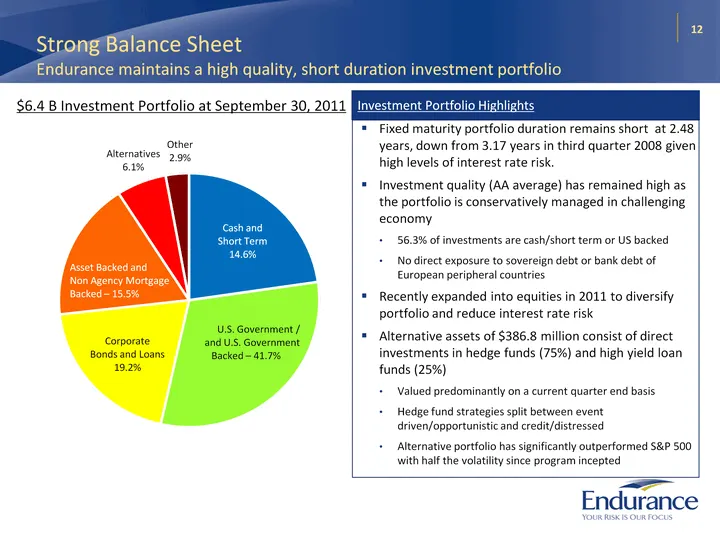
Strong Balance Sheet Endurance maintains a high quality, short duration investment portfolio $6.4 B Investment Portfolio at September 30, 2011 Investment Portfolio Highlights Fixed maturity portfolio duration remains short at 2.48 years, down from 3.17 years in third quarter 2008 given high levels o
Slide 13: Conclusion
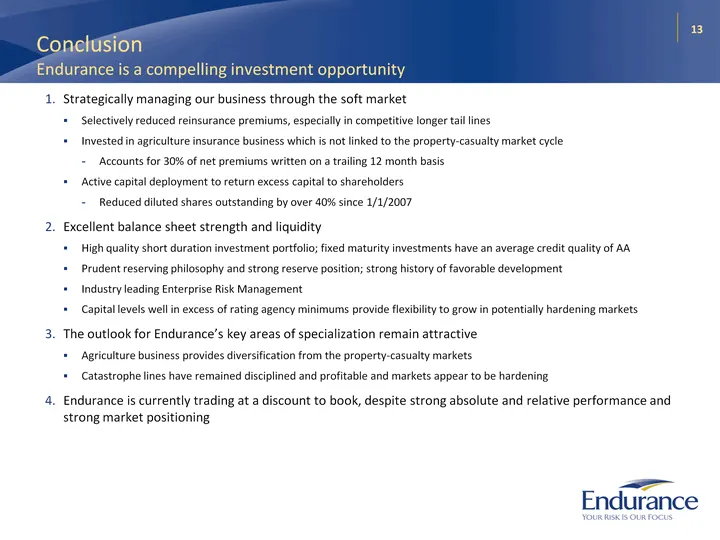
Conclusion Endurance is a compelling investment opportunity Strategically managing our business through the soft market Selectively reduced reinsurance premiums, especially in competitive longer tail lines Invested in agriculture insurance business which is not linked to the property-casualty market

Slide 14: Appendix
Appendix —_ Endurance
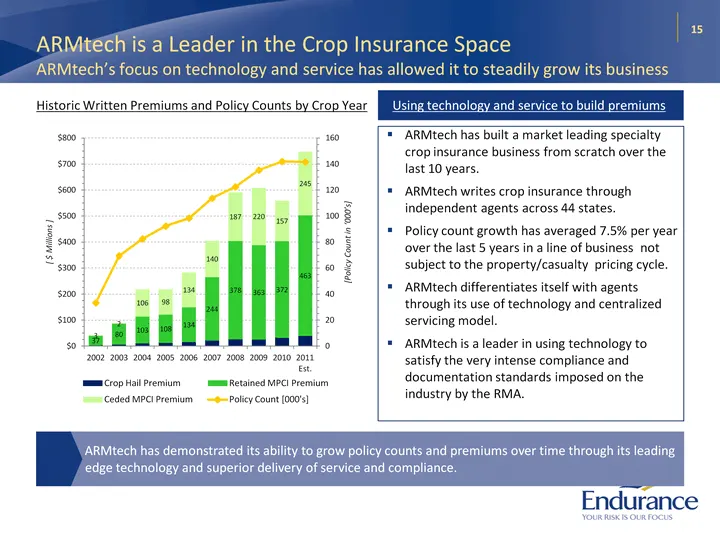
Slide 15: ARMtech is a Leader in the Crop Insurance Space
ARMtech is a Leader in the Crop Insurance Space ARMtech's focus on technology and service has allowed it to steadily grow its business Historic Written Premiums and Policy Counts by Crop Year Historic Written Premiums and Policy Counts by Crop Year Using technology and service to build premiums 15 A
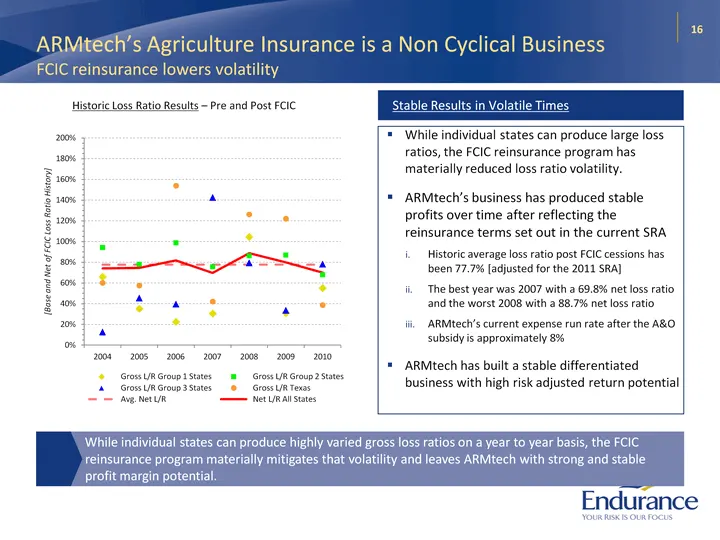
Slide 16: ARMtech's Agriculture Insurance is a Non Cyclical Business
ARMtech's Agriculture Insurance is a Non Cyclical Business FCIC reinsurance lowers volatility Historic Loss Ratio Results - Pre and Post FCIC Historic Loss Ratio Results - Pre and Post FCIC Stable Results in Volatile Times 16 While individual states can produce highly varied gross loss ratios on a y
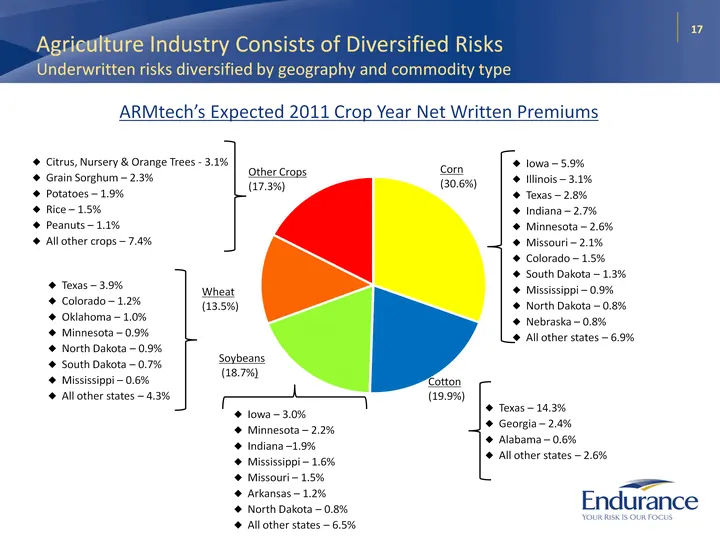
Slide 17: Agriculture Industry Consists of Diversified Risks
17 Agriculture Industry Consists of Diversified Risks Underwritten risks diversified by geography and commodity type ARMtech's Expected 2011 Crop Year Net Written Premiums Iowa - 5.9% Illinois - 3.1% Texas - 2.8% Indiana - 2.7% Minnesota - 2.6% Missouri - 2.1% Colorado - 1.5% South Dakota - 1.3% Mis
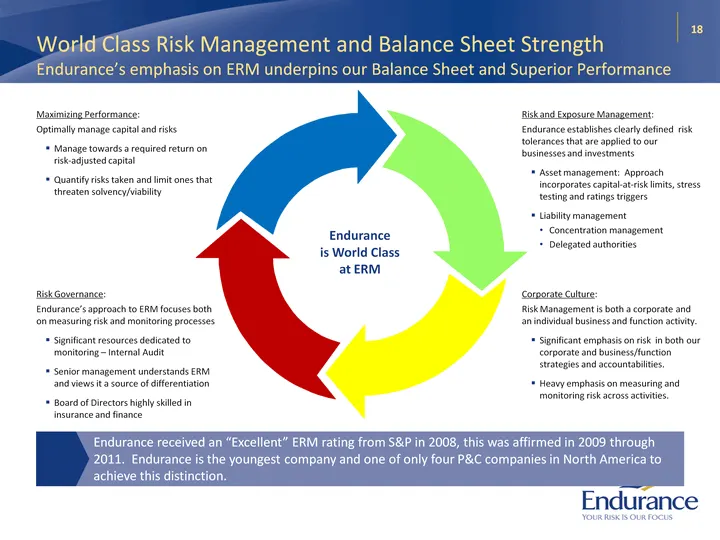
Slide 18: World Class Risk Management and Balance Sheet Strength
18 World Class Risk Management and Balance Sheet Strength Endurance's emphasis on ERM underpins our Balance Sheet and Superior Performance Endurance is World Class at ERM Risk and Exposure Management: Endurance establishes clearly defined risk tolerances that are applied to our businesses and invest
Slide 19: Probable Maximum Loss by Zone and Peril
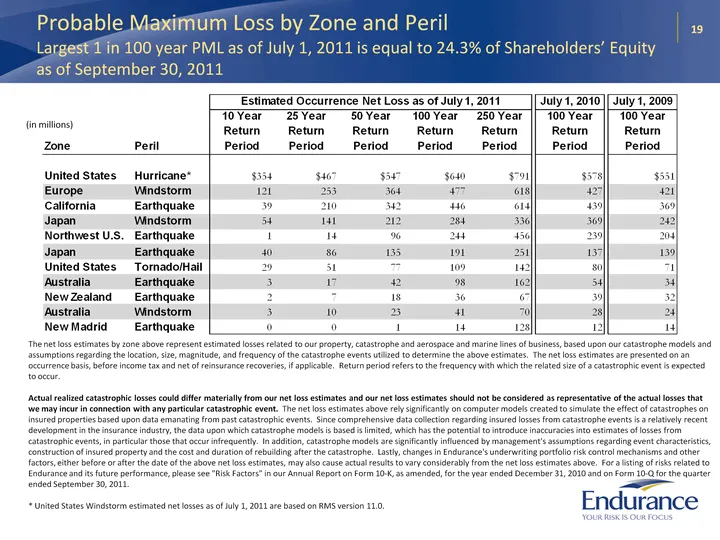
19 Probable Maximum Loss by Zone and Peril Largest 1 in 100 year PML as of July 1, 2011 is equal to 24.3% of Shareholders' Equity as of September 30, 2011 The net loss estimates by zone above represent estimated losses related to our property, catastrophe and aerospace and marine lines of business,
Slide 20: Actively Managing our Portfolio of Businesses
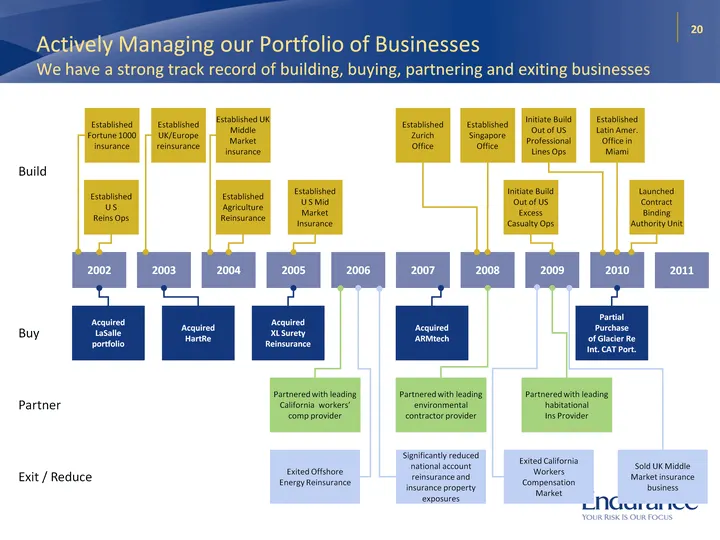
2011 2008 2006 2002 2003 2004 2005 2007 2009 2010 20 Actively Managing our Portfolio of Businesses We have a strong track record of building, buying, partnering and exiting businesses Buy Build Partner Acquired LaSalle portfolio Acquired HartRe Acquired ARMtech Partnered with leading California work
Slide 21: First Nine Months of 2011 Highlights
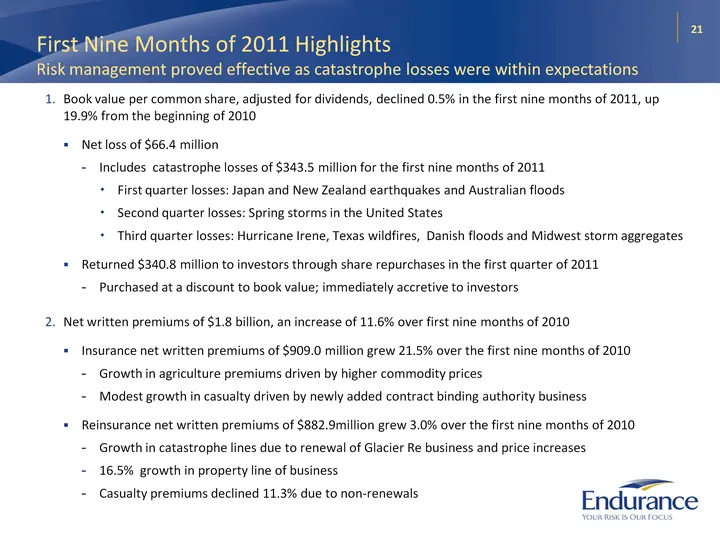
First Nine Months of 2011 Highlights Risk management proved effective as catastrophe losses were within expectations Book value per common share, adjusted for dividends, declined 0.5% in the first nine months of 2011, up 19.9% from the beginning of 2010 Net loss of $66.4 million Includes catastrophe
Slide 22: Financial Results for Third Quarter 2011
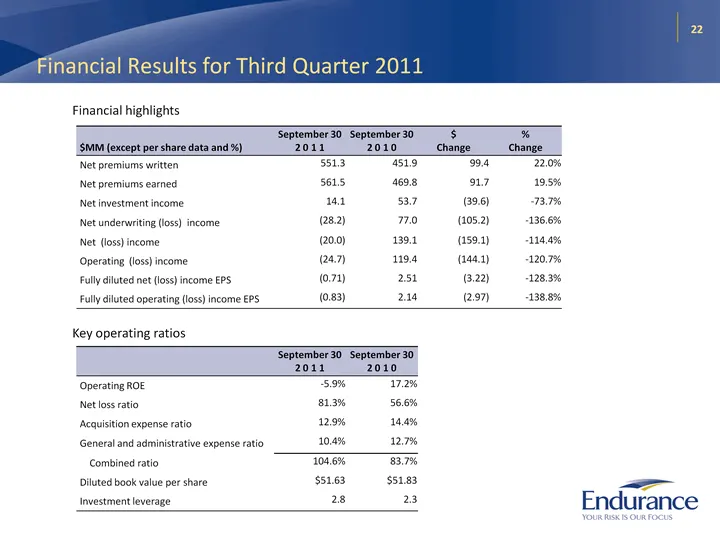
22 Financial Results for Third Quarter 2011 $MM (except per share data and %) September 30 2 0 1 1 September 302 0 1 0 $Change %Change Net premiums written 551.3 451.9 99.4 22.0% Net premiums earned 561.5 469.8 91.7 19.5% Net investment income 14.1 53.7 (39.6) -73.7% Net underwriting (loss) income (
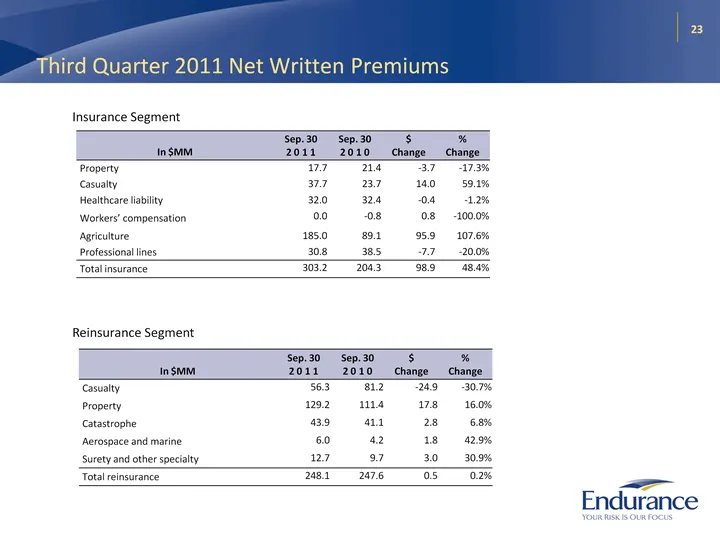
Slide 23: Third Quarter 2011 Net Written Premiums
23 Third Quarter 2011 Net Written Premiums In $MM Sep. 302 0 1 1 Sep. 302 0 1 0 $Change %Change Property 17.7 21.4 -3.7 -17.3% Casualty 37.7 23.7 14.0 59.1% Healthcare liability 32.0 32.4 -0.4 -1.2% Workers' compensation 0.0 -0.8 0.8 -100.0% Agriculture 185.0 89.1 95.9 107.6% Professional lines 30.8
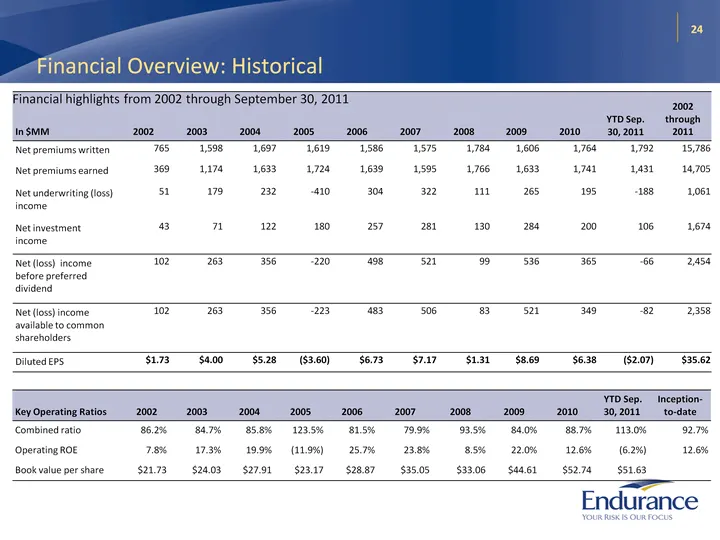
Slide 24: Financial Overview: Historical
24 Financial Overview: Historical In $MM 2002 2003 2004 2005 2006 2007 2008 2009 2010 YTD Sep. 30, 2011 2002 through 2011 Net premiums written 765 1,598 1,697 1,619 1,586 1,575 1,784 1,606 1,764 1,792 15,786 Net premiums earned 369 1,174 1,633 1,724 1,639 1,595 1,766 1,633 1,741 1,431 14,705 Net und
Source: SEC EDGAR · 8-K filed Nov 17, 2011
More decks from Endurance Specialty Holdings Ltd
 Merger or Acquisition (October 2016)17 slides · Oct 12, 2016
 Investor Presentation (August 2016)29 slides · Aug 9, 2016
 Investor Presentation (May 2016)28 slides · May 10, 2016
 Investor Presentation (February 2016)29 slides · Feb 9, 2016
 Investor Presentation (February 2015)28 slides · Feb 11, 2015
 Merger or Acquisition (April 2014)22 slides · Apr 14, 2014