Comerica — Comerica Inc /New/ — Credit Suisse Financial Services Forum 2013
21 slides from Comerica's conference presentation, Feb 8, 2013
Slide 1: Credit Suisse Financial Services Forum
Comerica Incorporated Credit Suisse Financial Services ForumFebruary 11-12, 2013 Curt FarmerVice Chairman, The Retail Bank and Wealth Management Karen ParkhillVice Chairman and Chief Financial Officer Safe Harbor Statement 2 Any statements in this presentation that are not historical facts are forwa
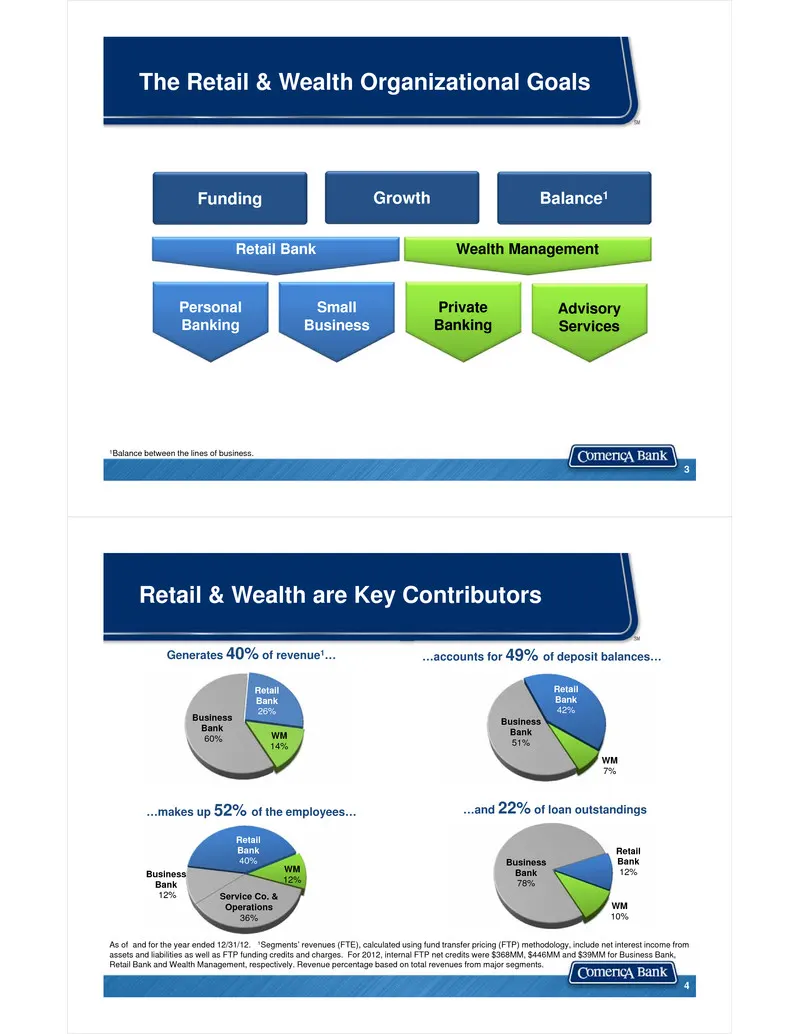
Slide 2: The Retail & Wealth Organizational Goals
The Retail & Wealth Organizational Goals 3 PersonalBanking Small Business PrivateBanking Advisory Services Retail Bank Wealth Management Balance1Funding Growth 1Balance between the lines of business. Business Bank 78% Retail Bank 12% WM 10% Business Bank 60% Retail Bank 26% WM 14% Retail & Wealth ar
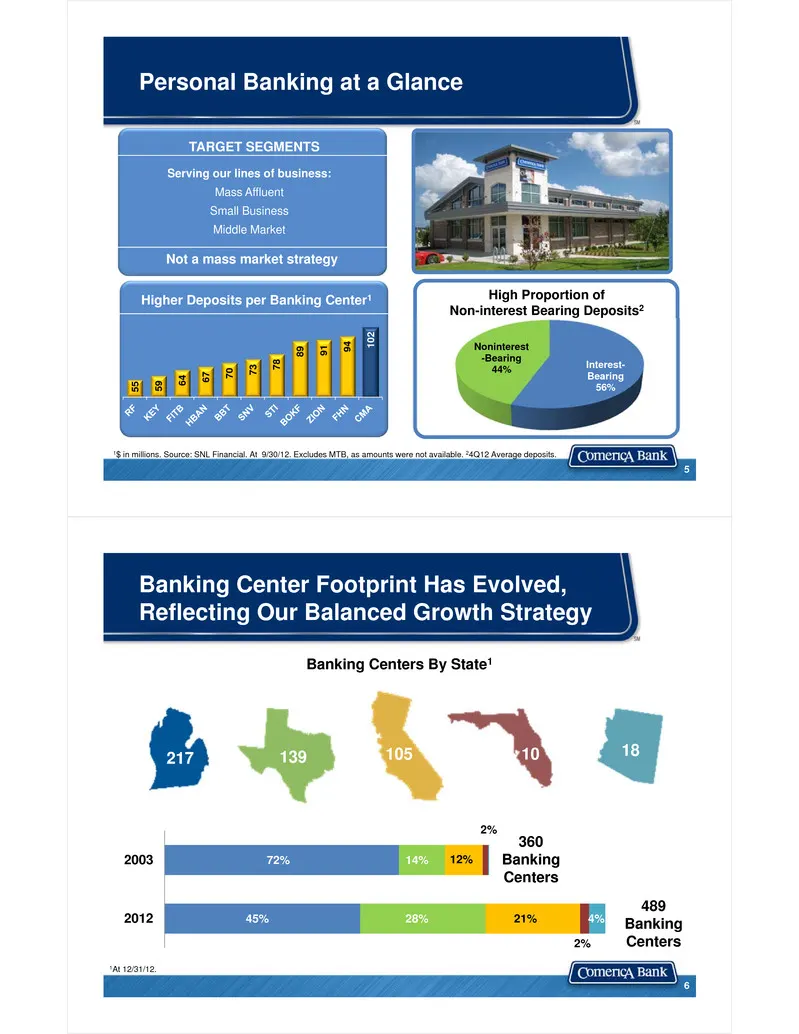
Slide 3: Personal Banking at a Glance
TARGET SEGMENTS Serving our lines of business: Mass Affluent Small Business Middle Market Not a mass market strategy 133 5 1$ in millions. Source: SNL Financial. At 9/30/12. Excludes MTB, as amounts were not available. 24Q12 Average deposits. Personal Banking at a Glance Higher Deposits per Banking
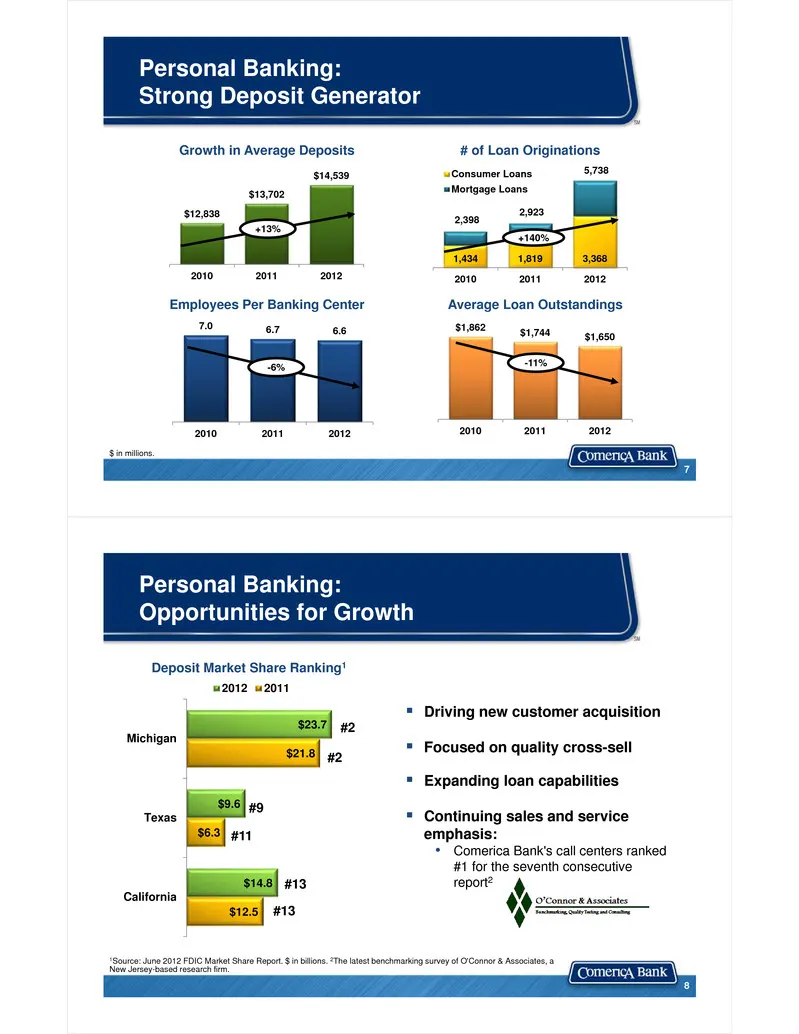
Slide 4: Personal Banking: Strong Deposit Generator
Personal Banking: Strong Deposit Generator 7 1,434 1,819 3,368 2,398 2,923 5,738 2010 2011 2012 Consumer LoansMortgage Loans # of Loan Originations $12,838 $13,702 $14,539 2010 2011 2012 Growth in Average Deposits $ in millions. $1,862 $1,744 $1,650 2010 2011 2012 Average Loan Outstandings +13% -11%
Slide 5: Small Business at a Glance
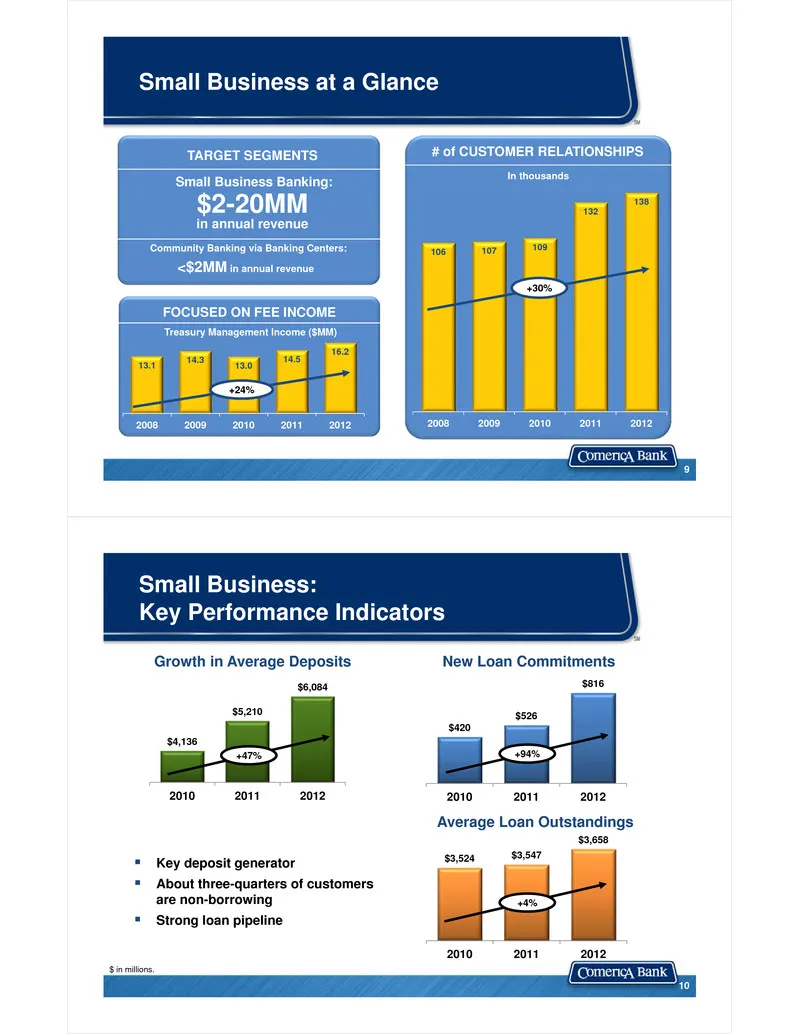
13.1 14.3 13.0 14.5 16.2 2008 2009 2010 2011 2012 Small Business at a Glance TARGET SEGMENTS Small Business Banking: Community Banking via Banking Centers: $2-20MMin annual revenue <$2MM in annual revenue 9 FOCUSED ON FEE INCOME Treasury Management Income ($MM) +24% 106 107 109 132 138 2008 2009 201
Slide 6: Small Business: Opportunities for Growth
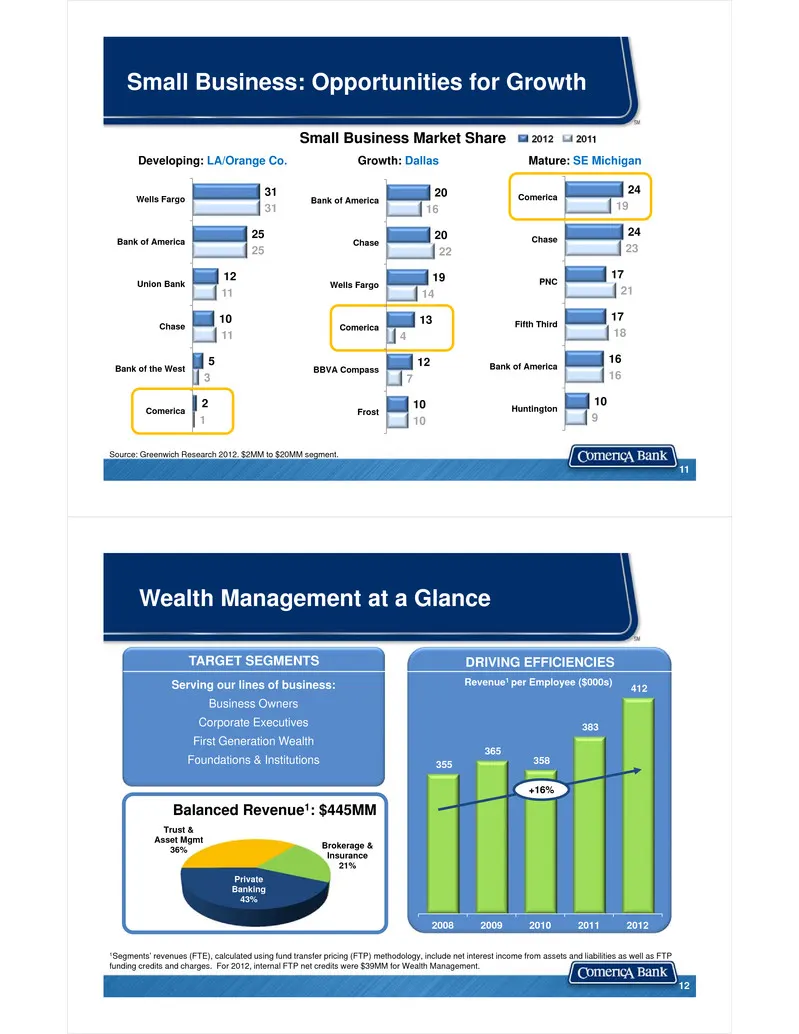
Small Business: Opportunities for Growth 11 Developing: LA/Orange Co. Growth: Dallas Mature: SE Michigan 31 25 12 10 5 2 31 25 11 11 3 1 Wells Fargo Bank of America Union Bank Chase Bank of the West Comerica 24 24 17 17 16 10 19 23 21 18 16 9 Comerica Chase PNC Fifth Third Bank of America Huntington
Slide 7: Wealth Management: Key Performance Indicators
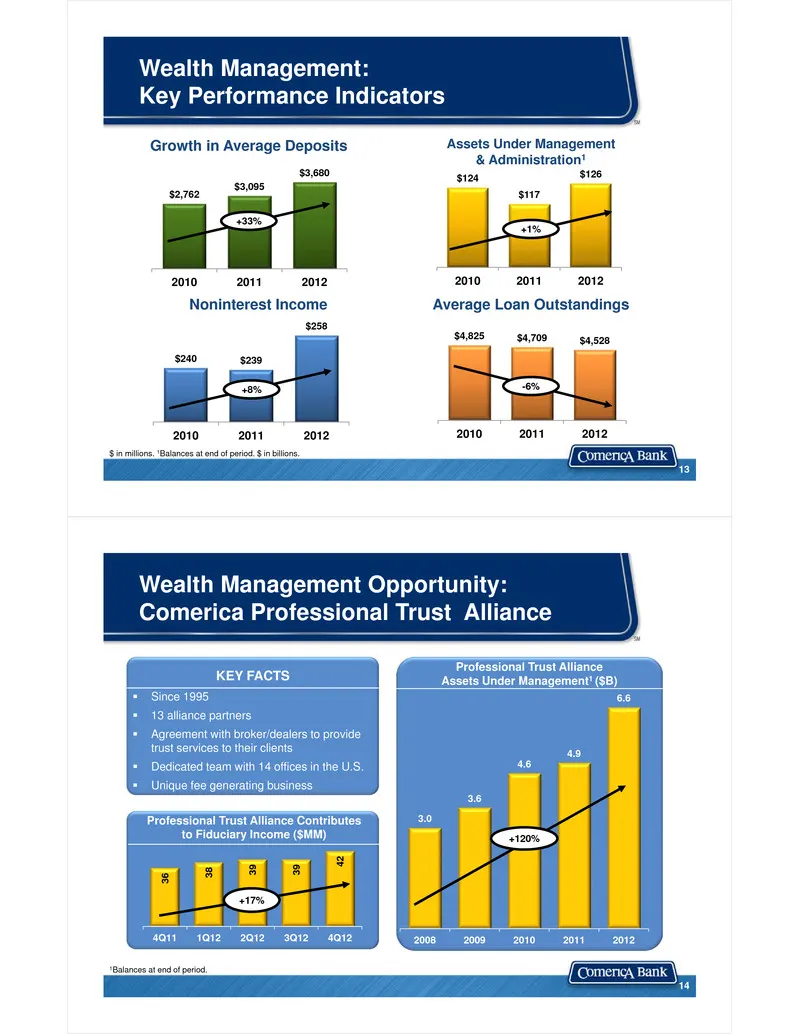
Wealth Management: Key Performance Indicators 13 $2,762 $3,095 $3,680 2010 2011 2012 $240 $239 $258 2010 2011 2012 Noninterest Income $124 $117 $126 2010 2011 2012 Assets Under Management & Administration1 Growth in Average Deposits $ in millions. 1Balances at end of period. $ in billions. $4,825 $4
Slide 8: Retail & Wealth Opportunity: Collaboration
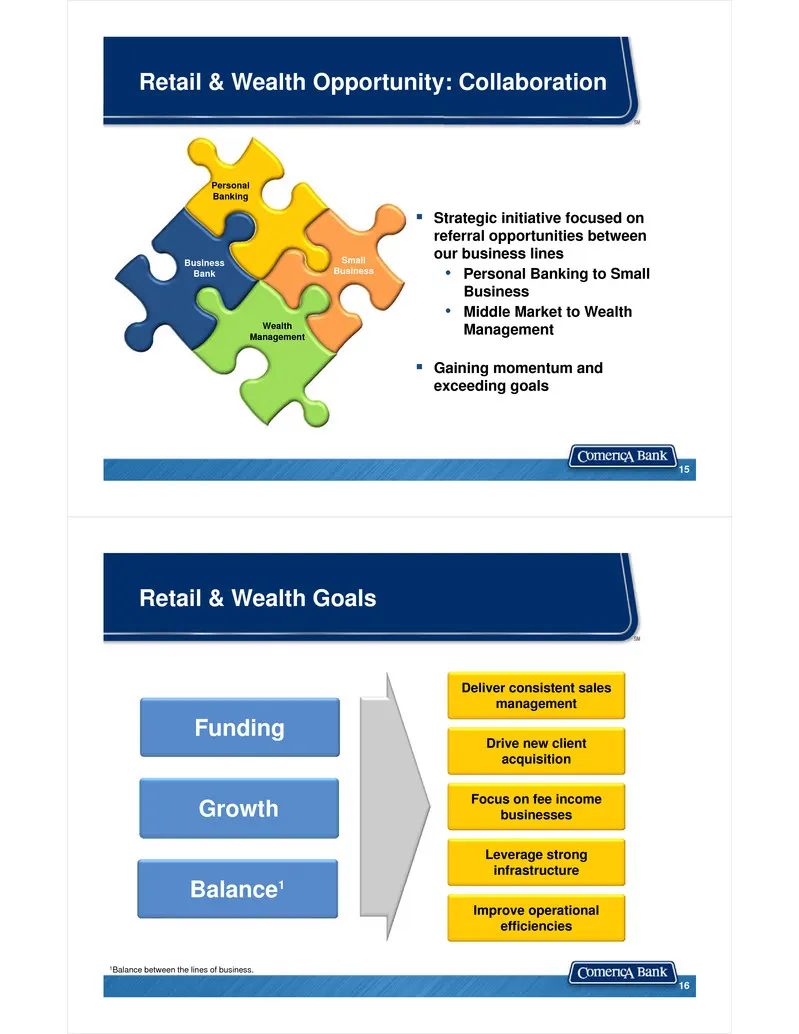
Retail & Wealth Opportunity: Collaboration 15 Personal Banking Business Bank Wealth Management Small Business Strategic initiative focused on referral opportunities between our business lines• Personal Banking to Small Business• Middle Market to Wealth Management Gaining momentum and exceeding g
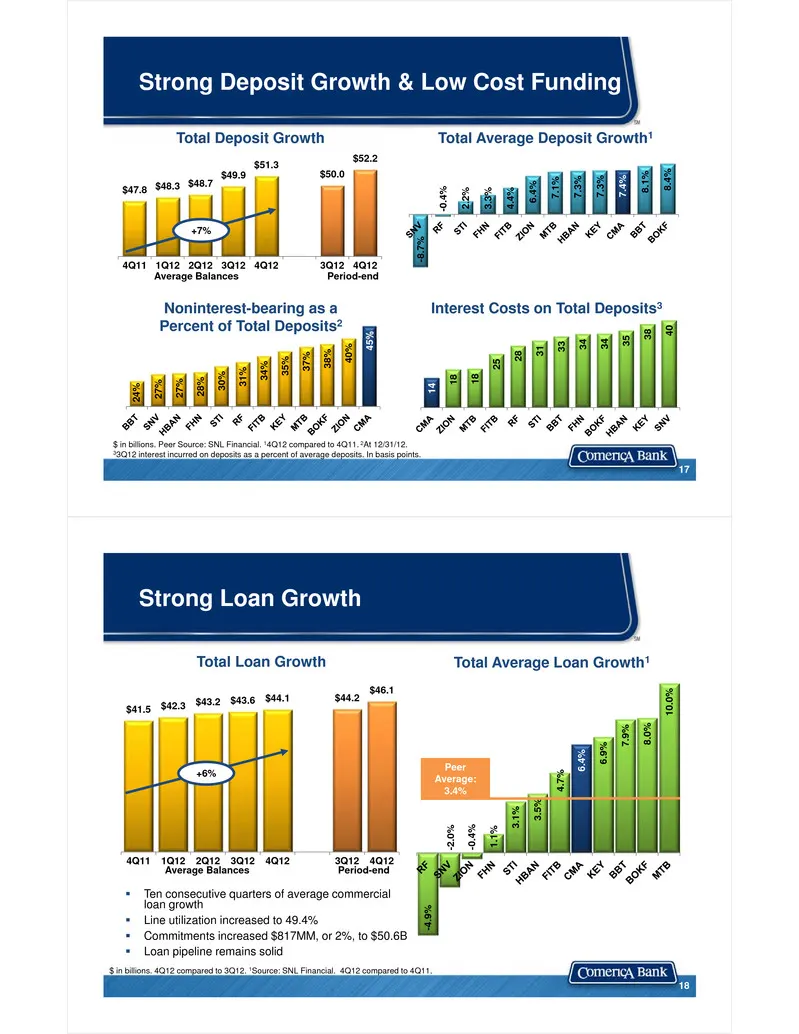
Slide 9: Strong Deposit Growth & Low Cost Funding
Strong Deposit Growth & Low Cost Funding 17 24% 27% 27% 28 % 30% 31% 34 % 35% 37% 38 % 40% 4 5% 14 18 18 25 28 3 1 33 34 34 35 3 8 40 -8.7 % -0.4 % 2.2% 3.3% 4.4% 6.4 % 7.1% 7.3% 7.3% 7.4% 8.1 % 8.4% $ in billions. Peer Source: SNL Financial. 14Q12 compared to 4Q11. 2At 12/31/12.33Q12 interest incur
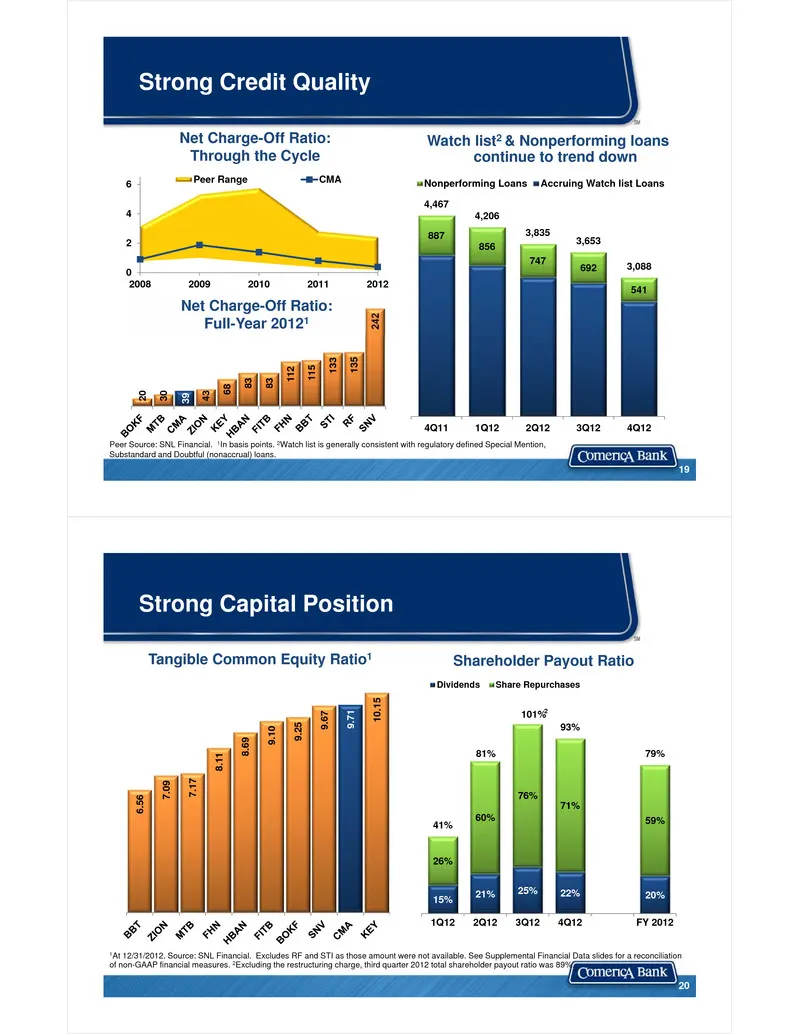
Slide 10: Strong Credit Quality
Strong Credit Quality 19 Peer Source: SNL Financial. 1In basis points. 2Watch list is generally consistent with regulatory defined Special Mention, Substandard and Doubtful (nonaccrual) loans. 887 856 747 692 541 4,467 4,206 3,835 3,653 3,088 4Q11 1Q12 2Q12 3Q12 4Q12 Nonperforming Loans Accruing Wat
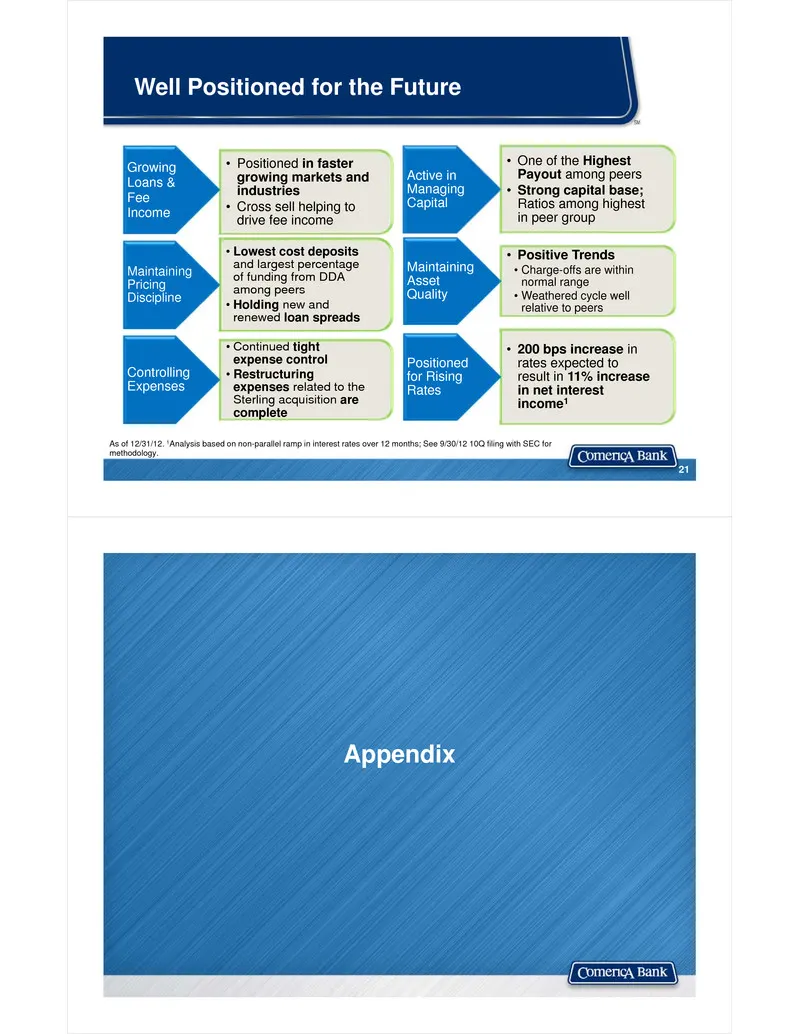
Slide 11: Well Positioned for the Future
• One of the Highest Payout among peers• Strong capital base; Ratios among highest in peer group Active in Managing Capital • Positive Trends• Charge-offs are within normal range• Weathered cycle well relative to peers Maintaining Asset Quality • 200 bps increase in rates expected to result in 11% i
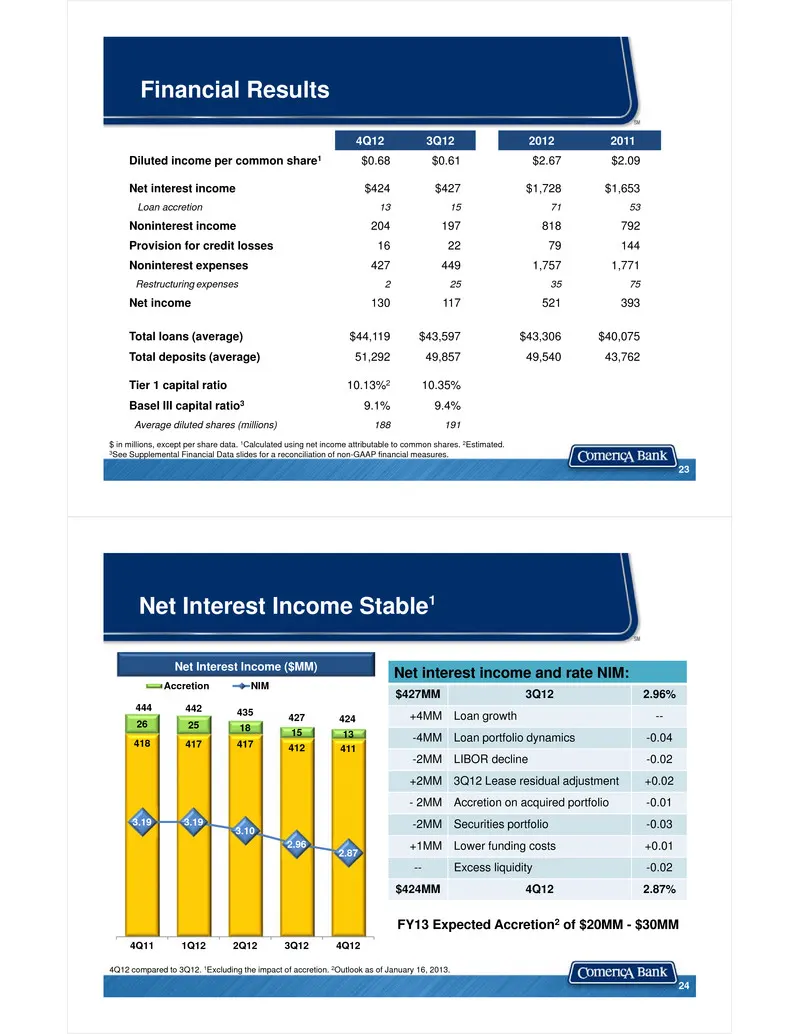
Slide 12: Financial Results
Financial Results $ in millions, except per share data. 1Calculated using net income attributable to common shares. 2Estimated.3See Supplemental Financial Data slides for a reconciliation of non-GAAP financial measures. 4Q12 3Q12 2012 2011 Diluted income per common share1 $0.68 $0.61 $2.67 $2.09 Net
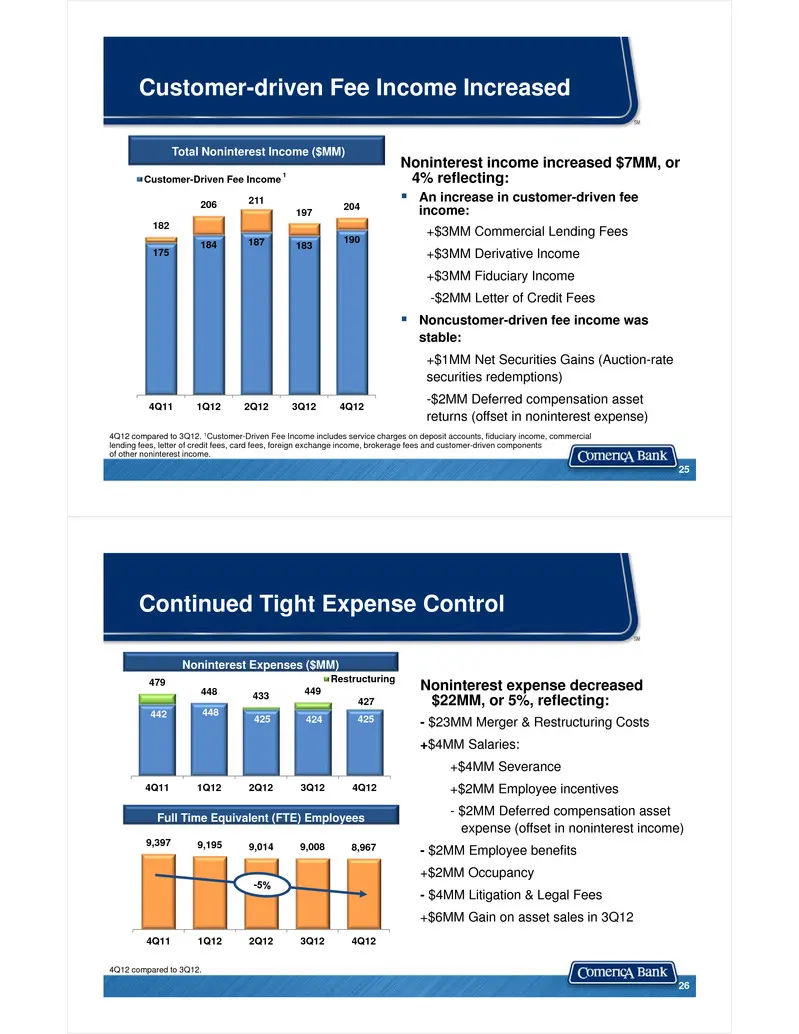
Slide 13: Customer-driven Fee Income Increased
4Q12 compared to 3Q12. 1Customer-Driven Fee Income includes service charges on deposit accounts, fiduciary income, commercial lending fees, letter of credit fees, card fees, foreign exchange income, brokerage fees and customer-driven components of other noninterest income. 25 175 184 187 183 190 182
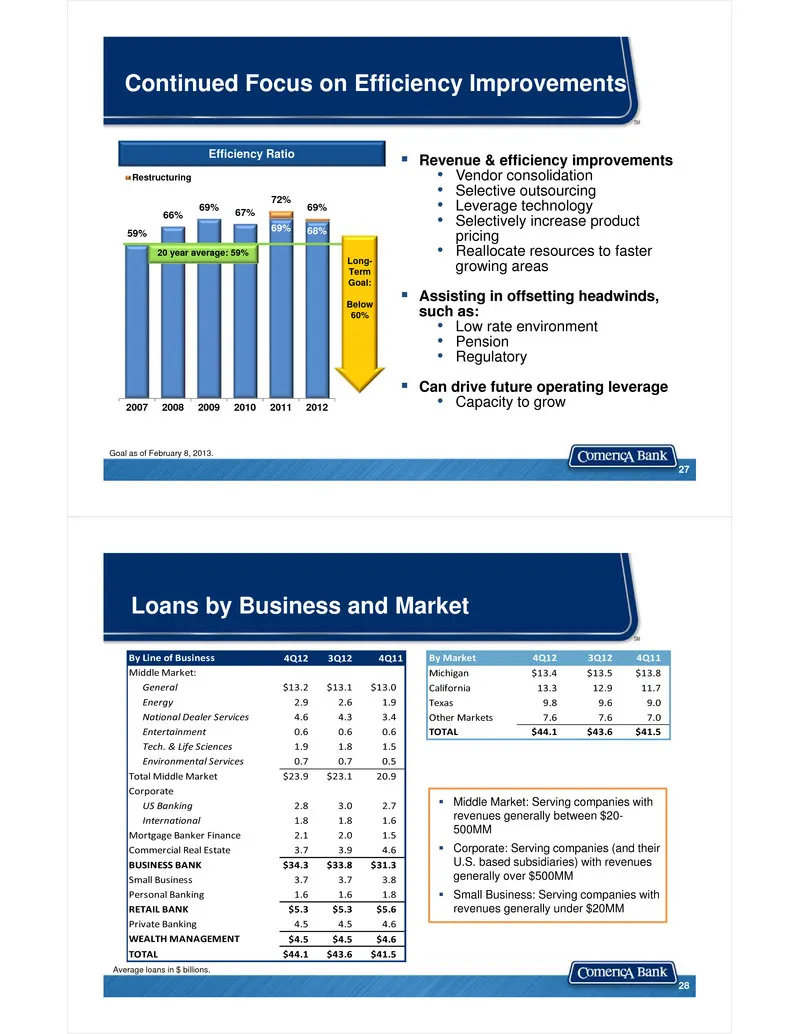
Slide 14: Continued Focus on Efficiency Improvements
Continued Focus on Efficiency Improvements Goal as of February 8, 2013. 27 Revenue & efficiency improvements• Vendor consolidation• Selective outsourcing• Leverage technology• Selectively increase product pricing• Reallocate resources to faster growing areas Assisting in offsetting headwinds, su
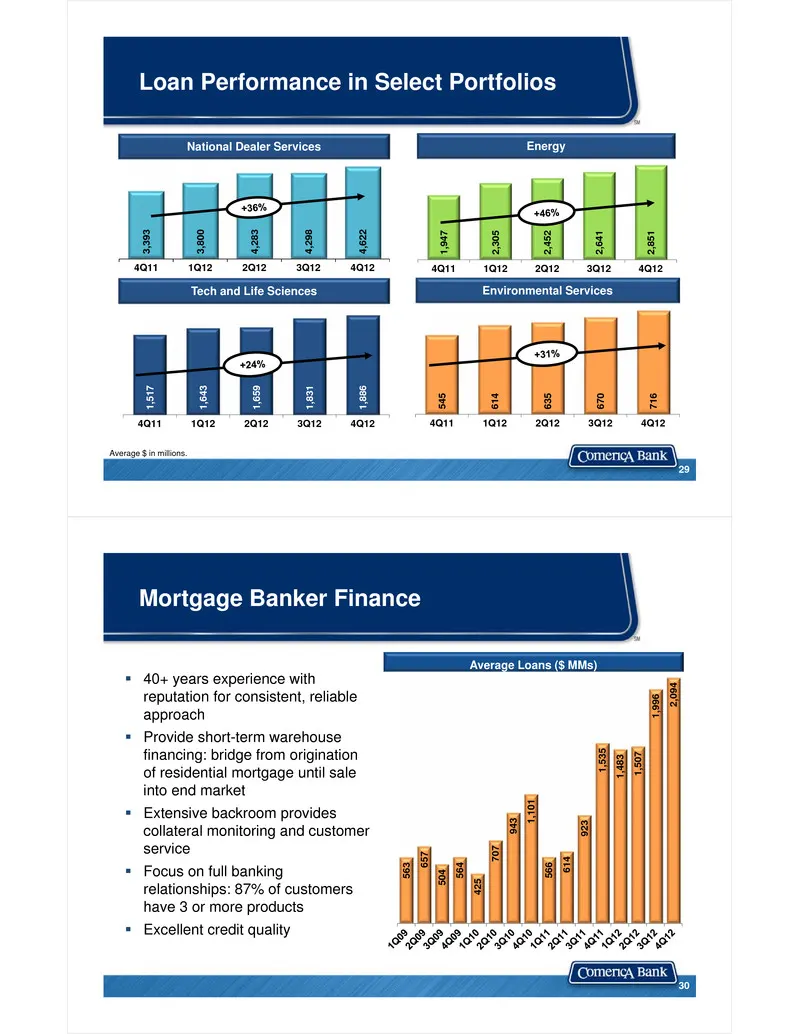
Slide 15: Loan Performance in Select Portfolios
1,94 7 2,30 5 2,45 2 2,64 1 2,85 1 4Q11 1Q12 2Q12 3Q12 4Q12 545 614 635 670 716 4Q11 1Q12 2Q12 3Q12 4Q12 Loan Performance in Select Portfolios Average $ in millions. Environmental Services Energy 1,51 7 1,64 3 1,65 9 1,83 1 1,88 6 4Q11 1Q12 2Q12 3Q12 4Q12 Tech and Life Sciences 29 3,39 3 3,80 0 4,28
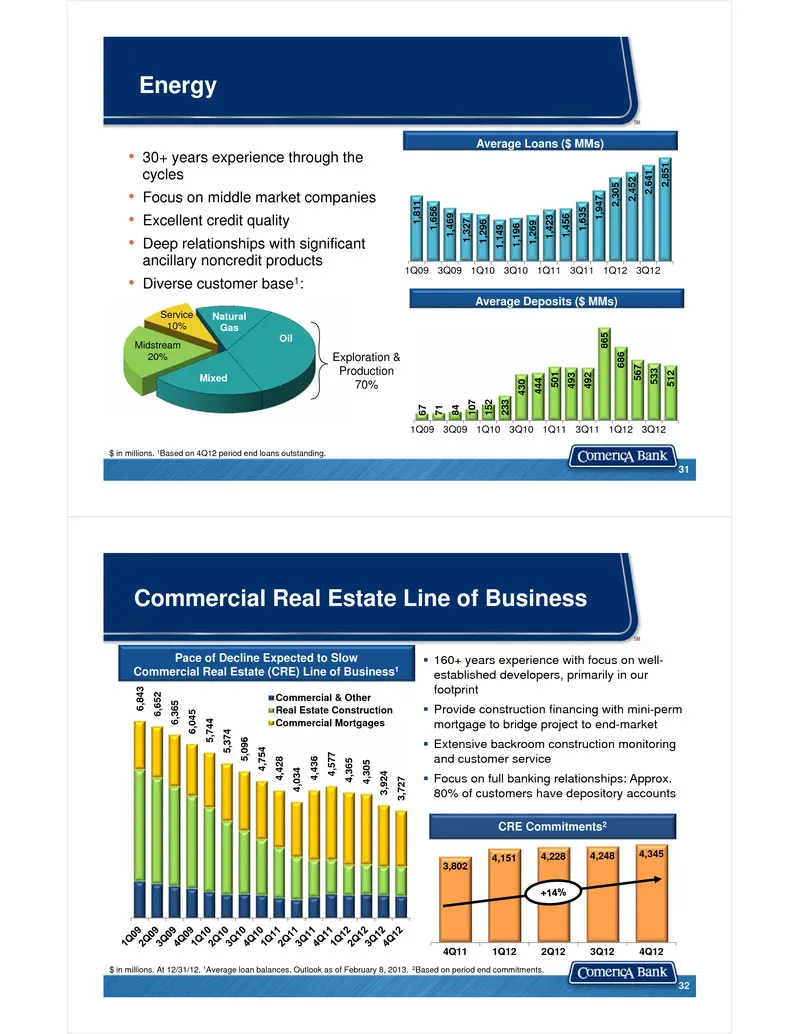
Slide 16: Energy and Commercial Real Estate
Energy • 30+ years experience through the cycles • Focus on middle market companies• Excellent credit quality• Deep relationships with significant ancillary noncredit products • Diverse customer base1: Natural Gas Oil Mixed Midstream 20% Service 10% Exploration & Production 70% $ in millions. 1Based
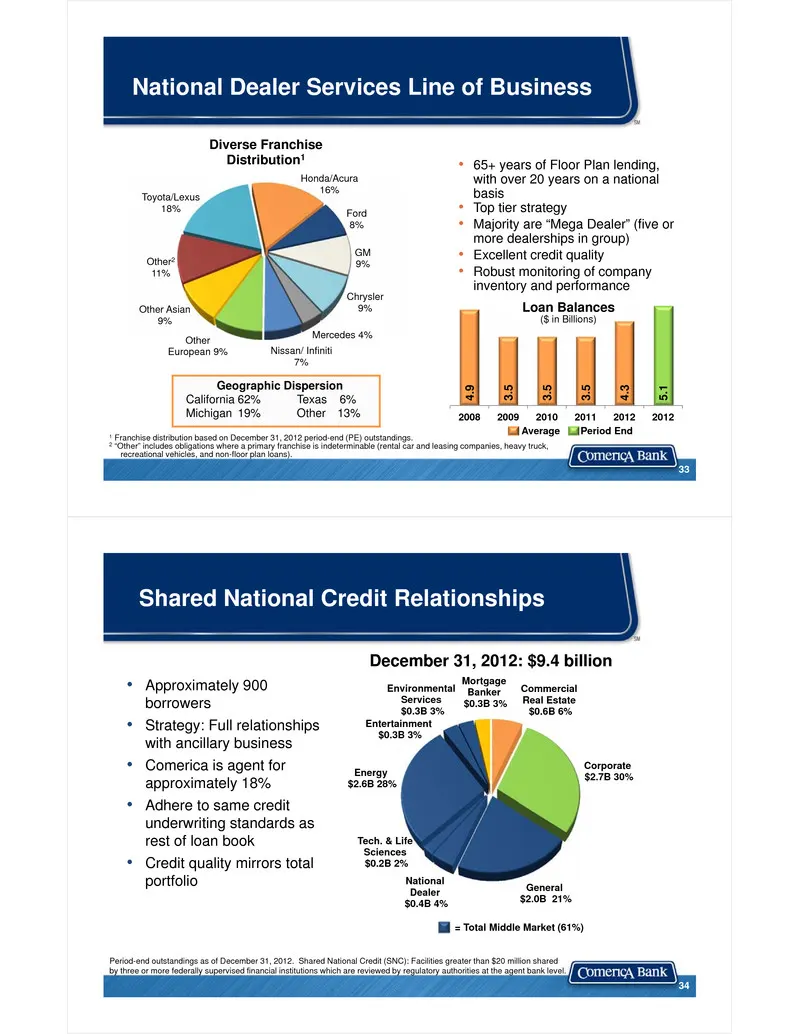
Slide 17: National Dealer Services Line of Business
Toyota/Lexus 18% Honda/Acura 16% Ford 8% GM 9% Chrysler 9% Mercedes 4% Nissan/ Infiniti 7% Other European 9% Other Asian 9% Other211% Diverse Franchise Distribution1 National Dealer Services Line of Business Geographic DispersionCalifornia 62% Texas 6%Michigan 19% Other 13% 1 Franchise distribution
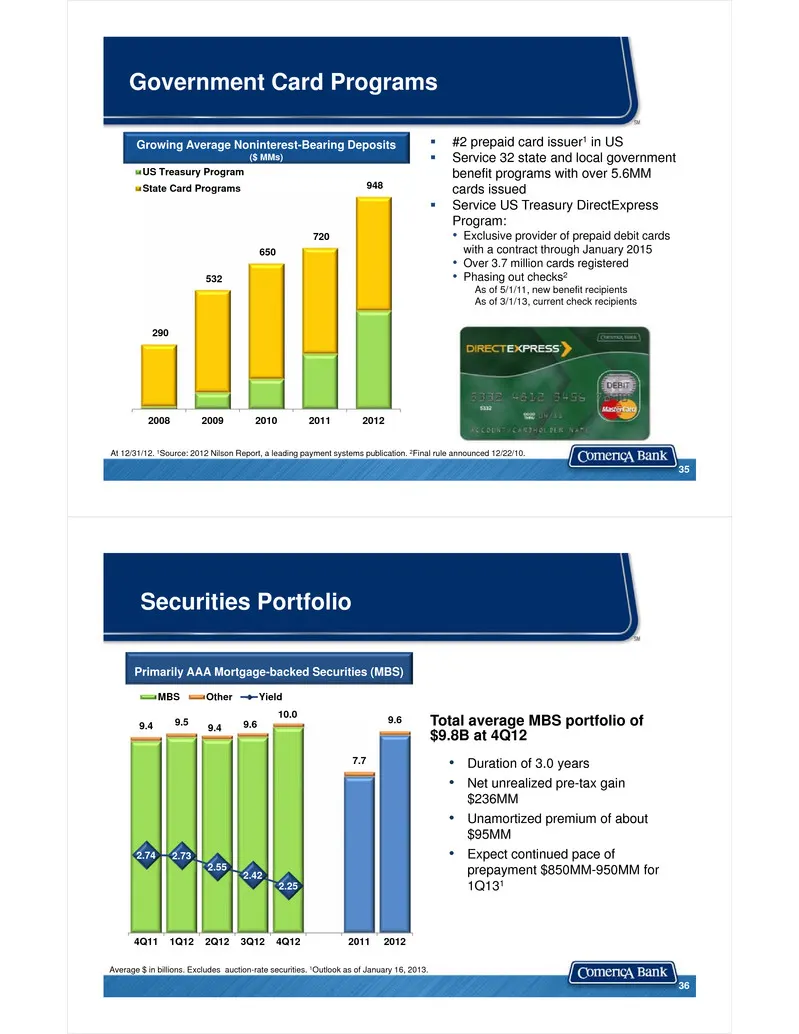
Slide 18: Government Card Programs and Securities Portfolio
At 12/31/12. 1Source: 2012 Nilson Report, a leading payment systems publication. 2Final rule announced 12/22/10. Government Card Programs #2 prepaid card issuer1 in US Service 32 state and local government benefit programs with over 5.6MM cards issued Service US Treasury DirectExpress Program:
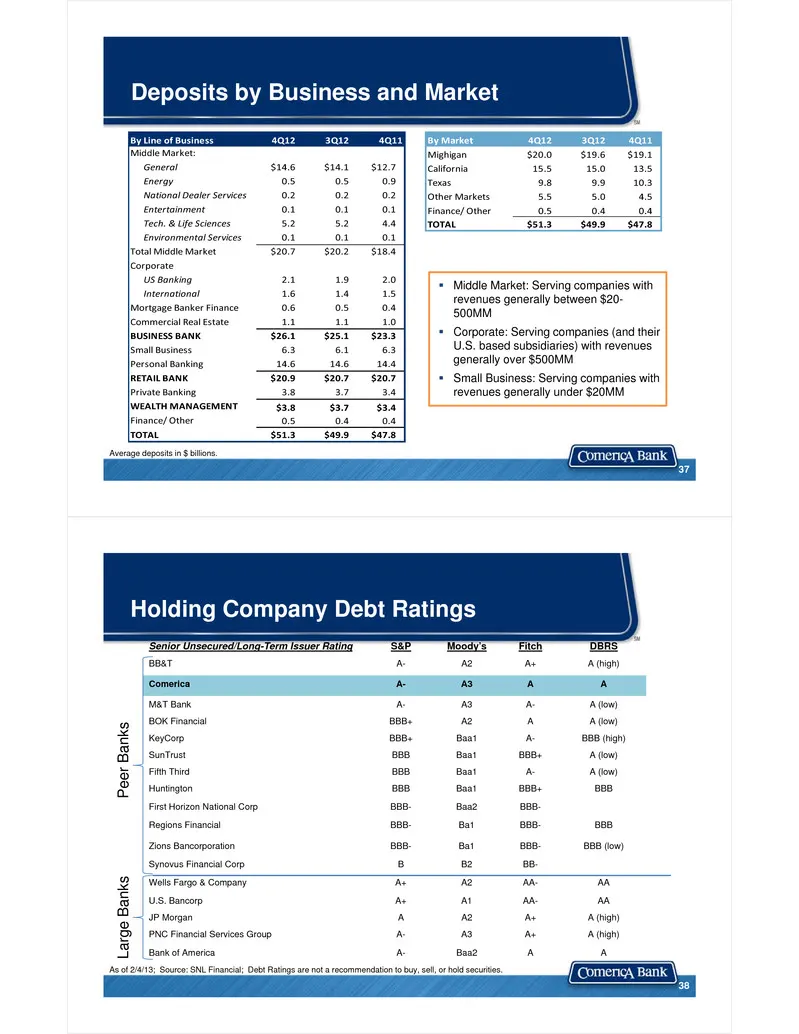
Slide 19: Deposits by Business and Market
Deposits by Business and Market Average deposits in $ billions. 37 By Line of Business 4Q12 3Q12 4Q11 By Market 4Q12 3Q12 4Q11Middle Market: Mighigan $20.0 $19.6 $19.1General $14.6 $14.1 $12.7 California 15.5 15.0 13.5Energy 0.5 0.5 0.9 Texas 9.8 9.9 10.3National Dealer Services 0.2 0.2 0.2 Other Ma
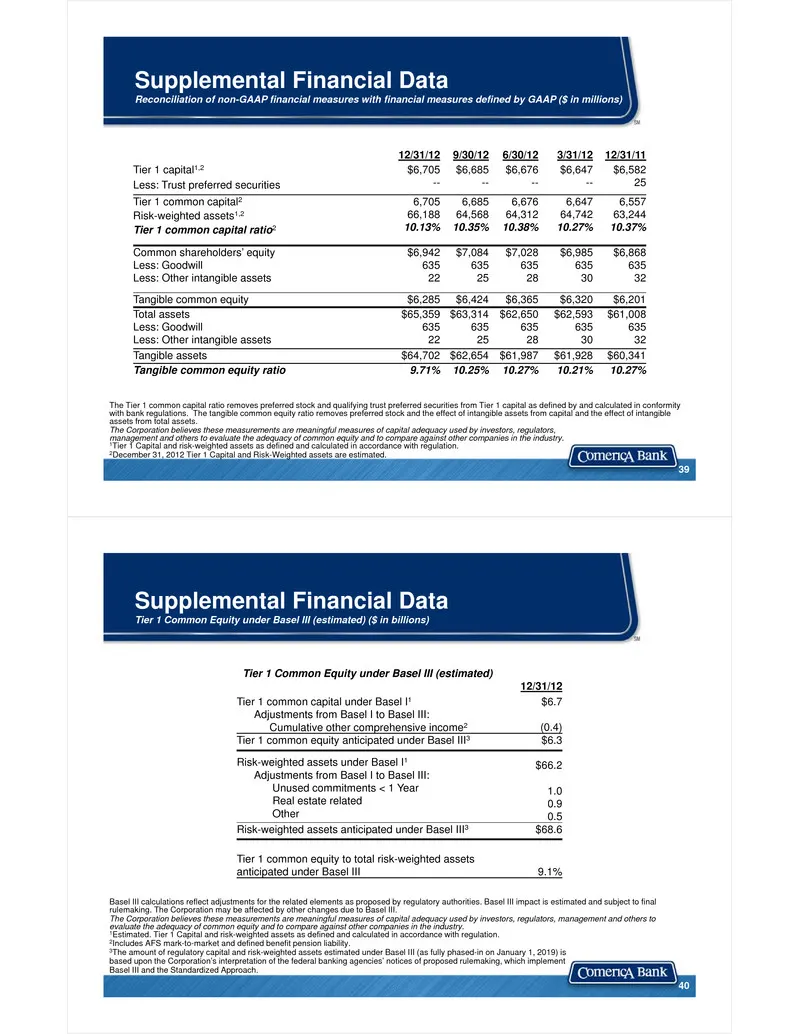
Slide 20: Supplemental Financial Data
Supplemental Financial DataReconciliation of non-GAAP financial measures with financial measures defined by GAAP ($ in millions) The Tier 1 common capital ratio removes preferred stock and qualifying trust preferred securities from Tier 1 capital as defined by and calculated in conformity with bank

Slide 21
Source: SEC EDGAR · 8-K filed Feb 8, 2013
More decks from Comerica Incorporated
 Goldman Sachs Financial Services Conference 202520 slides · Dec 11, 2025
 Merger or Acquisition (October 2025)18 slides · Oct 6, 2025
 Barclays Global Financial Services Conference 202524 slides · Sep 8, 2025
 Q2 2025 Earnings Presentation24 slides · Jul 18, 2025
 Q1 2025 Earnings Presentation21 slides · Apr 21, 2025
 Q4 2024 Earnings Presentation24 slides · Jan 22, 2025