Altra Industrial Motion — Altra Holdings — Q4 2012 Earnings Presentation
11 slides from Altra Industrial Motion's earnings presentation, Feb 14, 2013
Slide 1: Fourth-Quarter 2012 Results
Exhibit 99.2 Fourth-Quarter Replay Number 2012 Results Through February 21, 2013 877-660-6853 Domestic 201-612-7415 International Conference ID: # 408780 Webcast Replay at February 14, 2013 www.altramotion.com 10:00 AM ET Dial In Number 877-407-8293 Domestic 201-689-8349 International Webcast at www
Slide 2: Safe Harbor Statement
Safe Harbor Statement Cautionary Statement Regarding Forward Looking Statements All statements, other than statements of historical fact included in this release are forward-looking statements, as that term is defined in the Private Securities Litigation Reform Act of 1995. These statements include,
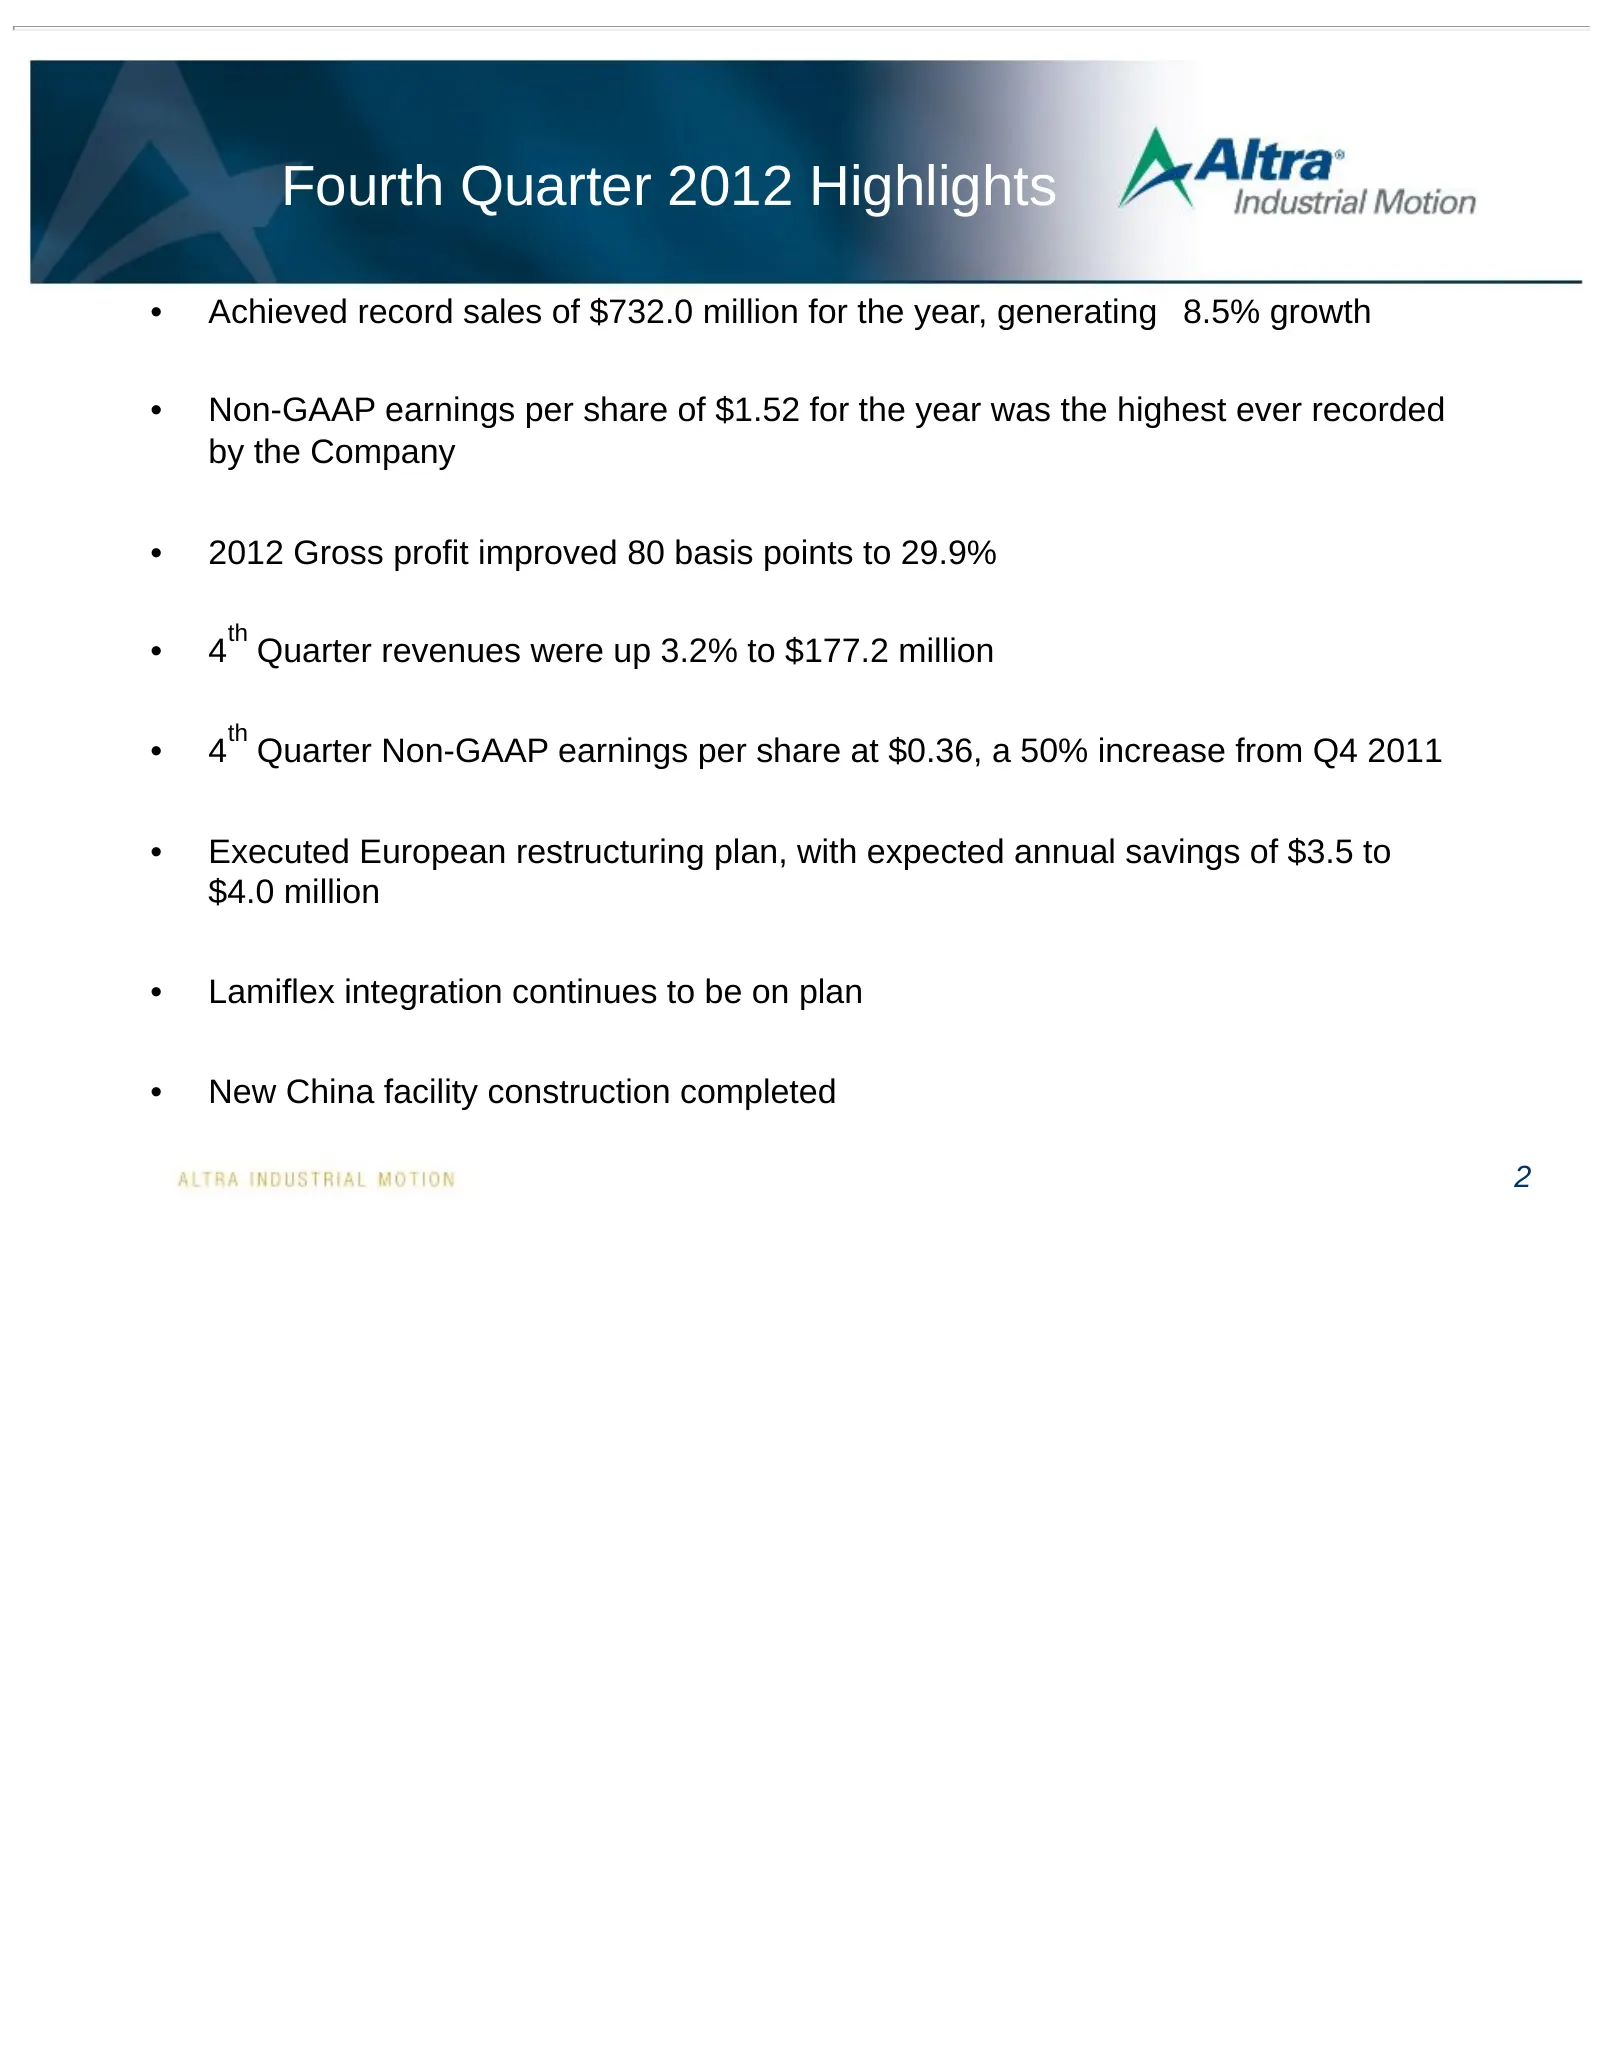
Slide 3: Fourth Quarter 2012 Highlights
Fourth Quarter 2012 Highlights • Achieved record sales of $732.0 million for the year, generating 8.5% growth • Non-GAAP earnings per share of $1.52 for the year was the highest ever recorded by the Company • 2012 Gross profit improved 80 basis points to 29.9% th • 4 Quarter revenues were up 3.2% to
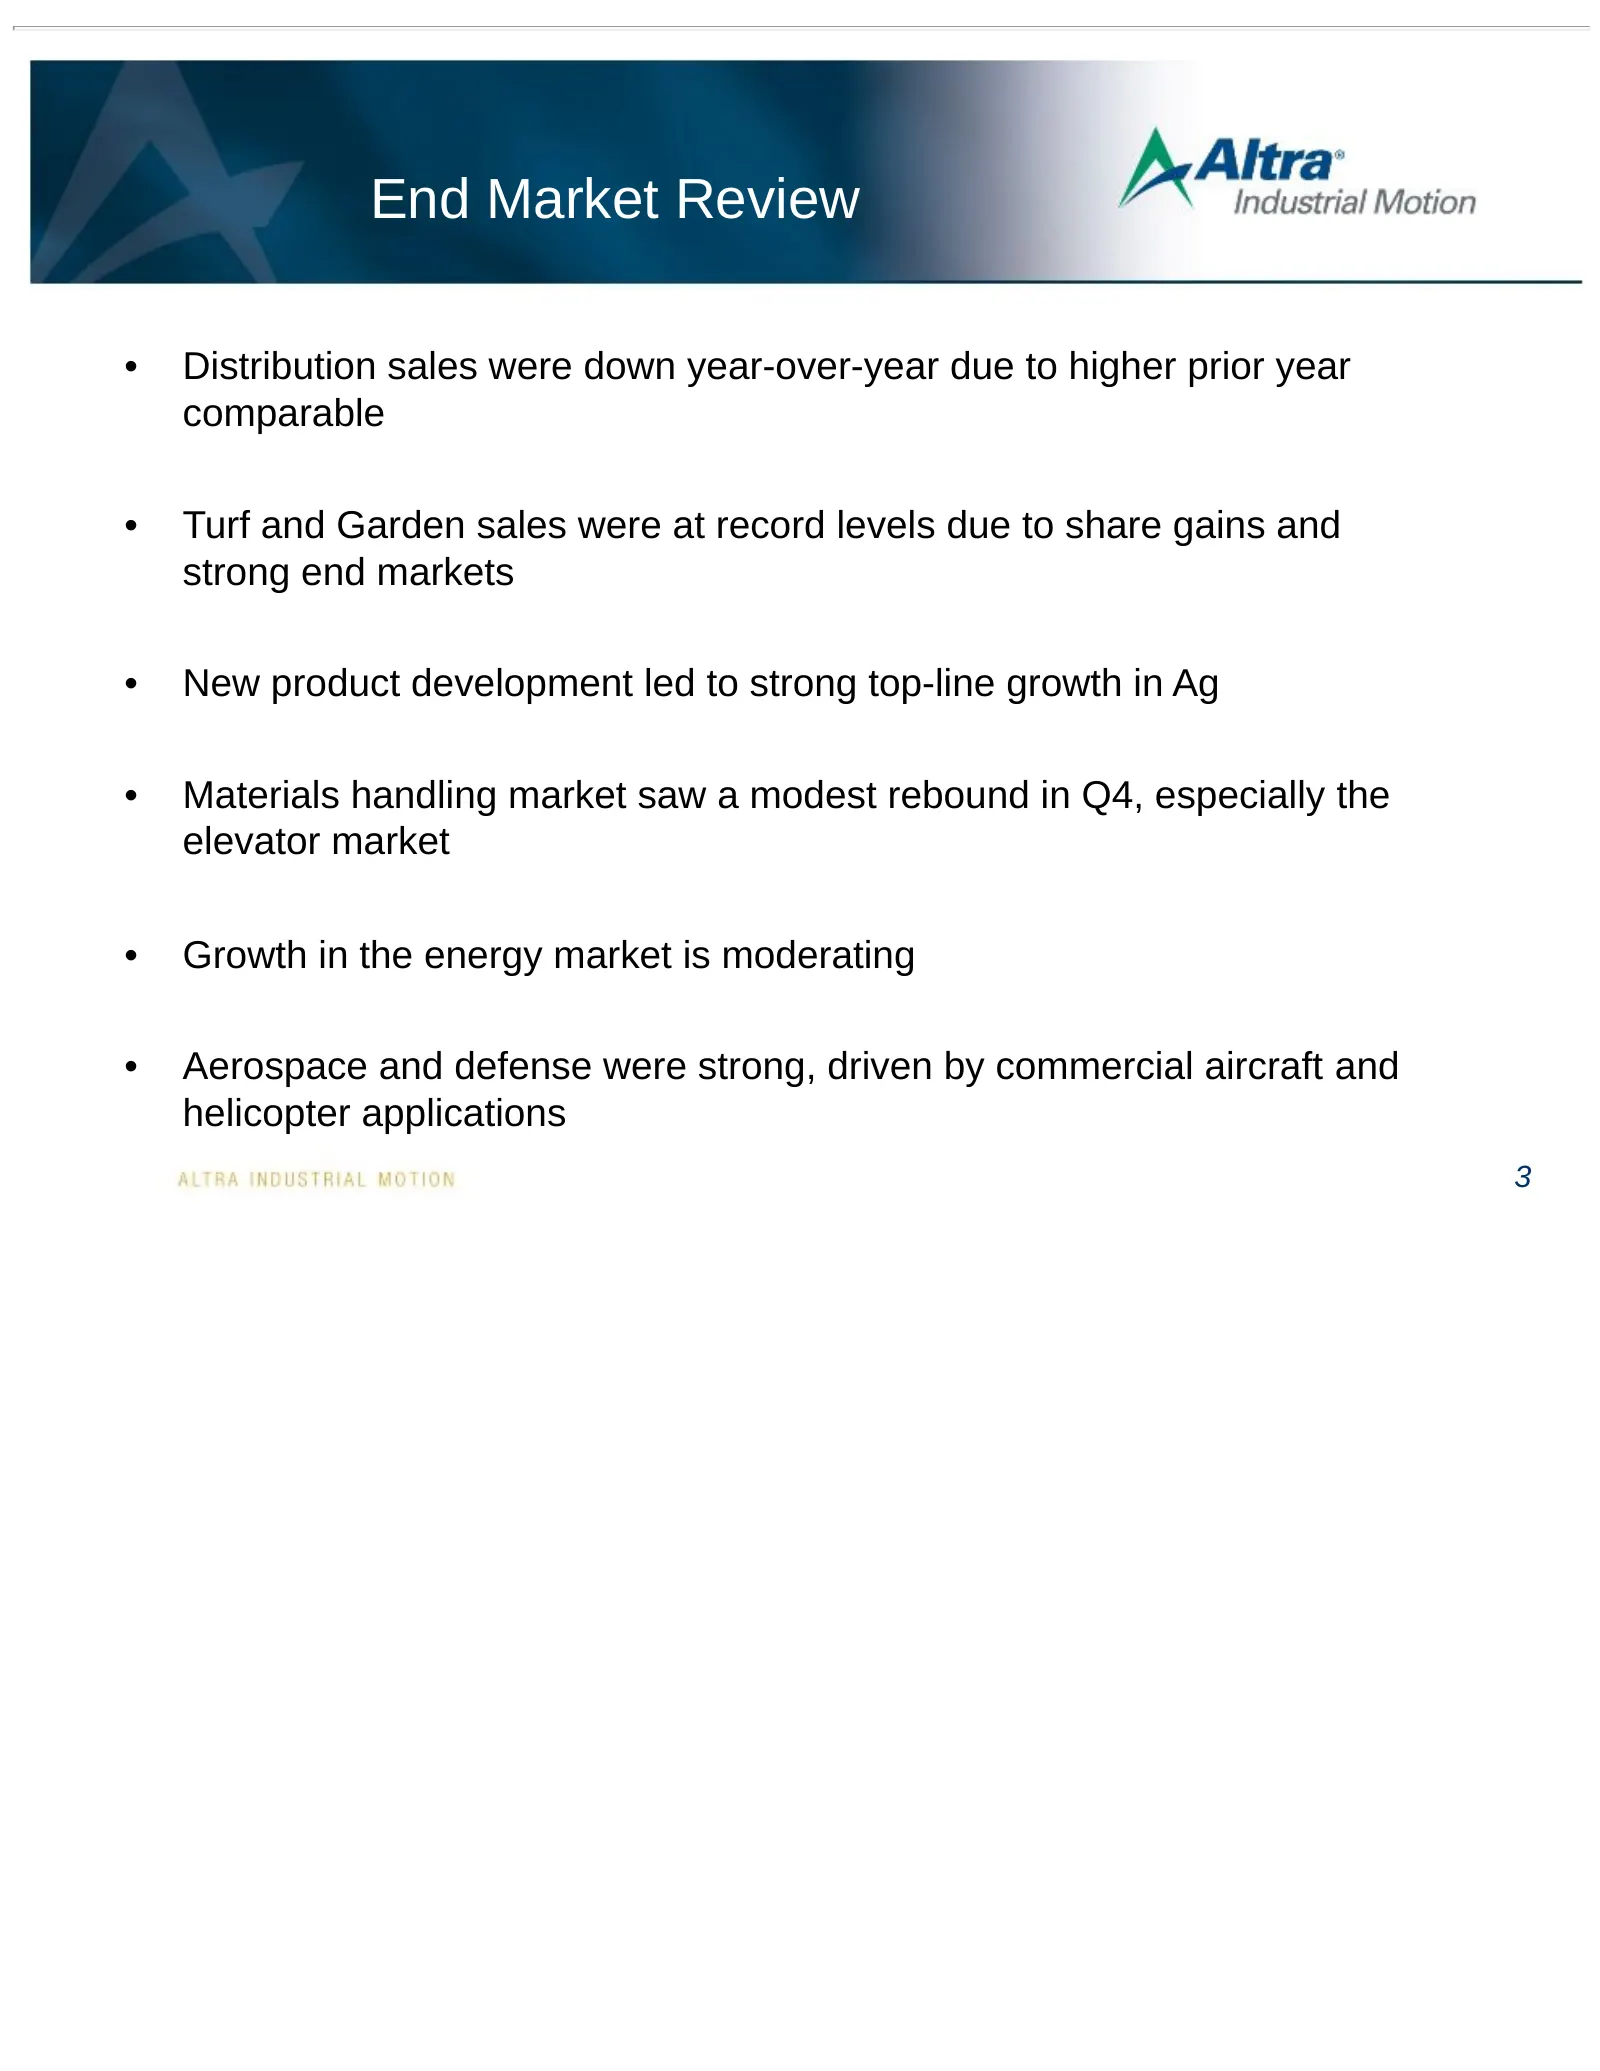
Slide 4: End Market Review
End Market Review • Distribution sales were down year-over-year due to higher prior year comparable • Turf and Garden sales were at record levels due to share gains and strong end markets • New product development led to strong top-line growth in Ag • Materials handling market saw a modest rebound i
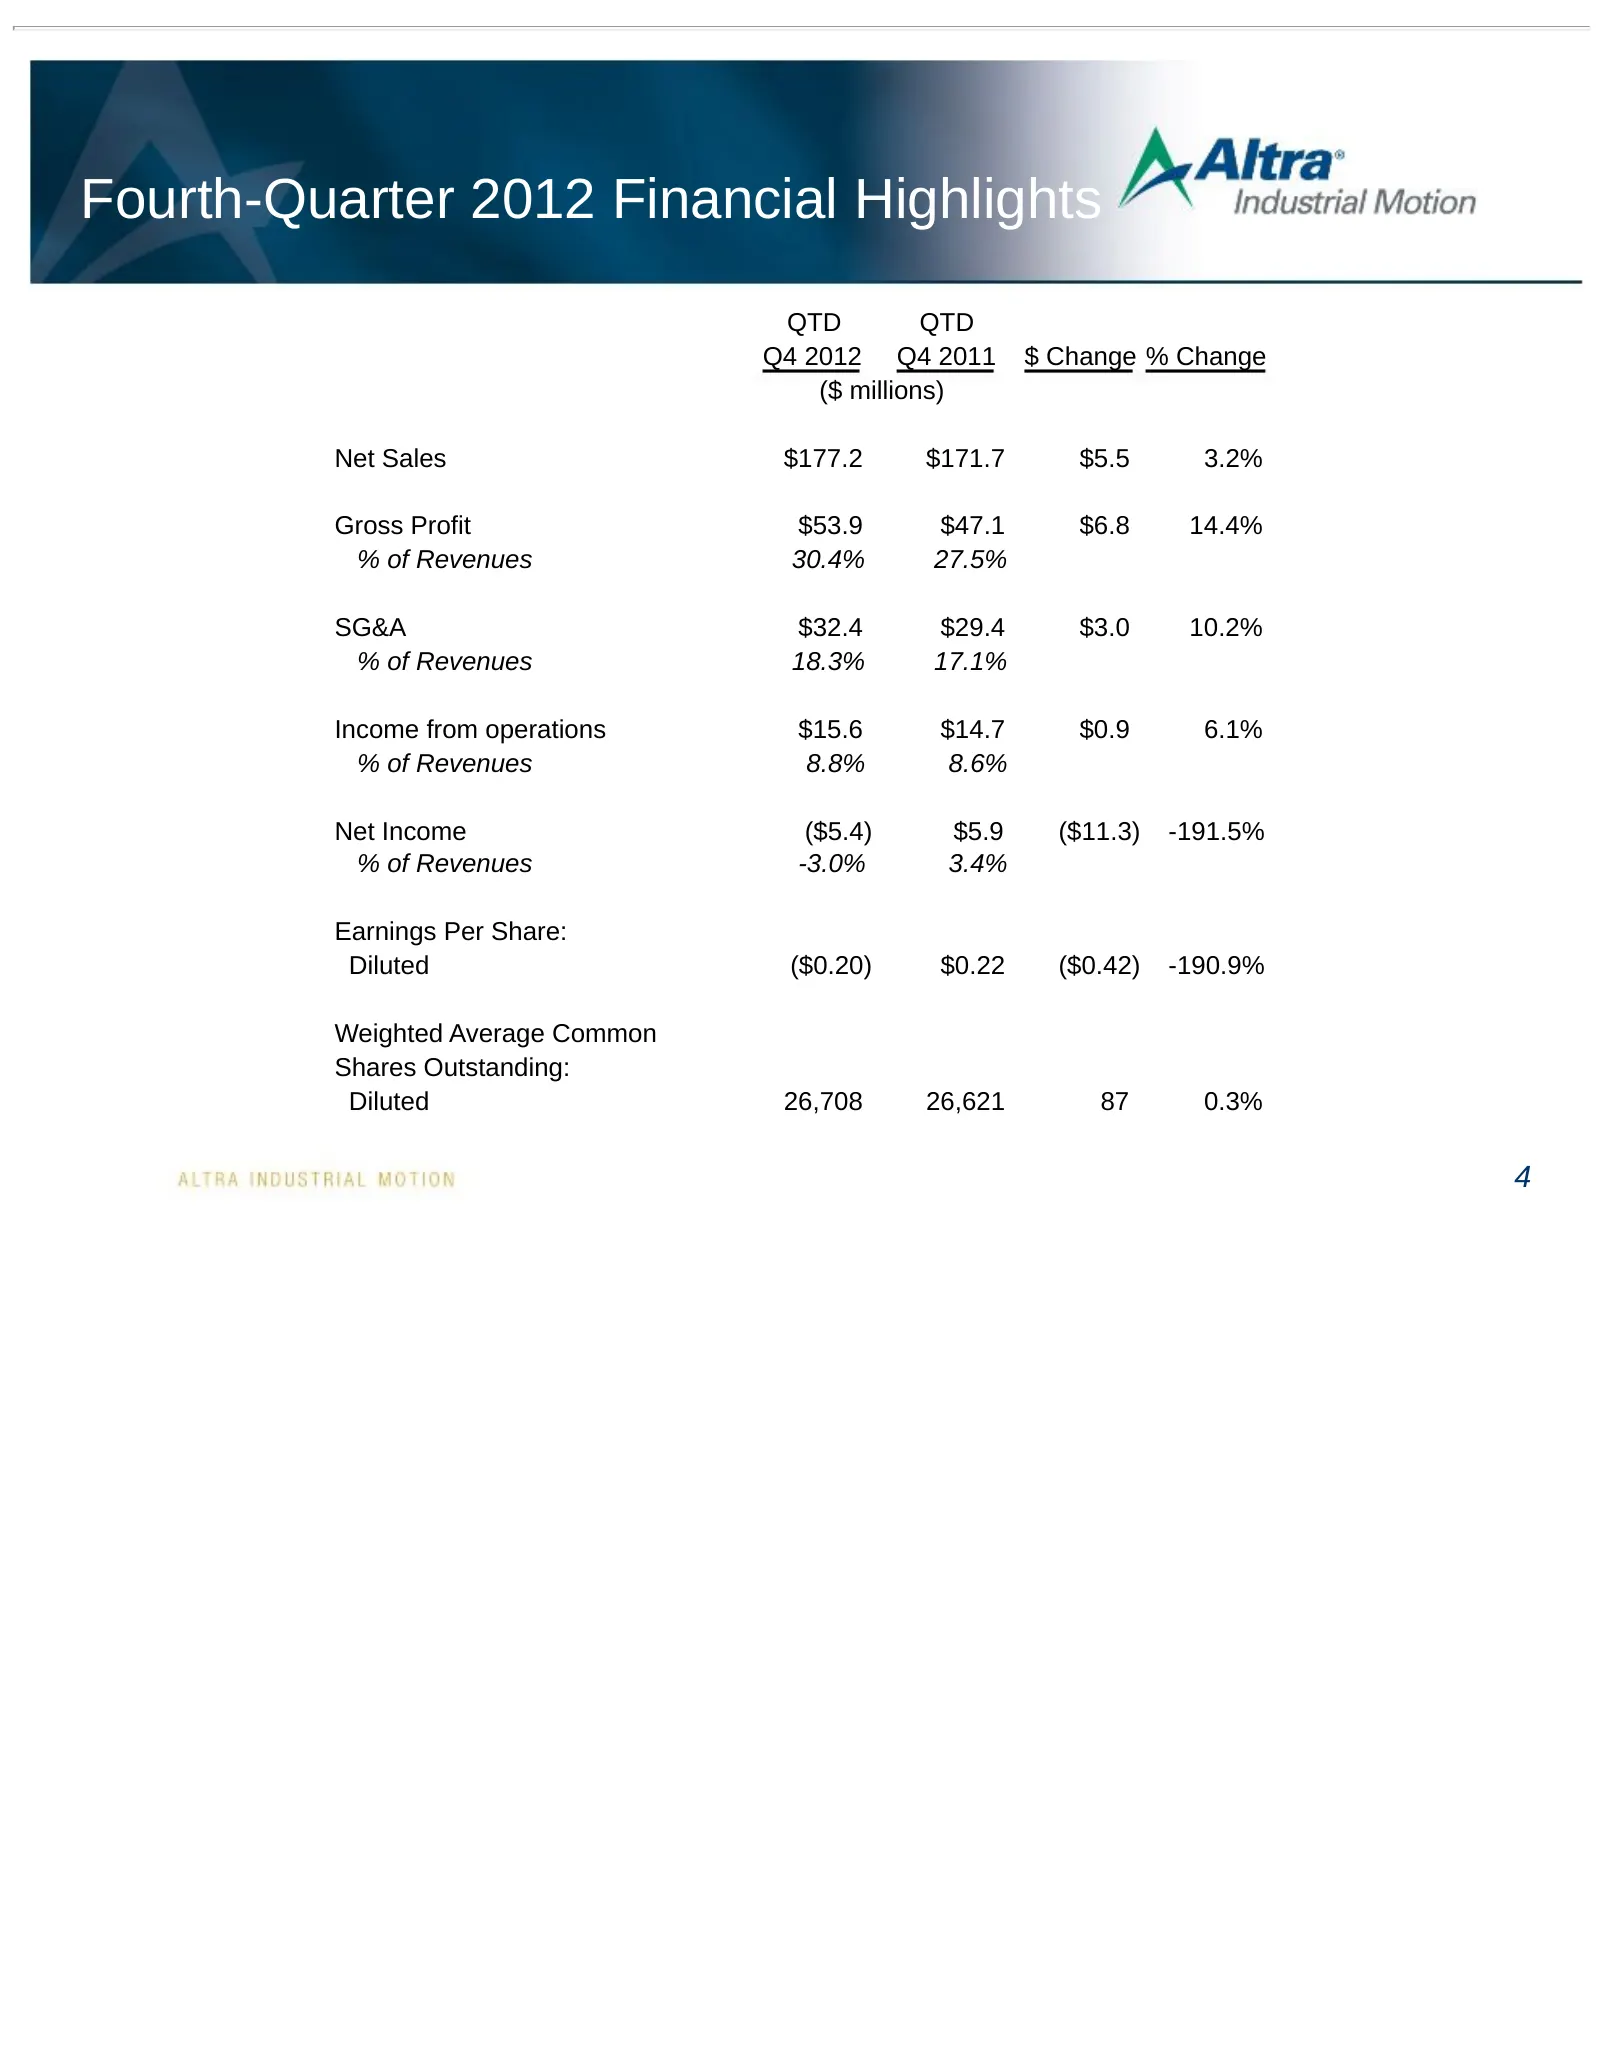
Slide 5: Fourth-Quarter 2012 Financial Highlights
Fourth-Quarter 2012 Financial Highlights QTD QTD Q4 2012 Q4 2011 $ Change % Change ($ millions) Net Sales $177.2 $171.7 $5.5 3.2% Gross Profit $53.9 $47.1 $6.8 14.4% % of Revenues 30.4% 27.5% SG&A $32.4 $29.4 $3.0 10.2% % of Revenues 18.3% 17.1% Income from operations $15.6 $14.7 $0.9 6.1% % of Reve
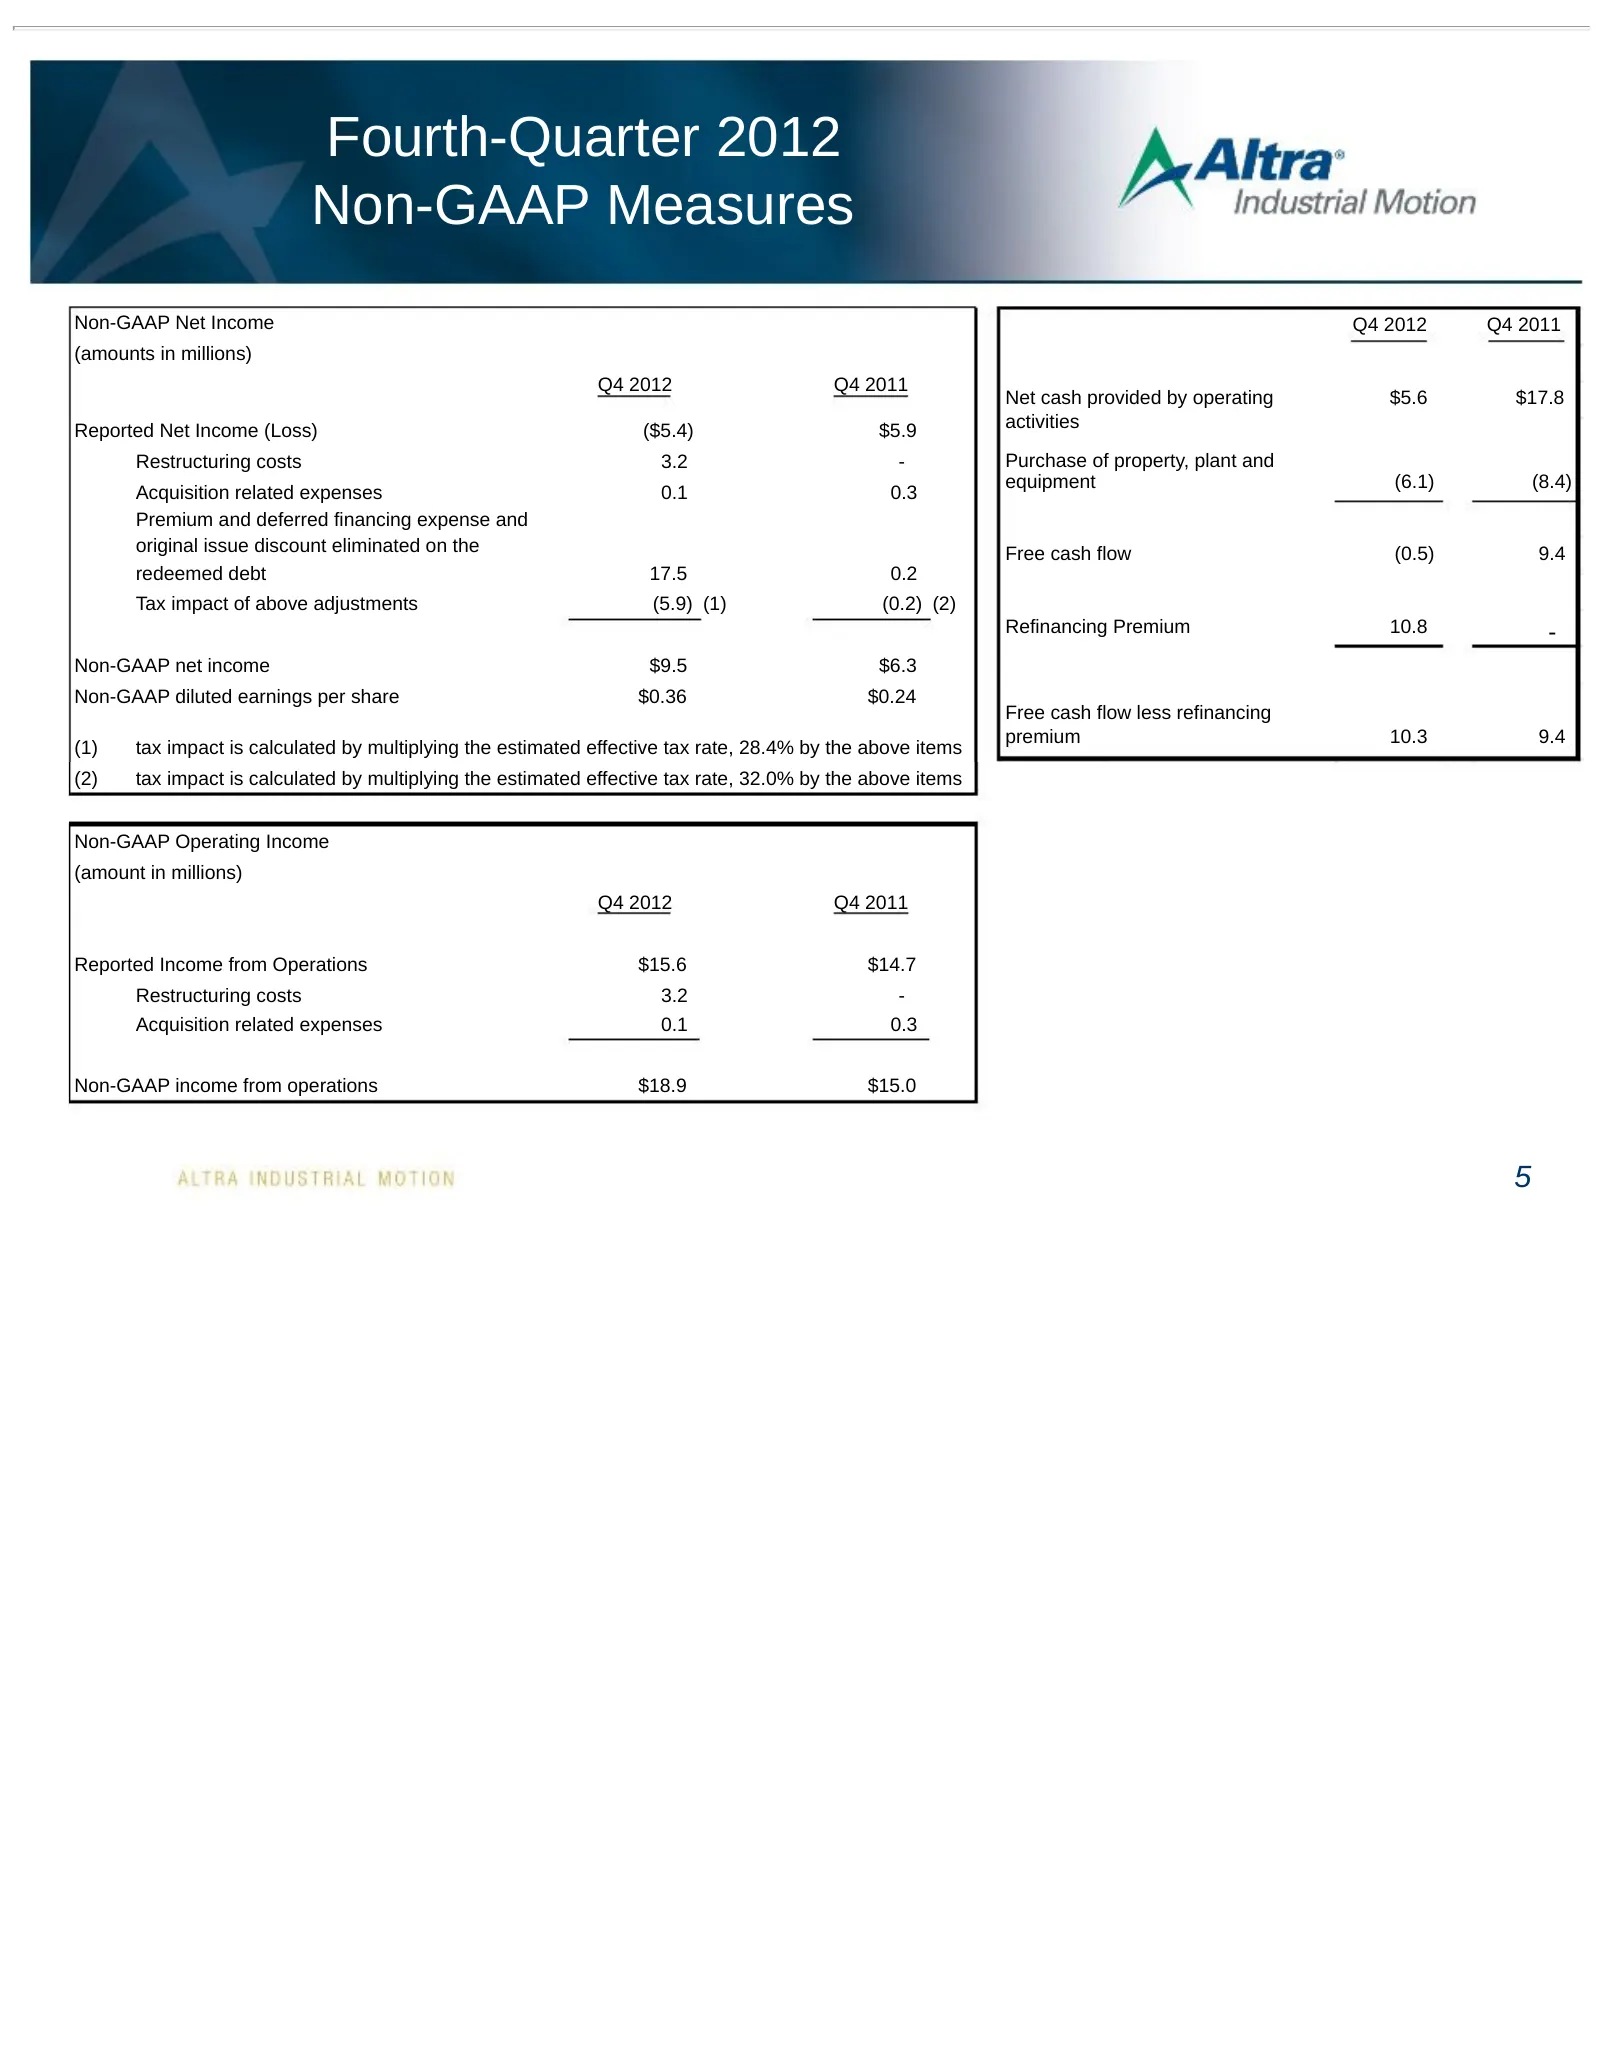
Slide 6: Fourth-Quarter 2012 Non-GAAP Measures
Fourth-Quarter 2012 Non-GAAP Measures Non-GAAP Net Income Q4 2012 Q4 2011 (amounts in millions) Q4 2012 Q4 2011 Net cash provided by operating $5.6 $17.8 activities Reported Net Income (Loss) ($5.4) $5.9 Restructuring costs 3.2 - Purchase of property, plant and equipment (6.1) (8.4) Acquisition rela
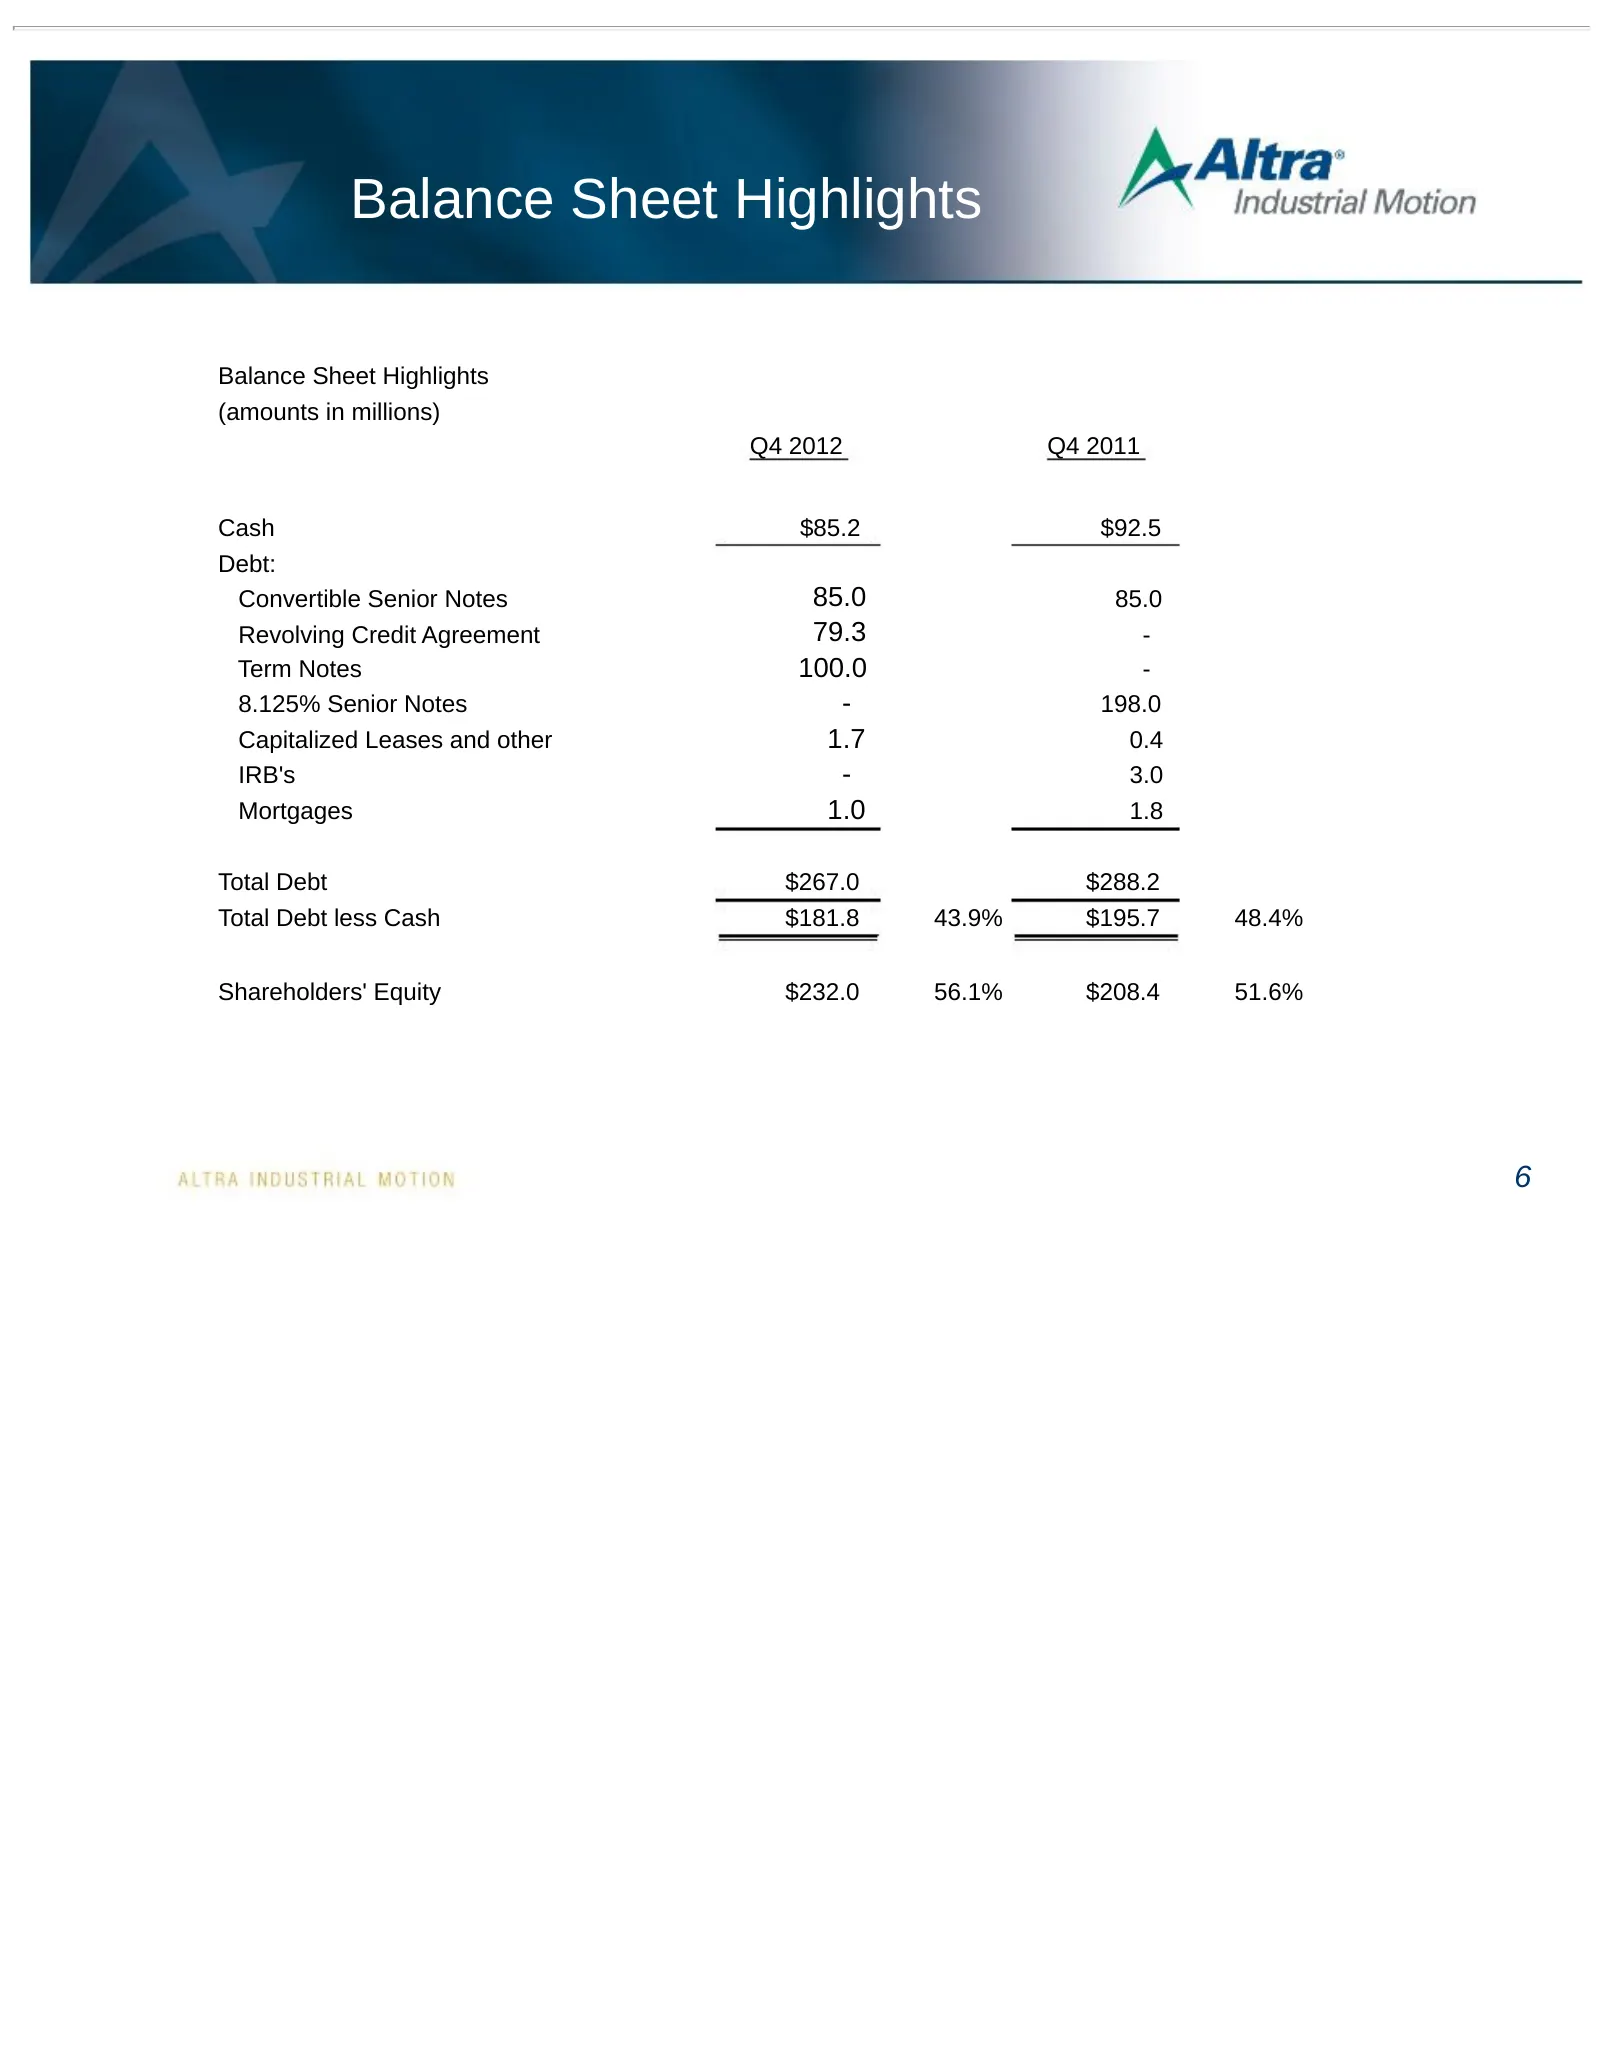
Slide 7: Balance Sheet Highlights
Balance Sheet Highlights Balance Sheet Highlights (amounts in millions) Q4 2012 Q4 2011 Cash $85.2 $92.5 Debt: Convertible Senior Notes 85.0 85.0 Revolving Credit Agreement 79.3 - Term Notes 100.0 - 8.125% Senior Notes - 198.0 Capitalized Leases and other 1.7 0.4 IRB's - 3.0 Mortgages 1.0 1.8 Total
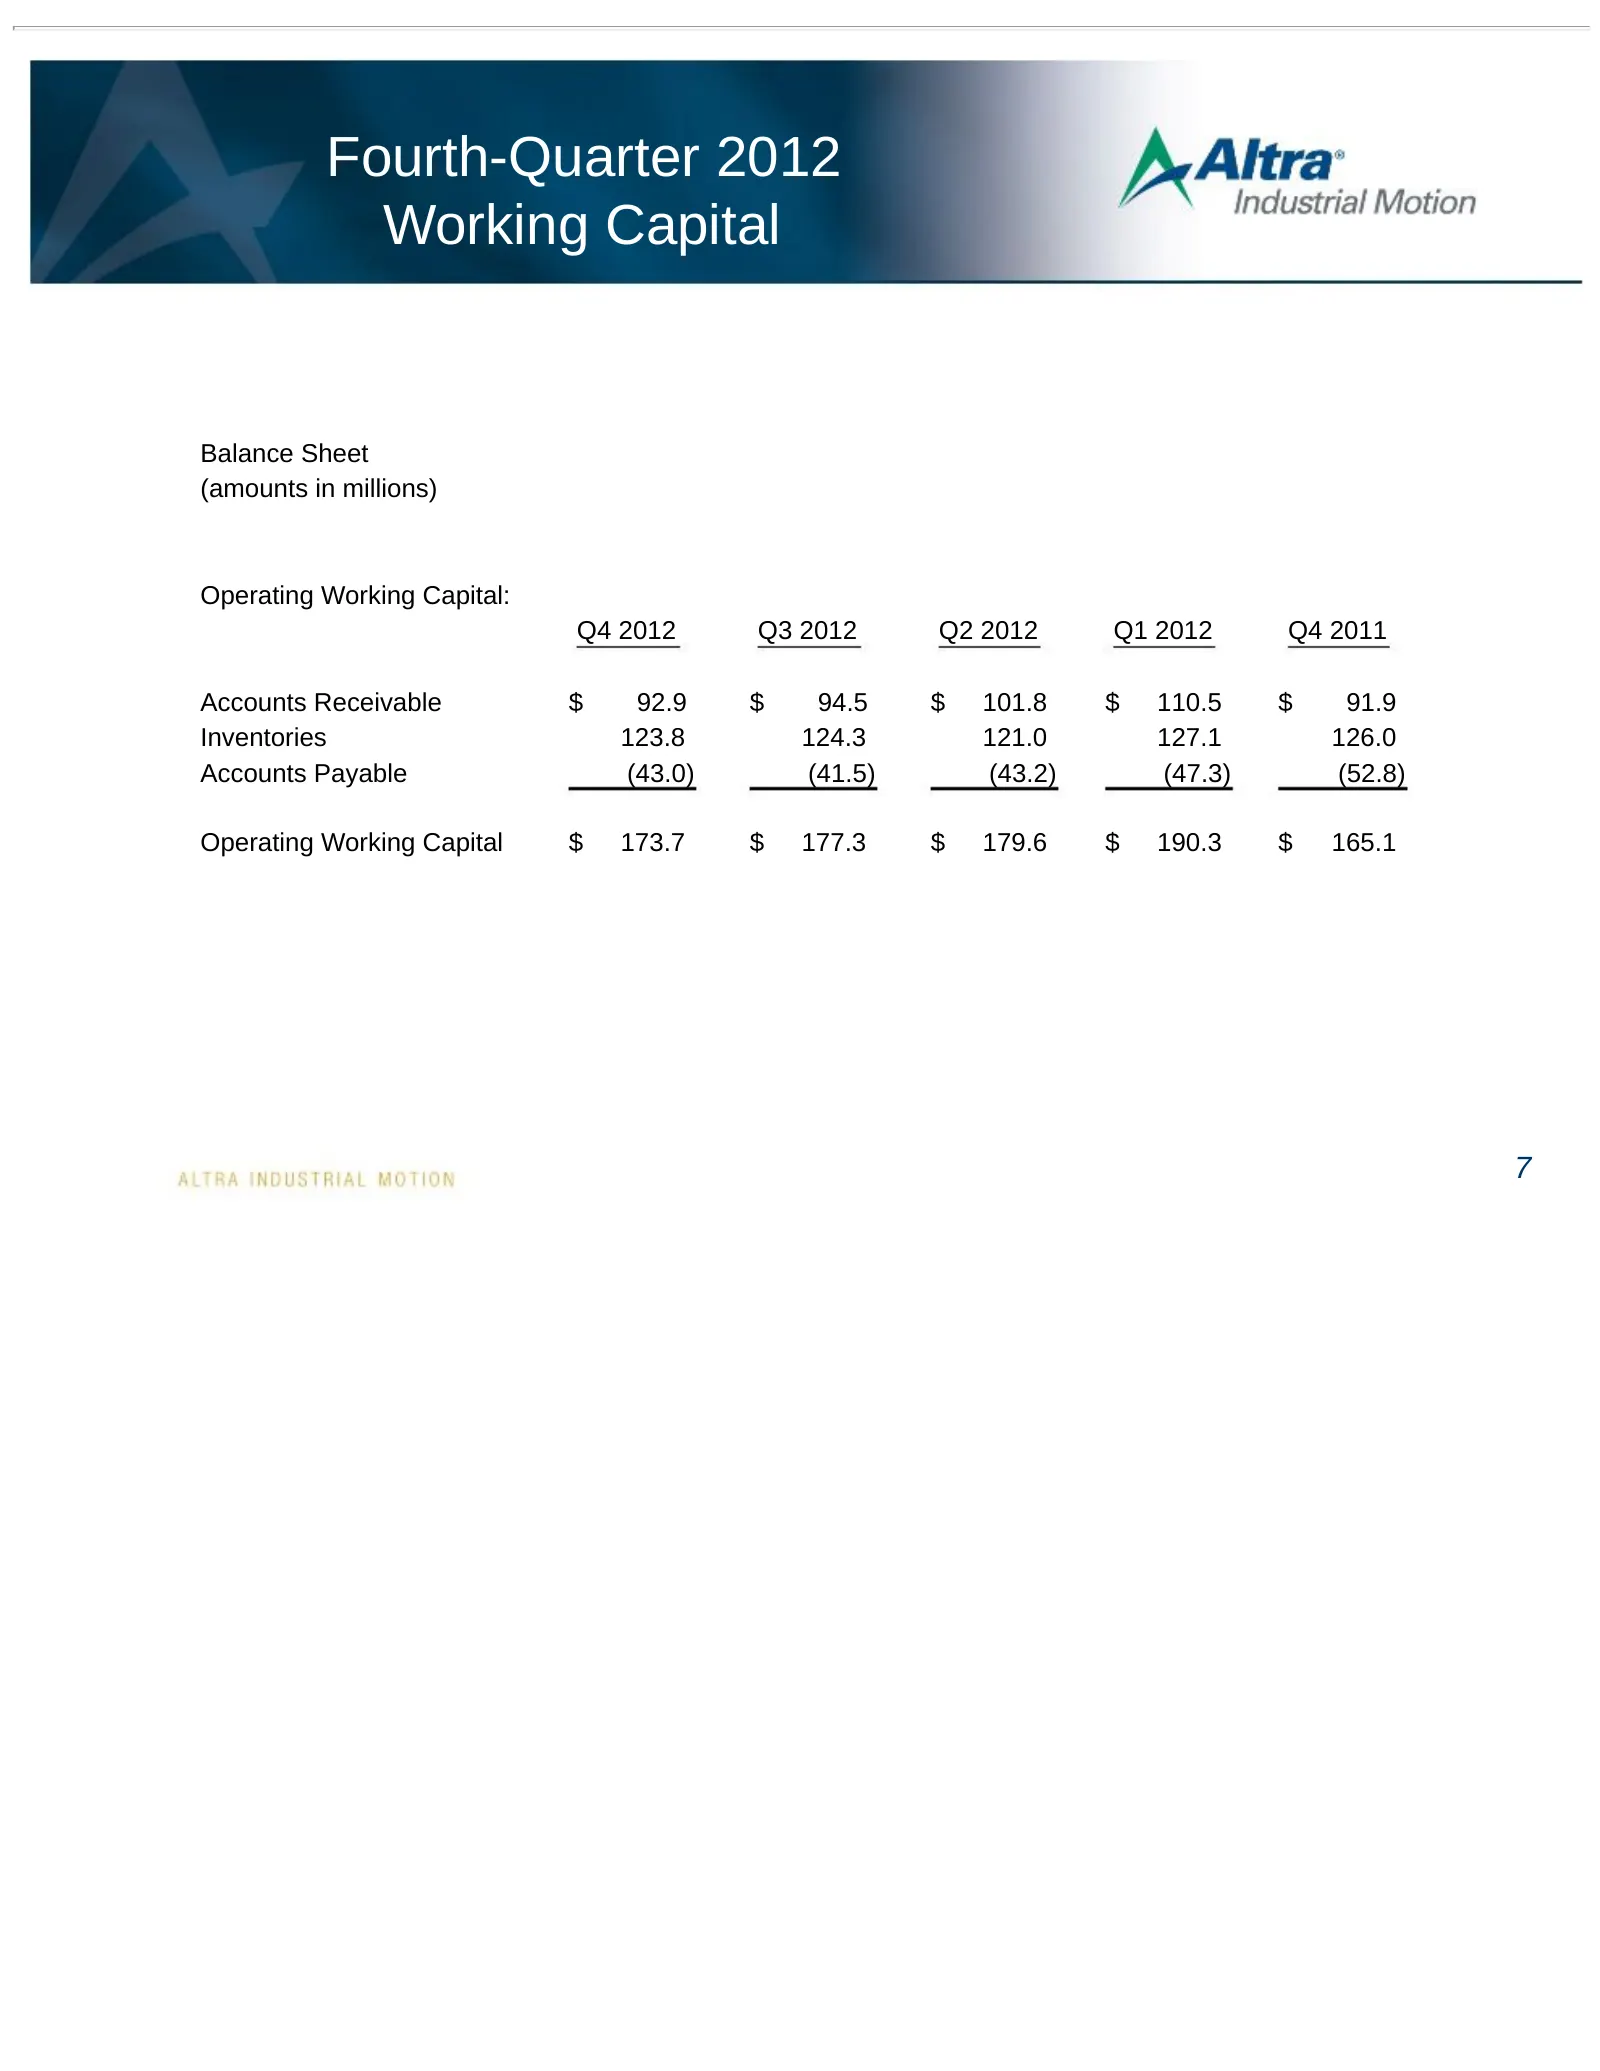
Slide 8: Fourth-Quarter 2012 Working Capital
Fourth-Quarter 2012 Working Capital Balance Sheet (amounts in millions) Operating Working Capital: Q4 2012 Q3 2012 Q2 2012 Q1 2012 Q4 2011 Accounts Receivable $ 92.9 $ 94.5 $ 101.8 $ 110.5 $ 91.9 Inventories 123.8 124.3 121.0 127.1 126.0 Accounts Payable (43.0) (41.5) (43.2) (47.3) (52.8) Operating
Slide 9: 2013 Outlook
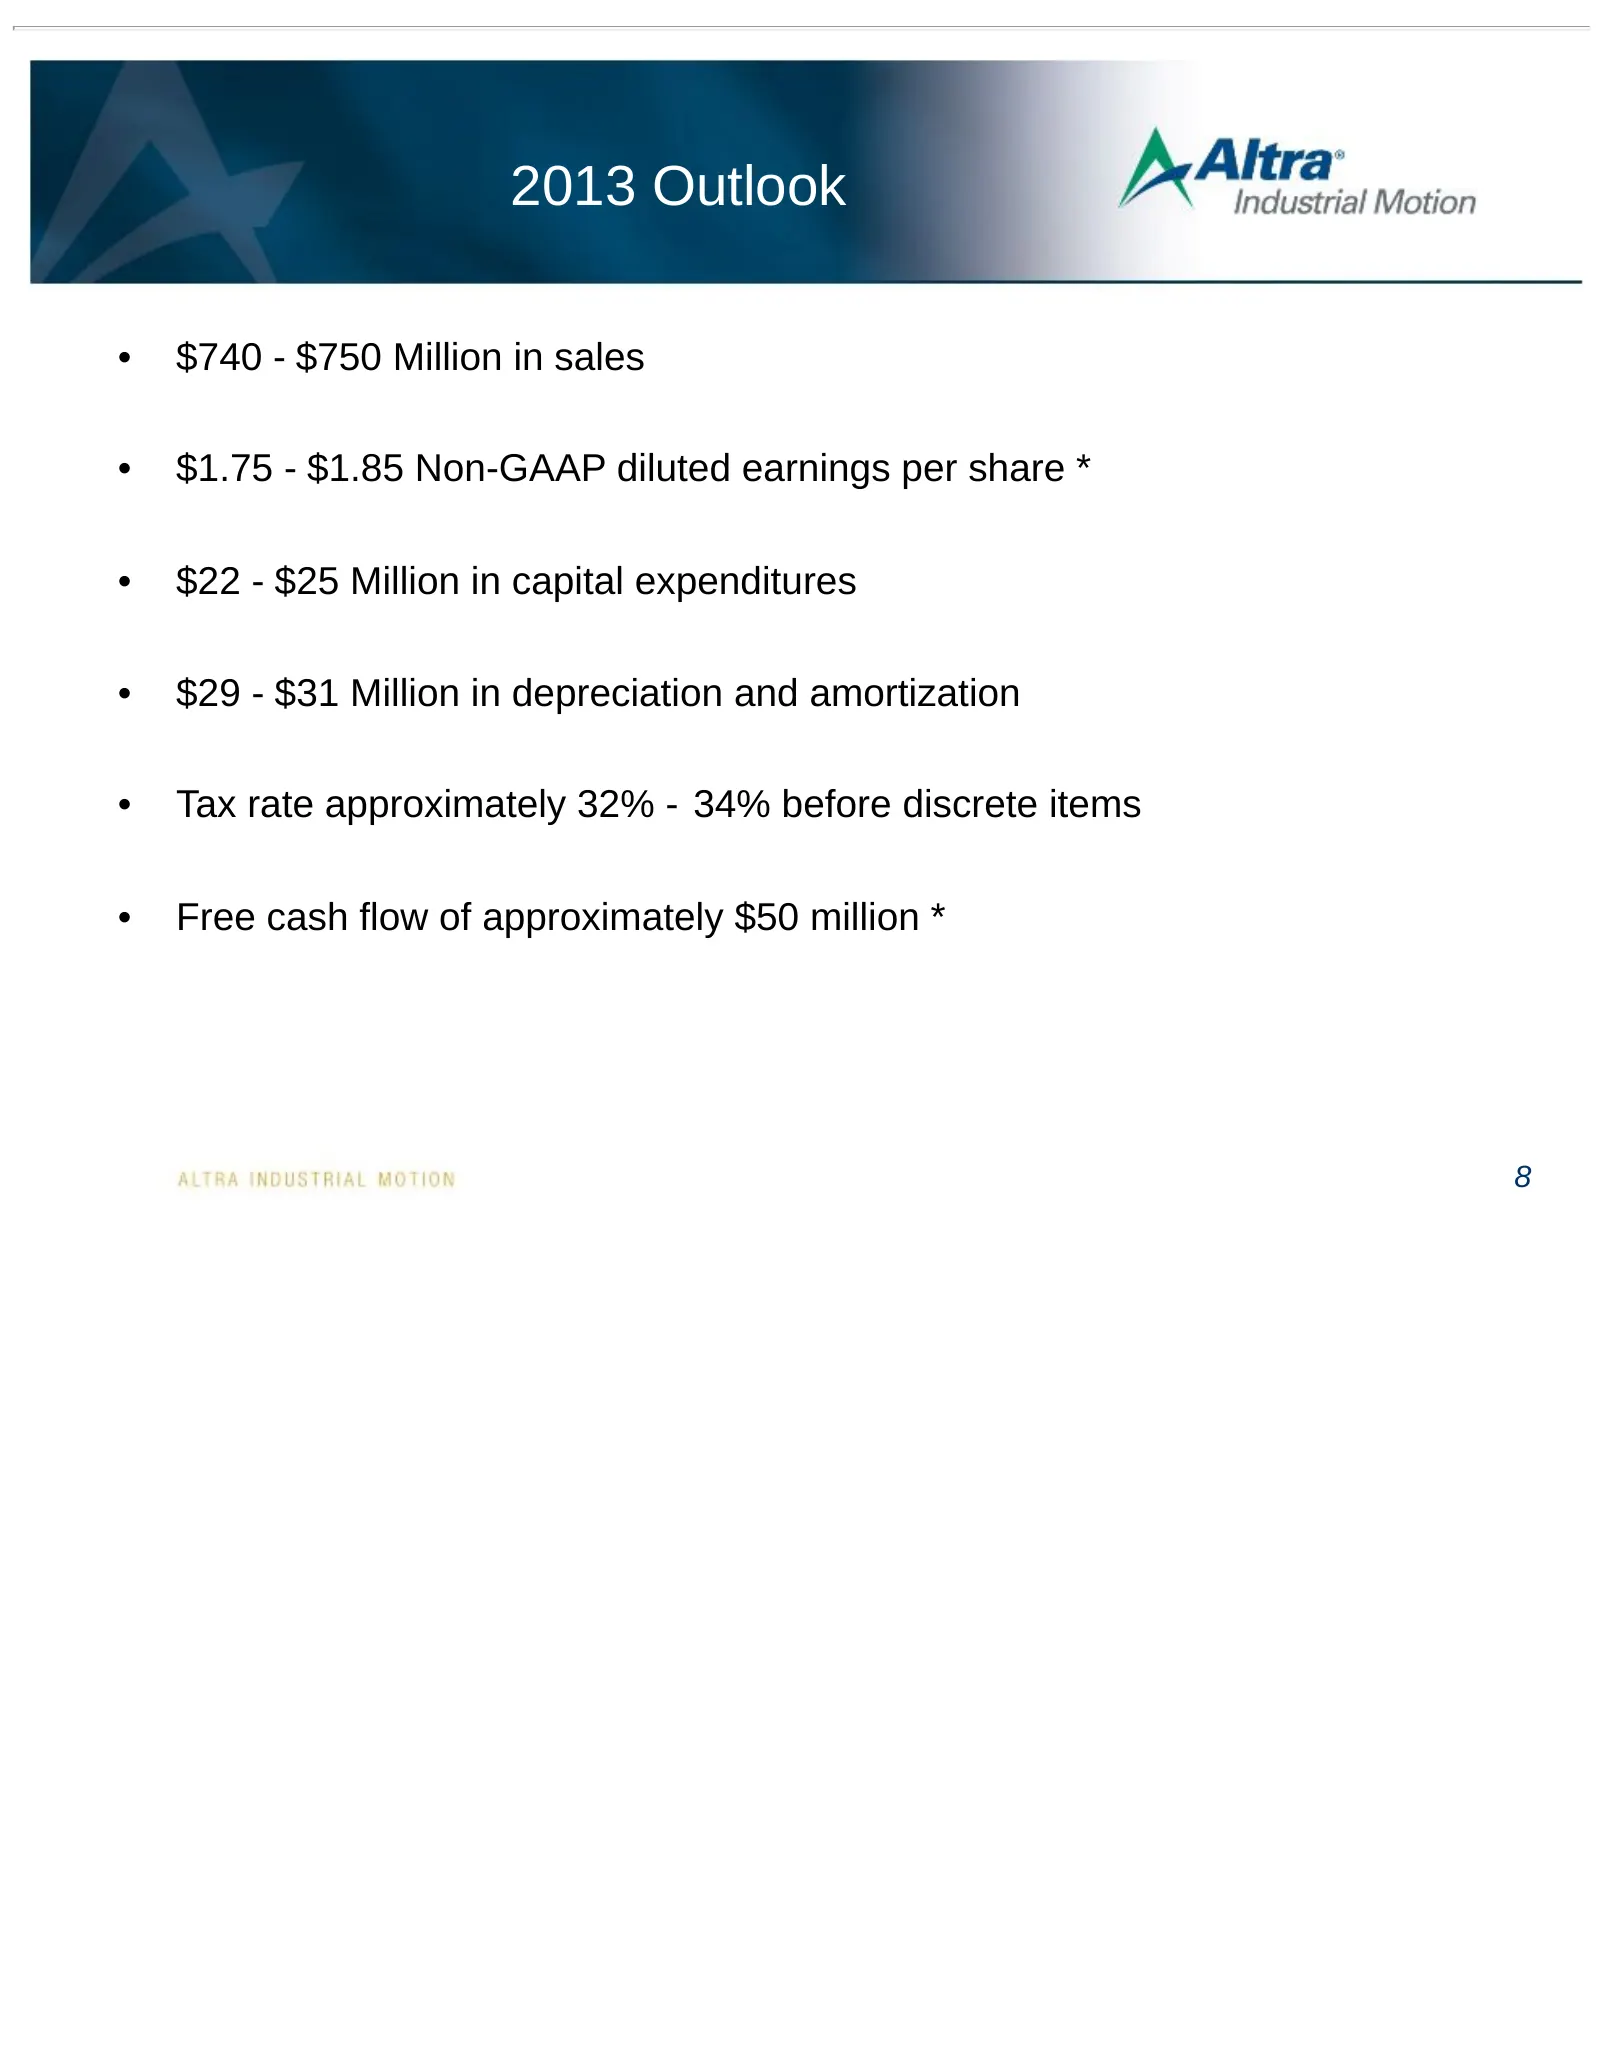
2013 Outlook • $740 - $750 Million in sales • $1.75 - $1.85 Non-GAAP diluted earnings per share * • $22 - $25 Million in capital expenditures • $29 - $31 Million in depreciation and amortization • Tax rate approximately 32% - 34% before discrete items • Free cash flow of approximately $50 million *
Slide 10: Summary
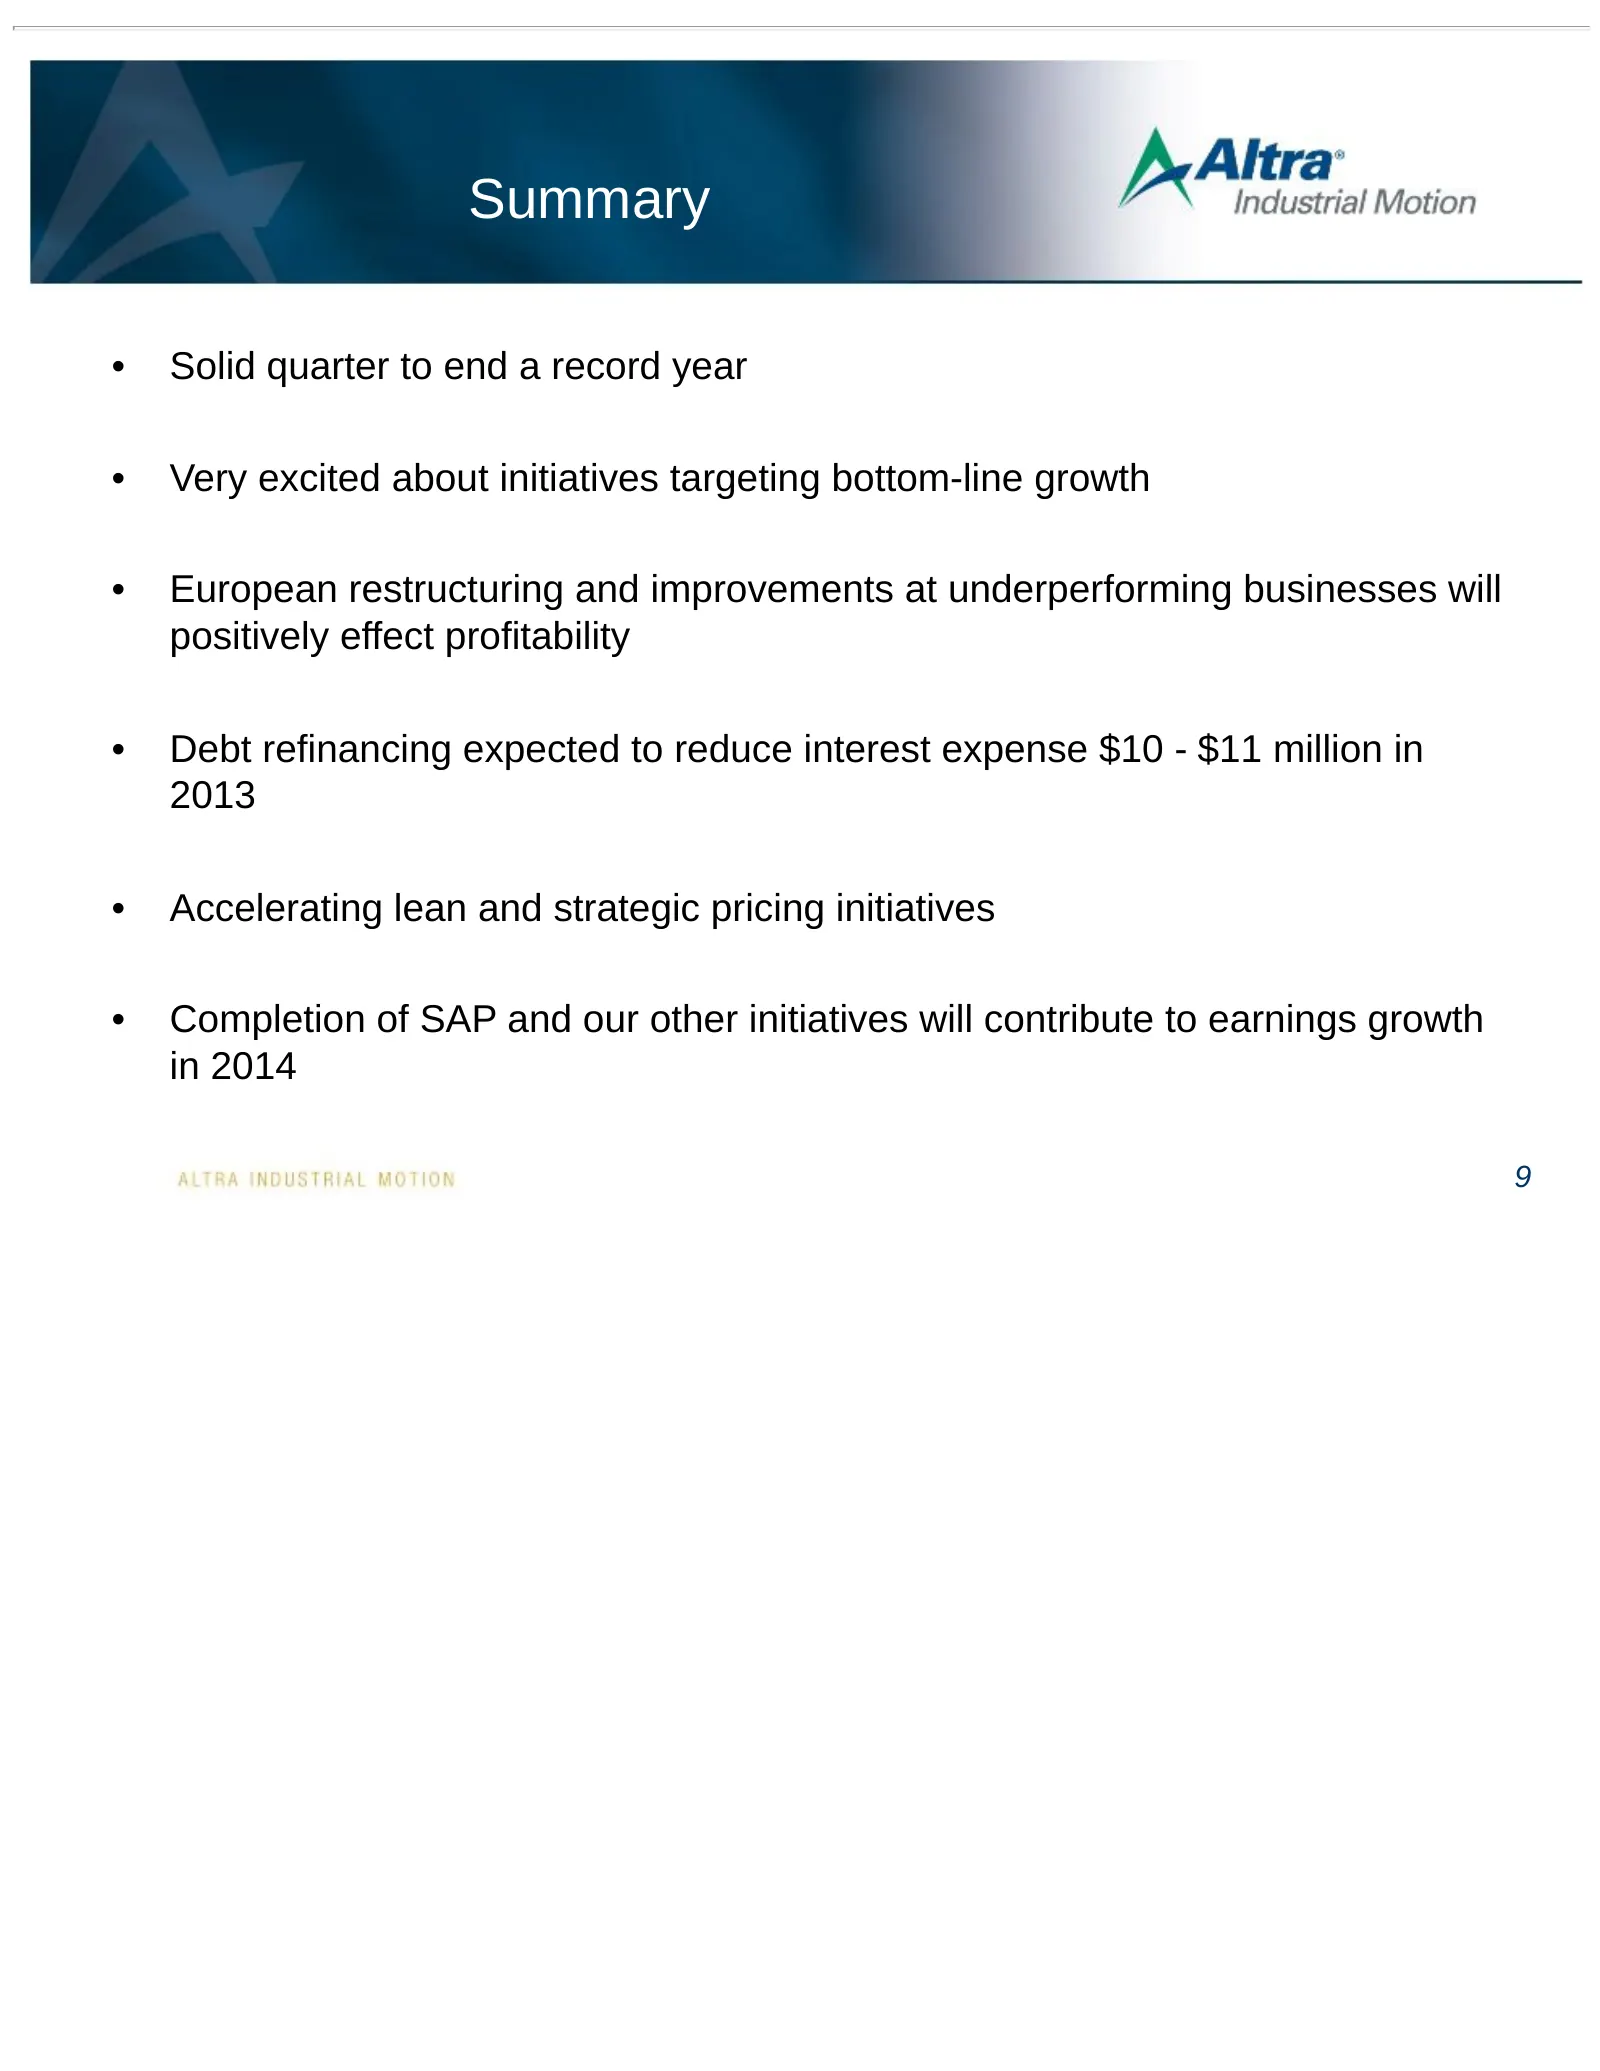
Summary • Solid quarter to end a record year • Very excited about initiatives targeting bottom-line growth • European restructuring and improvements at underperforming businesses will positively effect profitability • Debt refinancing expected to reduce interest expense $10 - $11 million in 2013 • A
Slide 11: Discussion of Non-GAAP Measures
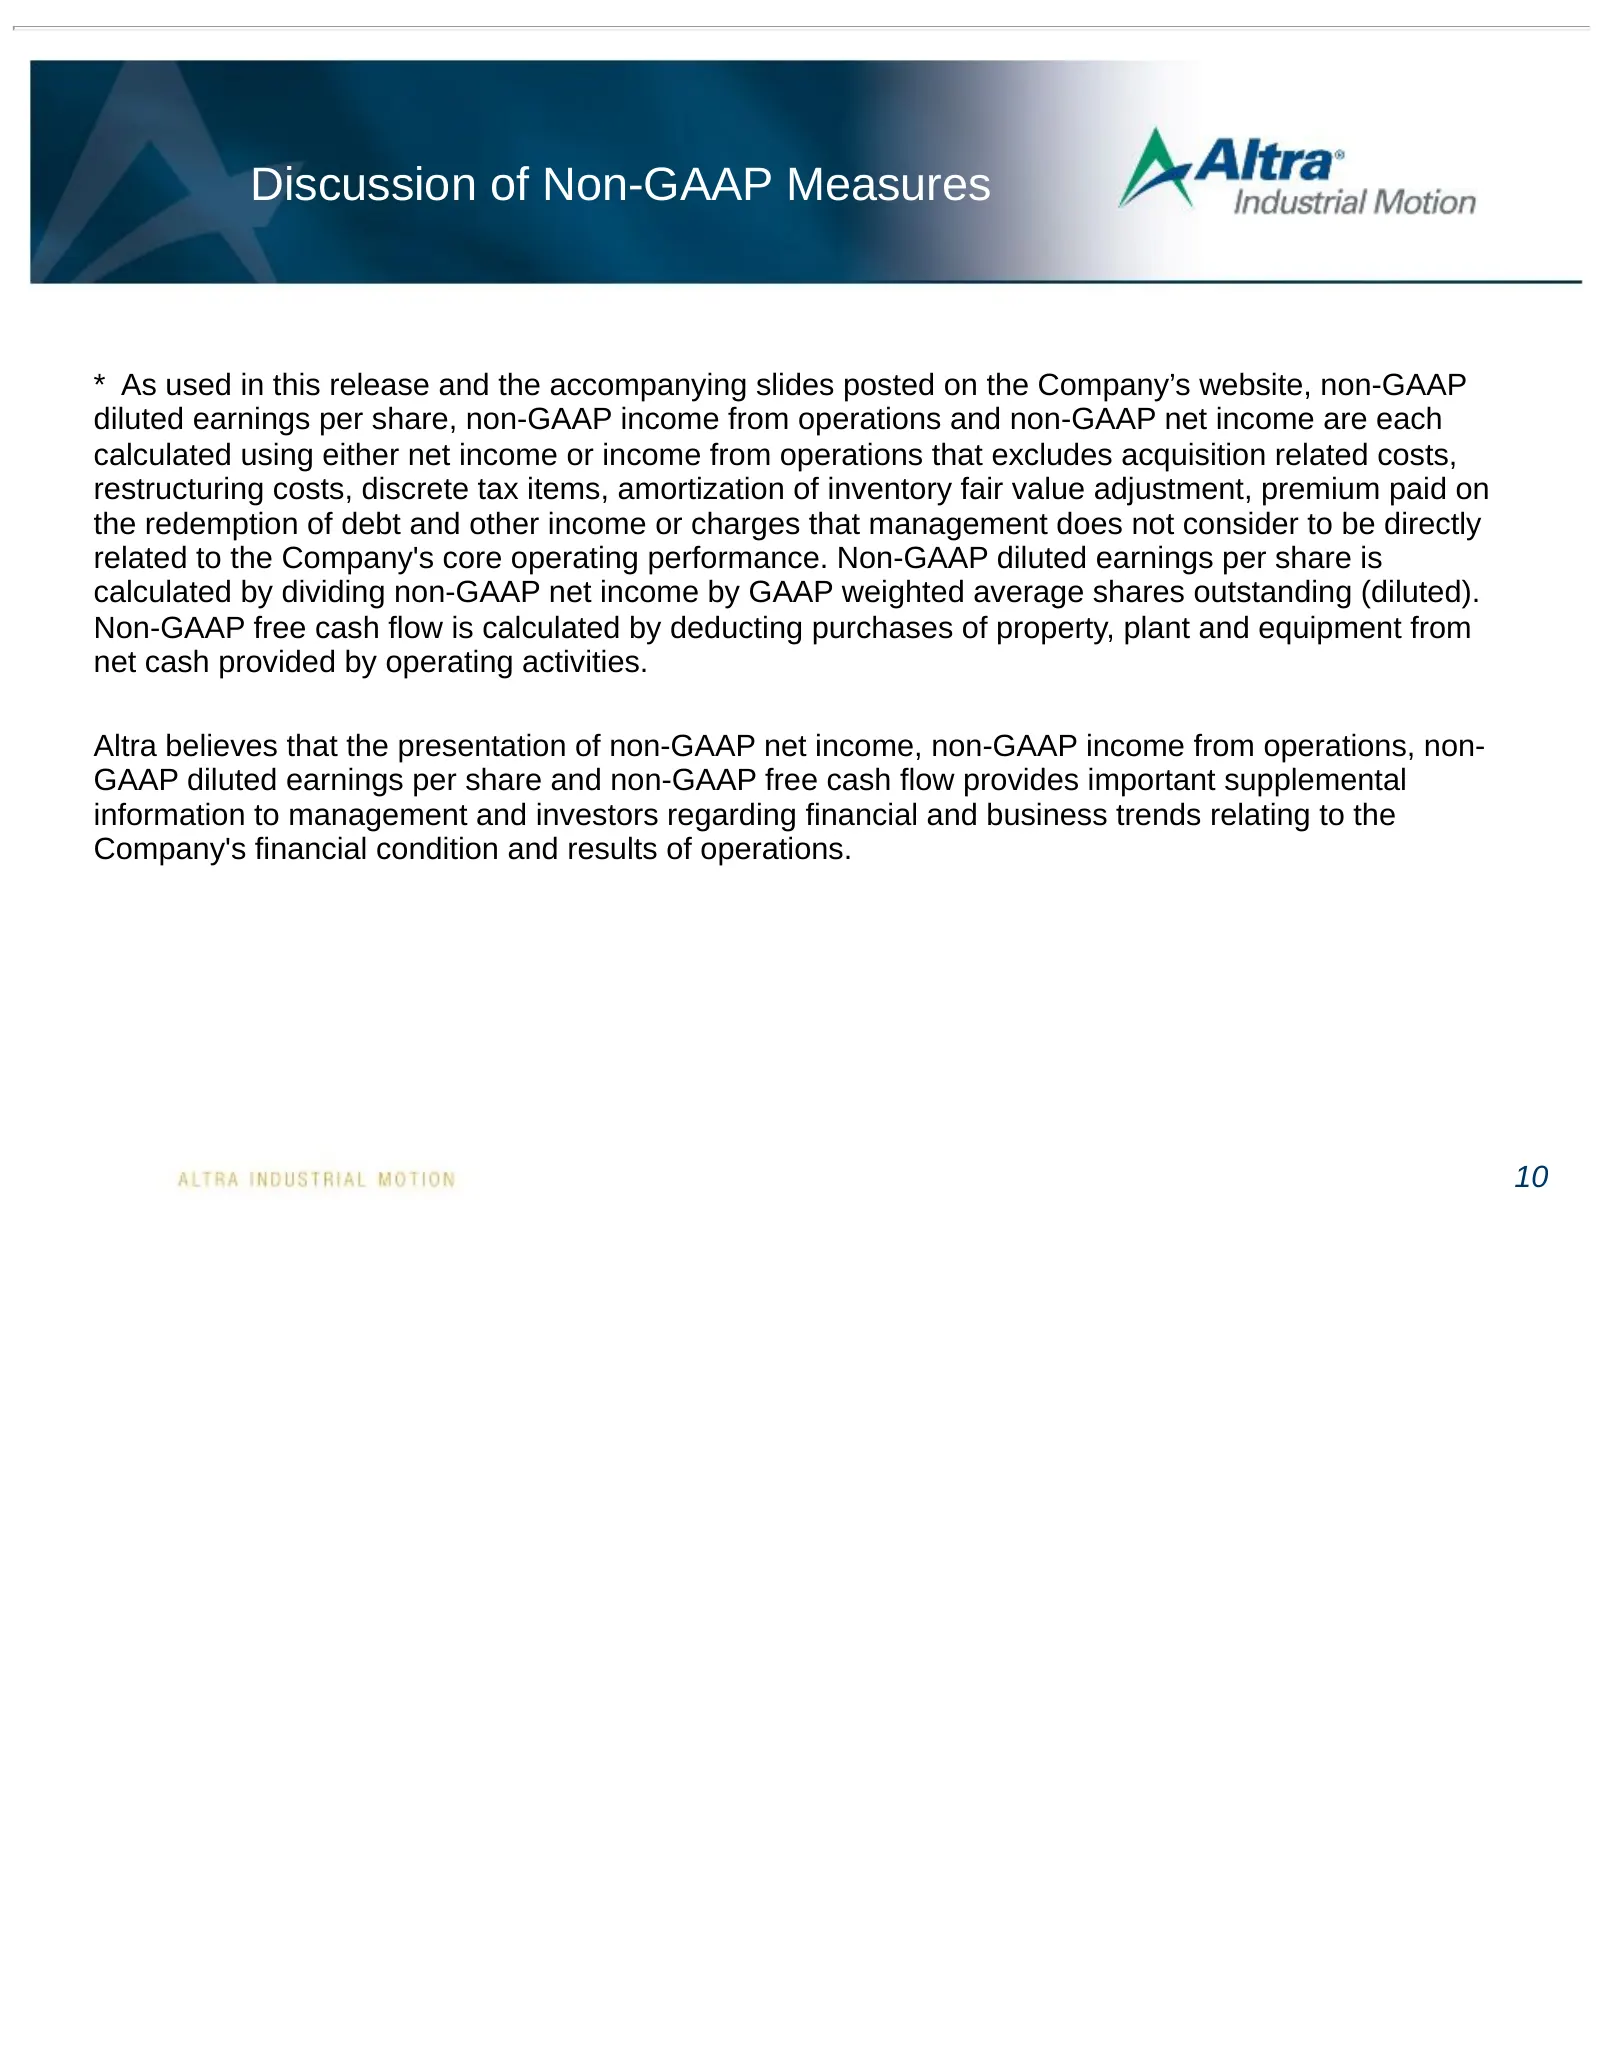
Discussion of Non-GAAP Measures * As used in this release and the accompanying slides posted on the Company’s website, non-GAAP diluted earnings per share, non-GAAP income from operations and non-GAAP net income are each calculated using either net income or income from operations that excludes acqu
Source: SEC EDGAR · 8-K filed Feb 14, 2013
More decks from Altra Industrial Motion Corp
 Q2 2022 Earnings Presentation25 slides · Jul 28, 2022
 Q1 2022 Earnings Presentation25 slides · Apr 28, 2022
 Investor Day (March 2022)135 slides · Mar 11, 2022
 Q4 2021 Earnings Presentation17 slides · Feb 16, 2022
 Q3 2021 Earnings Presentation16 slides · Oct 22, 2021
 Q2 2021 Earnings Presentation16 slides · Jul 23, 2021