Veritex — Non-Deal Roadshow (August 2021)
31 slides from Veritex's roadshow presentation, Aug 31, 2021
Slide 1: Veritex Holdings, Inc. 3rd Quarter 2021 Investor Meetings
Veritex Holdings, Inc. 3rd Quarter, 2021 Investor Meetings Exhibit 99.1
Slide 2: Franchise Overview
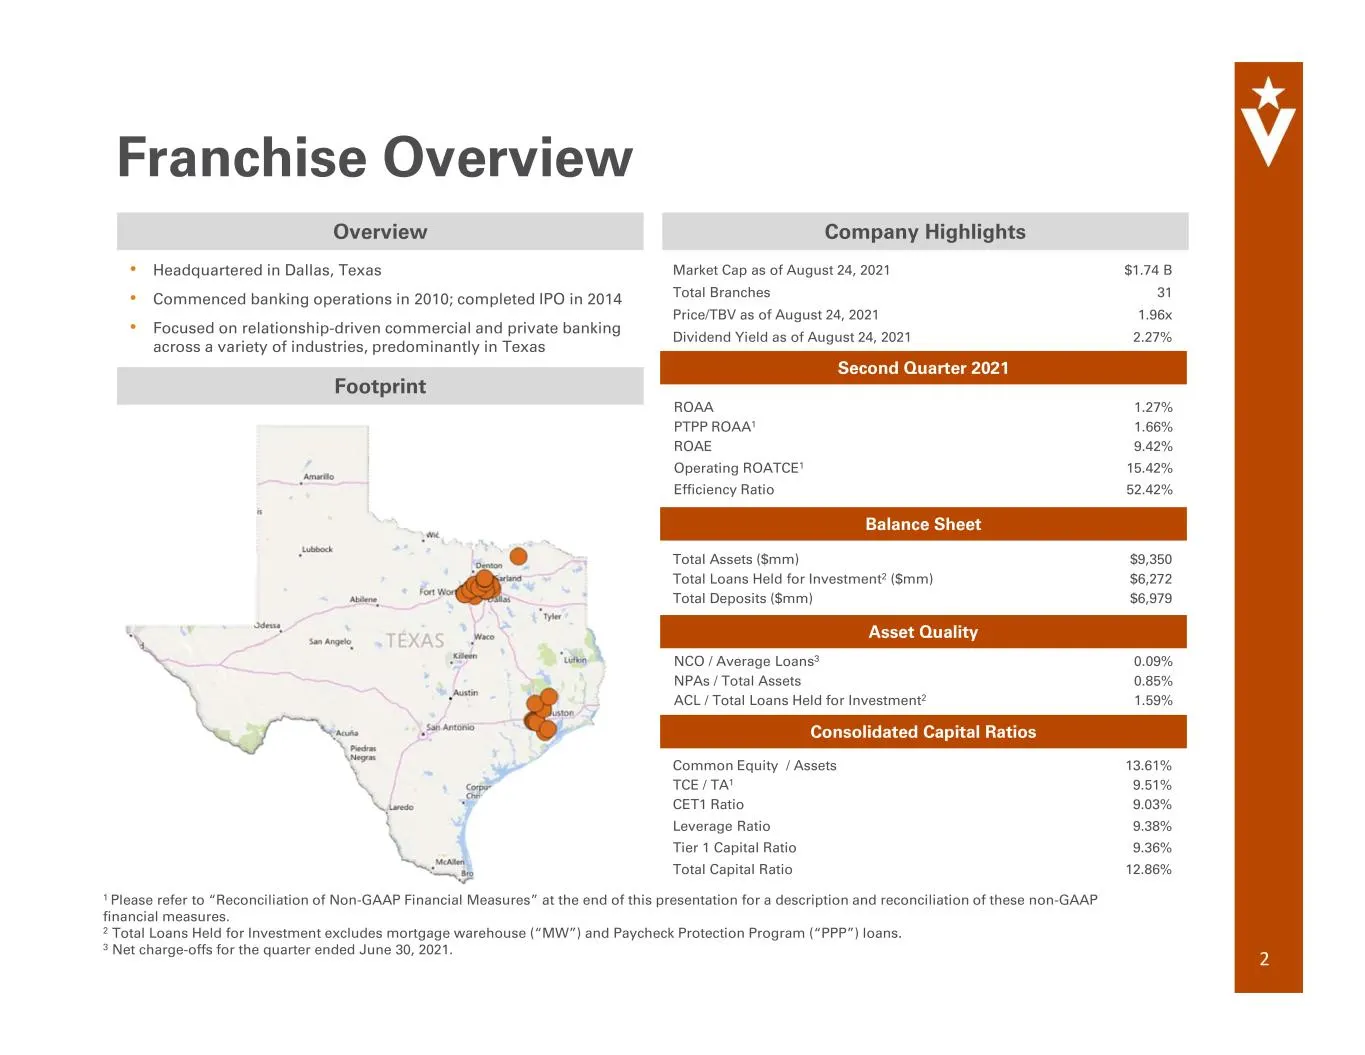
2 Franchise Overview • Headquartered in Dallas, Texas • Commenced banking operations in 2010; completed IPO in 2014 • Focused on relationship-driven commercial and private banking across a variety of industries, predominantly in Texas Overview Footprint Company Highlights Balance Sheet Asset Quality
Slide 3: Investment Thesis
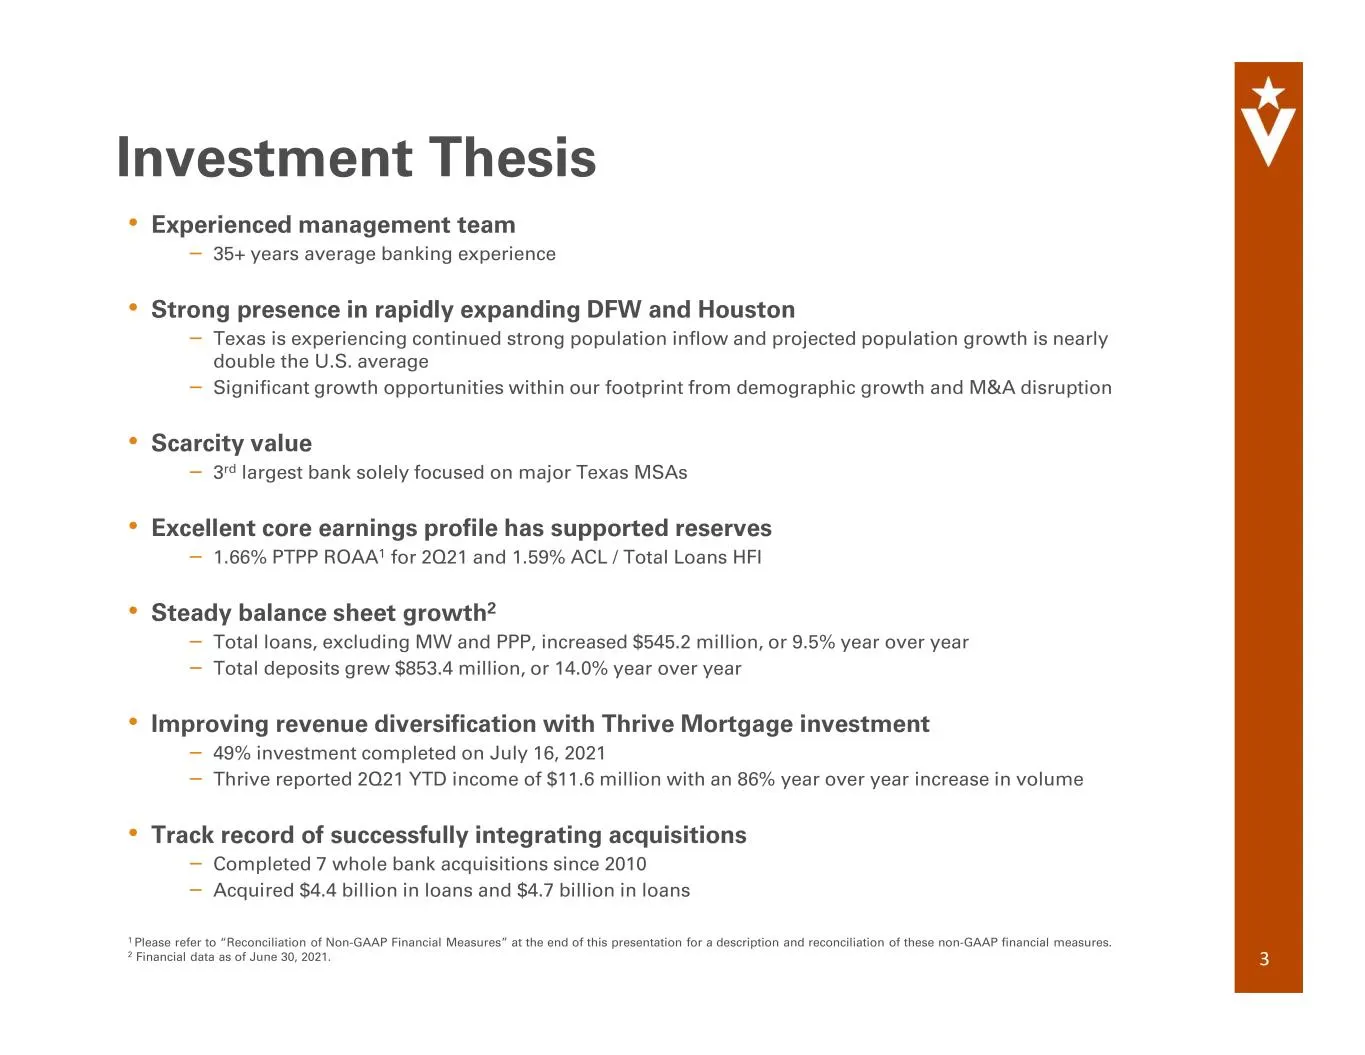
3 Investment Thesis • Experienced management team – 35+ years average banking experience • Strong presence in rapidly expanding DFW and Houston – Texas is experiencing continued strong population inflow and projected population growth is nearly double the U.S. average – Significant growth opportunit
Slide 4: Scarcity Value in Texas Metro Markets
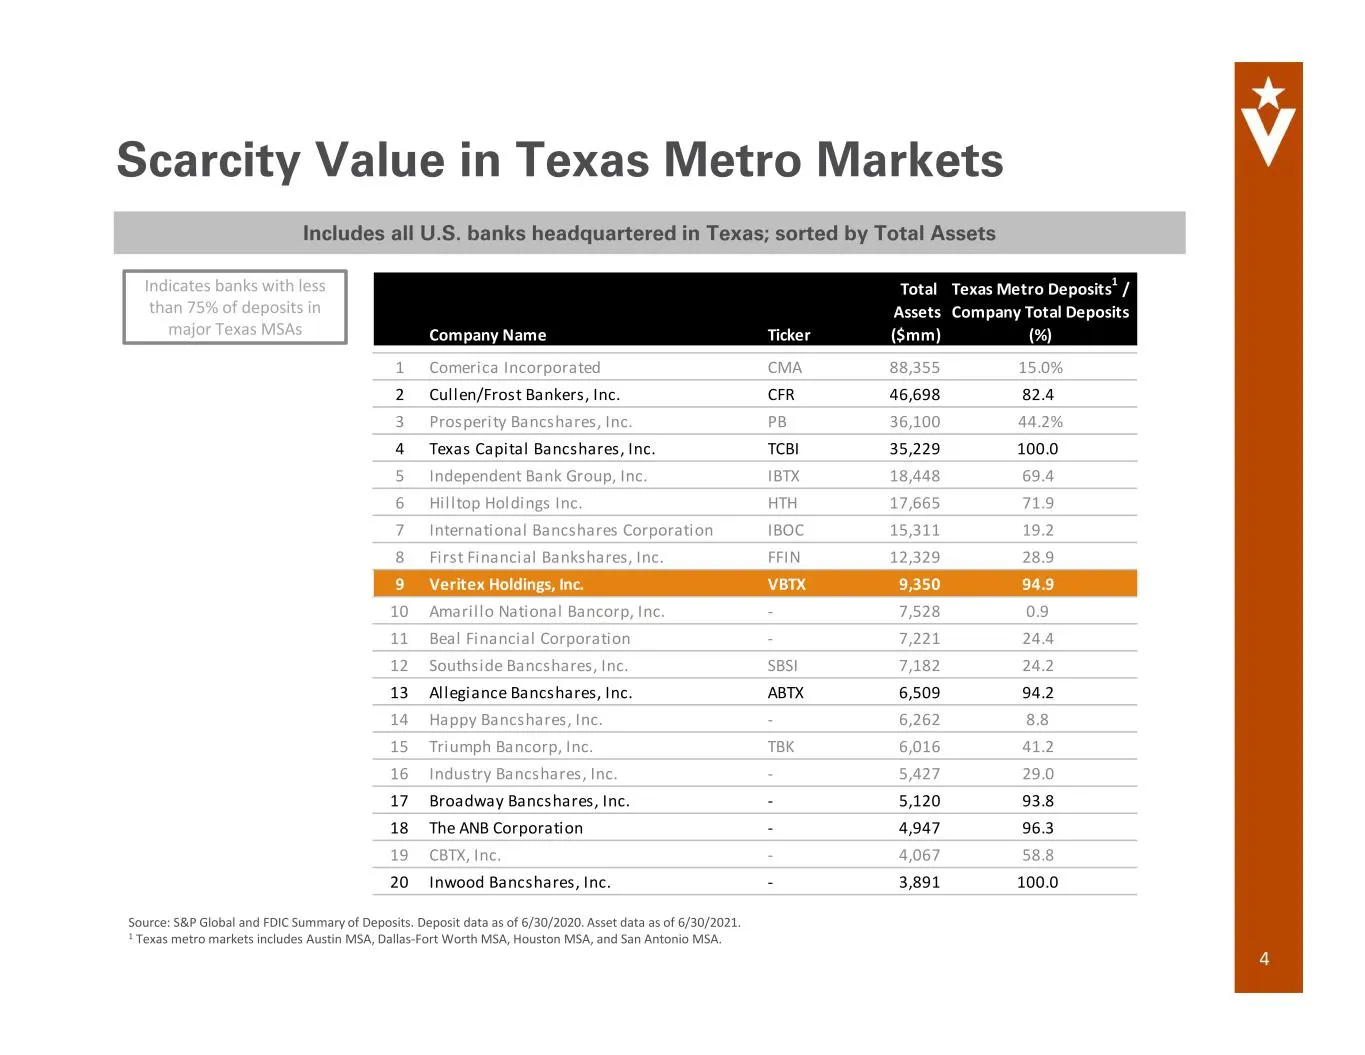
4 Scarcity Value in Texas Metro Markets Includes all U.S. banks headquartered in Texas; sorted by Total Assets Indicates banks with less than 75% of deposits in major Texas MSAs Total Texas Metro Deposits1 / Assets Company Total Deposits Company Name Ticker ($mm) (%) 1 Comerica Incorporated CMA 88,3
Slide 5: Well Positioned in Attractive Texas Markets
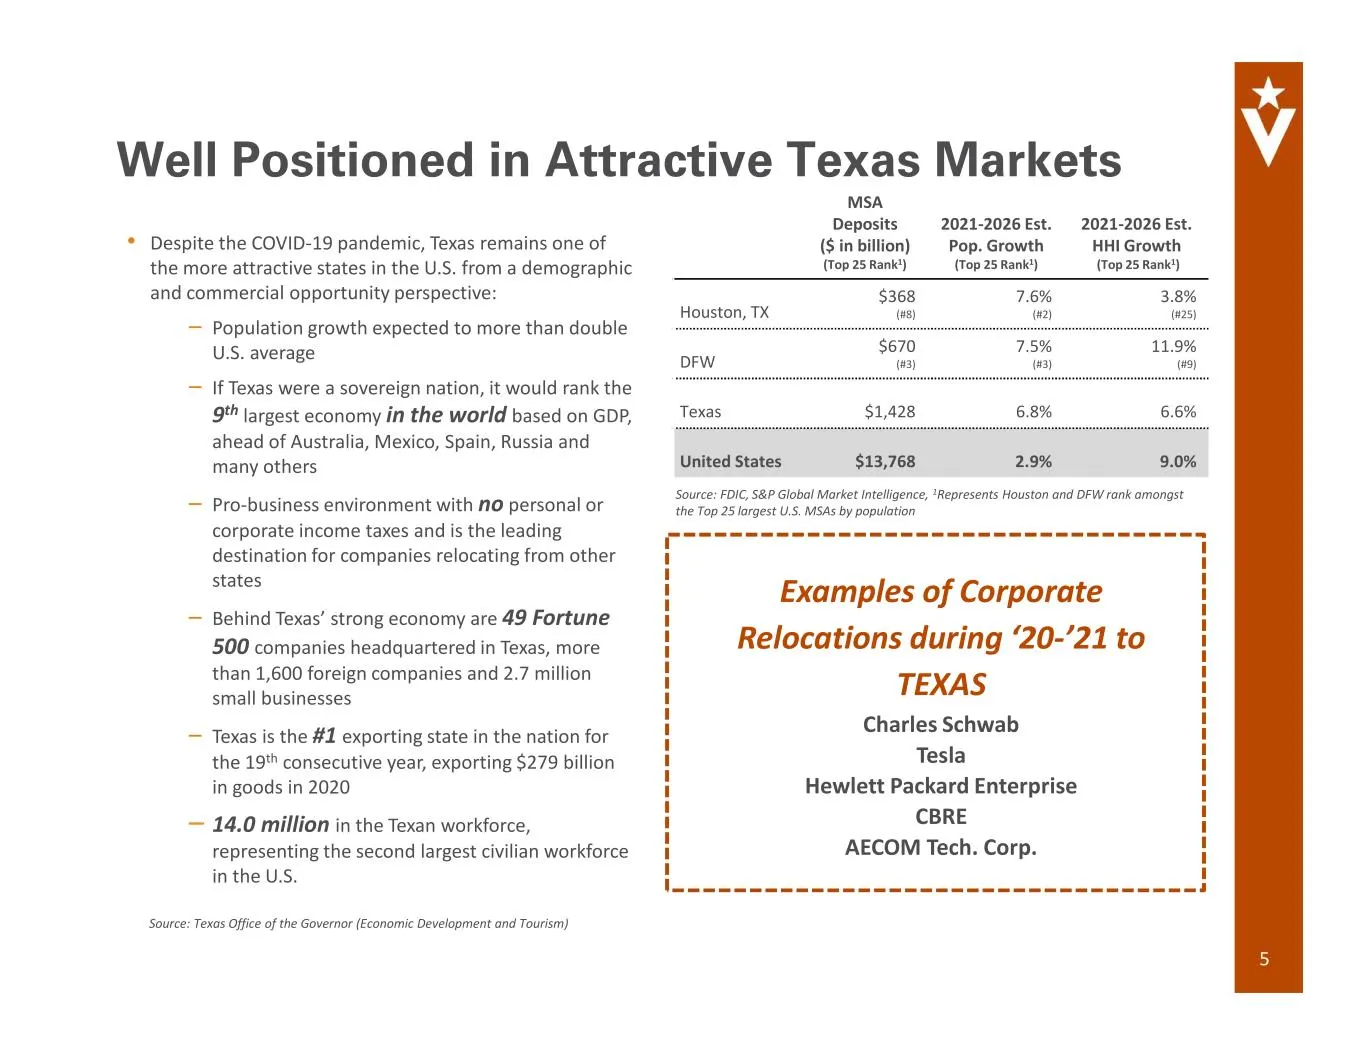
5 Well Positioned in Attractive Texas Markets • Despite the COVID-19 pandemic, Texas remains one of the more attractive states in the U.S. from a demographic and commercial opportunity perspective: – Population growth expected to more than double U.S. average – If Texas were a sovereign nation, it w
Slide 6: Well Positioned in Attractive Texas Markets
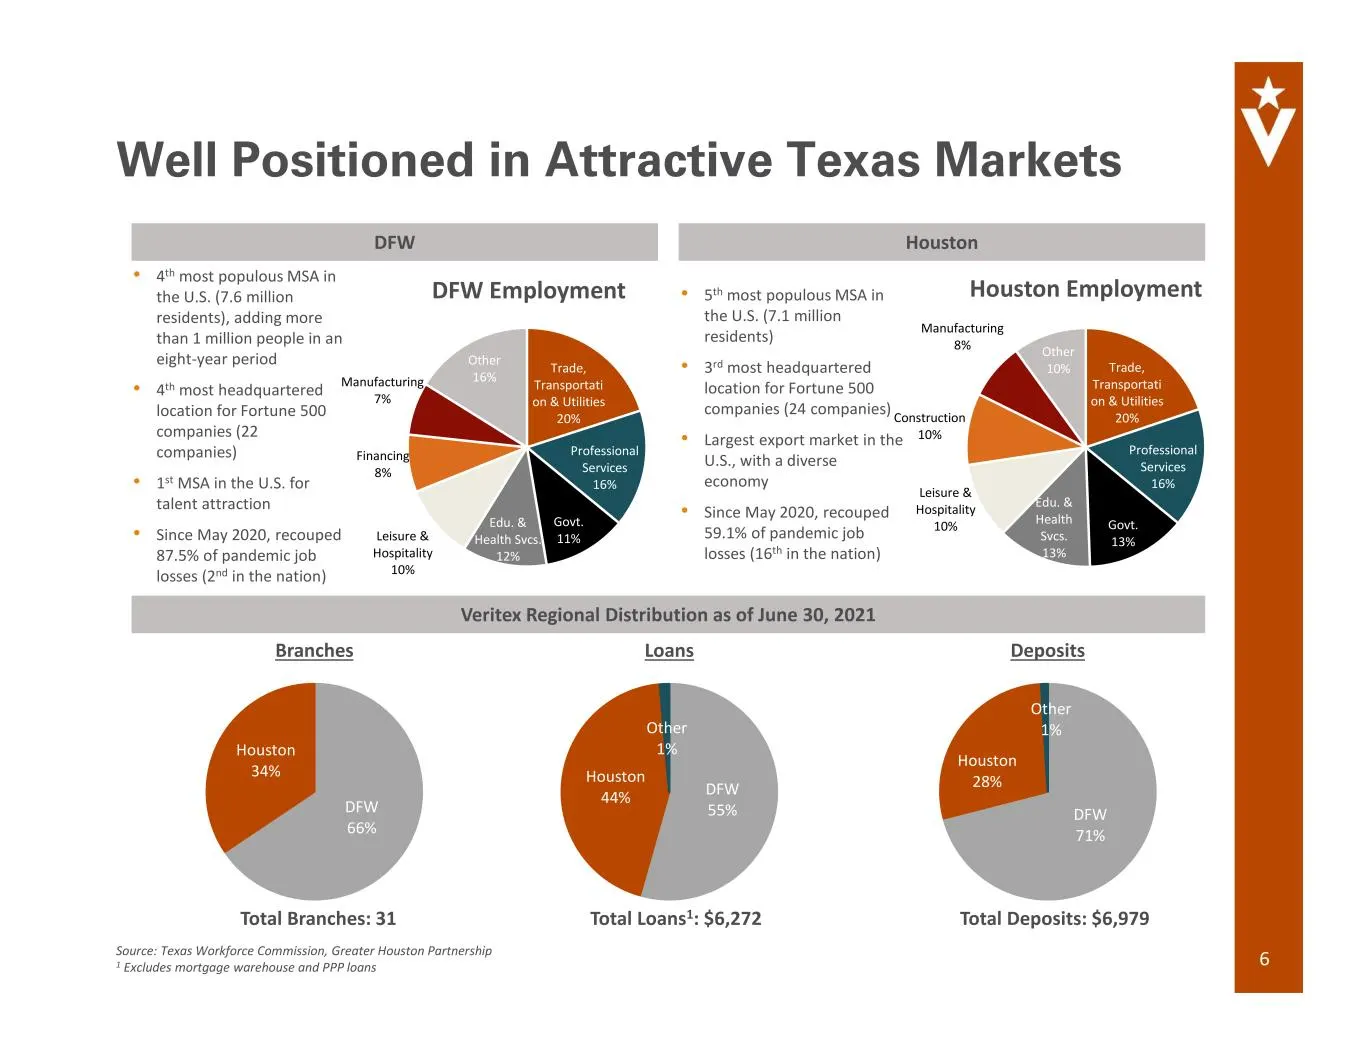
6 Well Positioned in Attractive Texas Markets DFW Houston Trade, Transportati on & Utilities 20% Professional Services 16% Govt. 13% Edu. & Health Svcs. 13% Leisure & Hospitality 10% Construction 10% Manufacturing 8% Other 10% Houston Employment• 5th most populous MSA in the U.S. (7.1 million reside
Slide 7: Impressive Organic and Acquisitive Growth
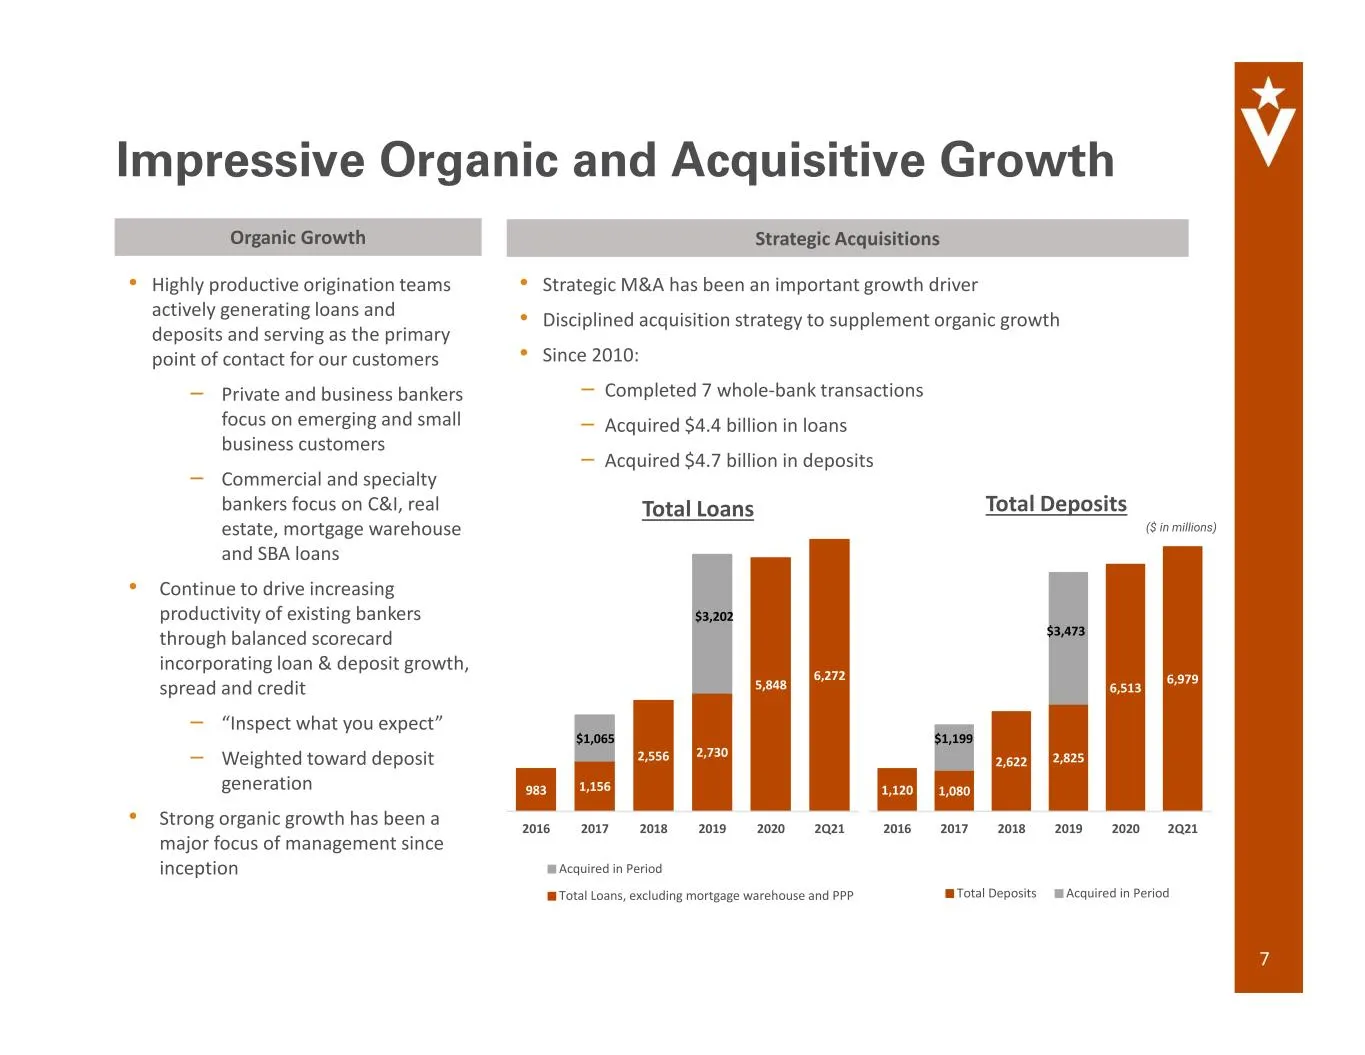
7 Impressive Organic and Acquisitive Growth Organic Growth Strategic Acquisitions • Strategic M&A has been an important growth driver • Disciplined acquisition strategy to supplement organic growth • Since 2010: – Completed 7 whole-bank transactions – Acquired $4.4 billion in loans – Acquired $4.7 b
Slide 8: Proven Track Record as a Strategic Acquirer
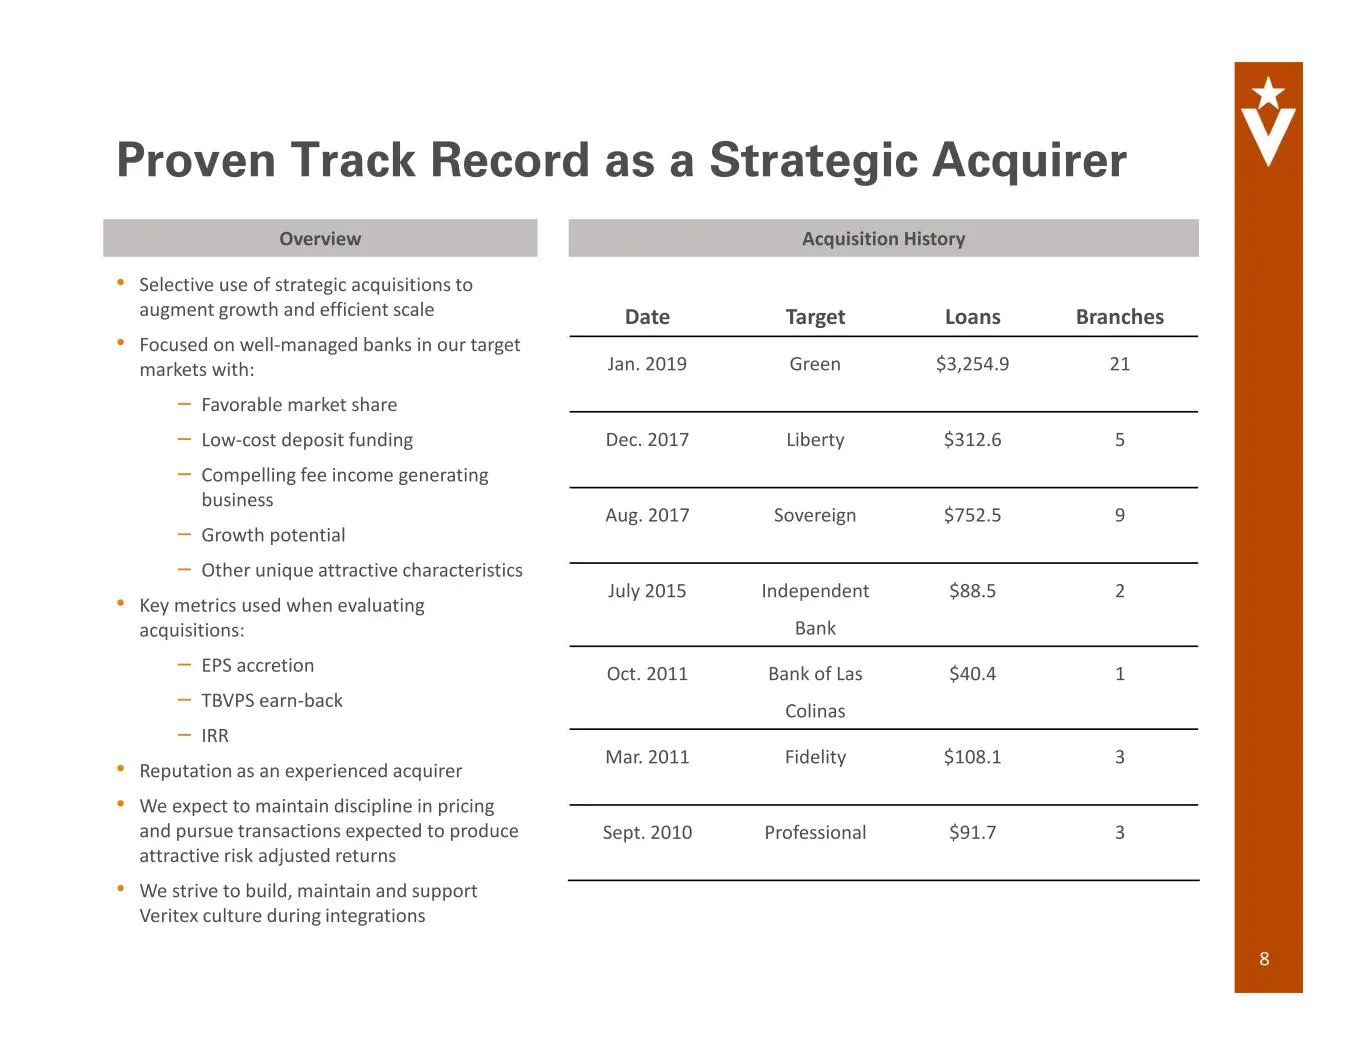
8 Proven Track Record as a Strategic Acquirer Overview Acquisition History • Selective use of strategic acquisitions to augment growth and efficient scale • Focused on well-managed banks in our target markets with: – Favorable market share – Low-cost deposit funding – Compelling fee income generatin
Slide 9: Stock Performance History
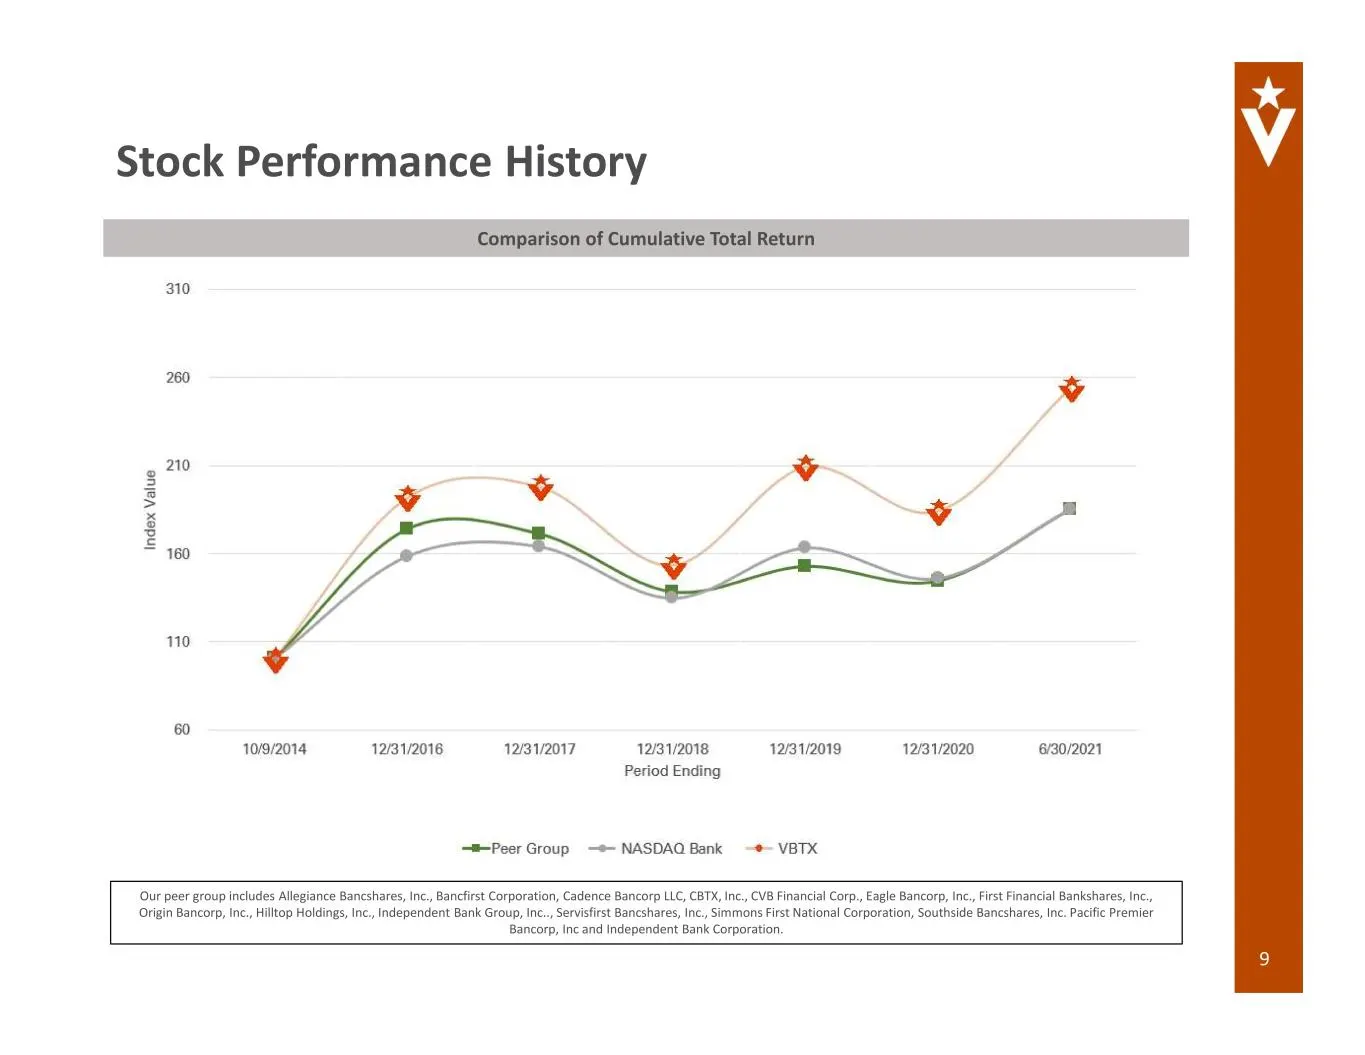
9 Stock Performance History Our peer group includes Allegiance Bancshares, Inc., Bancfirst Corporation, Cadence Bancorp LLC, CBTX, Inc., CVB Financial Corp., Eagle Bancorp, Inc., First Financial Bankshares, Inc., Origin Bancorp, Inc., Hilltop Holdings, Inc., Independent Bank Group, Inc.., Servisfirs
Slide 10: High-Performing Community Bank Franchise
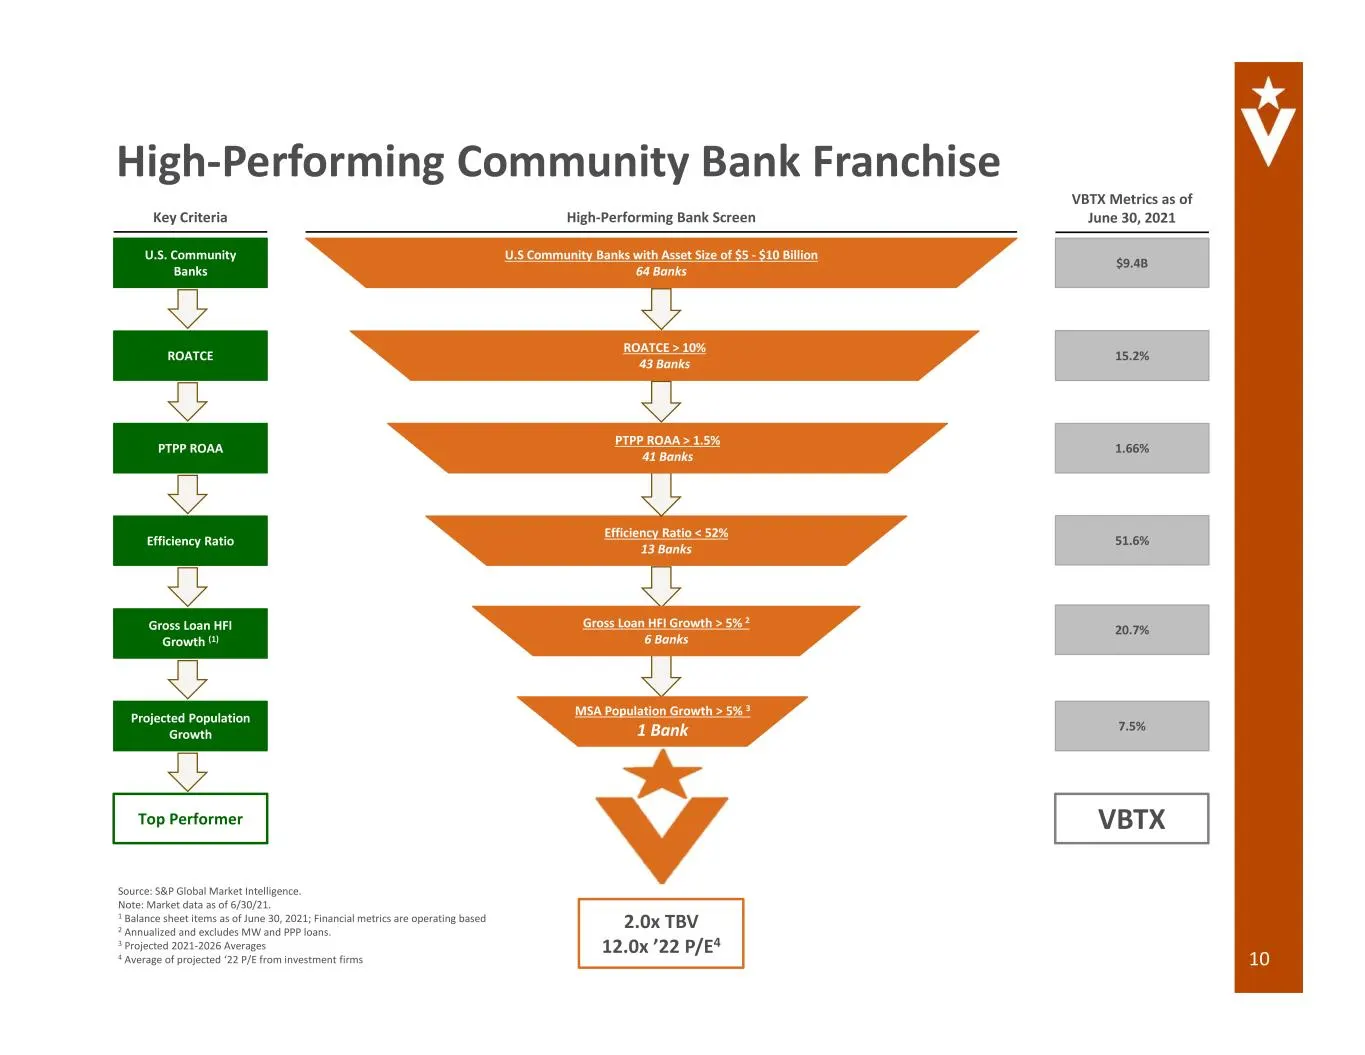
Efficiency Ratio < 52% 13 Banks U.S Community Banks with Asset Size of $5 - $10 Billion 64 Banks ROATCE > 10% 43 Banks PTPP ROAA > 1.5% 41 Banks Gross Loan HFI Growth > 5% 2 6 Banks U.S. Community Banks ROATCE PTPP ROAA Efficiency Ratio Gross Loan HFI Growth (1) Projected Population Growth Top Perfo
Slide 11: Analysts Remain Bullish Post 2Q21 Earnings
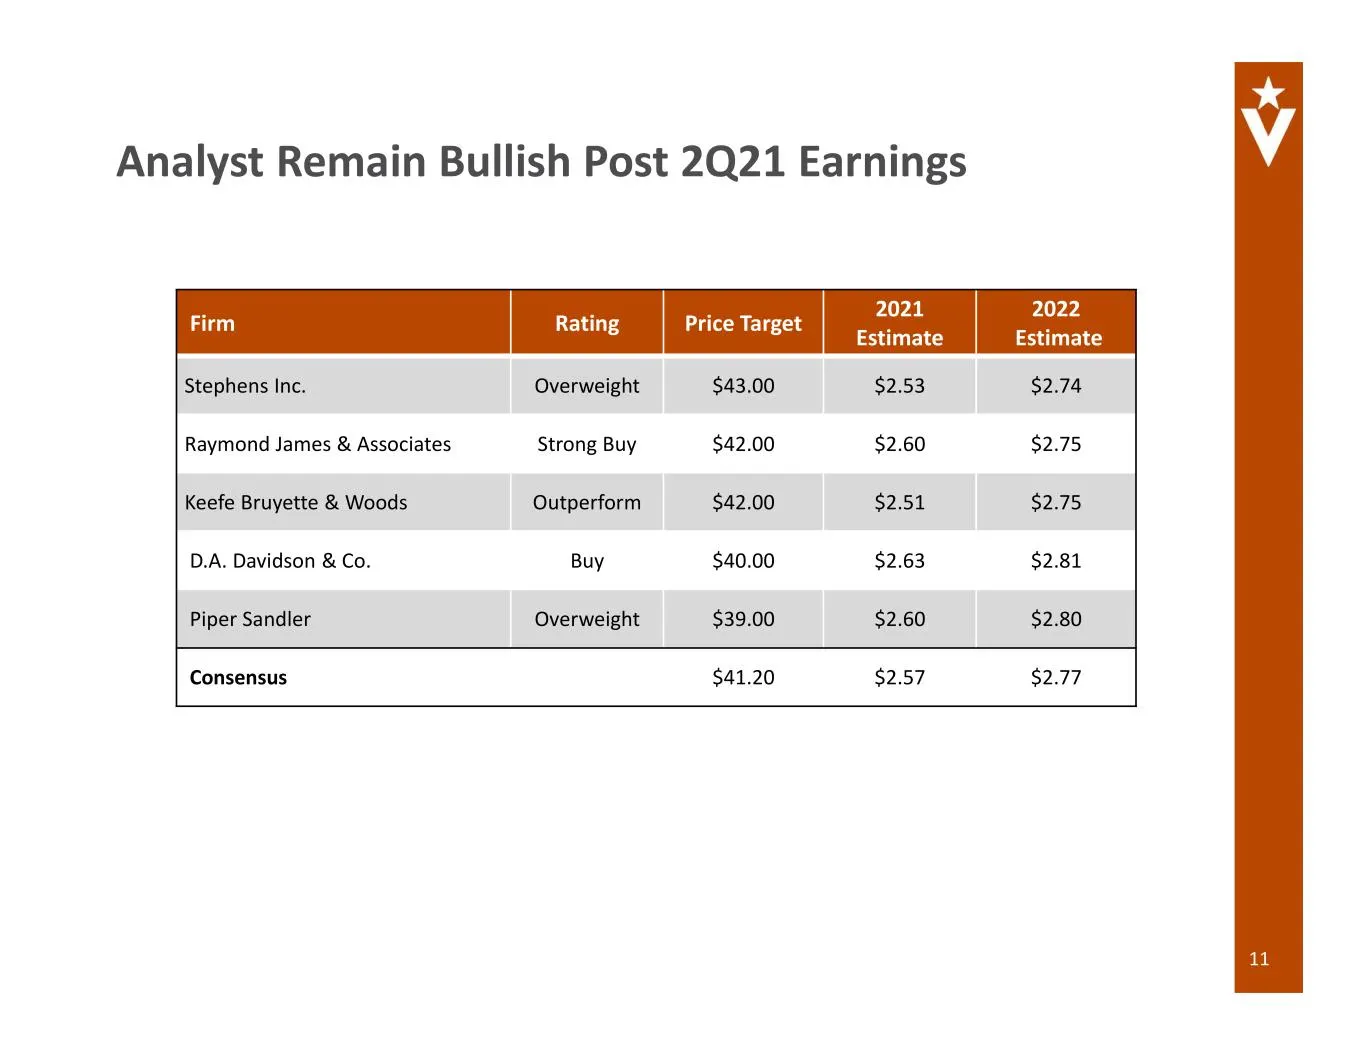
11 Analyst Remain Bullish Post 2Q21 Earnings Firm Rating Price Target 2021 Estimate 2022 Estimate Stephens Inc. Overweight $43.00 $2.53 $2.74 Raymond James & Associates Strong Buy $42.00 $2.60 $2.75 Keefe Bruyette & Woods Outperform $42.00 $2.51 $2.75 D.A. Davidson & Co. Buy $40.00 $2.63 $2.81 Piper
Slide 12: Analysts Remain Bullish Post 2Q21 Earnings
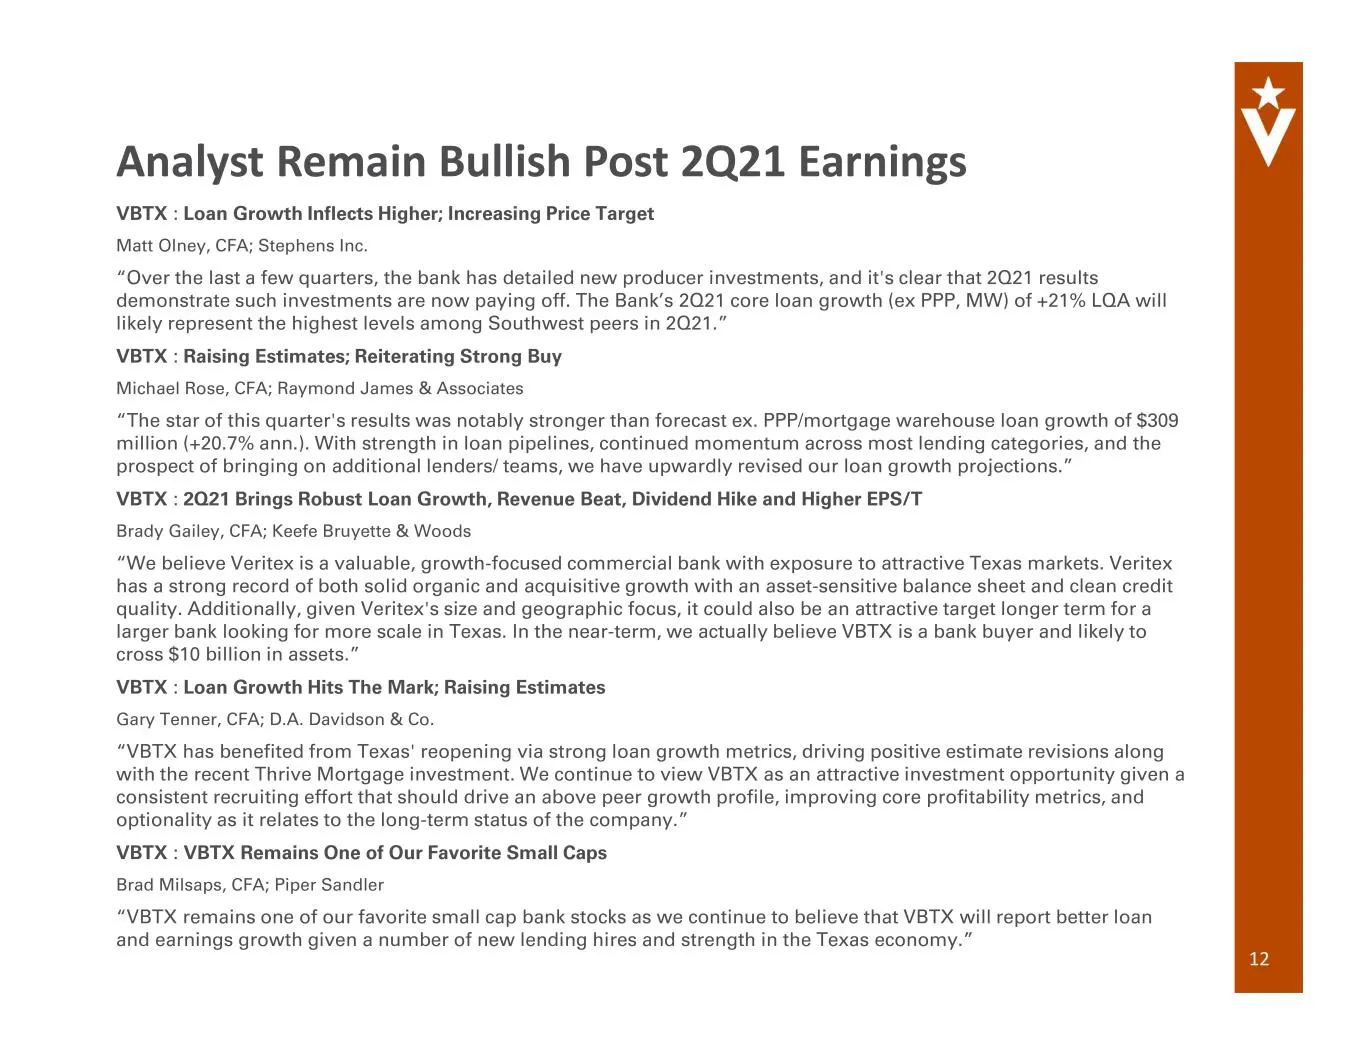
12 Analyst Remain Bullish Post 2Q21 Earnings VBTX : Loan Growth Inflects Higher; Increasing Price Target Matt Olney, CFA; Stephens Inc. “Over the last a few quarters, the bank has detailed new producer investments, and it's clear that 2Q21 results demonstrate such investments are now paying off. The
Slide 13: Attractive Valuation
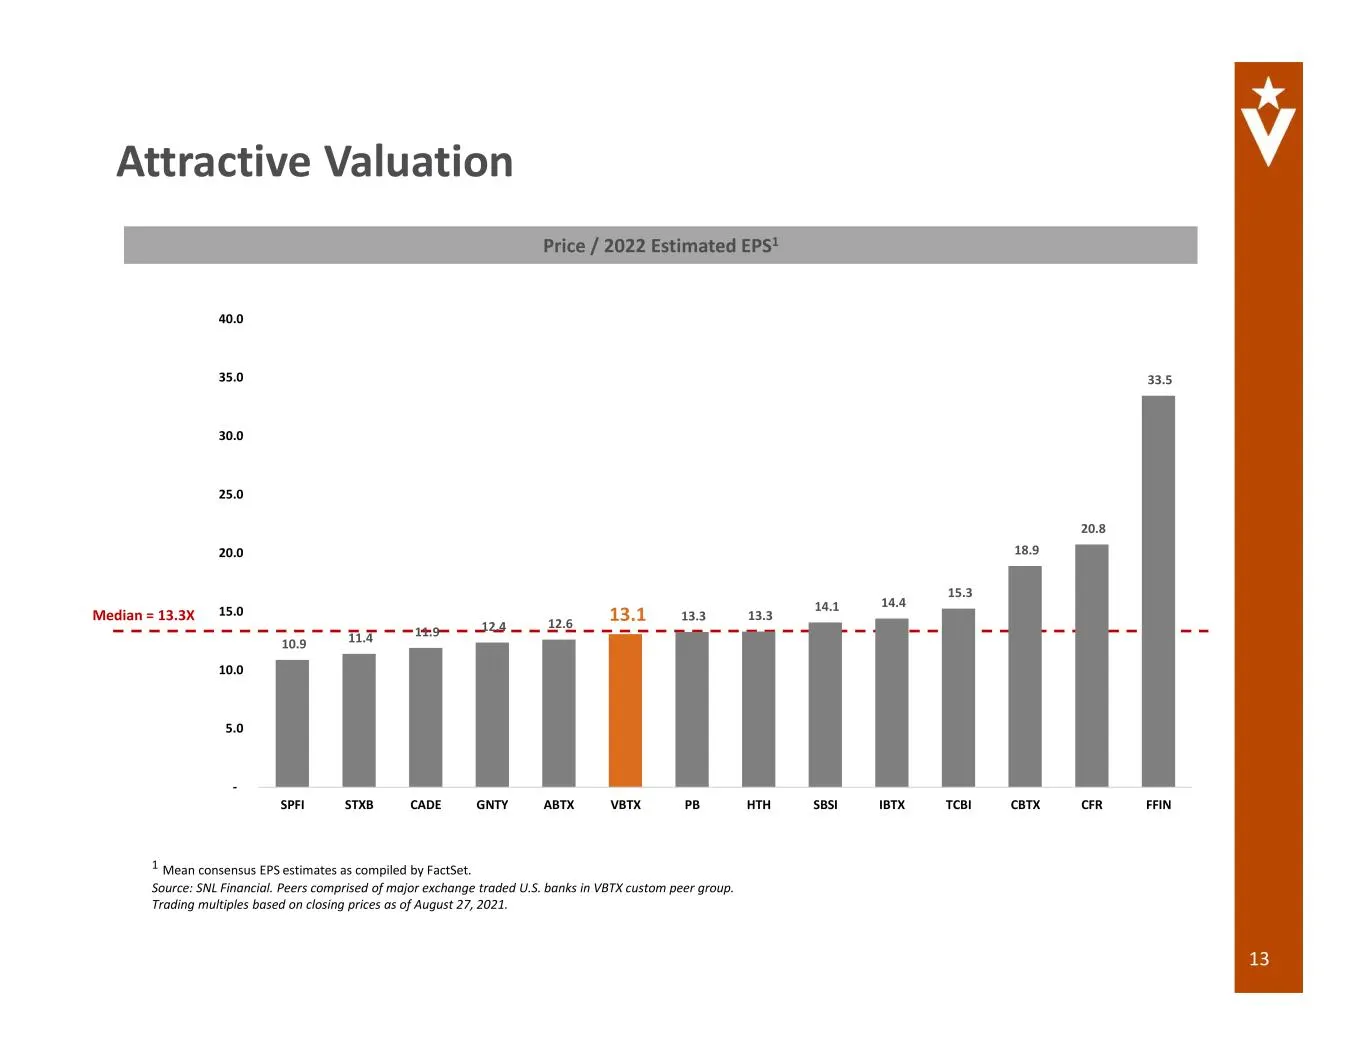
13 Attractive Valuation Price / 2022 Estimated EPS1 Median = 13.3X 10.9 11.4 11.9 12.4 12.6 13.1 13.3 13.3 14.1 14.4 15.3 18.9 20.8 33.5 - 5.0 10.0 15.0 20.0 25.0 30.0 35.0 40.0 SPFI STXB CADE GNTY ABTX VBTX PB HTH SBSI IBTX TCBI CBTX CFR FFIN 1 Mean consensus EPS estimates as compiled by FactSet. S
Slide 14: Strong Earnings, Solid Loan and Deposit Growth, Capital Build
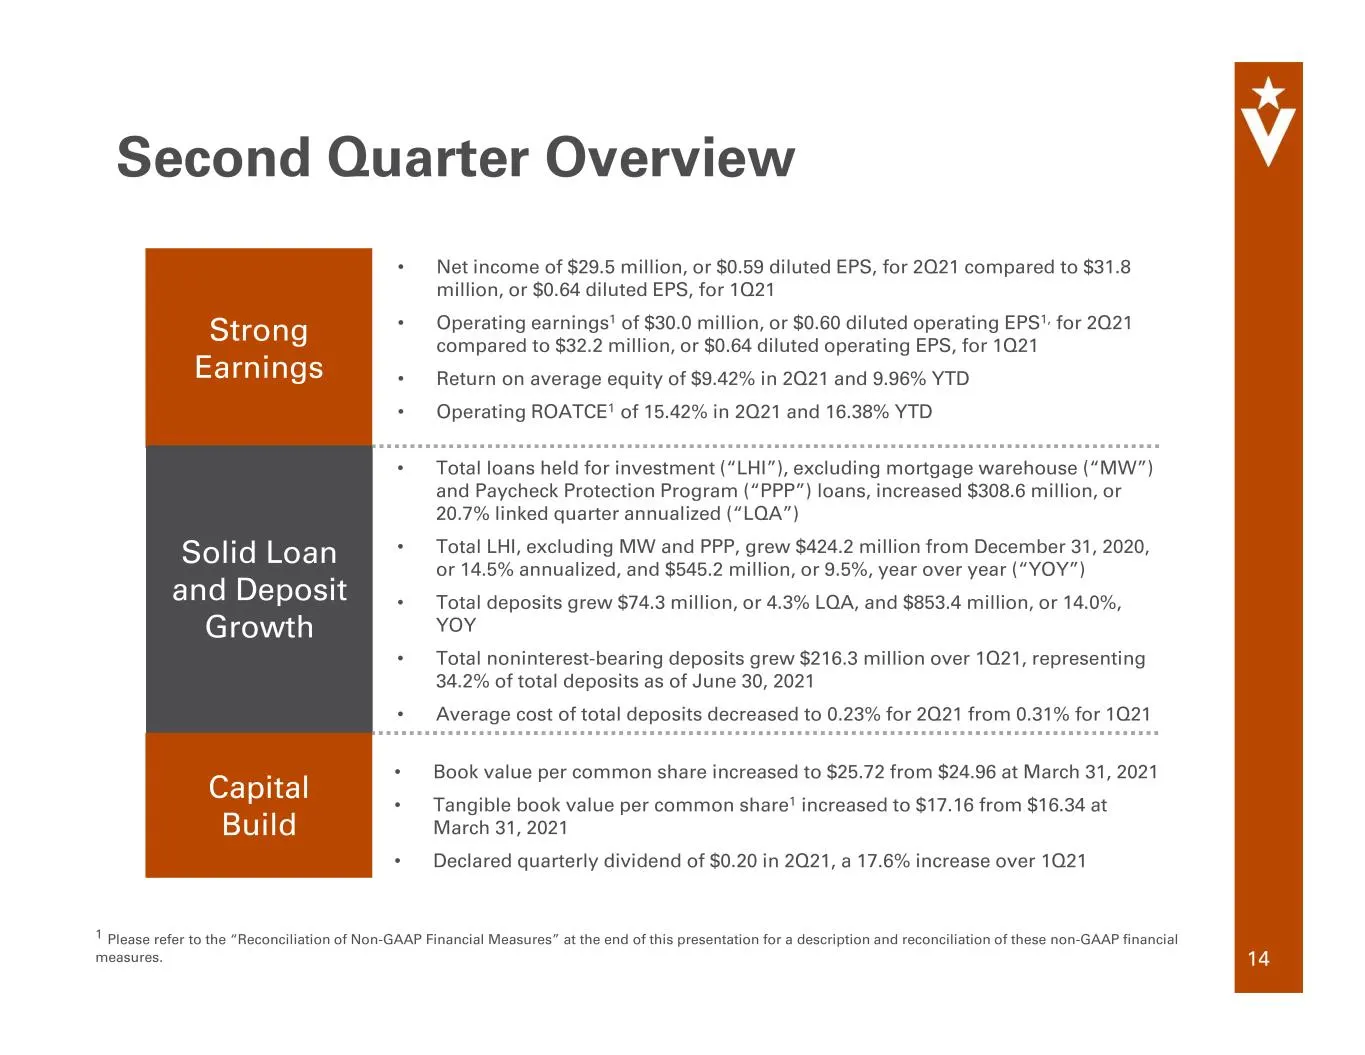
Strong Earnings Solid Loan and Deposit Growth Capital Build • Net income of $29.5 million, or $0.59 diluted EPS, for 2Q21 compared to $31.8 million, or $0.64 diluted EPS, for 1Q21 • Operating earnings1 of $30.0 million, or $0.60 diluted operating EPS1, for 2Q21 compared to $32.2 million, or $0.64 di
Slide 15: Key Financial Metrics
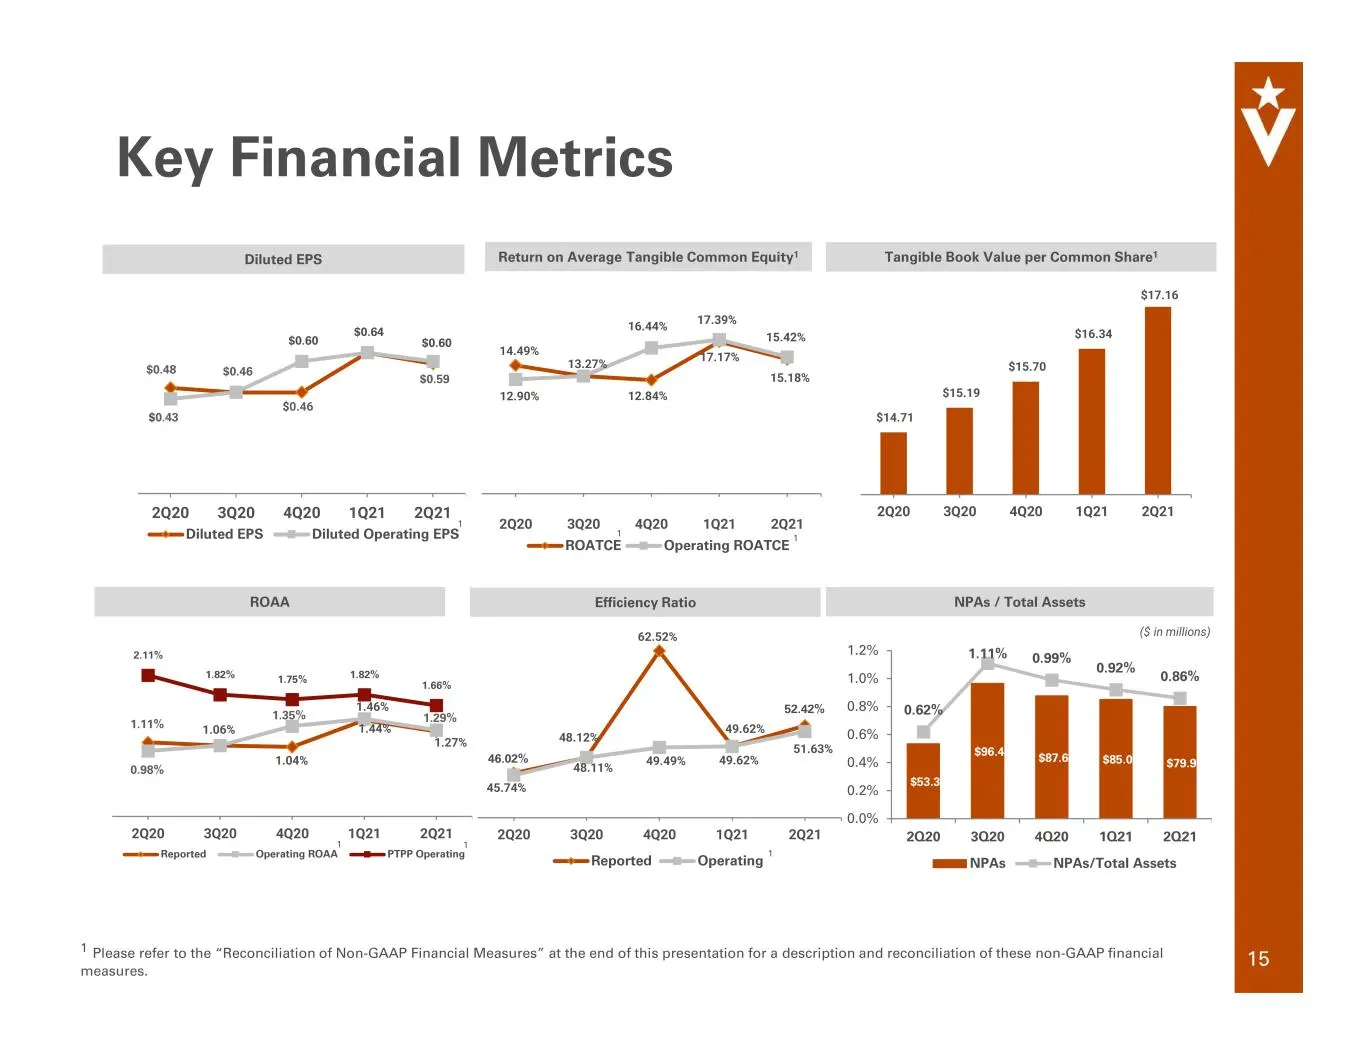
Key Financial Metrics 48.12% 62.52% 49.62% 45.74% 48.11% 49.49% 49.62% 51.63% 2Q20 3Q20 4Q20 1Q21 2Q21 Reported Operating Efficiency Ratio 1.06% 1.04% 1.44% 1.27% 1.46% 2.11% 1.82% 1.75% 1.82% 1.66% 2Q20 3Q20 4Q20 1Q21 2Q21 Reported Operating ROAA PTPP Operating 0.98% 1.11% 1.35% 1.29% $14.71 $15.19
Slide 16: Loan Growth
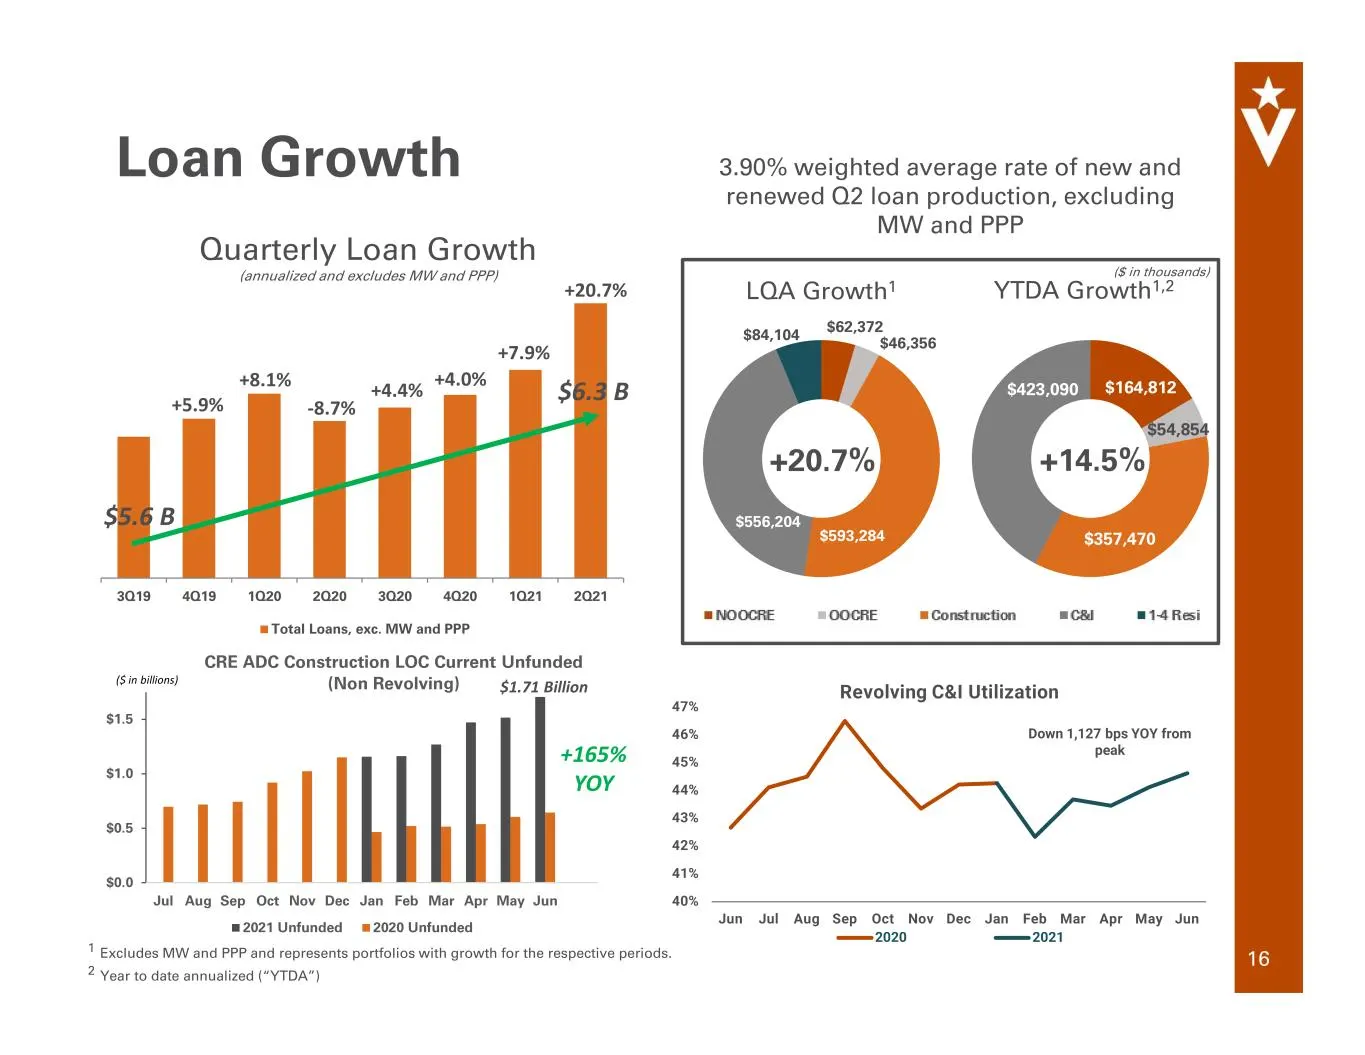
3.90% weighted average rate of new and renewed Q2 loan production, excluding MW and PPP Loan Growth 16 $1.2 Billion ($ in billions) 1 Excludes MW and PPP and represents portfolios with growth for the respective periods. 2 Year to date annualized (“YTDA”) $0.0 $0.5 $1.0 $1.5 Jul Aug Sep Oct Nov Dec J
Slide 17: 2nd Quarter Loan Production
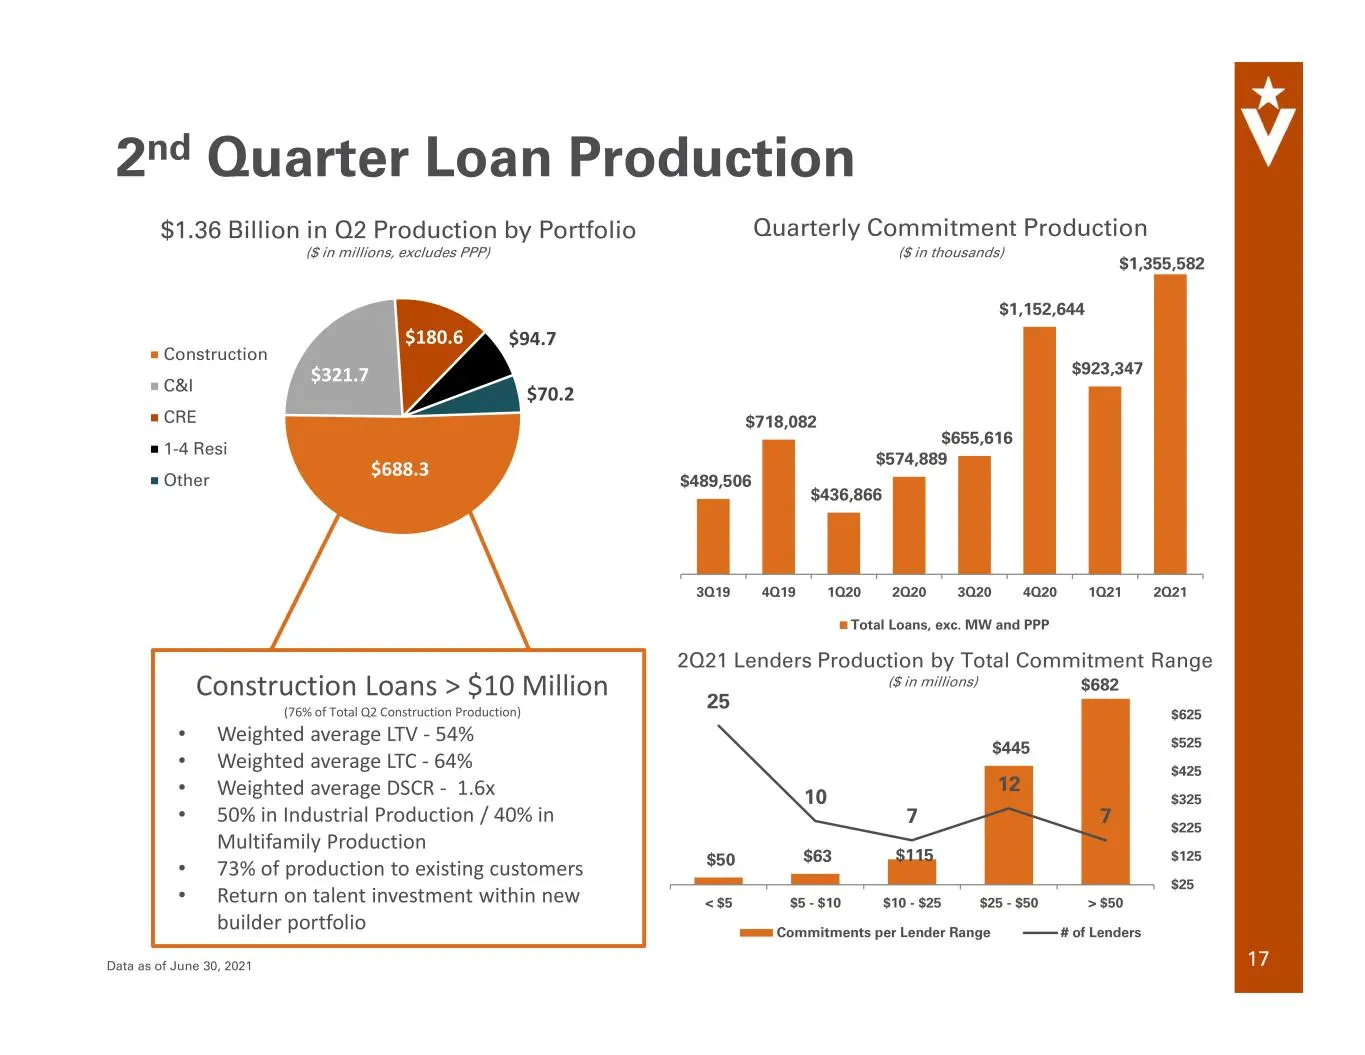
2nd Quarter Loan Production 17 $688.3 $321.7 $180.6 $94.7 $70.2 Construction C&I CRE 1-4 Resi Other $1.36 Billion in Q2 Production by Portfolio ($ in millions, excludes PPP) $50 $63 $115 $445 25 10 7 12 7 0 5 10 15 20 25 30 < $5 $5 - $10 $10 - $25 $25 - $50 > $50 $25 $125 $225 $325 $425 $525 $625 Co
Slide 18: Net Interest Income
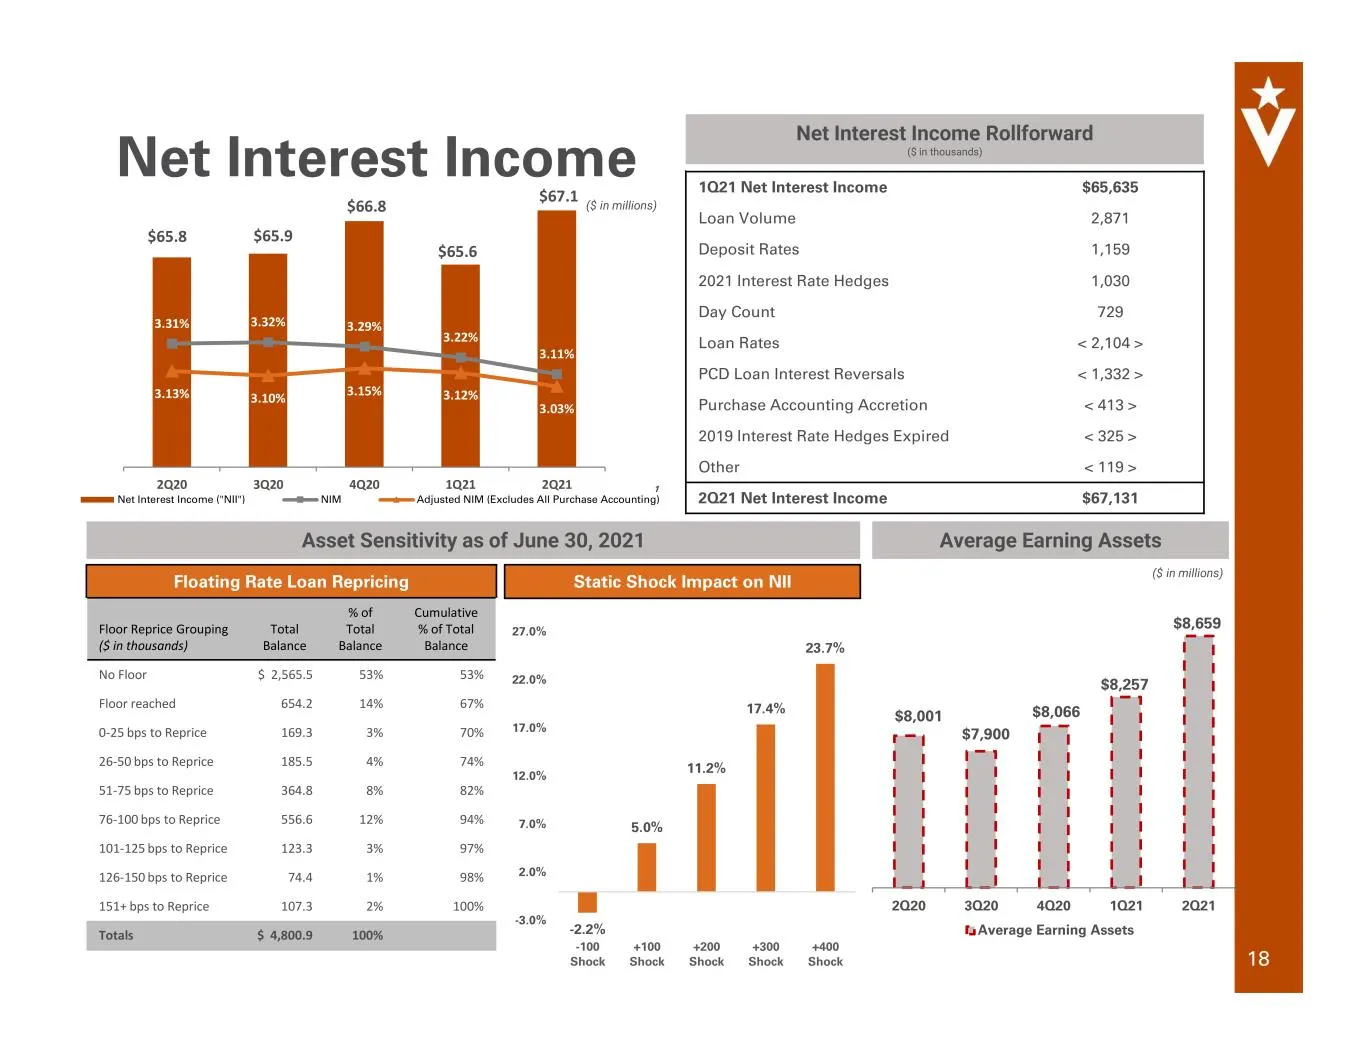
Net Interest Income 18 $65.9 $66.8 $65.6 $67.1 3.31% 3.32% 3.29% 3.22% 3.11% 3.13% 3.10% 3.15% 3.12% 3.03% 2Q20 3Q20 4Q20 1Q21 2Q21 Net Interest Income ("NII") NIM Adjusted NIM (Excludes All Purchase Accounting) $65.8 $7,900 $8,066 $8,257 $8,659 2Q20 3Q20 4Q20 1Q21 2Q21 Average Earning Assets $8,001
Slide 19: Operating Noninterest Income
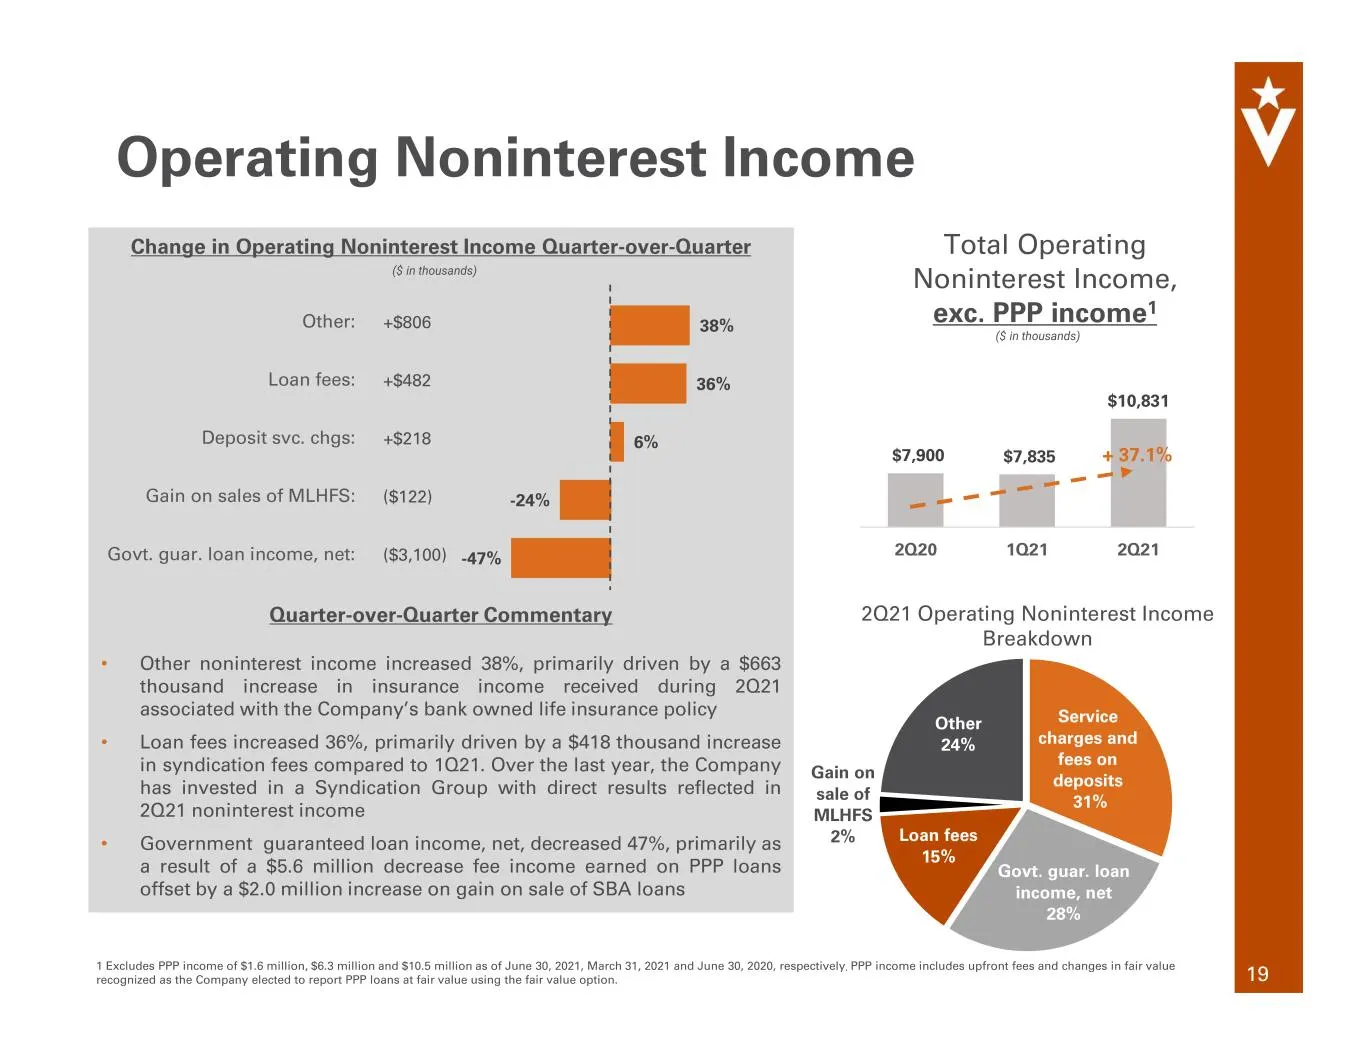
Operating Noninterest Income 19 Change in Operating Noninterest Income Quarter-over-Quarter Quarter-over-Quarter Commentary • Other noninterest income increased 38%, primarily driven by a $663 thousand increase in insurance income received during 2Q21 associated with the Company’s bank owned life in
Slide 20: Operating Noninterest Expense
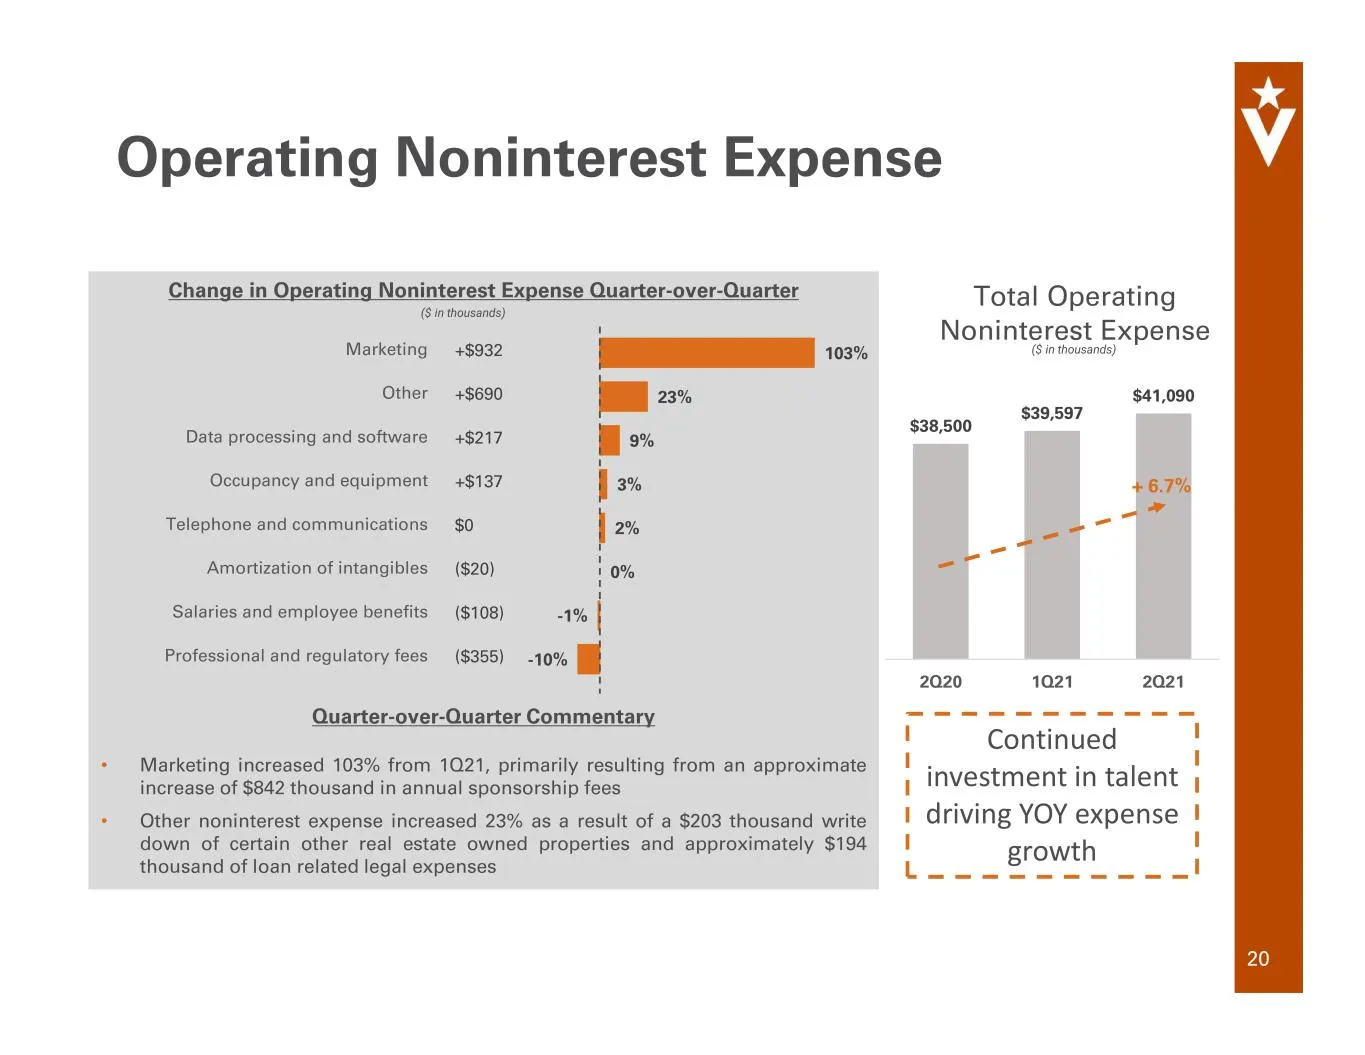
Operating Noninterest Expense 20 Change in Operating Noninterest Expense Quarter-over-Quarter Quarter-over-Quarter Commentary • Marketing increased 103% from 1Q21, primarily resulting from an approximate increase of $842 thousand in annual sponsorship fees • Other noninterest expense increased 23% a
Slide 21: Cost of Interest-bearing Deposits and Total Deposits
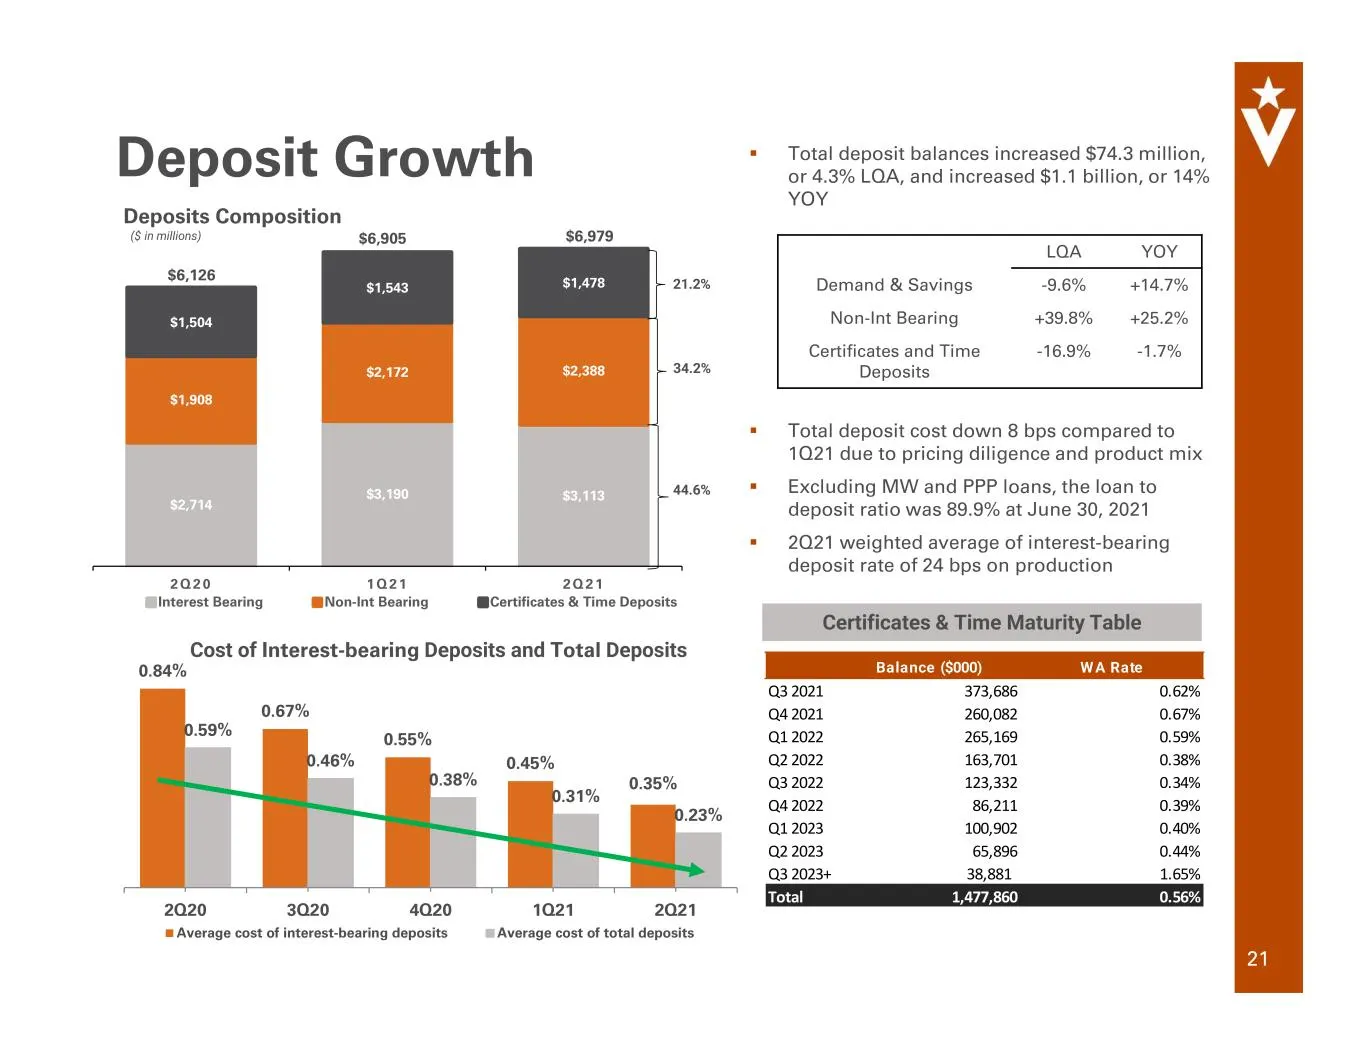
0.84% 0.67% 0.55% 0.45% 0.35% 0.59% 0.46% 0.38% 0.31% 0.23% 2Q20 3Q20 4Q20 1Q21 2Q21 Average cost of interest-bearing deposits Average cost of total deposits Cost of Interest-bearing Deposits and Total Deposits Total deposit balances increased $74.3 million, or 4.3% LQA, and increased $1.1 billion
Slide 22: Capital Build
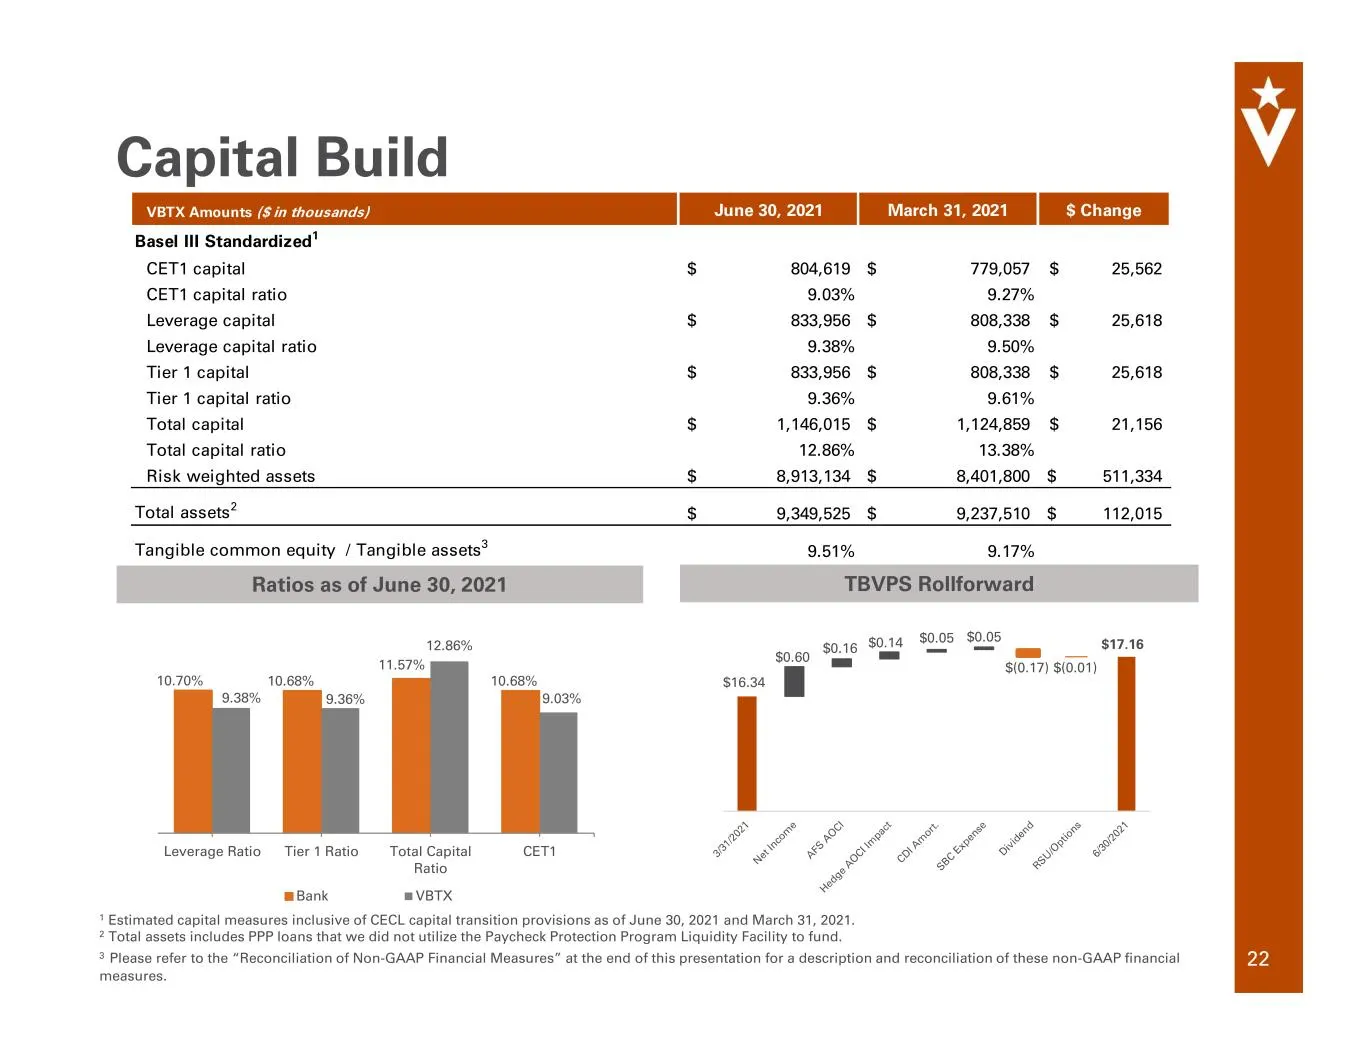
Capital Build 22 10.70% 10.68% 11.57% 10.68% 9.38% 9.36% 12.86% 9.03% Leverage Ratio Tier 1 Ratio Total Capital Ratio CET1 Bank VBTX 1 Estimated capital measures inclusive of CECL capital transition provisions as of June 30, 2021 and March 31, 2021. 2 Total assets includes PPP loans that we did not
Slide 23: Thrive Mortgage Investment
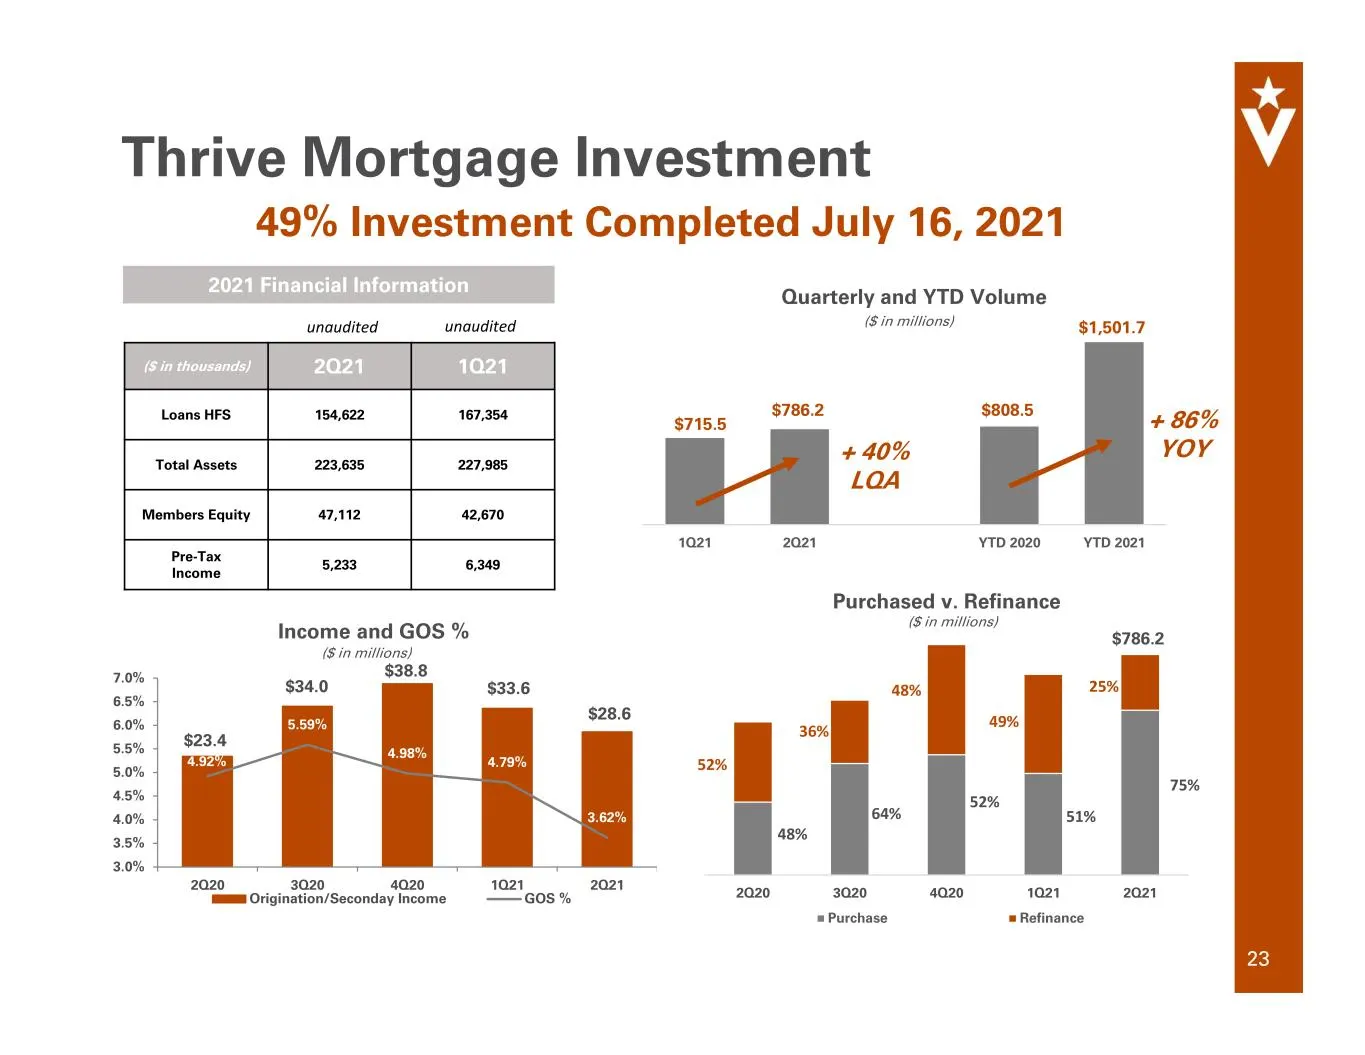
Thrive Mortgage Investment 2021 Financial Information ($ in thousands) 2Q21 1Q21 Loans HFS 154,622 167,354 Total Assets 223,635 227,985 Members Equity 47,112 42,670 Pre-Tax Income 5,233 6,349 2Q20 3Q20 4Q20 1Q21 2Q21 Purchase Refinance unaudited unaudited 1Q21 2Q21 YTD 2020 YTD 2021 $786.2 $715.5 Qu
Slide 24: Asset Quality and ACL
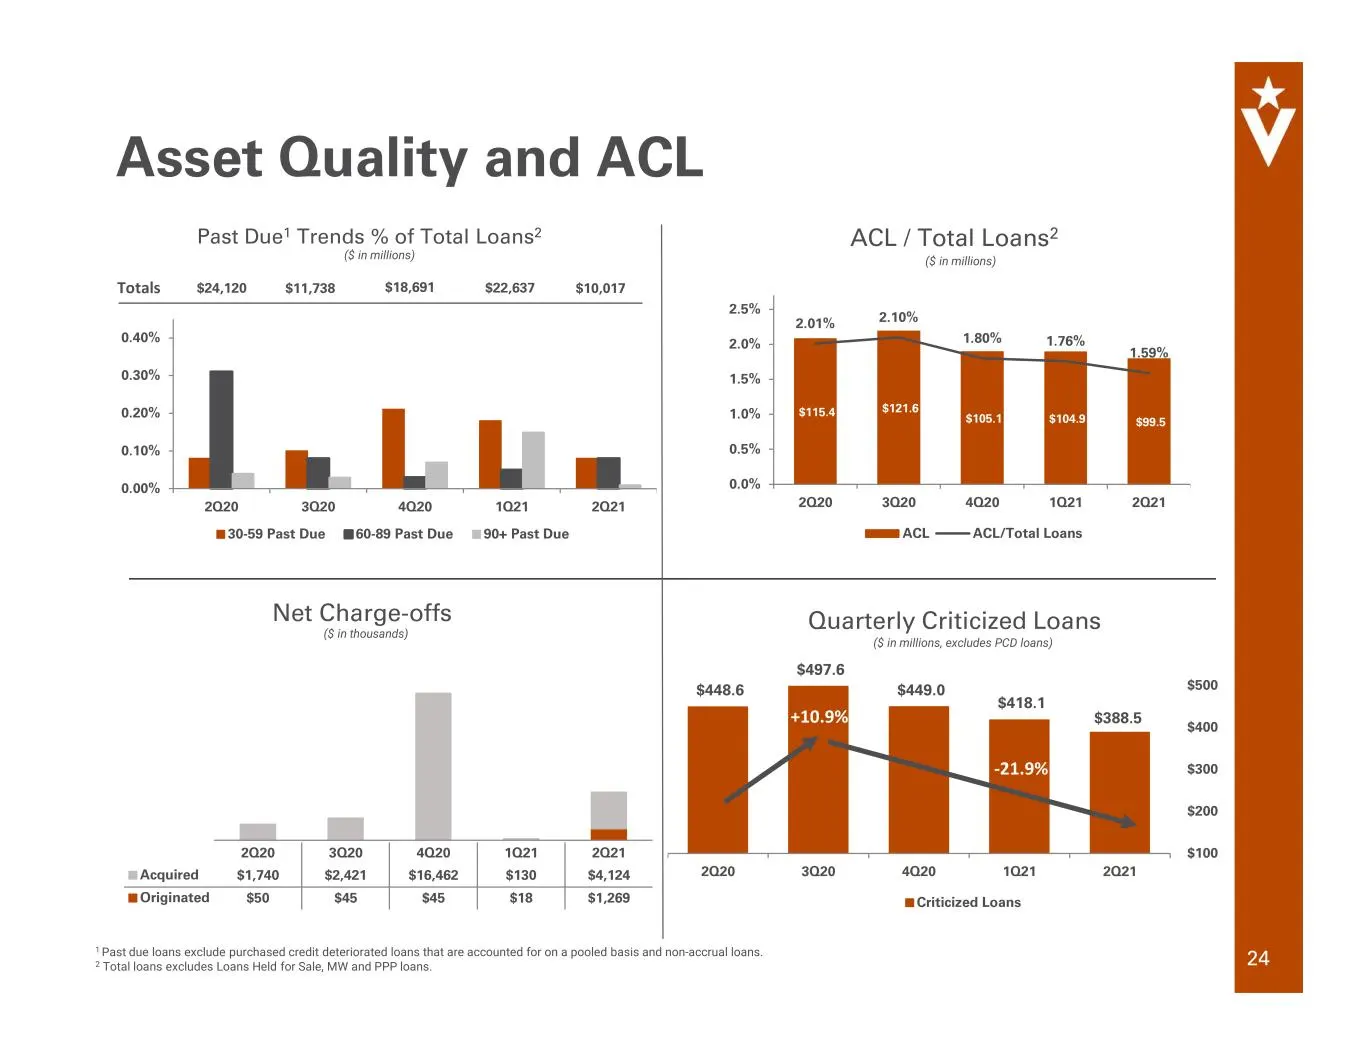
1 Past due loans exclude purchased credit deteriorated loans that are accounted for on a pooled basis and non-accrual loans. 2 Total loans excludes Loans Held for Sale, MW and PPP loans. 2Q20 3Q20 4Q20 1Q21 2Q21 0.00% 0.10% 0.20% 0.30% 0.40% 30-59 Past Due 60-89 Past Due 90+ Past Due Past Due1 Trend
Slide 25: Supplemental Information
Veritex Holdings, Inc. Supplemental Information
Slide 26: Reconciliation of Non-GAAP Financial Measures
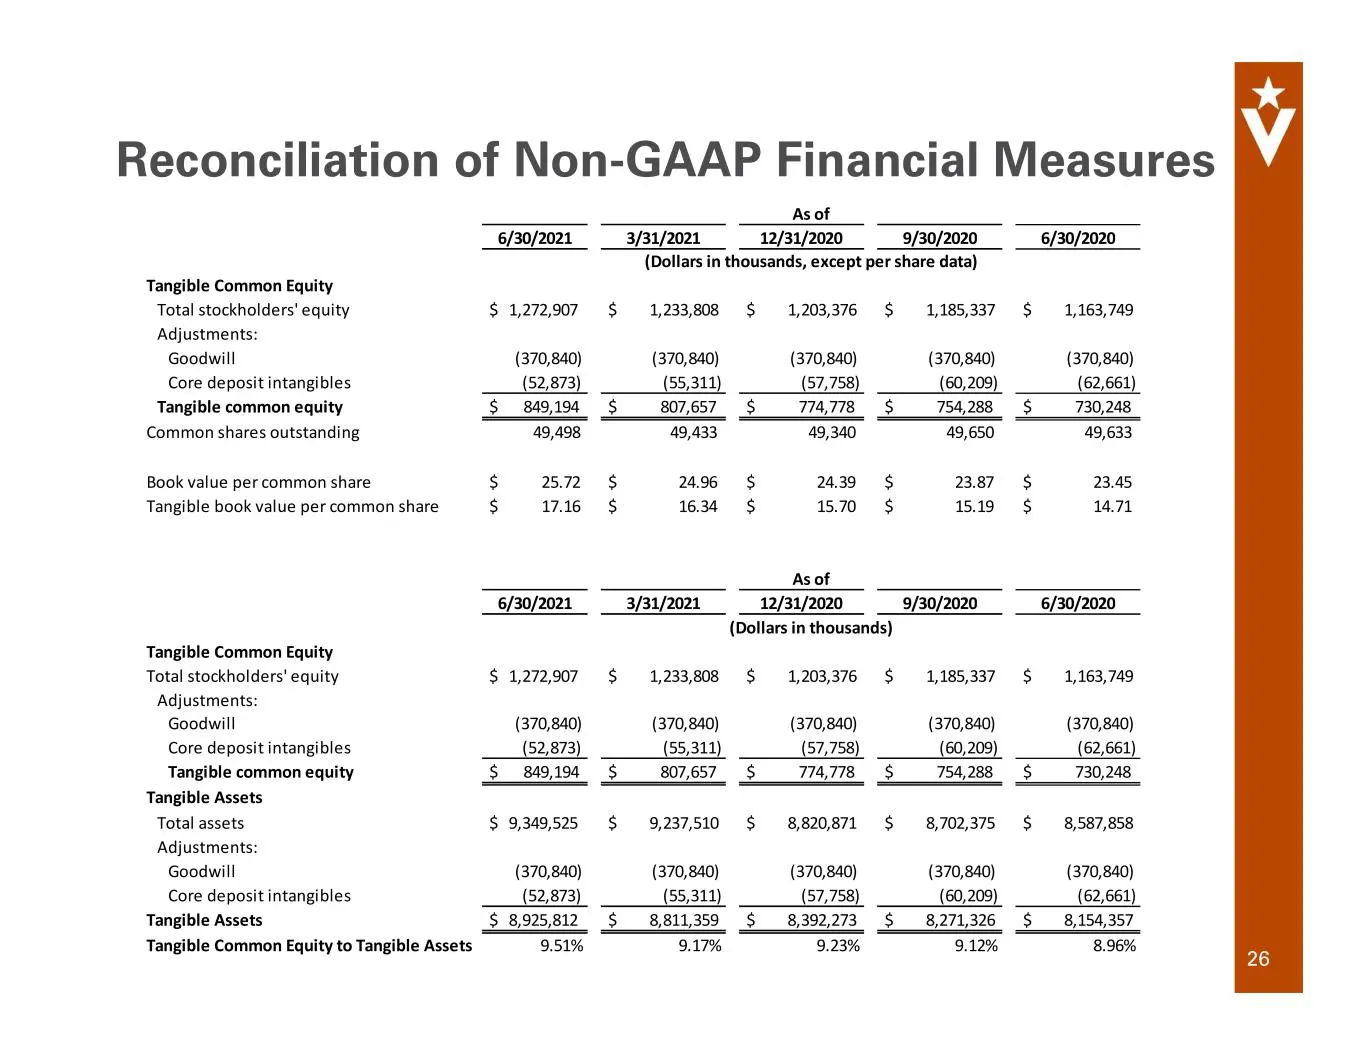
26 Reconciliation of Non-GAAP Financial Measures 6/30/2021 3/31/2021 12/31/2020 9/30/2020 6/30/2020 Tangible Common Equity Total stockholders' equity $ 1,272,907 $ 1,233,808 $ 1,203,376 $ 1,185,337 $ 1,163,749 Adjustments: Goodwill (370,840) (370,840) (370,840) (370,840) (370,840) Core deposit intan
Slide 27: Reconciliation of Non-GAAP Financial Measures
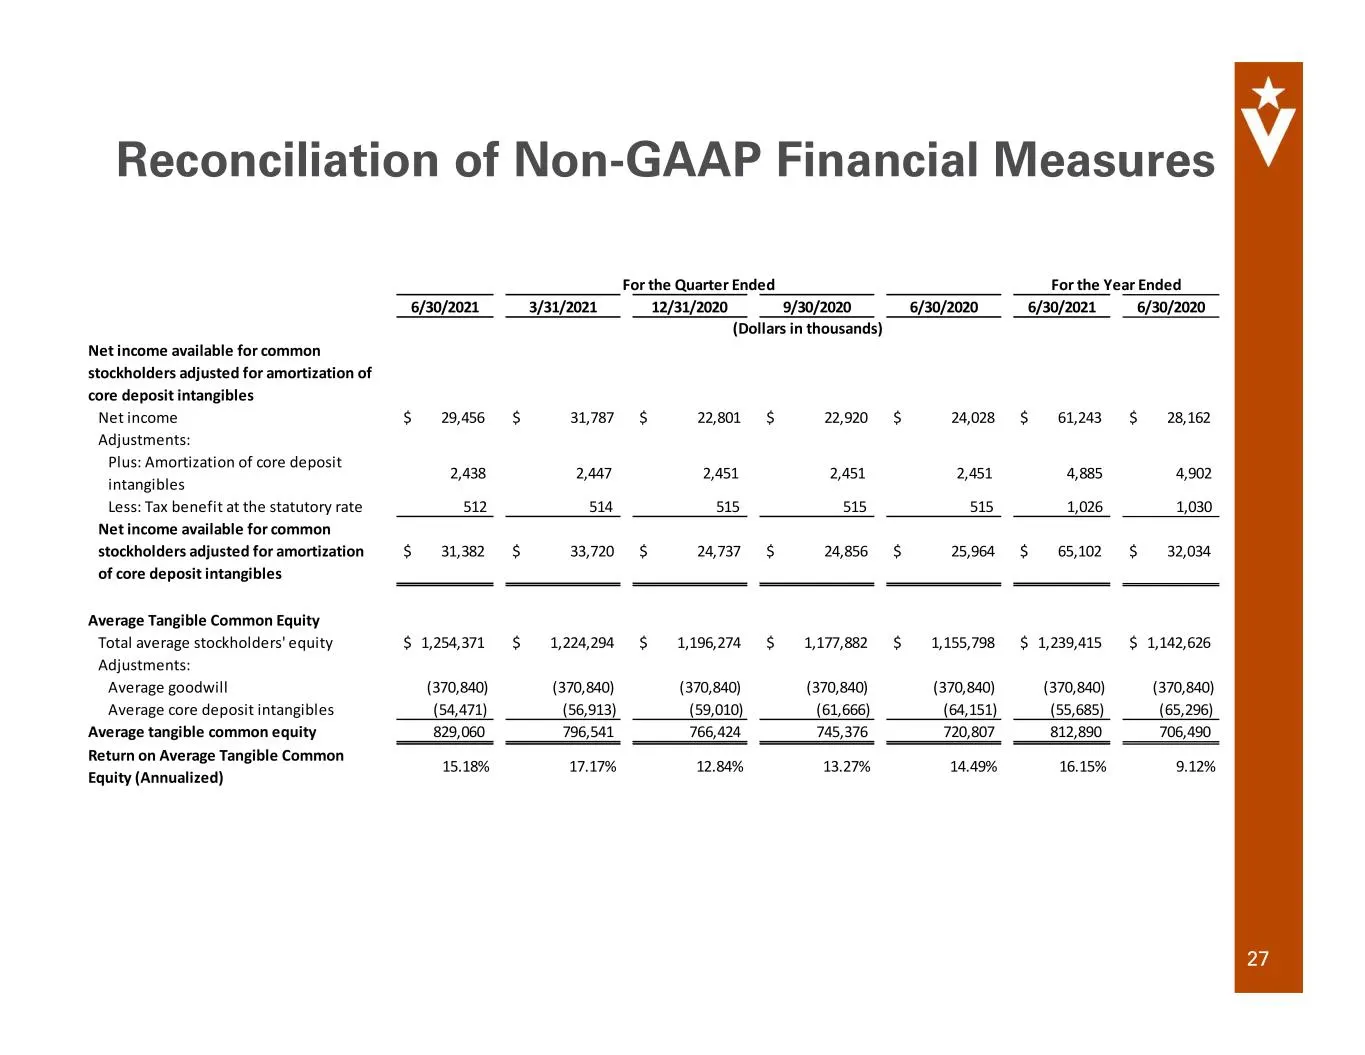
27 Reconciliation of Non-GAAP Financial Measures 6/30/2021 3/31/2021 12/31/2020 9/30/2020 6/30/2020 6/30/2021 6/30/2020 Net income available for common stockholders adjusted for amortization of core deposit intangibles Net income $ 29,456 $ 31,787 $ 22,801 $ 22,920 $ 24,028 $ 61,243 $ 28,162 Adjustm
Slide 28: Reconciliation of Non-GAAP Financial Measures
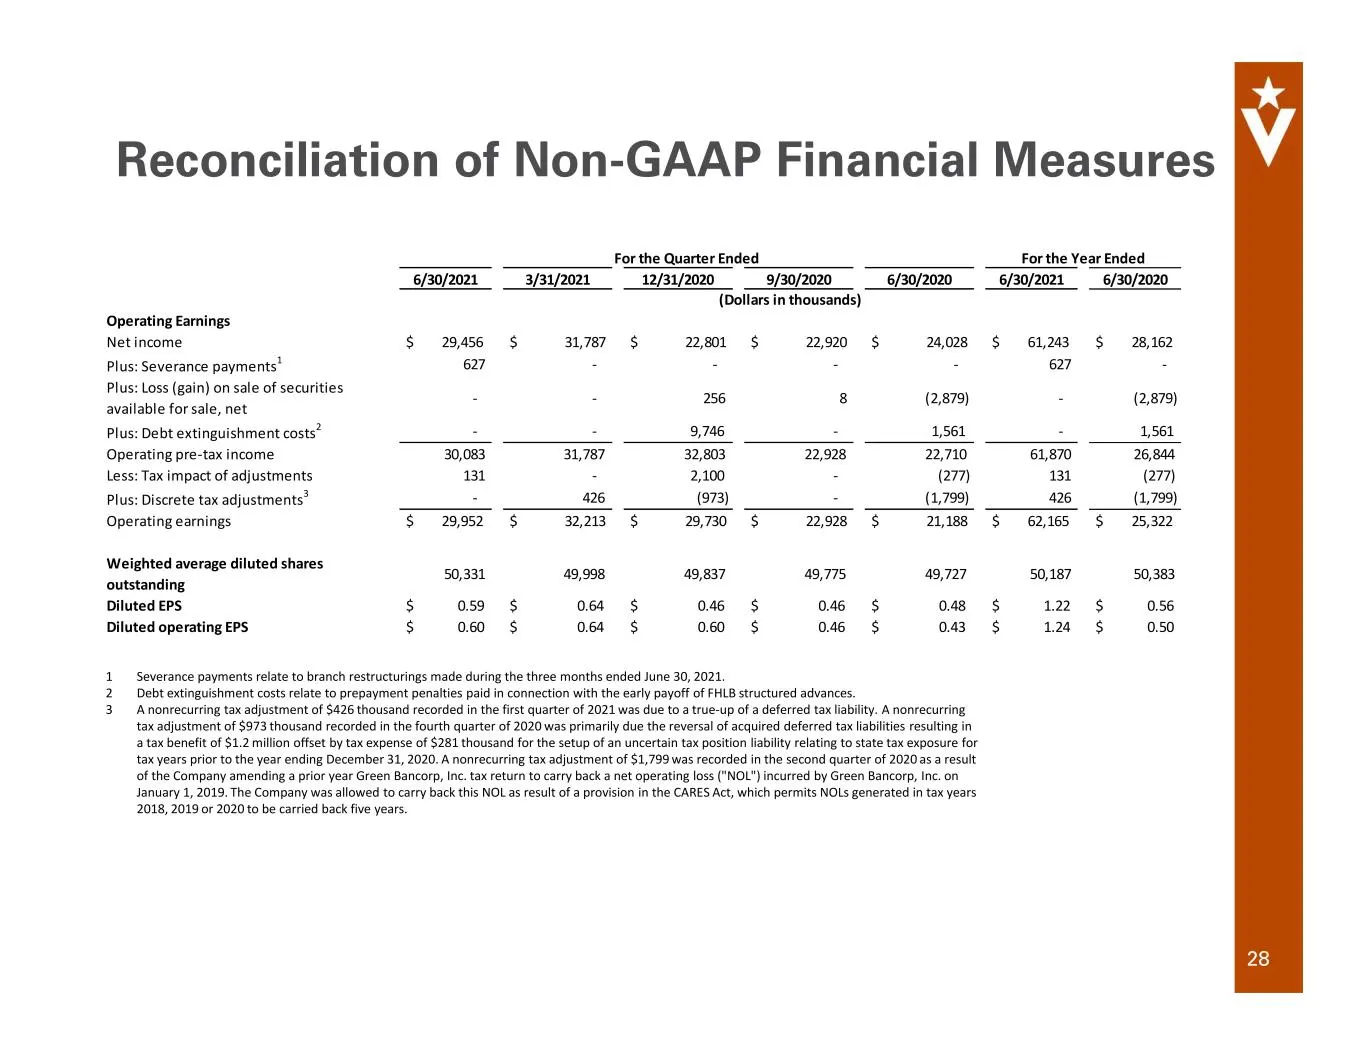
28 Reconciliation of Non-GAAP Financial Measures 1 Severance payments relate to branch restructurings made during the three months ended June 30, 2021. 2 Debt extinguishment costs relate to prepayment penalties paid in connection with the early payoff of FHLB structured advances. 3 A nonrecurring ta
Slide 29: Reconciliation of Non-GAAP Financial Measures
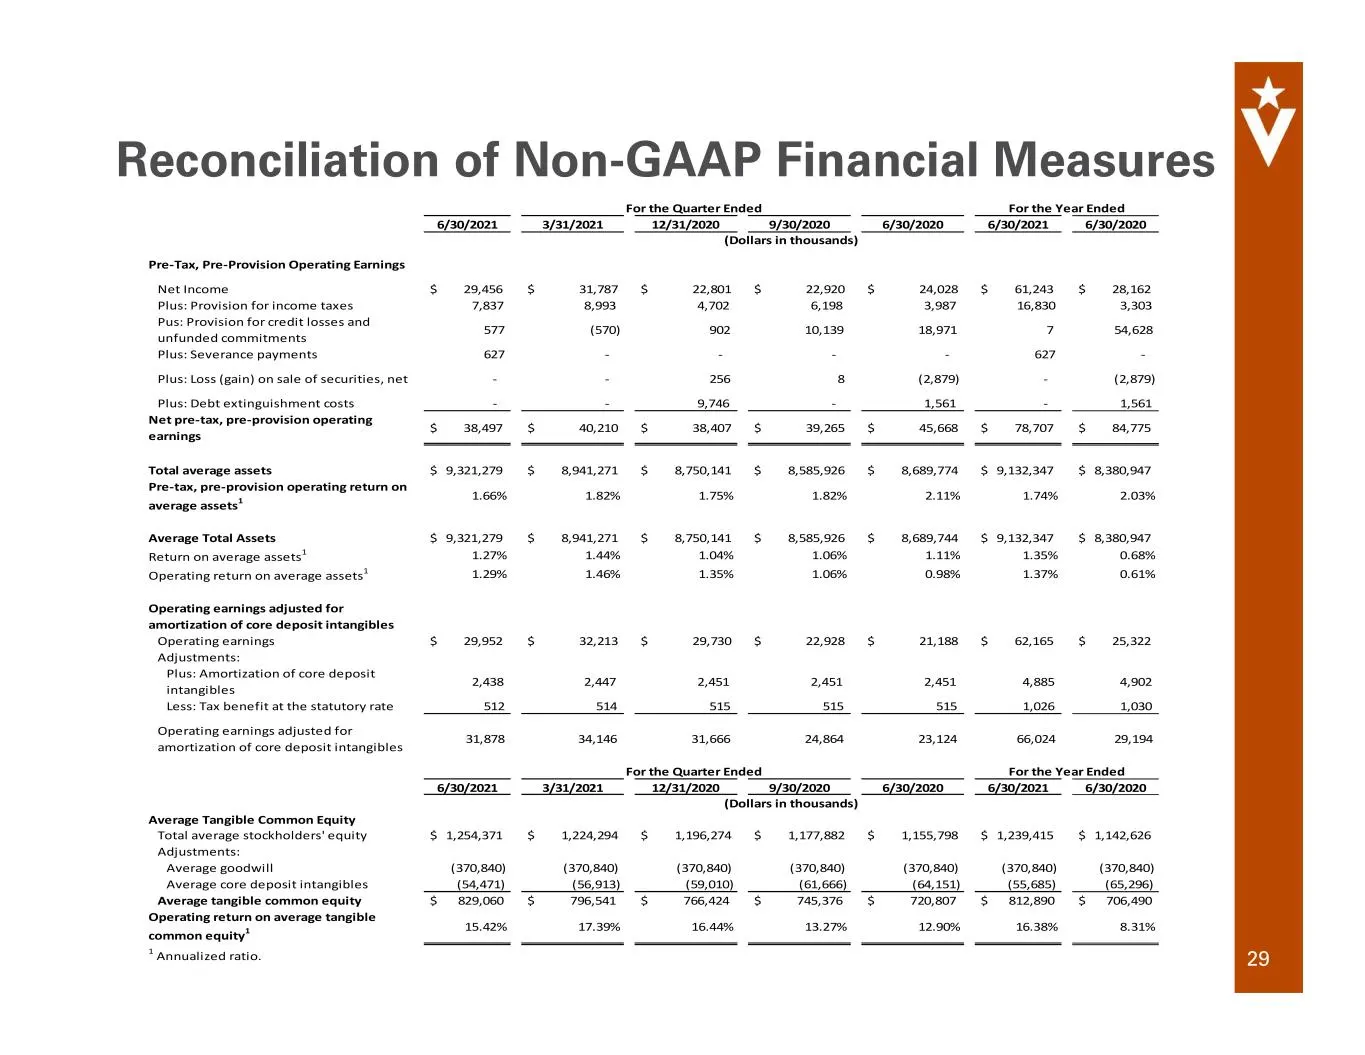
29 Reconciliation of Non-GAAP Financial Measures 6/30/2021 3/31/2021 12/31/2020 9/30/2020 6/30/2020 6/30/2021 6/30/2020 Pre-Tax, Pre-Provision Operating Earnings Net Income $ 29,456 $ 31,787 $ 22,801 $ 22,920 $ 24,028 $ 61,243 $ 28,162 Plus: Provision for income taxes 7,837 8,993 4,702 6,198 3,987 1
Slide 30: Reconciliation of Non-GAAP Financial Measures
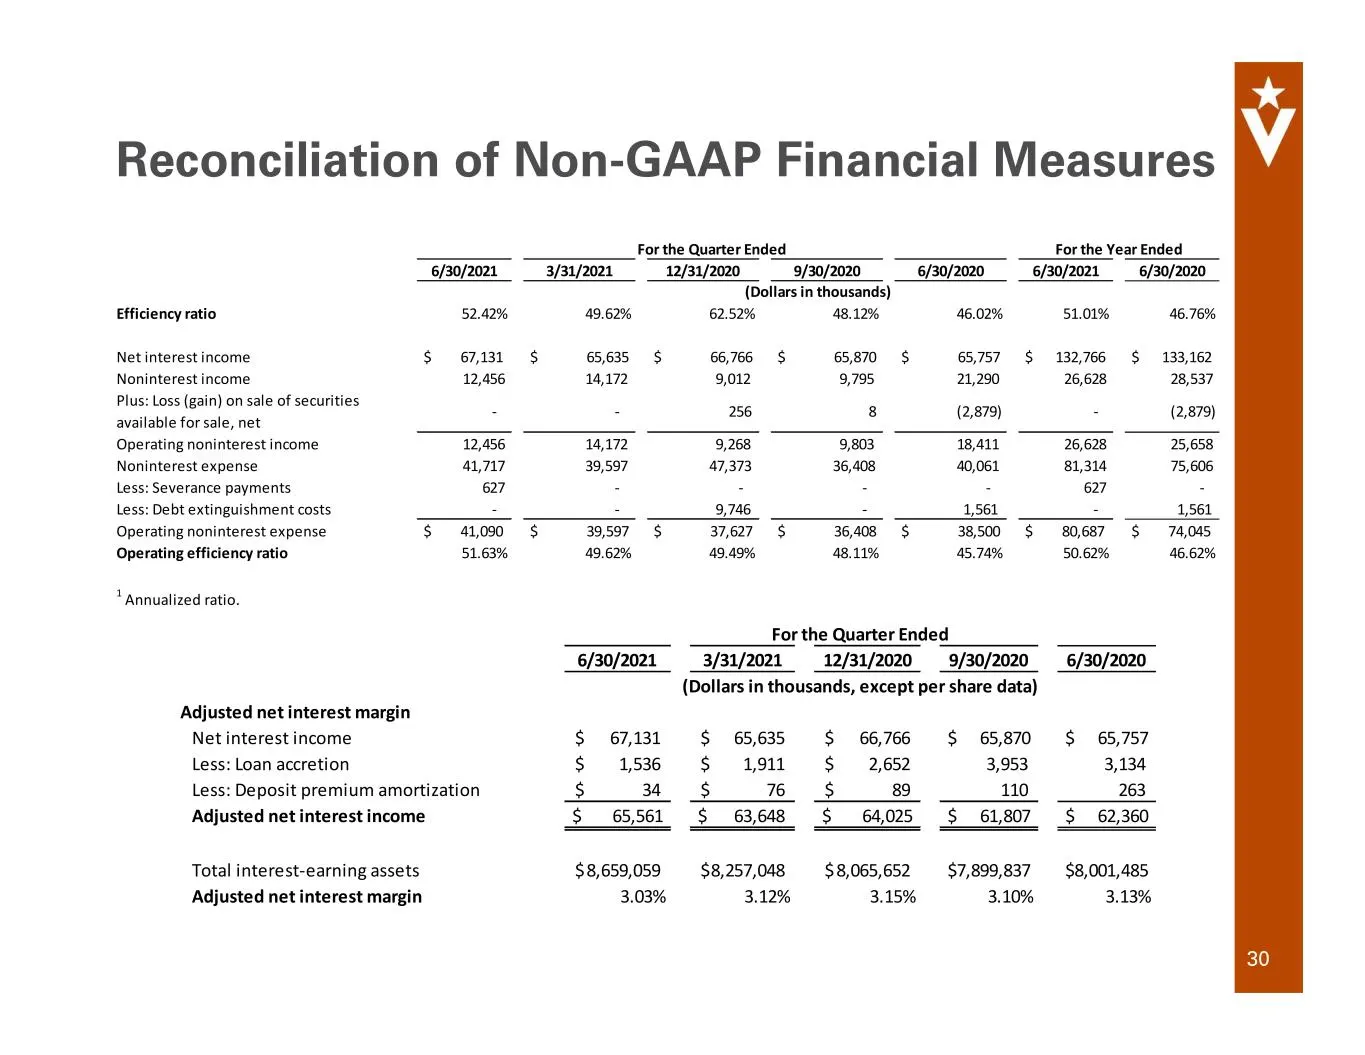
30 Reconciliation of Non-GAAP Financial Measures 6/30/2021 3/31/2021 12/31/2020 9/30/2020 6/30/2020 6/30/2021 6/30/2020 Efficiency ratio 52.42% 49.62% 62.52% 48.12% 46.02% 51.01% 46.76% Net interest income $ 67,131 $ 65,635 $ 66,766 $ 65,870 $ 65,757 $ 132,766 $ 133,162 Noninterest income 12,456 14,
Slide 31: Veritex Holdings, Inc.
Veritex Holdings, Inc.
Source: SEC EDGAR · 8-K filed Aug 31, 2021
More decks from Veritex Holdings Inc
 Merger or Acquisition (July 2025)17 slides · Jul 14, 2025
 Q1 2025 Earnings Presentation22 slides · Apr 23, 2025
 Q4 2024 Earnings Presentation22 slides · Jan 28, 2025
 Q3 2024 Earnings Presentation24 slides · Oct 23, 2024
 Investor Presentation (August 2024)30 slides · Aug 27, 2024
 Q2 2024 Earnings Presentation22 slides · Jul 24, 2024