Comerica — Comerica Inc /New/ — Barclays Capital Global Financial Services Conference 2012
18 slides from Comerica's conference presentation, Sep 7, 2012
Slide 1: Comerica Incorporated – Barclays Capital Global Financial Services Conference
Comerica IncorporatedBarclays Capital Global Financial Services ConferenceSeptember 11, 2012Ralph W. Babb, Jr. Karen Parkhill Chairman and CEO Vice Chairman and CFO Lars Anderson Vice Chairman – The Business Bank Safe Harbor Statement 2 Any statements in this presentation that are not historical fac
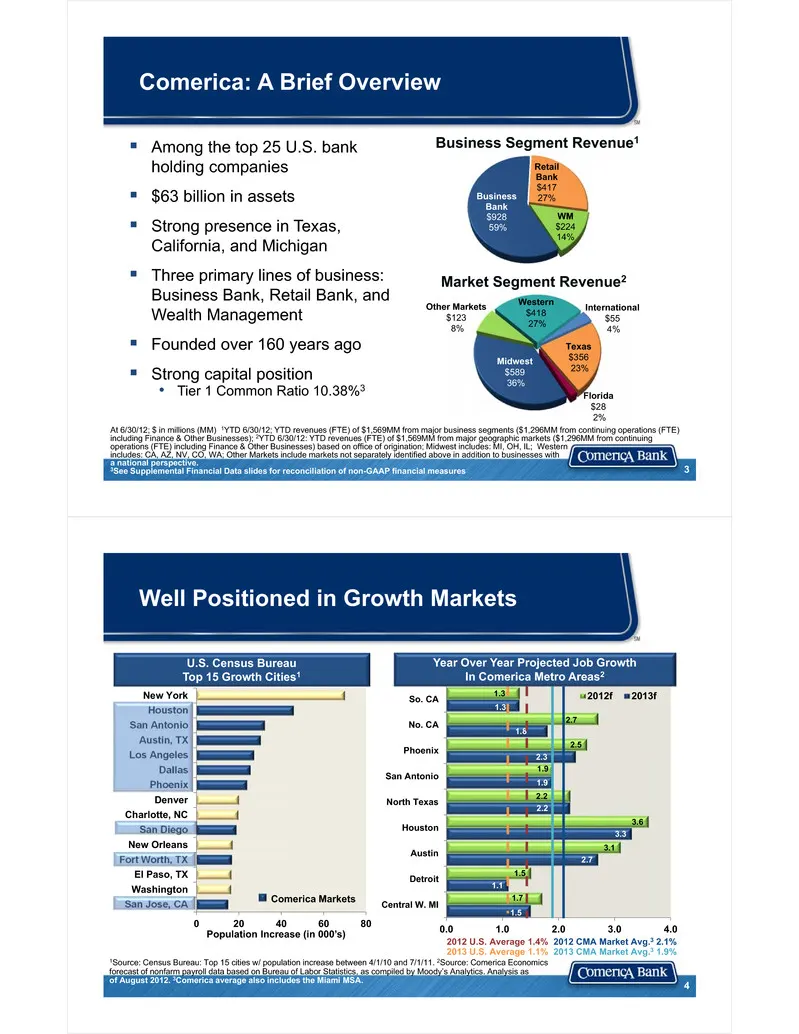
Slide 2: Comerica: A Brief Overview
Comerica: A Brief Overview Among the top 25 U.S. bank holding companies $63 billion in assets Strong presence in Texas, California, and Michigan Three primary lines of business: Business Bank, Retail Bank, and Wealth Management Founded over 160 years ago Strong capital position• Tier 1 C
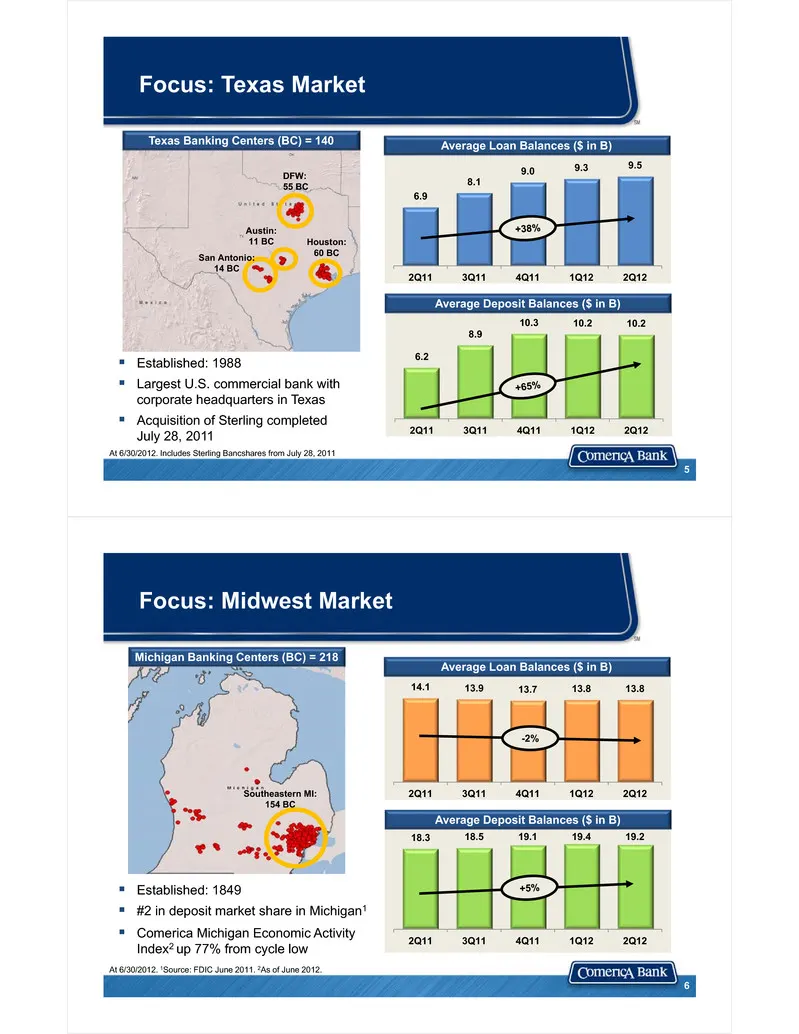
Slide 3: Focus: Texas Market / Focus: Midwest Market
Established: 1988 Largest U.S. commercial bank with corporate headquarters in Texas Acquisition of Sterling completed July 28, 2011 Focus: Texas Market 6.2 8.9 10.3 10.2 10.2 2Q11 3Q11 4Q11 1Q12 2Q12 Average Deposit Balances ($ in B) 5 6.9 8.1 9.0 9.3 9.5 2Q11 3Q11 4Q11 1Q12 2Q12 Average Loan
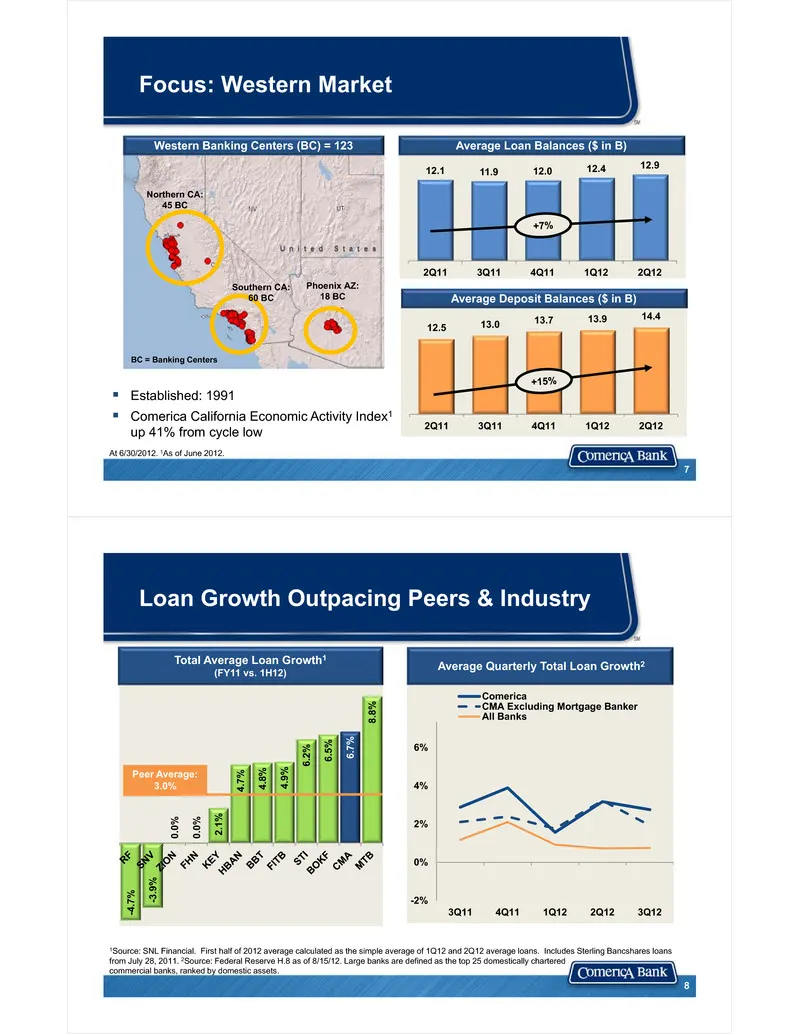
Slide 4: Focus: Western Market
Focus: Western Market Established: 1991 Comerica California Economic Activity Index1 up 41% from cycle low 12.5 13.0 13.7 13.9 14.4 2Q11 3Q11 4Q11 1Q12 2Q12 Average Deposit Balances ($ in B) At 6/30/2012. 1As of June 2012. 7 12.1 11.9 12.0 12.4 12.9 2Q11 3Q11 4Q11 1Q12 2Q12 Average Loan Balances
Slide 5: Commercial Loans Drive Growth
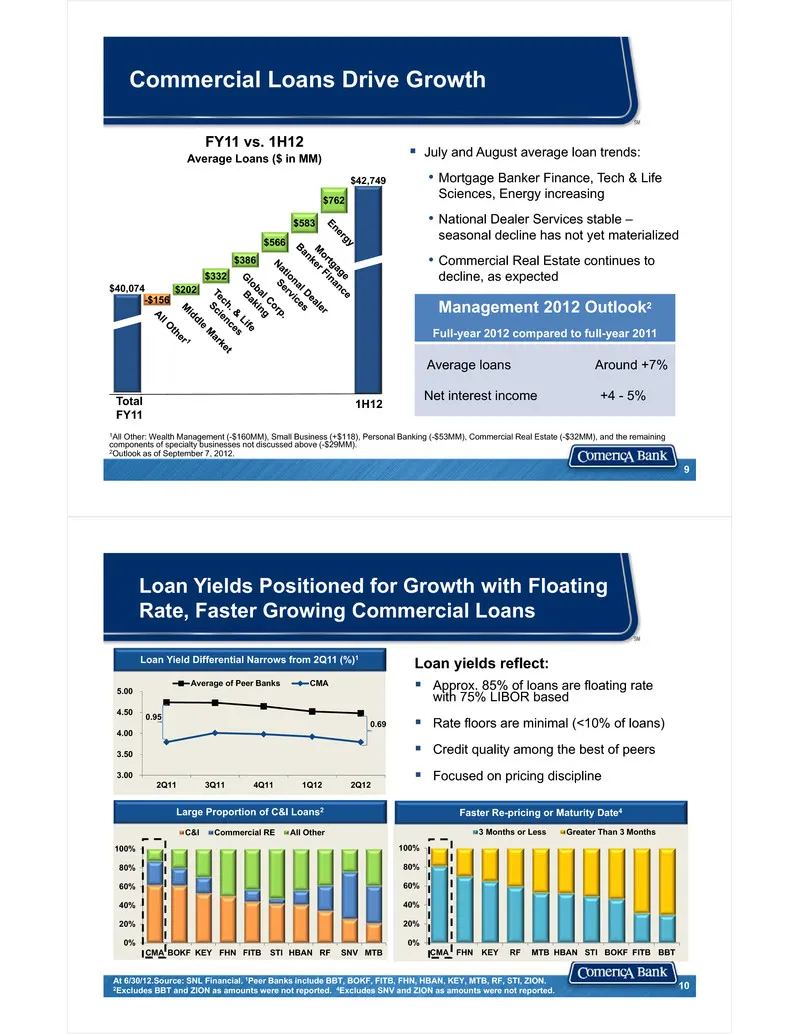
Commercial Loans Drive Growth 1All Other: Wealth Management (-$160MM), Small Business (+$118), Personal Banking (-$53MM), Commercial Real Estate (-$32MM), and the remaining components of specialty businesses not discussed above (-$29MM). 2Outlook as of September 7, 2012. 9 FY11 vs. 1H12Average Loans
Slide 6: Growing Deposit Base: Provides Low Cost Funding
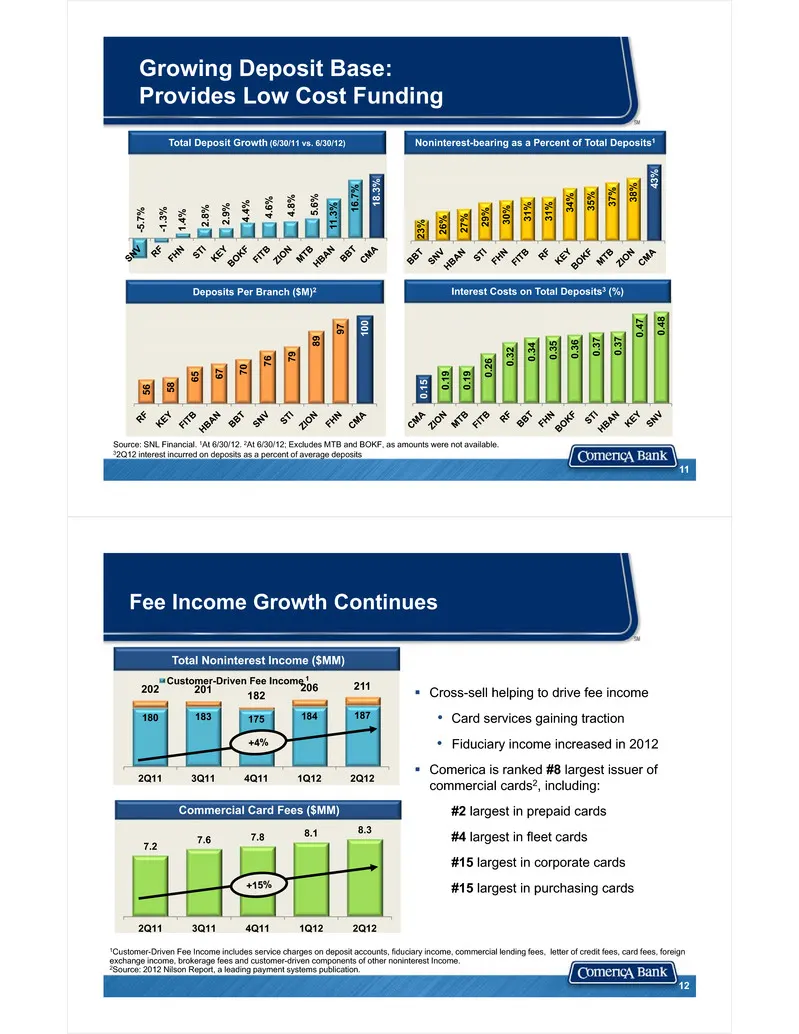
Growing Deposit Base: Provides Low Cost Funding 11 23% 26% 27 % 29% 30% 31 % 31% 34 % 35% 37% 38 % 43% Noninterest-bearing as a Percent of Total Deposits1 0.15 0. 19 0.19 0 .26 0.3 2 0.34 0.35 0.3 6 0.37 0.37 0.47 0.48 -5.7 % -1.3 % 1.4% 2.8 % 2.9% 4.4 % 4.6% 4.8% 5.6 % 11.3 % 16.7 % 18.3 % Total De
Slide 7: Disciplined Expense Management
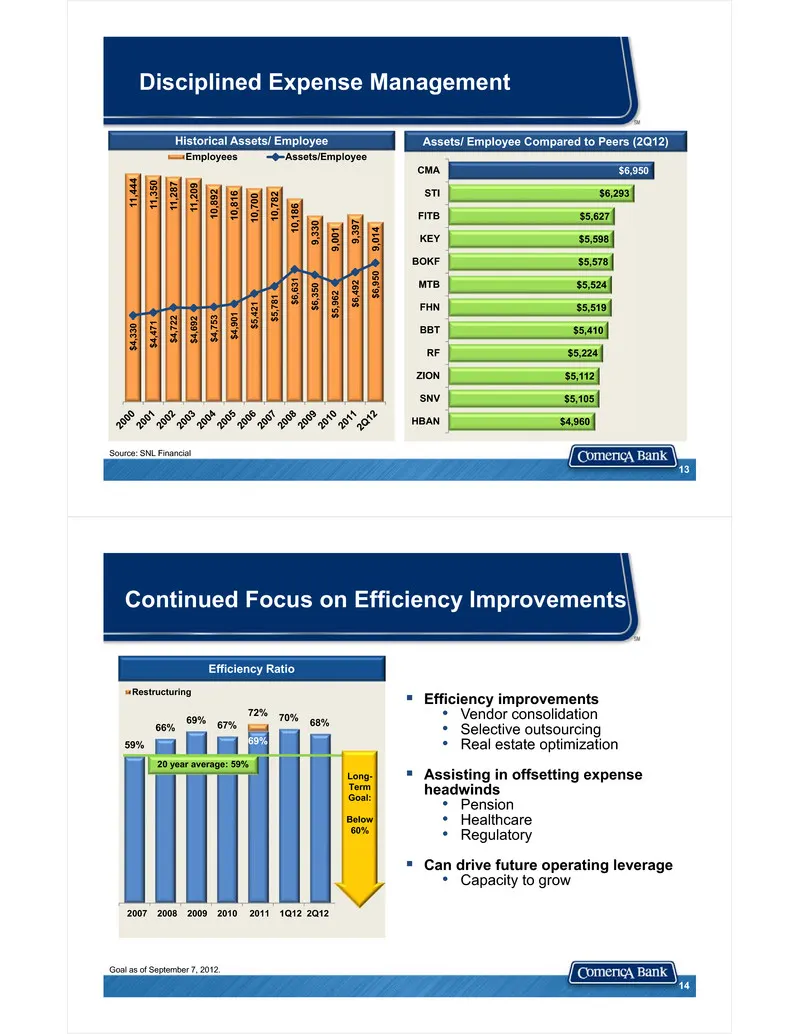
Disciplined Expense Management 13 11,4 44 11,3 50 11,2 87 11,2 09 10,8 92 10,8 16 10,7 00 10,7 82 10,1 86 9,33 0 9,00 1 9,39 7 9,01 4 $4,3 30 $4,4 71 $4,7 22 $4,6 92 $4,7 53 $4,9 01 $5,4 21 $5,7 81 $6,6 31 $6,3 50 $5,9 62 $6,4 92 $6,9 50 Employees Assets/EmployeeHistorical Assets/ Employee $4,960 $5
Slide 8: Capital Position Remains Strong Even Under Proposed Rules
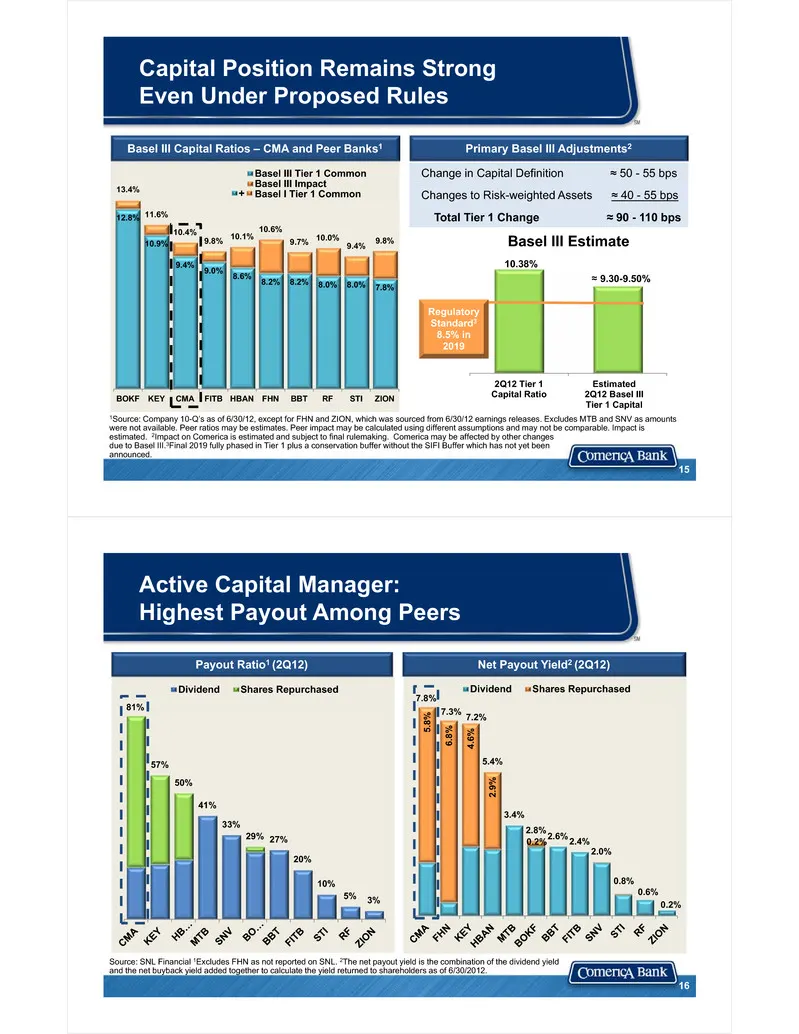
15 2Q12 Tier 1Capital Ratio Estimated2Q12 Basel IIITier 1 Capital Basel III Estimate 10.38% ≈ 9.30-9.50% Capital Position Remains StrongEven Under Proposed Rules Regulatory Standard38.5% in 2019 1Source: Company 10-Q’s as of 6/30/12, except for FHN and ZION, which was sourced from 6/30/12 earnings r
Slide 9: Well Positioned for the Future
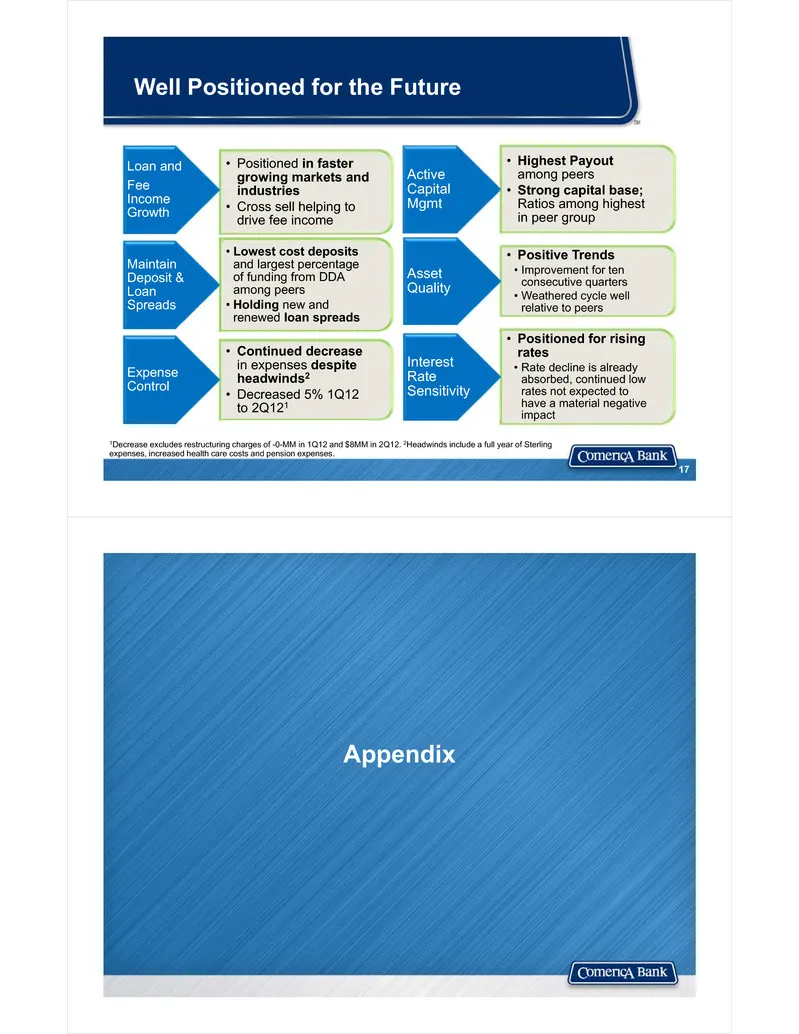
• Highest Payout among peers• Strong capital base; Ratios among highest in peer group Active Capital Mgmt • Positive Trends• Improvement for ten consecutive quarters• Weathered cycle well relative to peers Asset Quality • Positioned for rising rates• Rate decline is already absorbed, continued low r
Slide 10: Financial Results
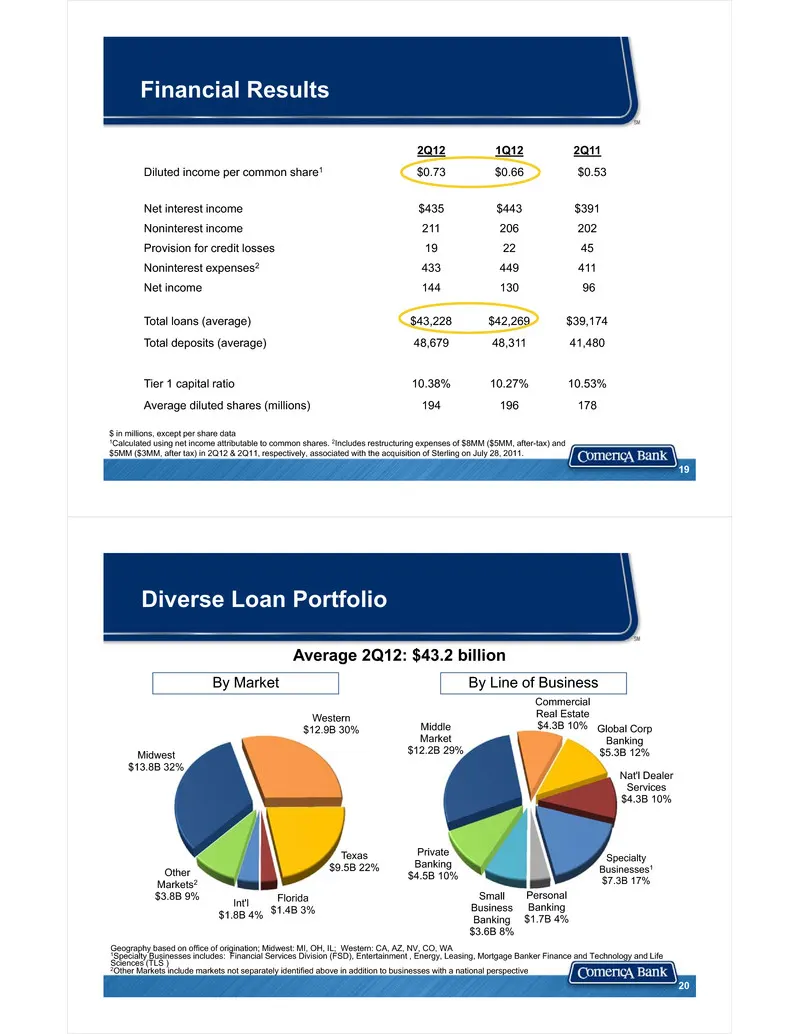
Financial Results $ in millions, except per share data1Calculated using net income attributable to common shares. 2Includes restructuring expenses of $8MM ($5MM, after-tax) and $5MM ($3MM, after tax) in 2Q12 & 2Q11, respectively, associated with the acquisition of Sterling on July 28, 2011. 2Q12 1Q1
Slide 11: Loan Commitments and Utilization Increase
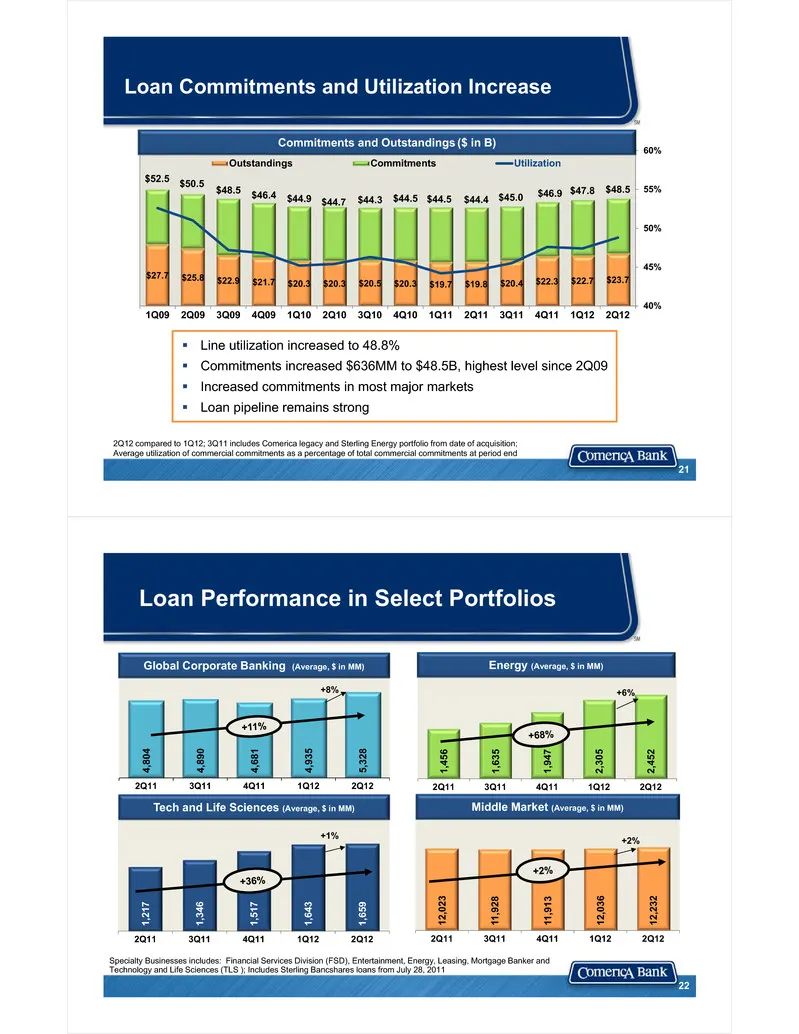
Loan Commitments and Utilization Increase $27.7 $25.8 $22.9 $21.7 $20.3 $20.3 $20.5 $20.3 $19.7 $19.8 $20.4 $22.3 $22.7 $23.7 $52.5 $50.5 $48.5 $46.4 $44.9 $44.7 $44.3 $44.5 $44.5 $44.4 $45.0 $46.9 $47.8 $48.5 40% 45% 50% 55% 60% 1Q09 2Q09 3Q09 4Q09 1Q10 2Q10 3Q10 4Q10 1Q11 2Q11 3Q11 4Q11 1Q12 2Q12
Slide 12: Focus: Mortgage Banker Finance / National Dealer Services
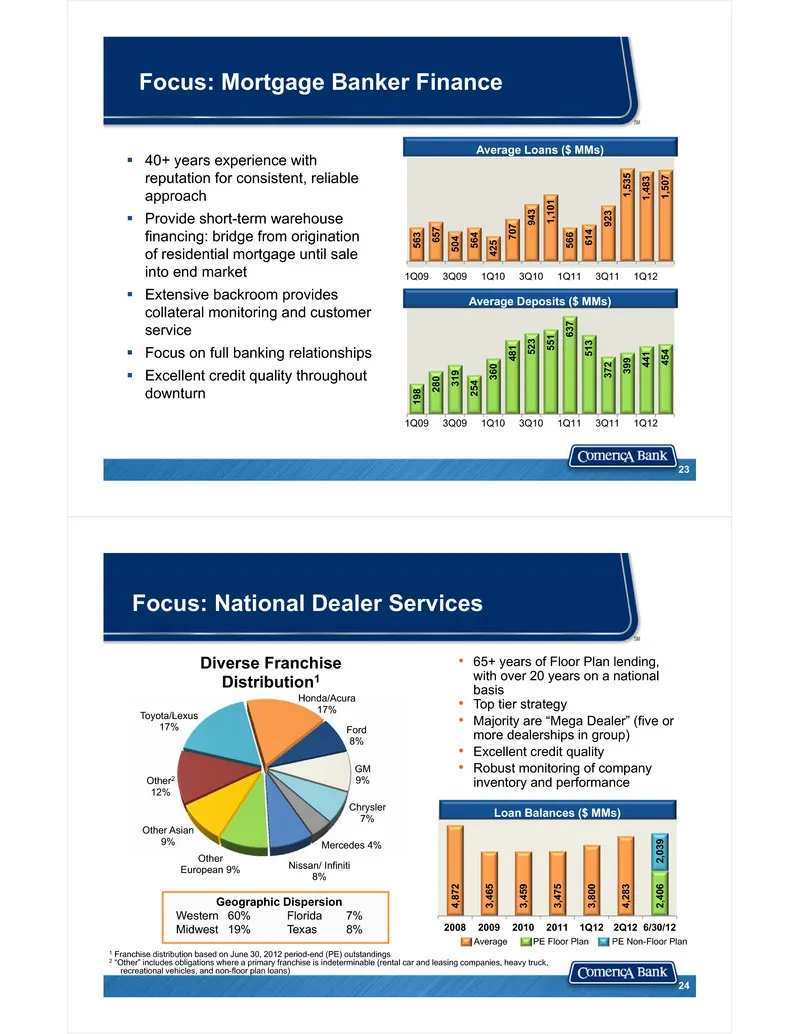
Focus: Mortgage Banker Finance 23 40+ years experience with reputation for consistent, reliable approach Provide short-term warehouse financing: bridge from origination of residential mortgage until sale into end market Extensive backroom provides collateral monitoring and customer service F
Slide 13: Focus: Energy
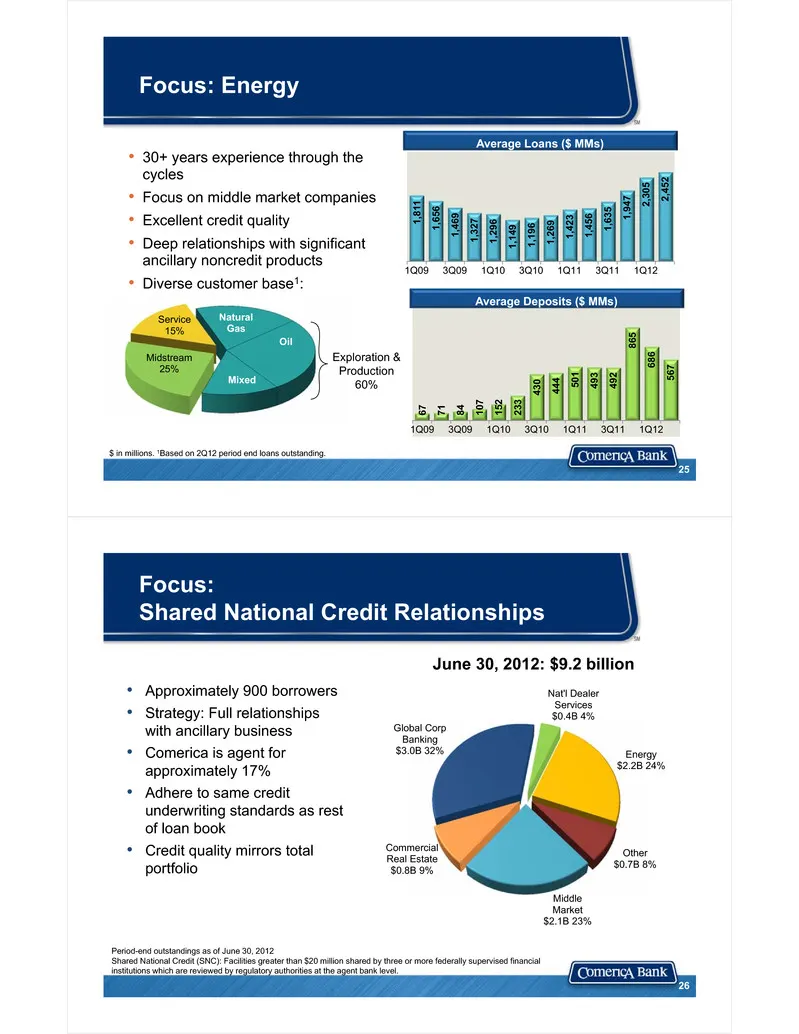
Focus: Energy • 30+ years experience through the cycles • Focus on middle market companies• Excellent credit quality• Deep relationships with significant ancillary noncredit products • Diverse customer base1: Natural Gas Oil Mixed Midstream 25% Service 15% Exploration & Production 60% $ in millions.
Slide 14: Focus: Commercial Real Estate
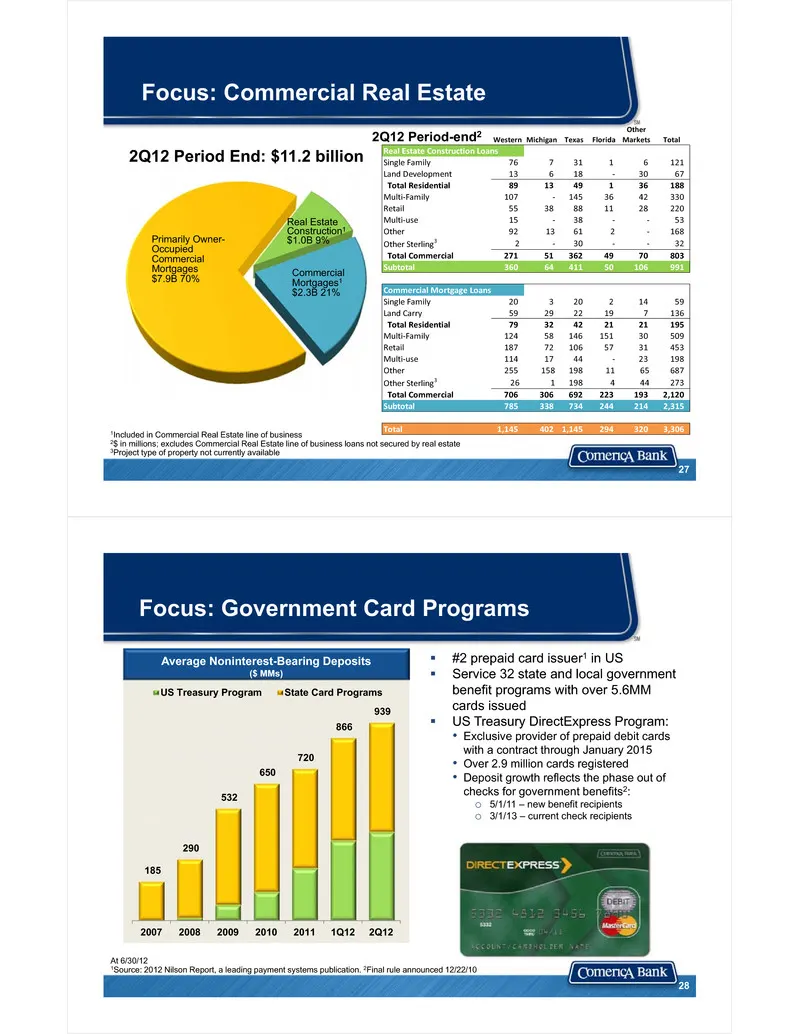
Focus: Commercial Real Estate 1Included in Commercial Real Estate line of business2$ in millions; excludes Commercial Real Estate line of business loans not secured by real estate3Project type of property not currently available 2Q12 Period End: $11.2 billion Primarily Owner-Occupied Commercial Mort
Slide 15: MBS Securities Portfolio Stable
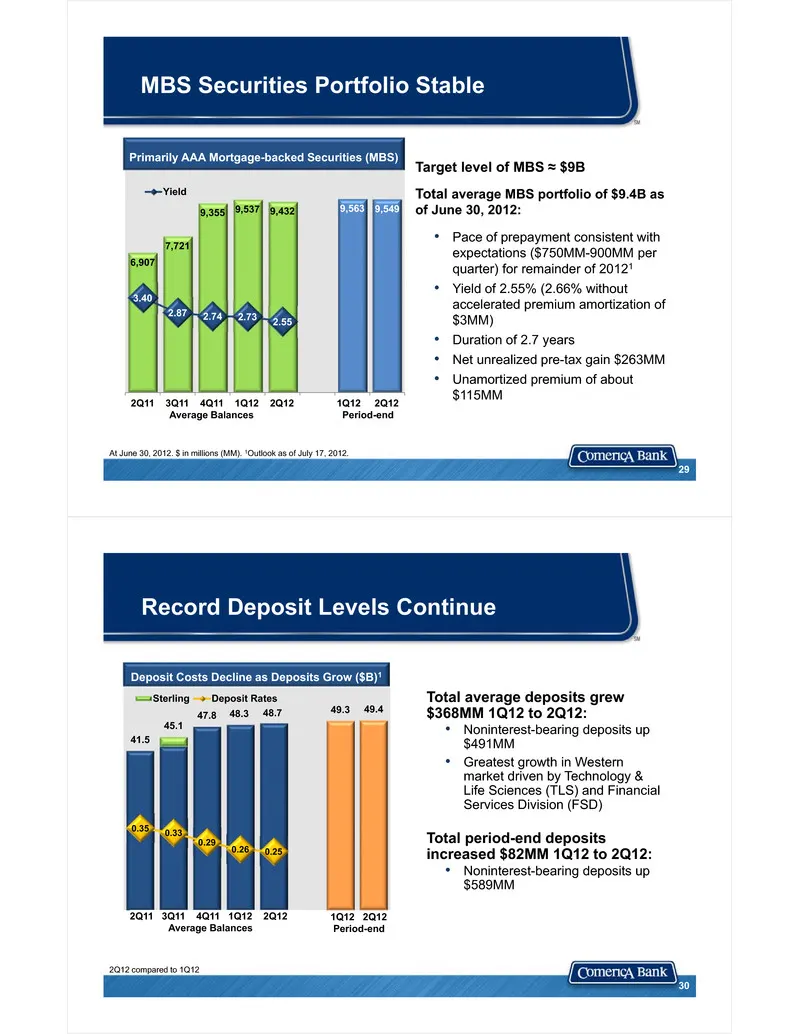
MBS Securities Portfolio Stable Target level of MBS ≈ $9B Total average MBS portfolio of $9.4B as of June 30, 2012: • Pace of prepayment consistent with expectations ($750MM-900MM per quarter) for remainder of 20121• Yield of 2.55% (2.66% without accelerated premium amortization of $3MM)• Duration o
Slide 16: Strong Credit Quality
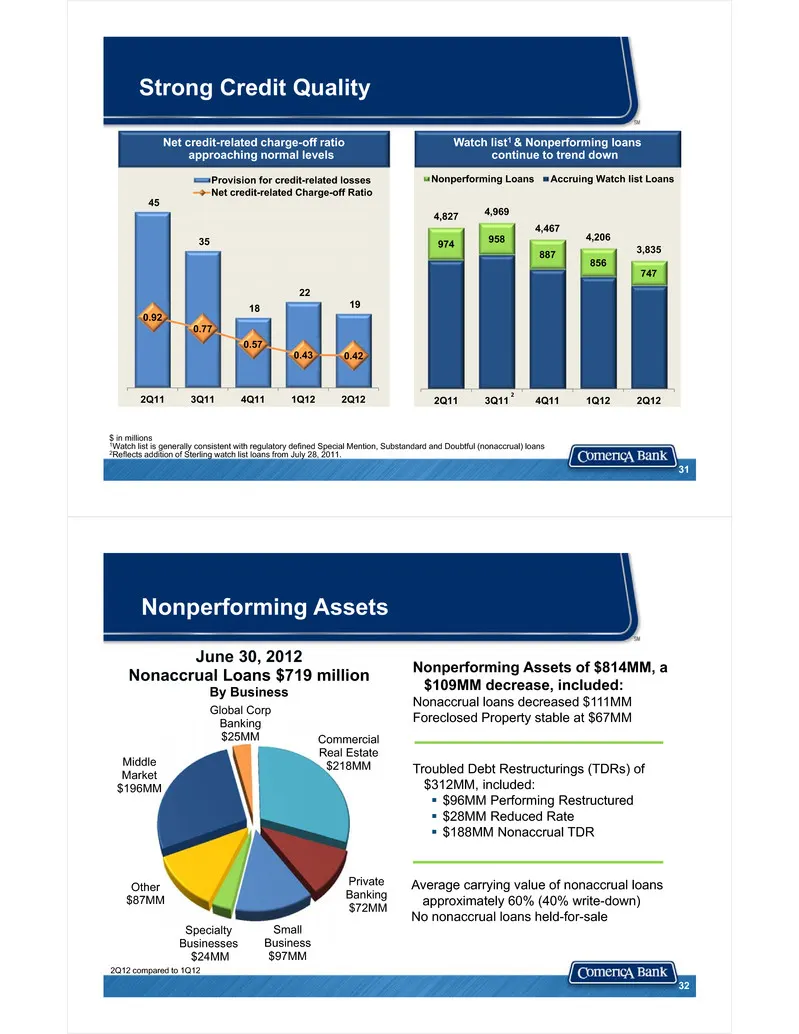
Strong Credit Quality $ in millions1Watch list is generally consistent with regulatory defined Special Mention, Substandard and Doubtful (nonaccrual) loans2Reflects addition of Sterling watch list loans from July 28, 2011. 1 31 45 35 18 22 19 0.92 0.77 0.57 0.43 0.42 2Q11 3Q11 4Q11 1Q12 2Q12 Provisi
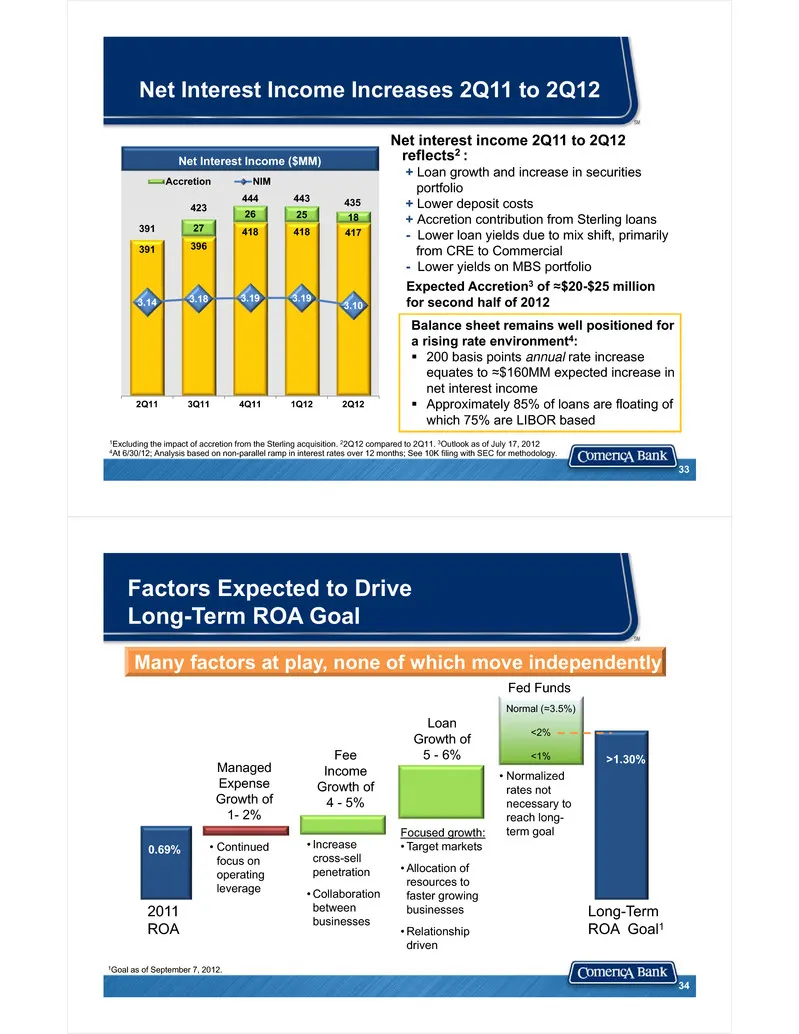
Slide 17: Net Interest Income Increases 2Q11 to 2Q12
Net Interest Income Increases 2Q11 to 2Q12 1Excluding the impact of accretion from the Sterling acquisition. 22Q12 compared to 2Q11. 3Outlook as of July 17, 20124At 6/30/12; Analysis based on non-parallel ramp in interest rates over 12 months; See 10K filing with SEC for methodology. Net interest in
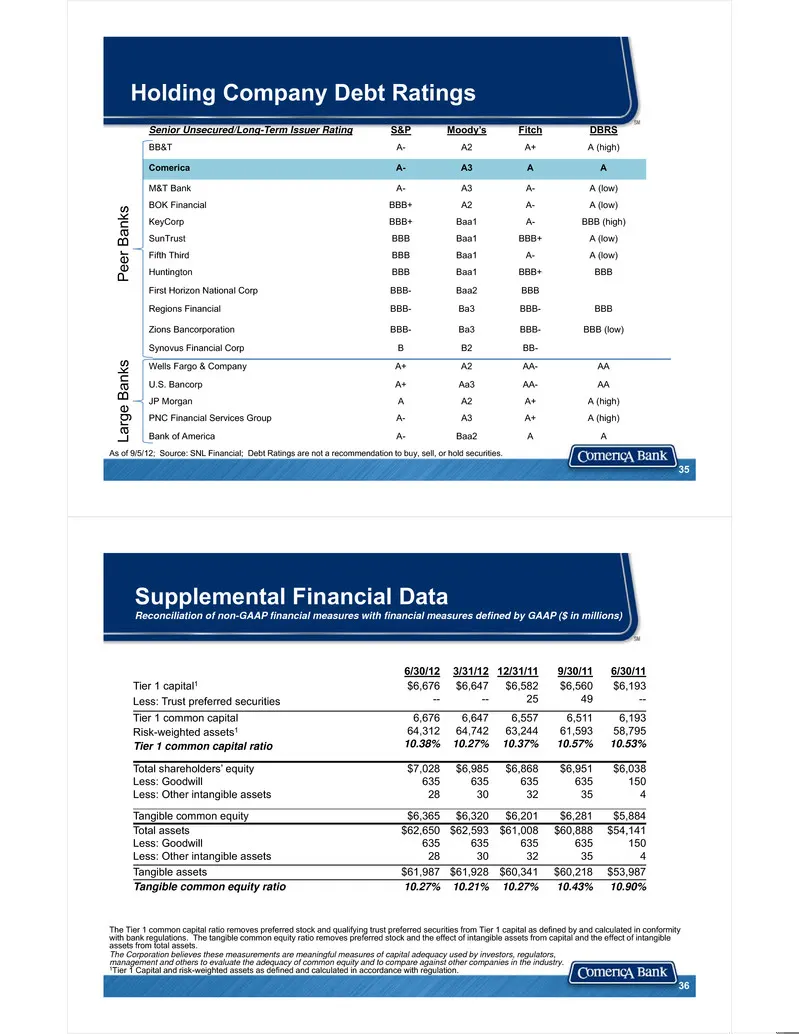
Slide 18: Holding Company Debt Ratings / Supplemental Financial Data
Senior Unsecured/Long-Term Issuer Rating S&P Moody’s Fitch DBRS BB&T A- A2 A+ A (high) Comerica A- A3 A A M&T Bank A- A3 A- A (low) BOK Financial BBB+ A2 A- A (low) KeyCorp BBB+ Baa1 A- BBB (high) SunTrust BBB Baa1 BBB+ A (low) Fifth Third BBB Baa1 A- A (low) Huntington BBB Baa1 BBB+ BBB First Horiz
Source: SEC EDGAR · 8-K filed Sep 7, 2012
More decks from Comerica Incorporated
 Goldman Sachs Financial Services Conference 202520 slides · Dec 11, 2025
 Merger or Acquisition (October 2025)18 slides · Oct 6, 2025
 Barclays Global Financial Services Conference 202524 slides · Sep 8, 2025
 Q2 2025 Earnings Presentation24 slides · Jul 18, 2025
 Q1 2025 Earnings Presentation21 slides · Apr 21, 2025
 Q4 2024 Earnings Presentation24 slides · Jan 22, 2025