Vertex Energy — Q2 2022 Earnings Presentation
20 slides from Vertex Energy's earnings presentation, Aug 9, 2022
Slide 1: Second Quarter 2022 Results Conference Call
Second Quarter 2022 Results Conference Call August 2022
Slide 2: Forward-looking statements
Certain of the matters discussed in this communication which are not statements of historical fact constitute forward - looking statements within the meaning of the federal securities laws, including the Private Securities Litigation Reform Act of 1995 , that involve a number of risks and uncertaint
Slide 3: Non-GAAP financial measures
In addition to our results calculated under generally accepted accounting principles in the United States ("GAAP"), in this earnings release we also present Refining Gross Margin, EBITDA and Adjusted EBITDA . Refining Gross Margin, EBITDA and Adjusted EBITDA are “non - GAAP financial measures” prese
Slide 4: Second Quarter 2022 Performance Summary
SECOND QUARTER 2022 Performance Summary
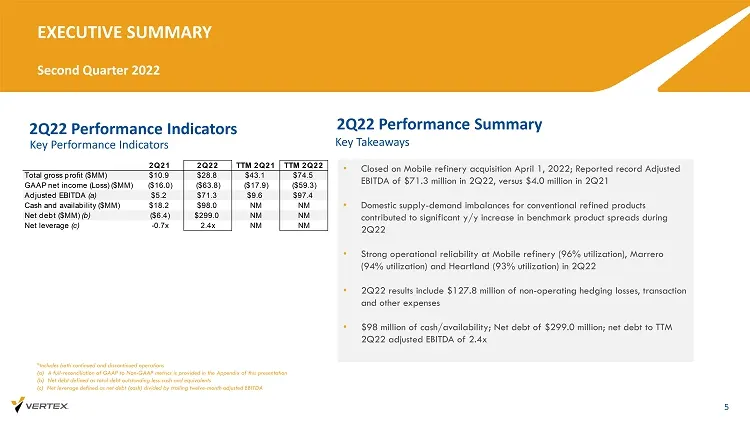
Slide 5: 2Q22 Performance Indicators - Executive Summary
2Q22 Performance Indicators EXECUTIVE SUMMARY Second Quarter 2022 5 2Q22 Performance Summary • Closed on Mobile refinery acquisition April 1, 2022; Reported record Adjusted EBITDA of $71.3 million in 2Q22, versus $4.0 million in 2Q21 • Domestic supply - demand imbalances for conventional refined pro
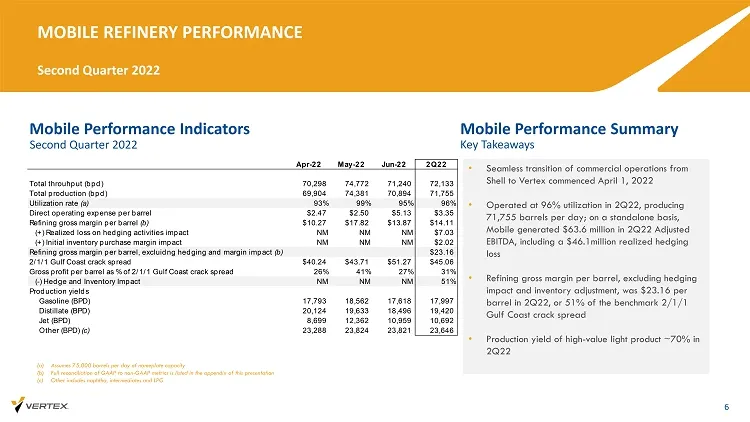
Slide 6: Mobile Refinery Performance Indicators
Mobile Performance Indicators MOBILE REFINERY PERFORMANCE Second Quarter 2022 6 Mobile Performance Summary • Seamless transition of commercial operations from Shell to Vertex commenced April 1, 2022 • Operated at 96% utilization in 2Q22, producing 71,755 barrels per day; on a standalone basis, Mobil
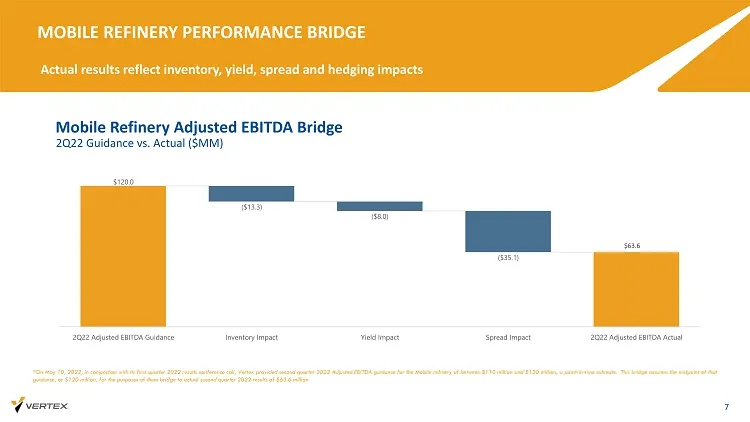
Slide 7: Mobile Refinery Performance Bridge
MOBILE REFINERY PERFORMANCE BRIDGE Actual results reflect inventory, yield, spread and hedging impacts 7 *On May 10, 2022, in conjunction with its first quarter 2022 results conference call, Vertex provided second quarter 2022 Adj ust ed EBITDA guidance for the Mobile refinery of between $110 millio
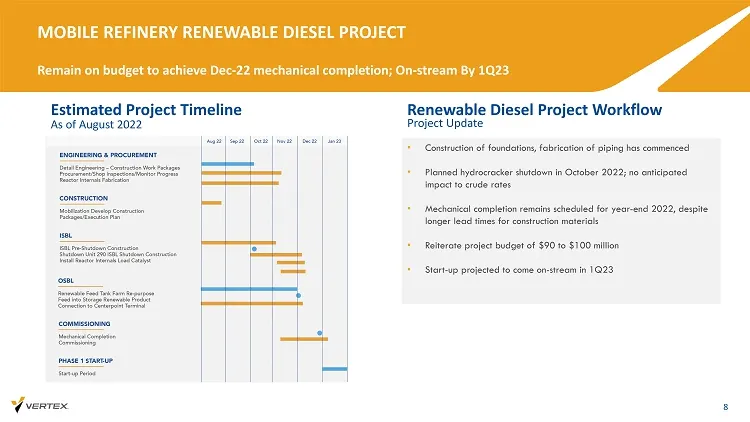
Slide 8: Mobile Refinery Renewable Diesel Project
MOBILE REFINERY RENEWABLE DIESEL PROJECT Remain on budget to achieve Dec - 22 mechanical completion; On - stream By 1Q23 8 Renewable Diesel Project Workflow Project Update • Construction of foundations, fabrication of piping has commenced • Planned hydrocracker shutdown in October 2022; no anticipat
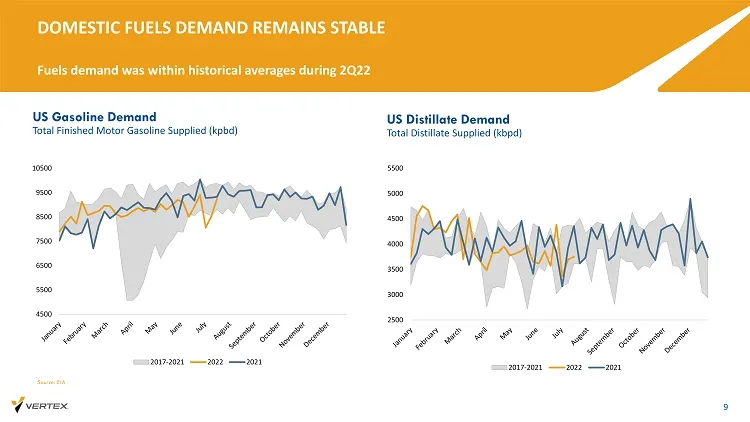
Slide 9: Domestic Fuels Demand Remains Stable
DOMESTIC FUELS DEMAND REMAINS STABLE Fuels demand was within historical averages during 2Q22 US Gasoline Demand 9 Total Finished Motor Gasoline Supplied ( kpbd ) US Distillate Demand Total Distillate Supplied ( kbpd ) 4500 5500 6500 7500 8500 9500 10500 2017-2021 2022 2021 2500 3000 3500 4000 4500 5
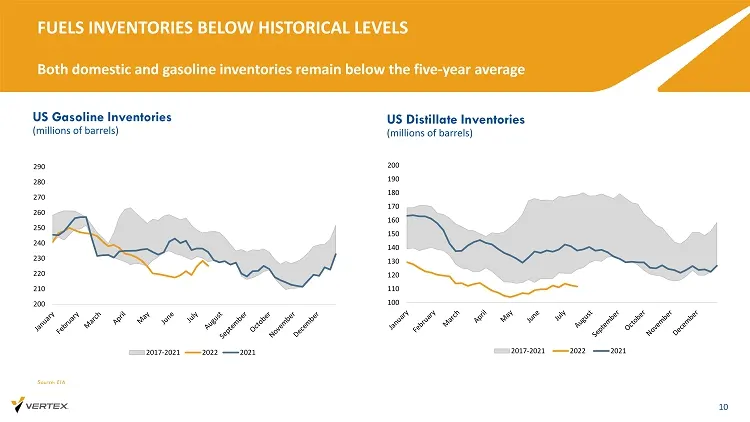
Slide 10: Fuels Inventories Below Historical Levels
FUELS INVENTORIES BELOW HISTORICAL LEVELS Both domestic and gasoline inventories remain below the five - year average US Gasoline Inventories 10 (millions of barrels) US Distillate Inventories (millions of barrels) Source: EIA 200 210 220 230 240 250 260 270 280 290 2017-2021 2022 2021 100 110 120 1
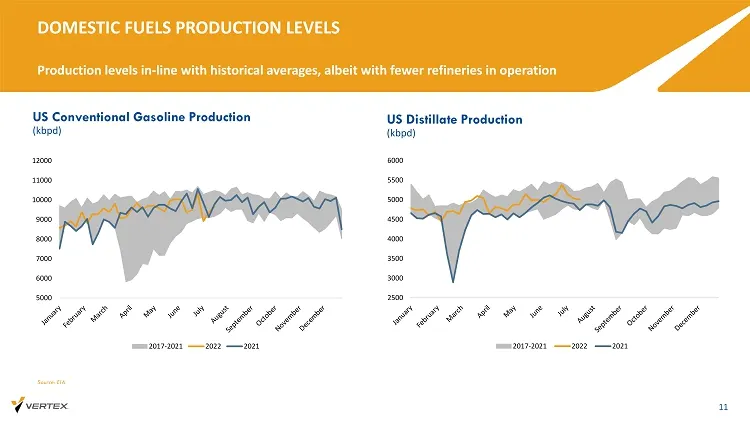
Slide 11: Domestic Fuels Production Levels
DOMESTIC FUELS PRODUCTION LEVELS Production levels in - line with historical averages, albeit with fewer refineries in operation US Conventional Gasoline Production 11 ( kbpd ) US Distillate Production ( kbpd ) Source: EIA 2500 3000 3500 4000 4500 5000 5500 6000 2017-2021 2022 2021 5000 6000 7000 80
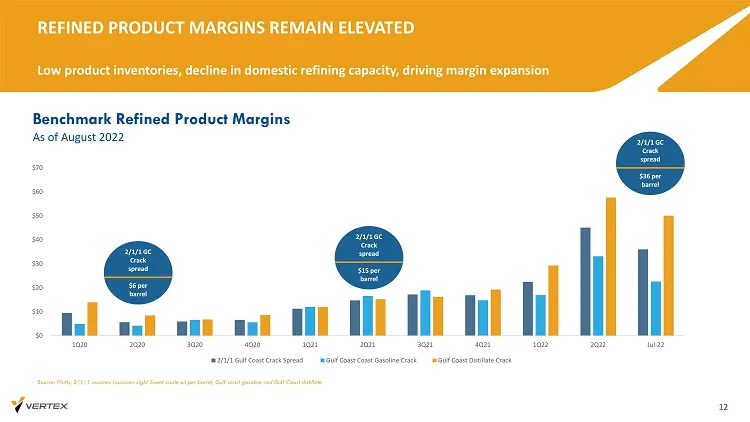
Slide 12: Refined Product Margins Remain Elevated
REFINED PRODUCT MARGINS REMAIN ELEVATED Low product inventories, decline in domestic refining capacity, driving margin expansion Benchmark Refined Product Margins 12 As of August 2022 2/1/1 GC Crack spread $6 per barrel 2/1/1 GC Crack spread $15 per barrel 2/1/1 GC Crack spread $36 per barrel Source
Slide 13: Balance Sheet Update
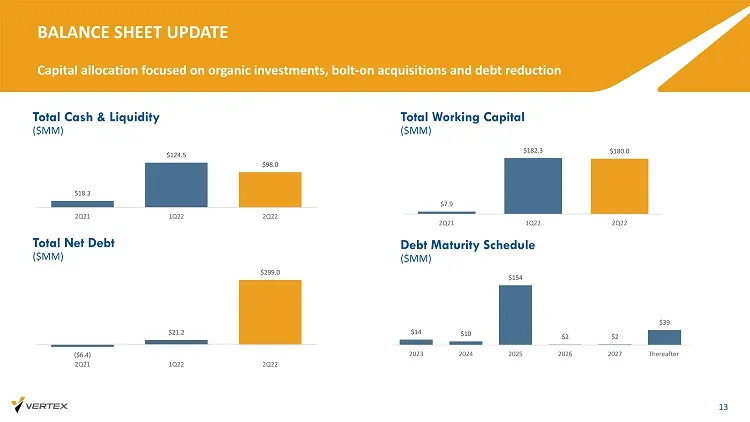
BALANCE SHEET UPDATE Capital allocation focused on organic investments, bolt - on acquisitions and debt reduction 13 Total Cash & Liquidity ($MM) Total Working Capital ($MM) Total Net Debt ($MM) Debt Maturity Schedule ($MM) $18.3 $124.5 $98.0 2Q21 1Q22 2Q22 $7.9 $182.3 $180.0 2Q21 1Q22 2Q22 ($6.4) $
Slide 14: Projected Financial Guidance
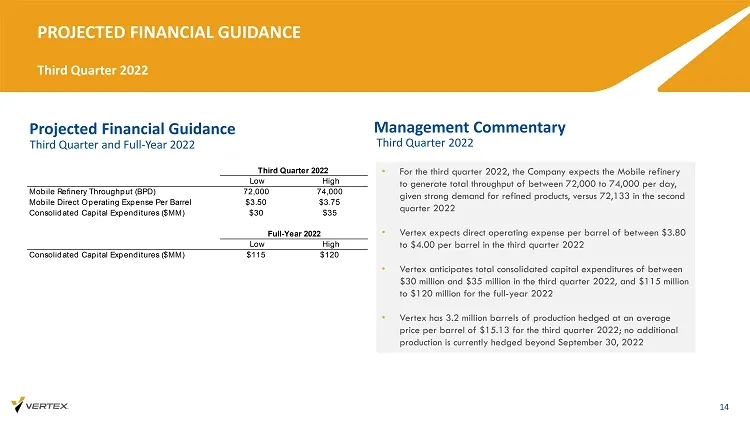
Projected Financial Guidance PROJECTED FINANCIAL GUIDANCE Third Quarter 2022 14 Management Commentary • For the third quarter 2022, the Company expects the Mobile refinery to generate total throughput of between 72,000 to 74,000 per day, given strong demand for refined products, versus 72,133 in the
Slide 15: Our Strategic Focus
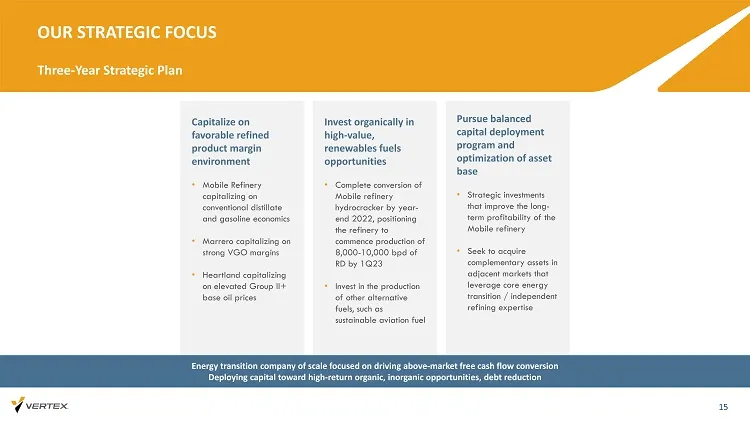
OUR STRATEGIC FOCUS Three - Year Strategic Plan 15 Pursue balanced capital deployment program and optimization of asset base • Strategic investments that improve the long - term profitability of the Mobile refinery • Seek to acquire complementary assets in adjacent markets that leverage core energy

Slide 16: Appendix
APPENDIX
Slide 17: Non-GAAP Reconciliation: Refining Gross Margin
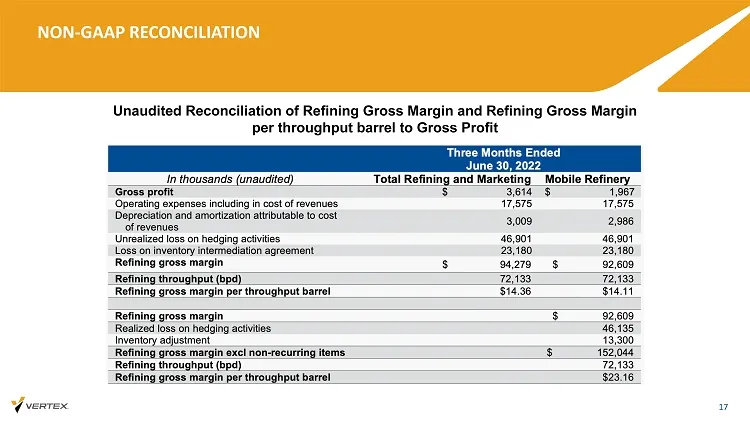
NON - GAAP RECONCILIATION 17 Unaudited Reconciliation of Refining Gross Margin and Refining Gross Margin per throughput barrel to Gross Profit
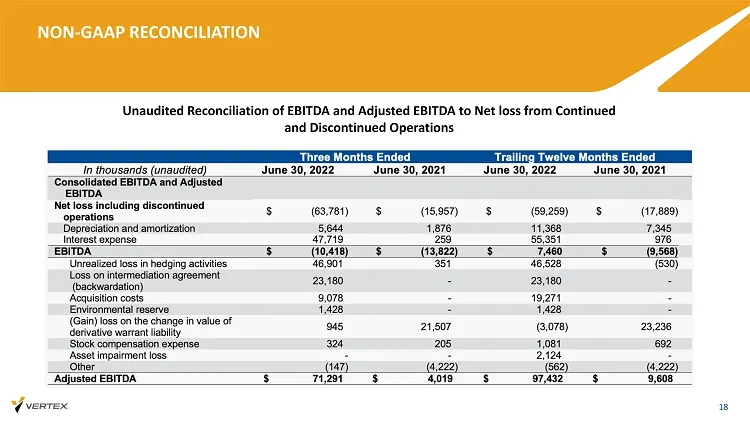
Slide 18: Non-GAAP Reconciliation: EBITDA and Adjusted EBITDA
NON - GAAP RECONCILIATION 18 Unaudited Reconciliation of EBITDA and Adjusted EBITDA to Net loss from Continued and Discontinued Operations
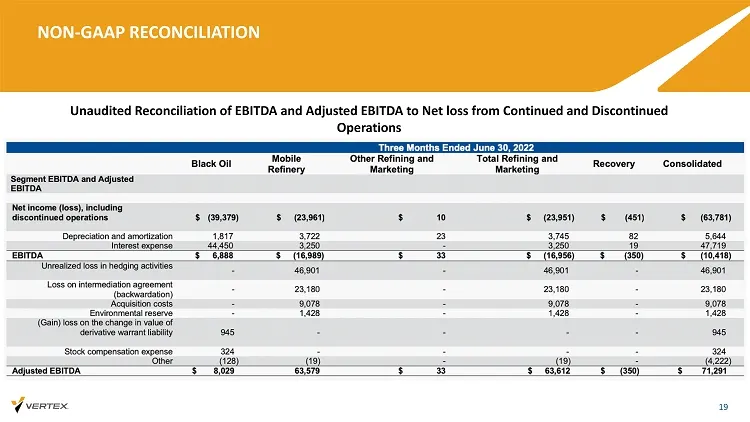
Slide 19: Non-GAAP Reconciliation: EBITDA and Adjusted EBITDA
NON - GAAP RECONCILIATION 19 Unaudited Reconciliation of EBITDA and Adjusted EBITDA to Net loss from Continued and Discontinued Operations
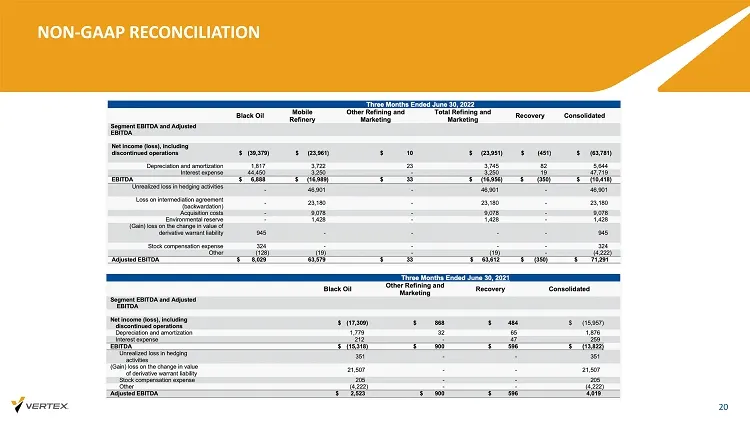
Slide 20: Non-GAAP Reconciliation
NON - GAAP RECONCILIATION 20
Source: SEC EDGAR · 8-K filed Aug 9, 2022
More decks from Vertex Energy Inc
 Q2 2024 Earnings Presentation21 slides · Aug 8, 2024
 Q1 2024 Earnings Presentation20 slides · May 9, 2024
 Q4 2023 Earnings Presentation29 slides · Feb 28, 2024
 Q3 2023 Earnings Presentation27 slides · Nov 7, 2023
 Q2 2023 Earnings Presentation26 slides · Aug 9, 2023
 Q1 2023 Earnings Presentation26 slides · May 9, 2023