Heidrick & Struggles International
Heidrick & Struggles International — SunTrust Robinson Humphrey Business & Technology Services Conference 2003
34 slides from Heidrick & Struggles International's conference presentation, Nov 13, 2003

Slide 1: Heidrick & Struggles - SunTrust Robinson Humphrey Conference
H EIDRICK & S TRUGGLES SunTrust Robinson Humphrey Business & Technology Services Conference November 13, 2003

Slide 2: Safe Harbor Statement
This presentation contains forward-looking statements. The forward-looking statements are based on current expectations, estimates, forecasts and projections about the industry in which we operate and management's beliefs and assumptions. Forward-looking statements may be identified by the use of wo

Slide 3: Business Overview
Business Overview

Slide 4: Heidrick & Struggles
World’s premiere executive search and leadership consulting firm Executive Search Includes interim executive placement Leadership Services Executive assessment Coaching Global network of approximately 320 consultants working from 52 offices in principal cities of the world Heidrick & Struggles

Slide 5: Global Presence
Atlanta Boston Chicago Cleveland Dallas Denver Greenwich Houston Los Angeles Menlo Park New York Philadelphia Shanghai Singapore Sydney Taipei Tokyo Amsterdam Barcelona Berlin Brussels Copenhagen Dusseldorf Frankfurt Hamburg Bogota* Buenos Aires Caracas* Lima* Paris Rome Stockholm Vienna Warsaw Zuri
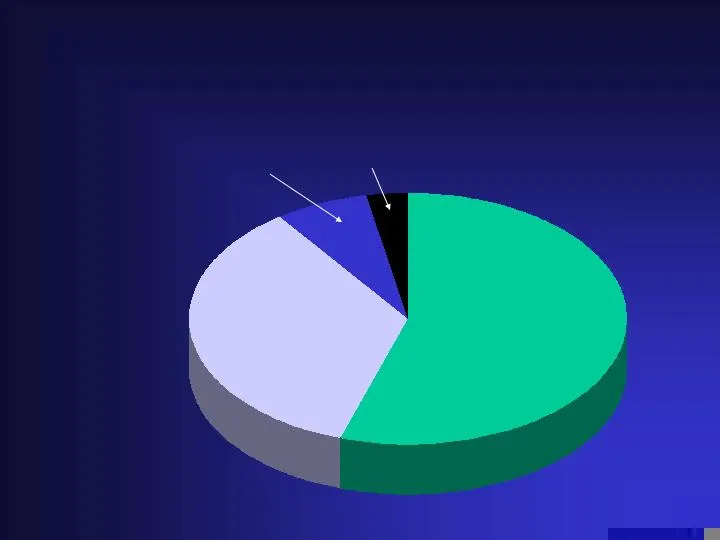
Slide 6: Diverse Geographic Mix
Asia Pacific 7% Latin America 3% Diverse Geographic Mix* * YTD net revenue through September 30, 2003 North America 55% Europe 35%
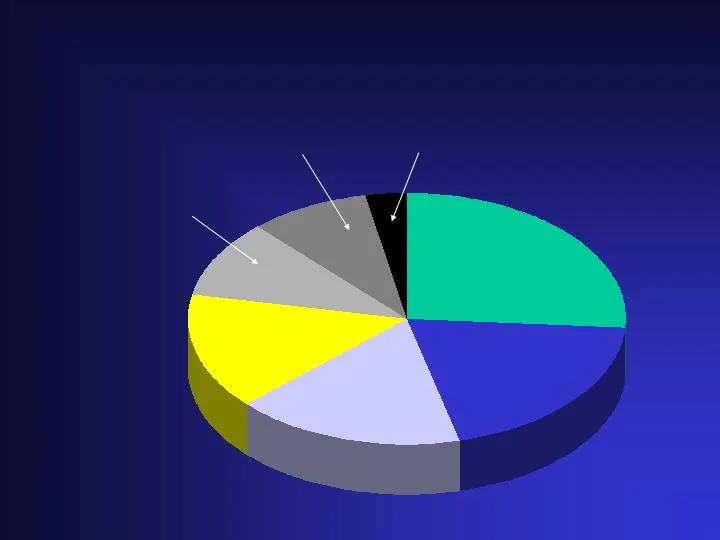
Slide 7: Diverse Industry Practice Mix
Education/Nonprofit; Other 3% Industrial 20% Healthcare 10% Professional Services 9% Diverse Industry Practice Mix* Financial Services 26% Technology 15% Consumer 17% * YTD net revenue through September 30, 2003

Slide 8: World's Largest Search Firms
Firm 2002 Revenue Heidrick & Struggles $ 350.7 M Korn/Ferry 338.3 M Spencer Stuart 269.4 M Egon Zehnder 264.9 M Russell Reynolds 196.1 M Ray & Berndtson 103.1 M Amrop Hever Group 102.5 M Whitehead Mann 94.0 M Hudson Highland Group 66.1 M L.L.C. Partners 50.2 M Source: Kennedy Information World’s Lar

Slide 9: Our Mission
We help our clients build the best leadership teams in the world Our Mission

Slide 10: Focus on Top-Level Services
Board, CEO and other senior-level searches generate the majority of our revenue Advantages of top-level searches Provides access and influence with decision makers Strengthens the Heidrick & Struggles brand Generates higher fees per search Establishes barriers to entry Attracts and retains high-cali
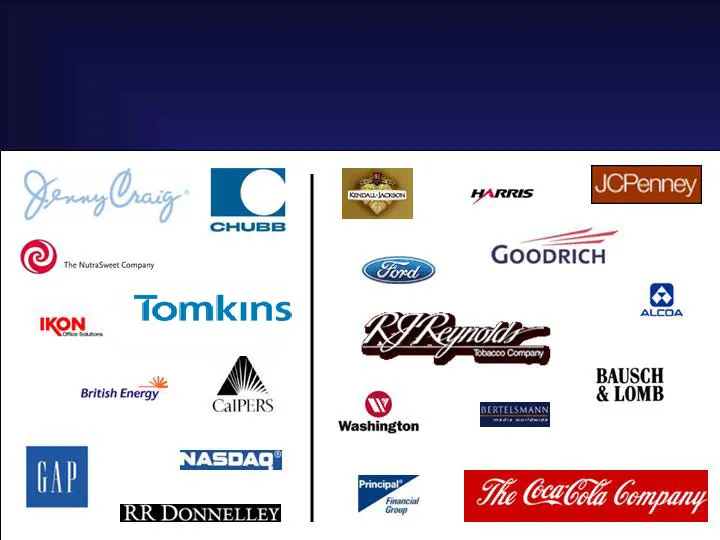
Slide 11: Representative CEO/Board Searches in 2002-2003
Representative CEO/Board Searches in 2002-2003

Slide 12: Economics of the Firm
Fees For executive search it is one-third of placement’s first year cash compensation Includes salary and bonus Billed in three monthly installments Project based for board services, leadership services Consultant compensation Primarily cash 70% based on revenue generation (formula based) and 30% on

Slide 13: Financial Performance
Financial Performance
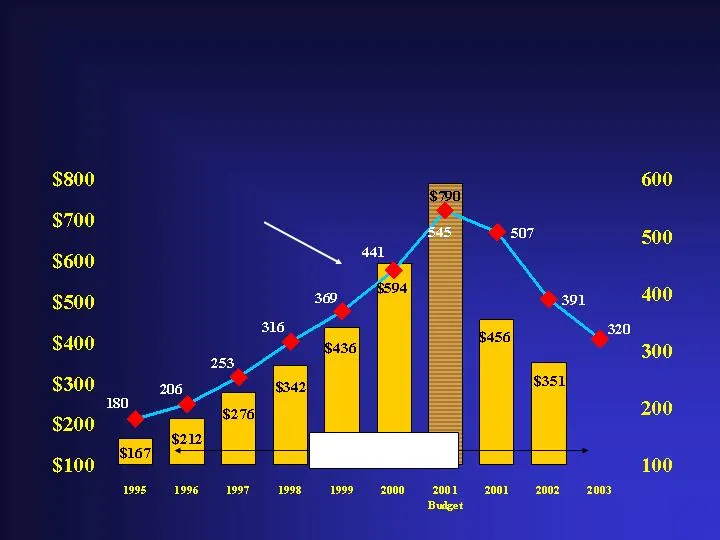
Slide 14: Revenue Performance & Consultant Headcount
Average Number of Consultants Revenue Performance & Consultant Headcount Annual Revenue in Millions Number of Consultants Revenue

Slide 15: Realigned Cost Structure
Reduced costs by over $200 million Reduced workforce by 40% Eliminated excess real estate, bringing the number of offices down from a high of 80 in 2001 to 52 today Reduced management roles by 30% Implemented centralized purchasing programs Realigned Cost Structure

Slide 16: Pro Forma Financial Results
Nine Months Ended Sept. 30 , 2003 2002 $ Change Net Revenue $ 235.9 $ 272.6 $ (36.7) Operating Income (Loss) $ 10.7 $ (0.5) $ 11.2 (Dollars in millions) Columns may not foot due to rounding. * Pro forma results exclude restructuring charges, separation expense for former executives, other severance

Slide 17: Pro Forma Results By Geography
(Dollars in millions) Columns may not foot due to rounding. * Pro forma results exclude restructuring charges, separation expense for former executives, other severance expense, and a favorable adjustment to employee benefits accruals. A full reconciliation of U.S. GAAP and pro forma results is prov

Slide 18: Fourth Quarter 2003
Expected restructuring charge of $15-20 million to better align the European cost structure with current net revenue levels to increase previously established accruals for unused office space Expected revenue range of $70-80 million Corresponding results would range from a loss per share of $0.07 to

Slide 19: Strong Balance Sheet
Strongest in the industry Cash flow positive in 2002 despite significant restructuring activity Ended third quarter of 2003 with $110 million cash and no debt Expect $85-90 million cash at end of 2003, after first tranche of bonuses are paid Strong Balance Sheet

Slide 20: Strategic Initiatives
Strategic Initiatives

Slide 21: Strategic Focus
Some ongoing work on the cost structure Majority of attention will be spent on market-facing activities Strategic Focus

Slide 22: Strategic Initiatives
Expand aggressively our share of senior- level search, supported by our capabilities in complementary leadership services Strategic Initiatives

Slide 23: Strategic Initiatives
Expand aggressively our share of senior- level search, supported by our capabilities in complementary leadership services Build broader, deeper client relationships Strategic Initiatives

Slide 24: Strategic Initiatives
Expand aggressively our share of senior- level search, supported by our capabilities in complementary leadership services Build broader, deeper client relationships Attract and retain the best consultants Strategic Initiatives

Slide 25: Strategic Initiatives
Expand aggressively our share of senior- level search, supported by our capabilities in complementary leadership services Build broader, deeper client relationships Attract and retain the best consultants Improve profitability and cash flow Strategic Initiatives

Slide 26: This Is A Growth Business
The past four years have been aberrations 1999 and 2000 saw hyper-growth 2001 and 2002 saw severe contraction Cyclicality more pronounced than previous recessions 1993-1998 CAGR was 24% Double-digit growth rates should return when the economy improves Fundamentals remain strong This Is A Growth Busi

Slide 27: Fundamentals Are Strong
Shortage of management talent Higher-caliber talent is aspirant and mobile Executive management tenures are at an all time low Focus on corporate governance will create opportunities Cash compensation of placements will continue to rise Fundamentals Are Strong

Slide 28: Summary: Strengths and Goals
Premier brand name in executive search Unparalleled group of consultants Outstanding client base Strongest balance sheet in the sector Capitalize on our strengths Improve margins and cash flow Continue to invest in people and initiatives Summary Strengths Goals

Slide 29: Heidrick & Struggles
H EIDRICK & S TRUGGLES

Slide 30: Reconciliation of Pro Forma Results
The following is a reconciliation of the company’s actual and pro forma financial information. The pro forma financial information is included because the company believes that it more accurately reflects its core operations. Reconciliation of Pro Forma Results

Slide 31: Consolidated Statements of Operations
Actual Adjustments Pro forma Actual Adjustments Pro forma Revenue: Revenue before reimbursements (net revenue) 235,926 - $ $ 235,926 $ 272,555 $ - $ 272,555 $ Reimbursements (1) 17,417 (17,417) - 19,824 (19,824) - Total revenue 253,343 (17,417) 235,926 292,379 (19,824) 272,555 Operating expenses: Sa

Slide 32: Results By Geography 2003
Separation Employee and Benefit Reimbursed Severance Accrual Restructuring Pro forma Expenses Charges Adjustment Charges Actual Revenue North America 129,332 $ - $ - $ - $ - $ 129,332 $ Latin America 8,235 - - - - 8,235 Europe 82,293 - - - - 82,293 Asia Pacific 16,066 - - - - 16,066 Revenue before r

Slide 33: Results By Geography 2002
Reimbursed Restructuring Pro forma Expenses Charges Actual Revenue North America 149,487 $ - $ - $ 149,487 $ Latin America 8,670 - - 8,670 Europe 97,477 - - 97,477 Asia Pacific 16,921 - - 16,921 Revenue before reimbursements (net revenue) 272,555 - - 272,555 Reimbursements - 19,824 - 19,824 Total Co

Slide 34: Schedule Notes
Schedule Notes: (1) Emerging Issues Task Force Issue No. 01-14, "Income Statement Characterization of Reimbursements Received for 'Out-of-Pocket' Expenses Incurred," (EITF 01-14) establishes that reimbursements received for certain out-of-pocket expenses should be reported as revenue. Historically,
Source: SEC EDGAR · 8-K filed Nov 13, 2003
More decks from Heidrick & Struggles International
 Q1 2025 Earnings Presentation20 slides · May 5, 2025
 Q4 2024 Earnings Presentation26 slides · Mar 3, 2025
 Investor Day (December 2024)68 slides · Dec 3, 2024
 Q3 2024 Earnings Presentation24 slides · Nov 4, 2024
 Q2 2024 Earnings Presentation25 slides · Jul 29, 2024
 Q1 2024 Earnings Presentation25 slides · May 6, 2024