Kimball International — Investor Presentation (February 2017)
25 slides from Kimball International's investor presentation, Feb 23, 2017
Slide 1: Investor Presentation February 2017
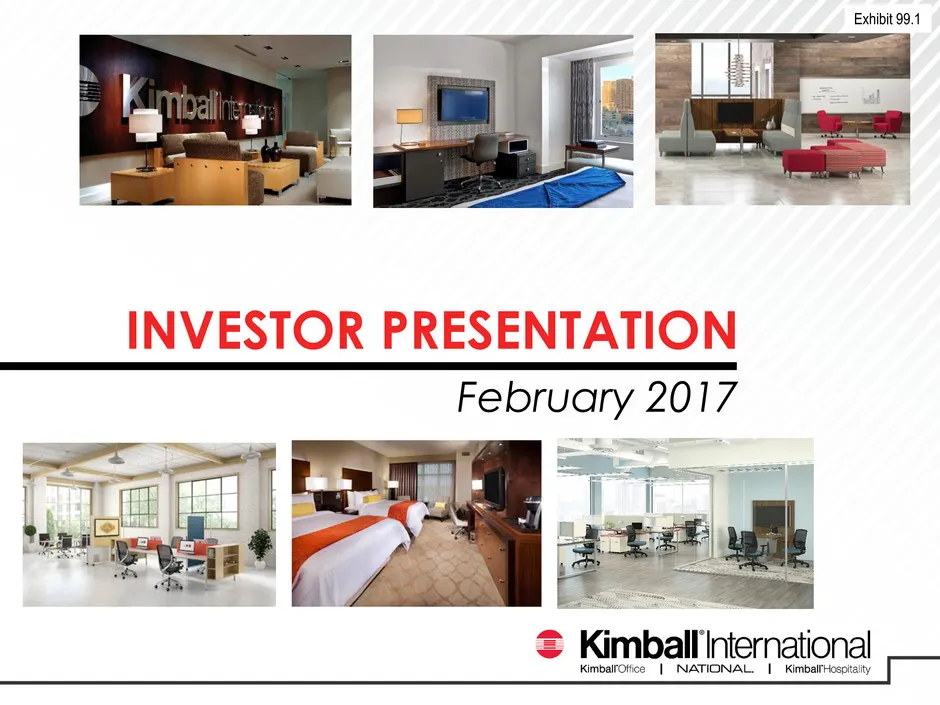
INVESTOR PRESENTATION February 2017 Exhibit 99.1
Slide 2: Safe Harbor Statement
SAFE HARBOR STATEMENT Certain statements contained within this release are considered forward-looking under the Private Securities Litigation Reform Act of 1995 and are subject to risks and uncertainties including, but not limited to, the risk that any projections or guidance, including revenues, ma
Slide 3: Company Snapshot
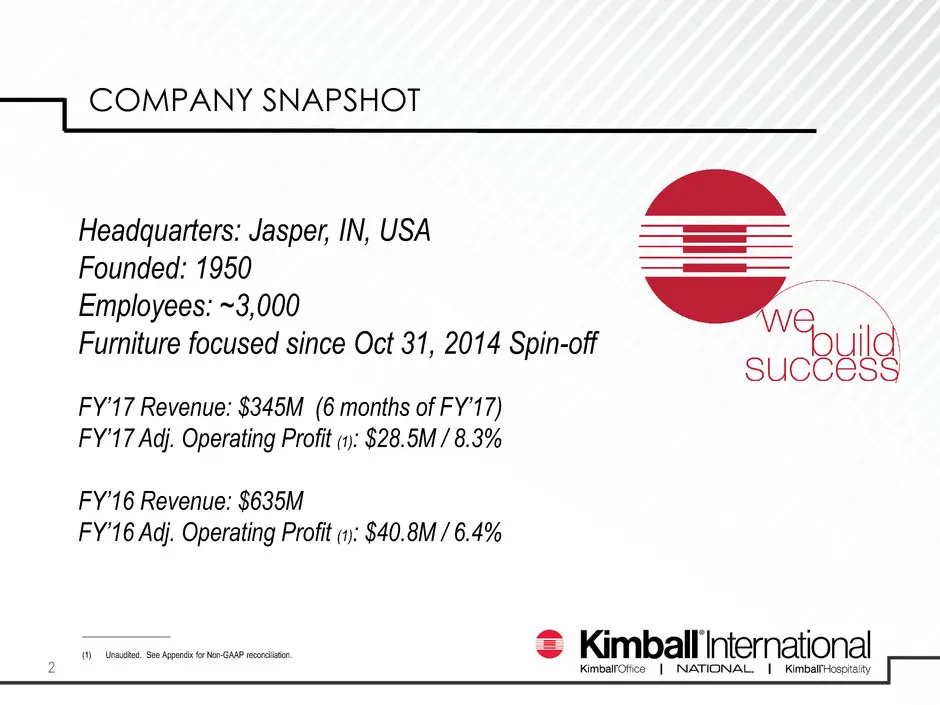
COMPANY SNAPSHOT Headquarters: Jasper, IN, USA Founded: 1950 Employees: ~3,000 Furniture focused since Oct 31, 2014 Spin-off FY’17 Revenue: $345M (6 months of FY’17) FY’17 Adj. Operating Profit (1): $28.5M / 8.3% FY’16 Revenue: $635M FY’16 Adj. Operating Profit (1): $40.8M / 6.4% 2 _________________
Slide 4: Why Invest in Us
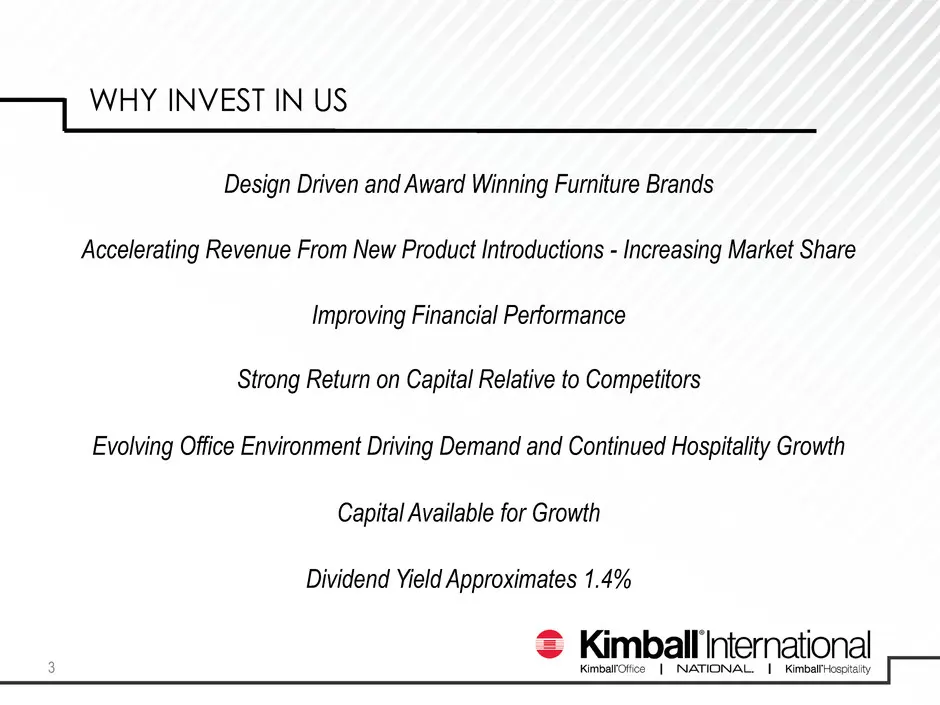
Design Driven and Award Winning Furniture Brands Evolving Office Environment Driving Demand and Continued Hospitality Growth Dividend Yield Approximates 1.4% Accelerating Revenue From New Product Introductions - Increasing Market Share WHY INVEST IN US Improving Financial Performance Capital Availab
Slide 5: Who We Are
WHO WE ARE Kimball International, Inc. creates design driven, innovative furnishings sold through our family of brands: Kimball Office, National Office Furniture, and Kimball Hospitality. Our diverse portfolio offers solutions for the workplace, learning, healing, and hospitality environments. Dedic
Slide 6: How We Are Recognized
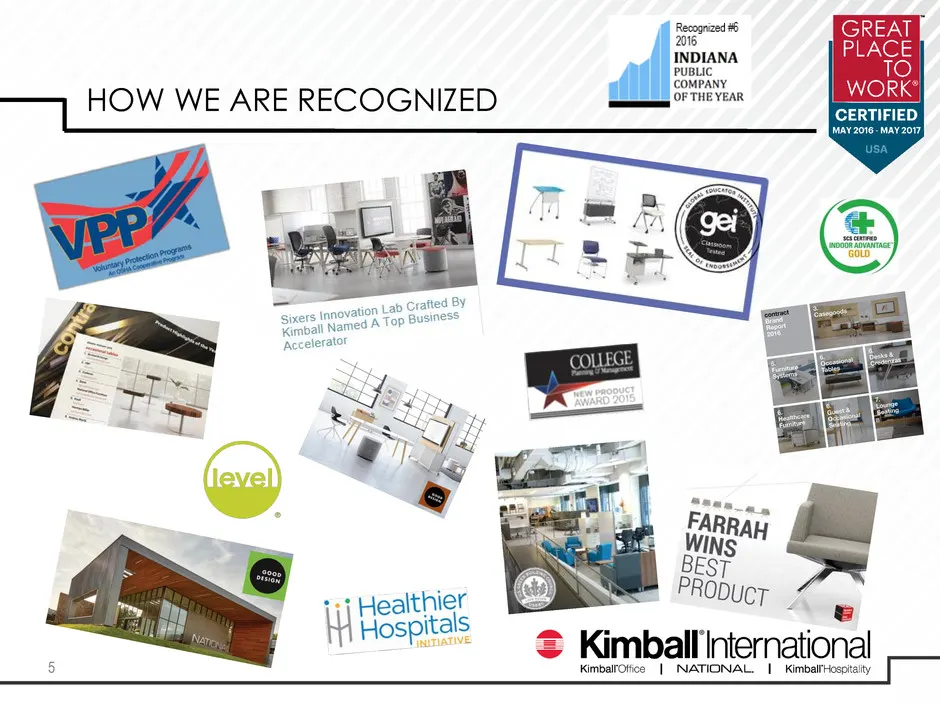
Recognized #6 26 INDIANA PUBLIC COMPANY OF THE YEAR Fal HOW WE ARE RECOGNIZED 3 ++7 Healthier itals . ’ Hoses & Kimball International Kimbalrotice | NATIONAL. | KimbalrHosotalty
Slide 7: Market Changes Driving Office Furniture Demand
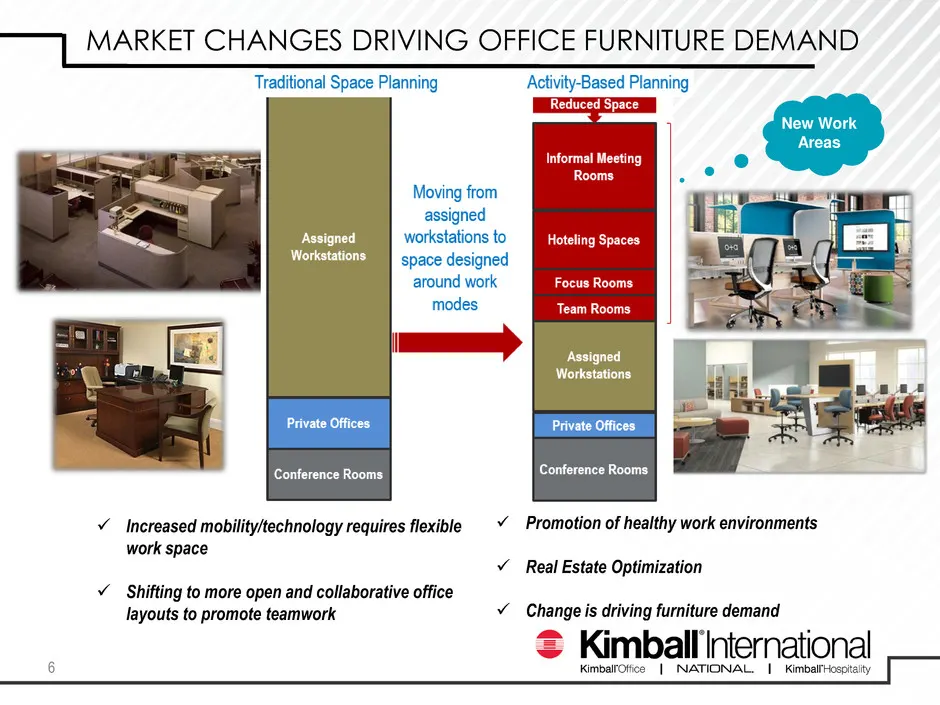
Increased mobility/technology requires flexible work space Shifting to more open and collaborative office layouts to promote teamwork Promotion of healthy work environments Real Estate Optimization Change is driving furniture demand New Work Areas MARKET CHANGES DRIVING OFFICE FURNITURE DE
Slide 8: Mixed U.S. Furniture Leading Indicators
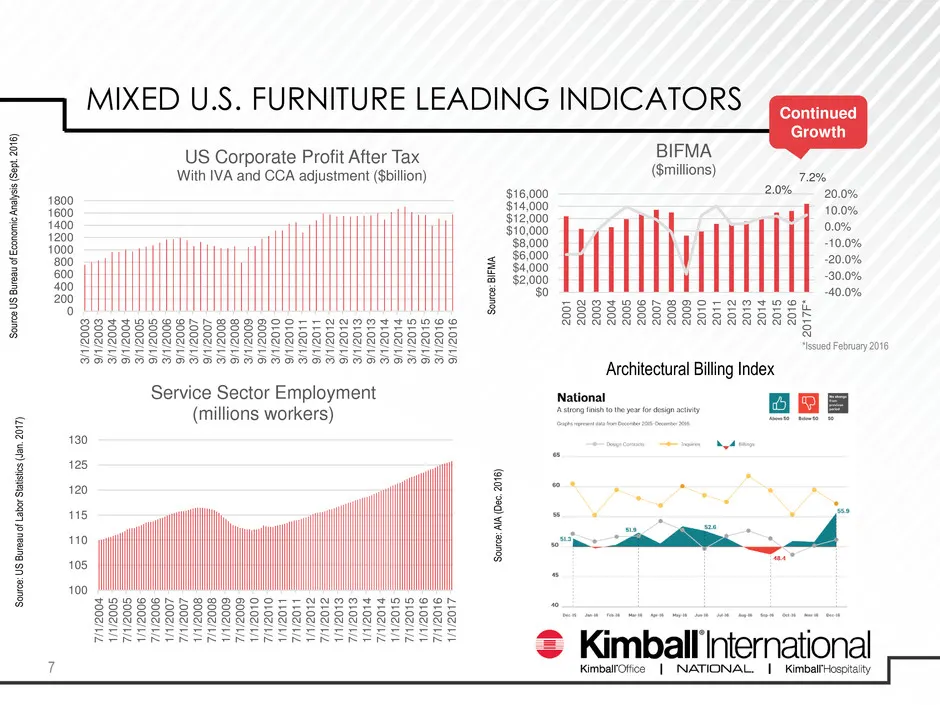
S ou rc e U S B ur ea u of E co no m ic A na ly si s (S ep t. 20 16 ) S ou rc e: U S B ur ea u of L ab or S ta tis tic s (J an . 2 01 7) S ou rc e: A IA ( D ec . 2 01 6) Continued Growth MIXED U.S. FURNITURE LEADING INDICATORS 7 Architectural Billing Index S ou rc e: B IF M A 100 105 110 115 120 125
Slide 9: Growth in Hospitality Leading Indicators
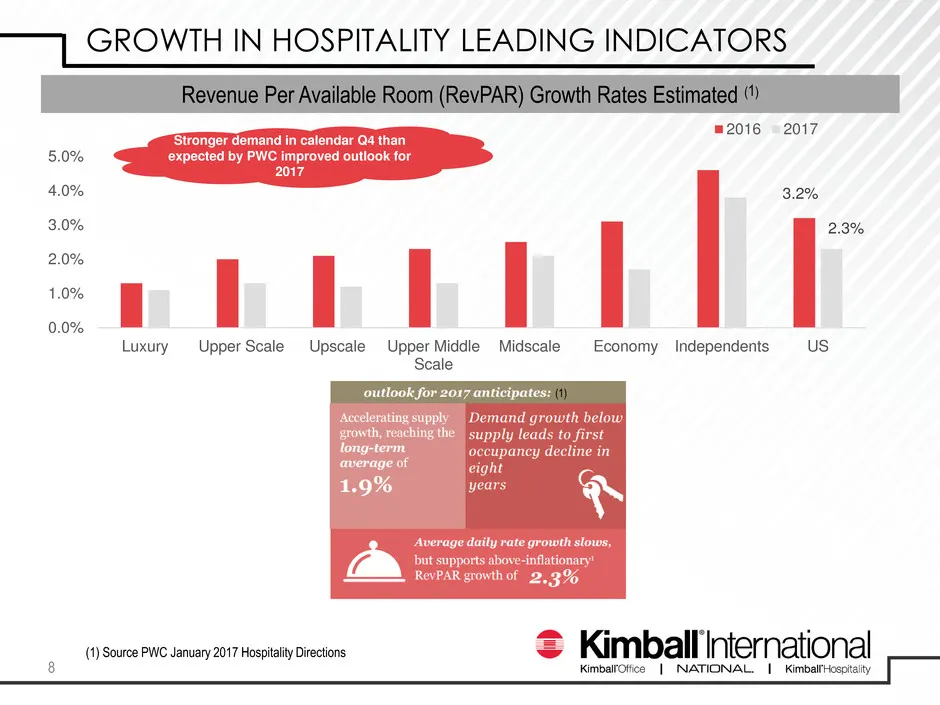
3.2% 2.3% 0.0% 1.0% 2.0% 3.0% 4.0% 5.0% Luxury Upper Scale Upscale Upper Middle Scale Midscale Economy Independents US 2016 2017 Source: PWC Hospitality Directions May 2015 Revenue Per Available Room (RevPAR) Growth Rates Estimated (1) Stronger demand in calendar Q4 than expected by PWC improved out
Slide 10: Improving Performance
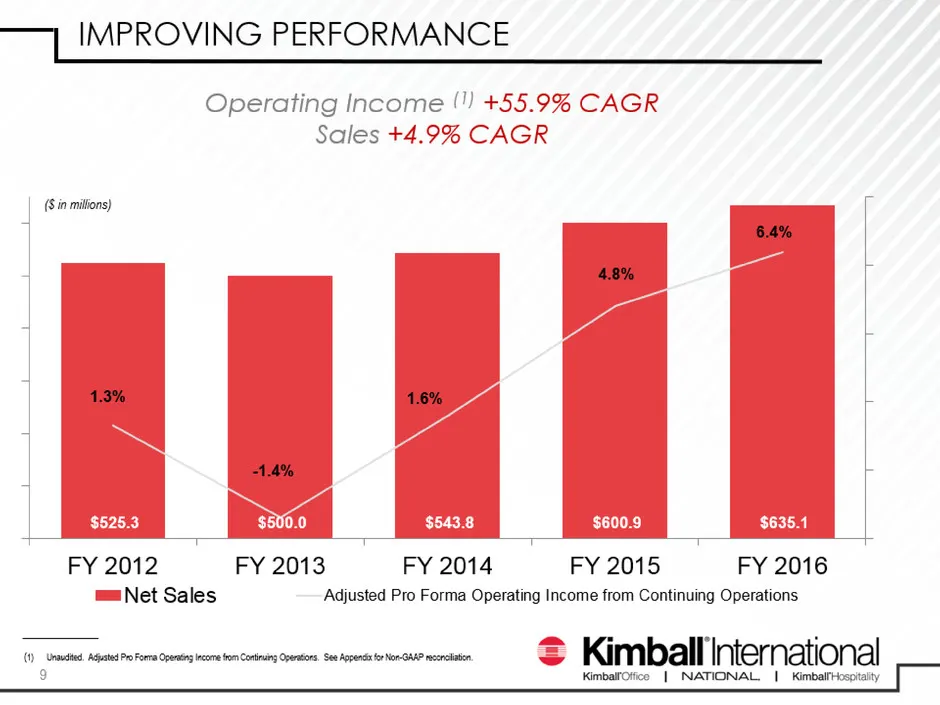
$525.3 $500.0 $543.8 $600.9 $635.1 [VALUE] -1.4% 1.6% 4.8% [VALUE] FY 2012 FY 2013 FY 2014 FY 2015 FY 2016 Net Sales Adjusted Pro Forma Operating Income from Continuing Operations IMPROVING PERFORMANCE 9 ($ in millions) (1) Unaudited. Adjusted Pro Forma Operating Income from Continuing Operations. S
Slide 11: Operating Profit
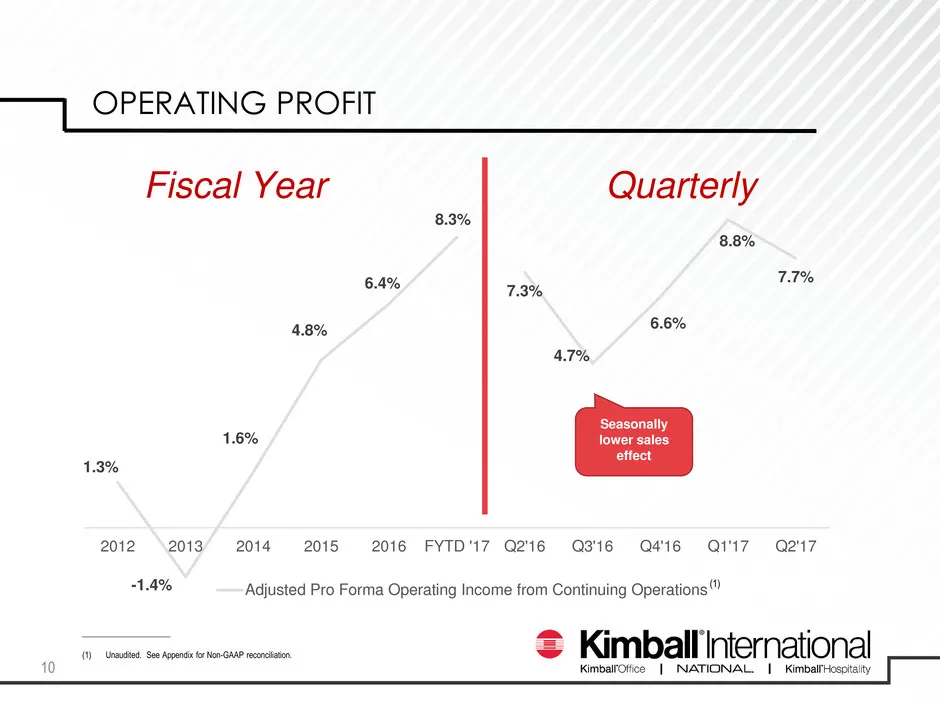
OPERATING PROFIT 10 1.3% -1.4% 1.6% 4.8% 6.4% 8.3% 7.3% 4.7% 6.6% 8.8% 7.7% 2012 2013 2014 2015 2016 FYTD '17 Q2'16 Q3'16 Q4'16 Q1'17 Q2'17 Adjusted Pro Forma Operating Income from Continuing Operations Series 2 Fiscal Year Quarterly Seasonally lower sales effect _____________________ (1) Unaudited.
Slide 12: Sales Growth Each Quarter
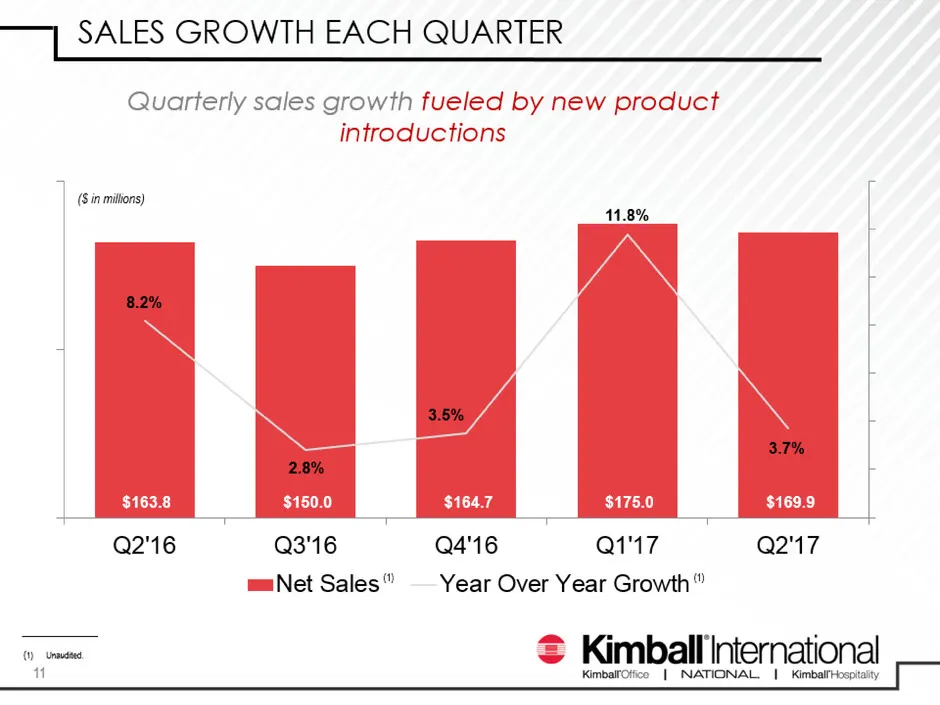
$163.8 $150.0 $164.7 $175.0 $169.9 [VALUE] 2.8% 3.5% 11.8% [VALUE] Q2'16 Q3'16 Q4'16 Q1'17 Q2'17 Net Sales Year Over Year Growth SALES GROWTH EACH QUARTER 11 ($ in millions) (1) Unaudited. Quarterly sales growth fueled by new product introductions (1) (1)
Slide 13: Strong New Product Introductions
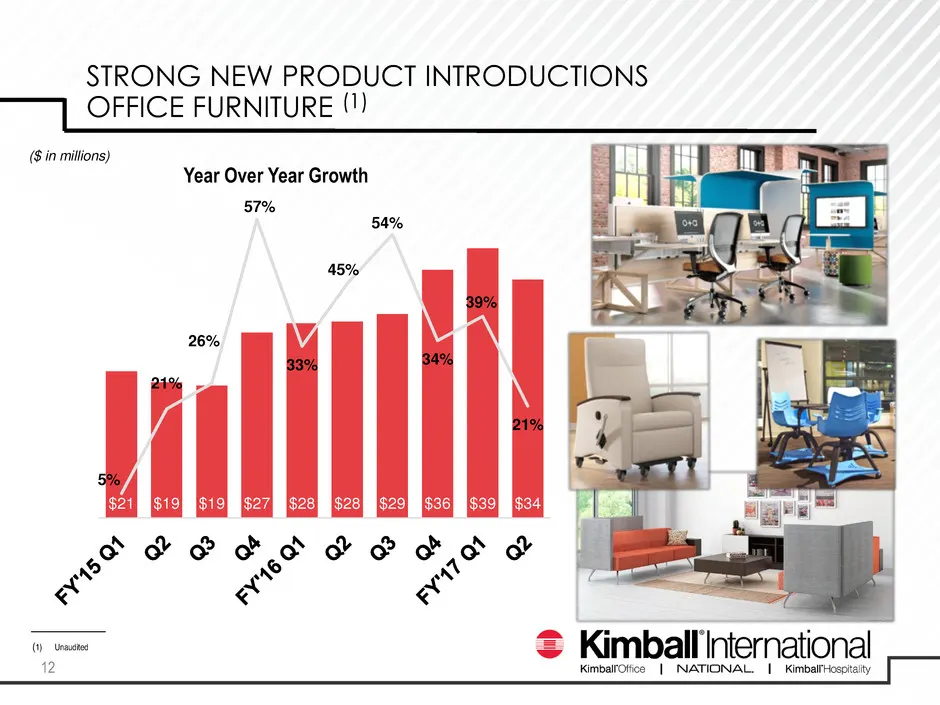
STRONG NEW PRODUCT INTRODUCTIONS OFFICE FURNITURE (1) $21 $19 $19 $27 $28 $28 $29 $36 $39 $34 5% 21% 26% 57% 33% 45% 54% 34% 39% 21% ($ in millions) (1) Unaudited Year Over Year Growth 12
Slide 14: Orders
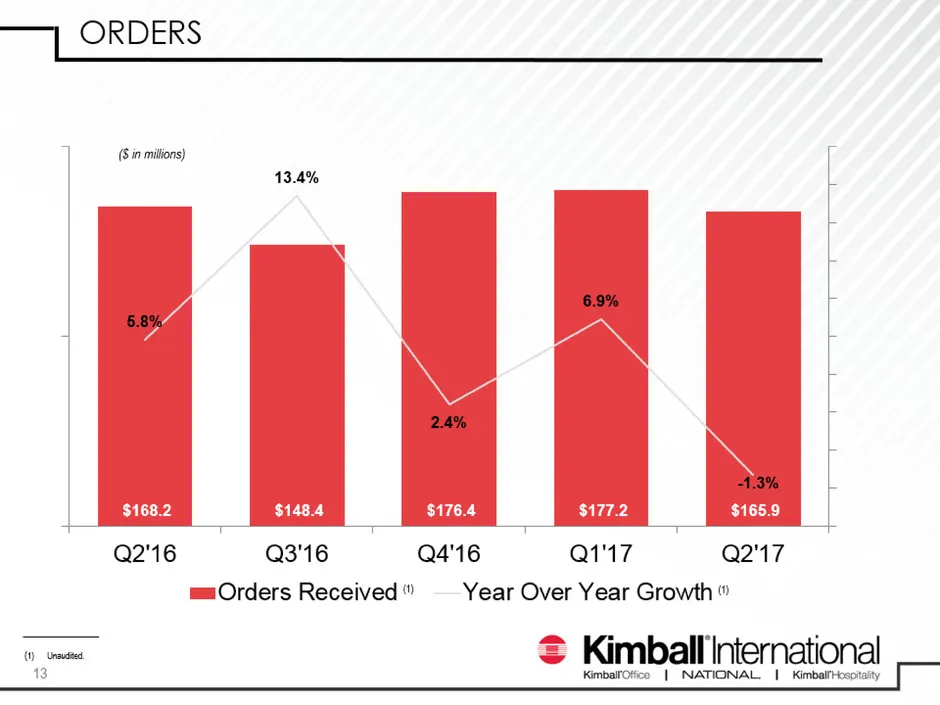
$168.2 $148.4 $176.4 $177.2 $165.9 [VALUE] 13.4% 2.4% 6.9% [VALUE] Q2'16 Q3'16 Q4'16 Q1'17 Q2'17 Orders Received Year Over Year Growth ORDERS 13 ($ in millions) (1) Unaudited. (1) (1)
Slide 15: Order Trend Relative to Office Furniture Market
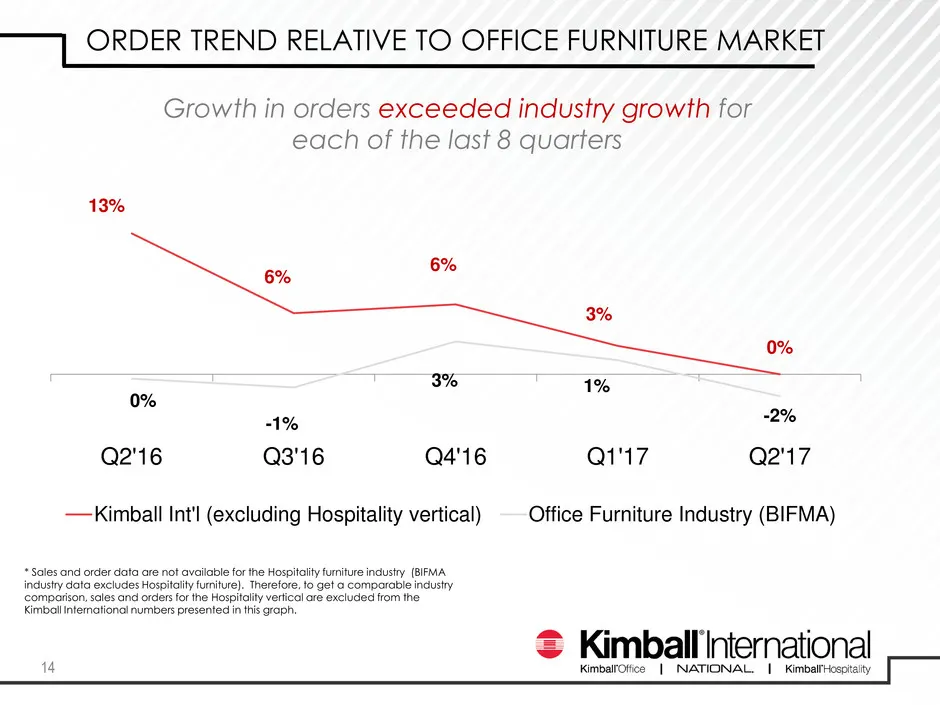
ORDER TREND RELATIVE TO OFFICE FURNITURE MARKET 14 * Sales and order data are not available for the Hospitality furniture industry (BIFMA industry data excludes Hospitality furniture). Therefore, to get a comparable industry comparison, sales and orders for the Hospitality vertical are excluded from
Slide 16: Sales by Vertical – Good Diversification
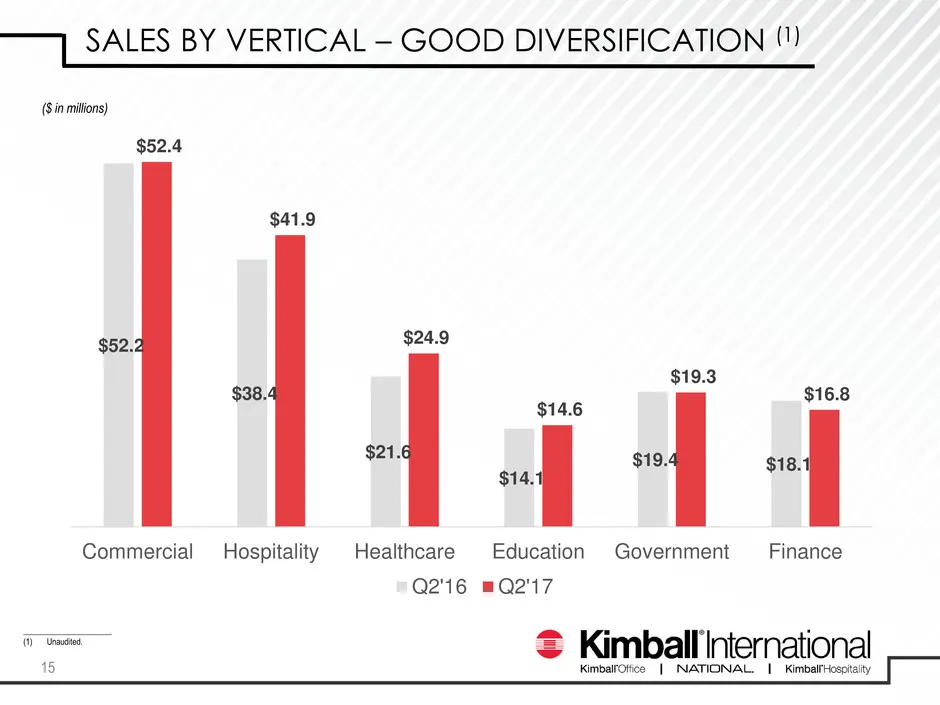
SALES BY VERTICAL – GOOD DIVERSIFICATION (1) 15 _____________________ (1) Unaudited. ($ in millions) $52.2 $38.4 $21.6 $14.1 $19.4 $18.1 $52.4 $41.9 $24.9 $14.6 $19.3 $16.8 Commercial Hospitality Healthcare Education Government Finance Q2'16 Q2'17
Slide 17: Orders by Vertical
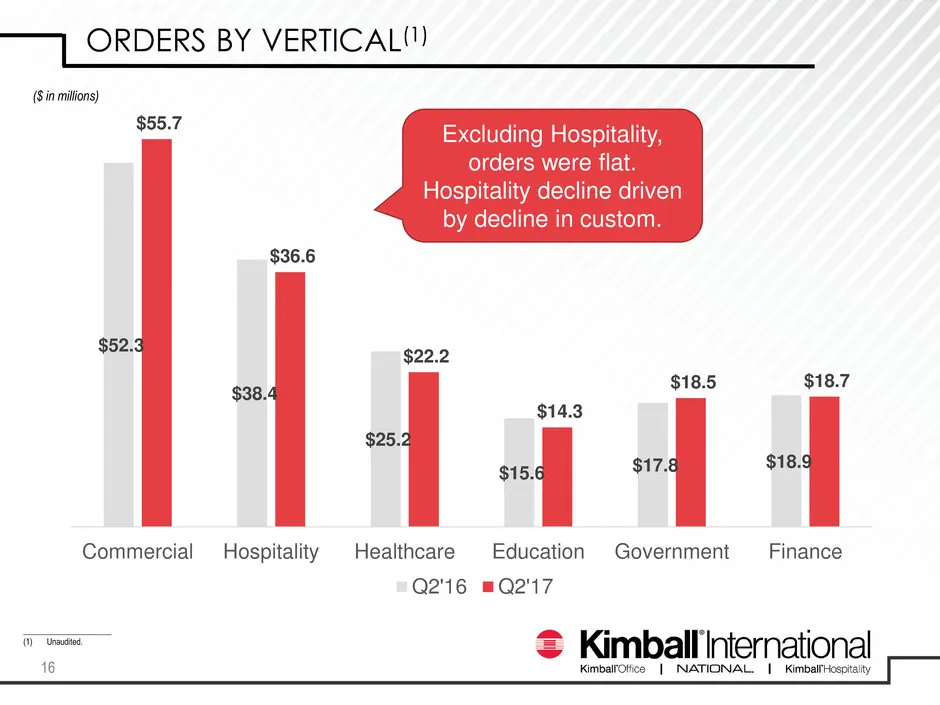
ORDERS BY VERTICAL(1) 16 _____________________ (1) Unaudited. ($ in millions) $52.3 $38.4 $25.2 $15.6 $17.8 $18.9 $55.7 $36.6 $22.2 $14.3 $18.5 $18.7 Commercial Hospitality Healthcare Education Government Finance Q2'16 Q2'17 Excluding Hospitality, orders were flat. Hospitality decline driven by decl
Slide 18: Strong Adjusted Return on Capital
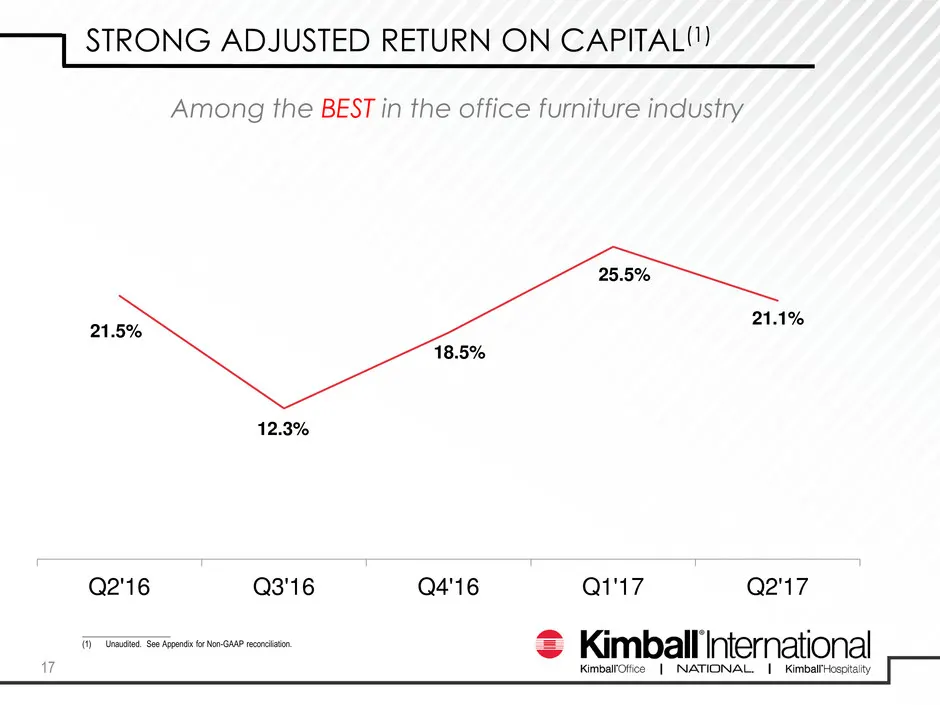
STRONG ADJUSTED RETURN ON CAPITAL(1) 17 21.5% 12.3% 18.5% 25.5% 21.1% Q2'16 Q3'16 Q4'16 Q1'17 Q2'17 _____________________ (1) Unaudited. See Appendix for Non-GAAP reconciliation. Among the BEST in the office furniture industry
Slide 19: Adjusted Free Cash Flow
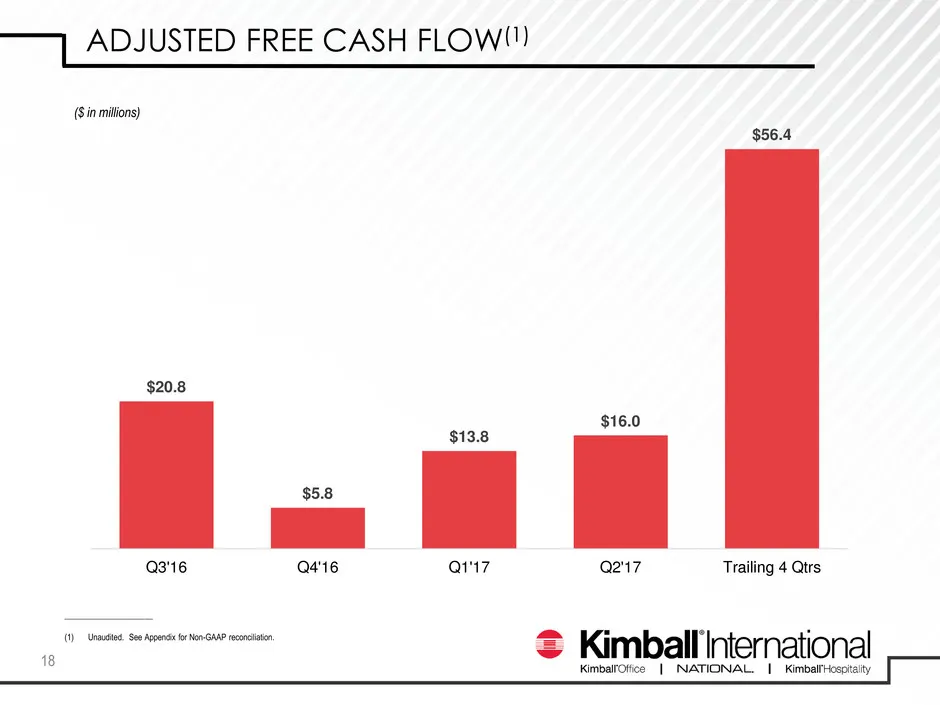
ADJUSTED FREE CASH FLOW(1) 18 ($ in millions) _____________________ (1) Unaudited. See Appendix for Non-GAAP reconciliation. $20.8 $5.8 $13.8 $16.0 $56.4 Q3'16 Q4'16 Q1'17 Q2'17 Trailing 4 Qtrs
Slide 20: Priorities for Capital Allocation
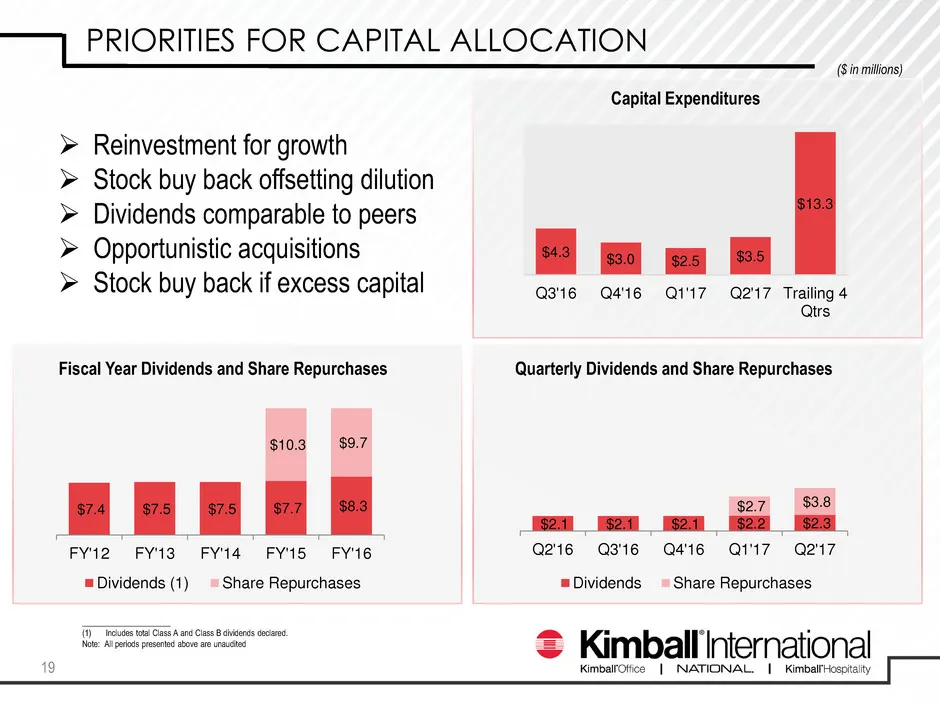
PRIORITIES FOR CAPITAL ALLOCATION 19 _____________________ (1) Includes total Class A and Class B dividends declared. Note: All periods presented above are unaudited ($ in millions) $2.1 $2.1 $2.1 $2.2 $2.3 $2.7 $3.8 Q2'16 Q3'16 Q4'16 Q1'17 Q2'17 Dividends Share Repurchases $7.4 $7.5 $7.5 $7.7 $8.3
Slide 21: Mid-Term Outlook
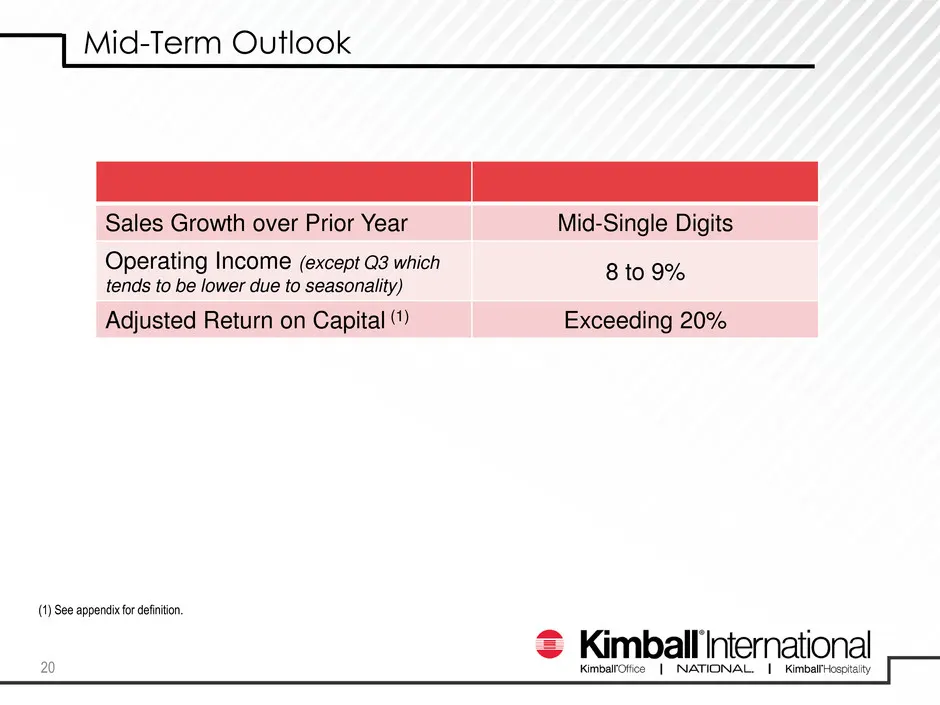
Sales Growth over Prior Year Mid-Single Digits Operating Income (except Q3 which tends to be lower due to seasonality) 8 to 9% Adjusted Return on Capital (1) Exceeding 20% (1) See appendix for definition. Mid-Term Outlook 20
Slide 22: Appendix
— APPENDIX @ Kimbaitotice 1 Nati Kimball hierational
Slide 23: Annual Non-GAAP Reconciliation (Unaudited)
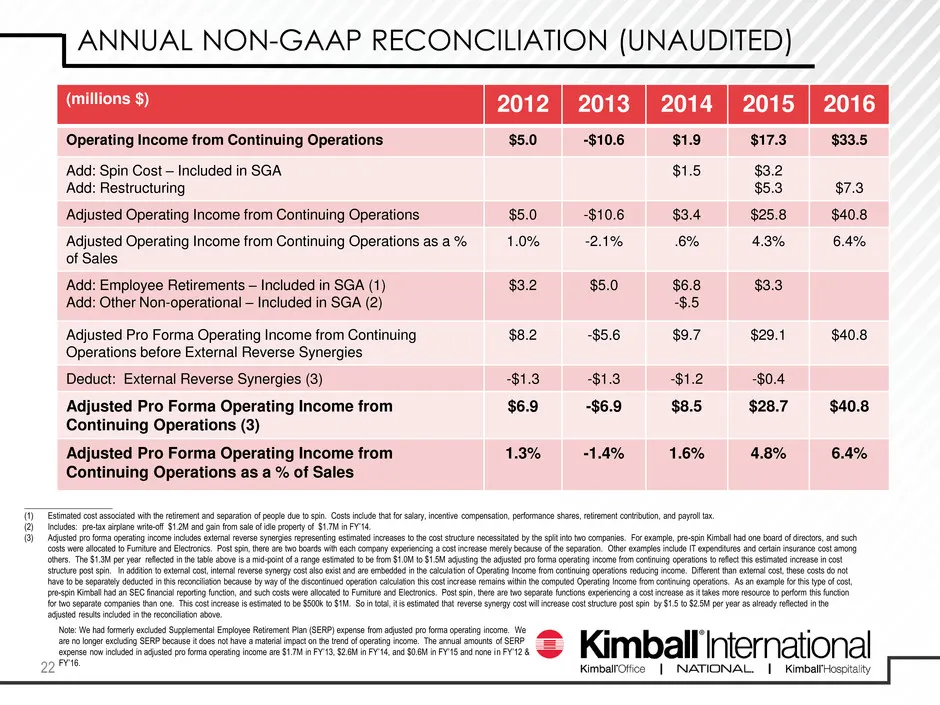
ANNUAL NON-GAAP RECONCILIATION (UNAUDITED) 22 (millions $) 2012 2013 2014 2015 2016 Operating Income from Continuing Operations $5.0 -$10.6 $1.9 $17.3 $33.5 Add: Spin Cost – Included in SGA Add: Restructuring $1.5 $3.2 $5.3 $7.3 Adjusted Operating Income from Continuing Operations $5.0 -$10.6 $3.4 $
Slide 24: Quarterly Non-GAAP Reconciliation (Unaudited)
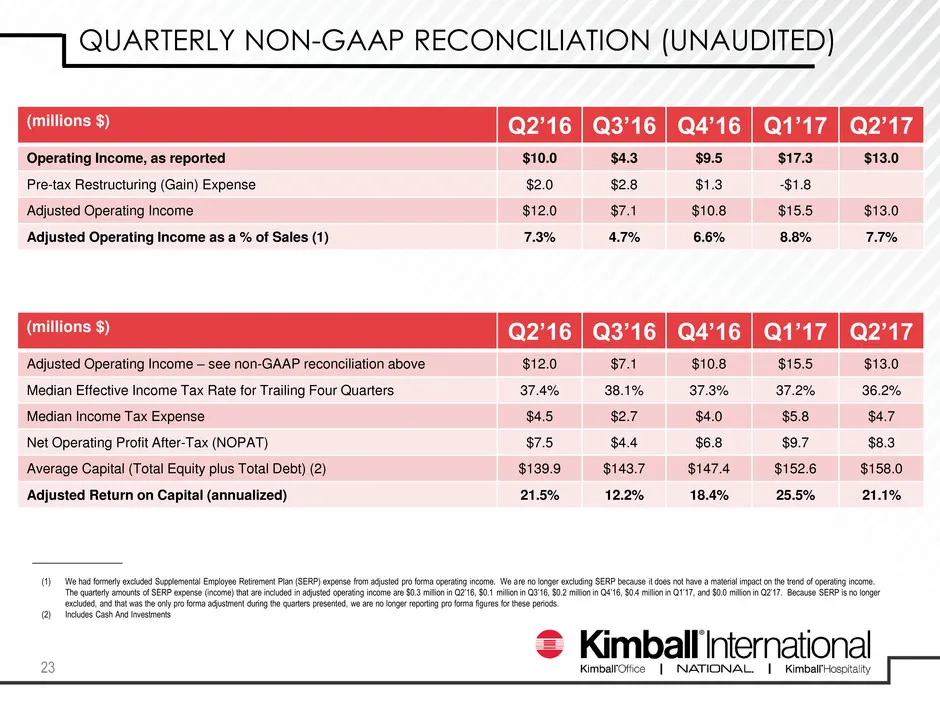
QUARTERLY NON-GAAP RECONCILIATION (UNAUDITED) 23 (1) We had formerly excluded Supplemental Employee Retirement Plan (SERP) expense from adjusted pro forma operating income. We are no longer excluding SERP because it does not have a material impact on the trend of operating income. The quarterly amou
Slide 25: Quarterly Non-GAAP Reconciliation (Unaudited)
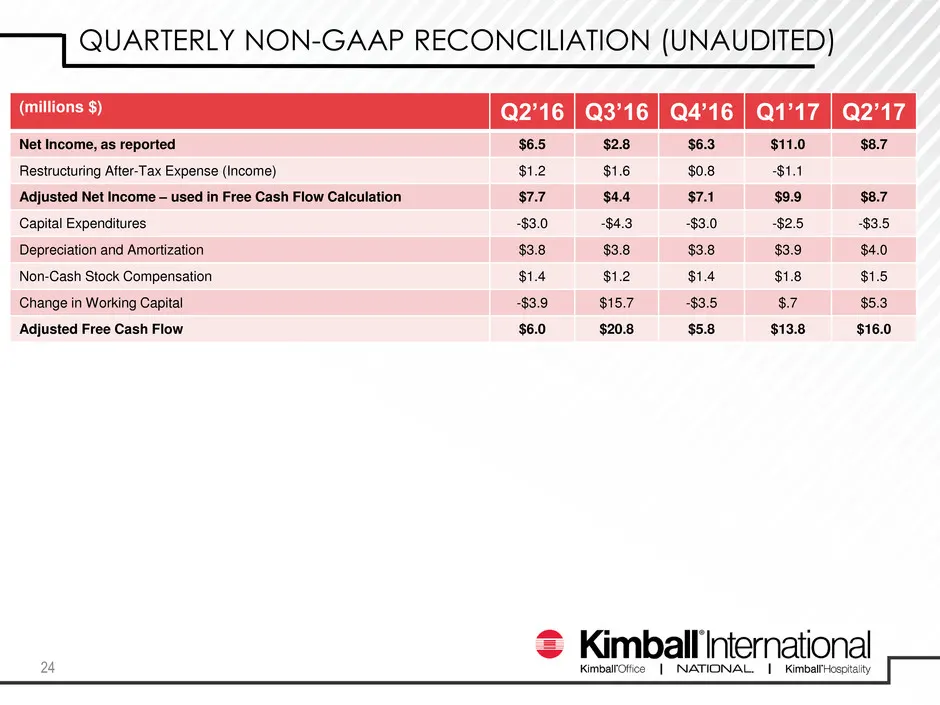
QUARTERLY NON-GAAP RECONCILIATION (UNAUDITED) 24 (millions $) Q2’16 Q3’16 Q4’16 Q1’17 Q2’17 Net Income, as reported $6.5 $2.8 $6.3 $11.0 $8.7 Restructuring After-Tax Expense (Income) $1.2 $1.6 $0.8 -$1.1 Adjusted Net Income – used in Free Cash Flow Calculation $7.7 $4.4 $7.1 $9.9 $8.7 Capital Expend
Source: SEC EDGAR · 8-K filed Feb 23, 2017
More decks from Kimball International Inc
 Merger or Acquisition (May 2023)30 slides · May 23, 2023
 Merger or Acquisition (March 2023)15 slides · Mar 8, 2023
 Q2 FY2023 Earnings Presentation16 slides · Feb 2, 2023
 Q1 FY2023 Earnings Presentation17 slides · Nov 3, 2022
 Q4 FY2022 Earnings Presentation18 slides · Aug 4, 2022
 Q3 FY2022 Earnings Presentation17 slides · May 3, 2022