Altra Industrial Motion — Q1 2018 Earnings Presentation
15 slides from Altra Industrial Motion's earnings presentation, Apr 27, 2018

Slide 1: First Quarter 2018 Results
First Quarter 2018 Results The Power Brands in Power Transmissions Exhibit 99.2
Slide 2: Q1 2018 Conference Call Details
Live Webcast April 27, 2018 at 10:00 AM ET 877-407-8293 Domestic 201-689-8349 International Webcast at www.altramotion.com Replay Through May 11, 2018 877-660-6853 Domestic 201-612-7415 International Conference ID: # 13678537 www.altramotion.com Q1 2018 Conference Call Details
Slide 3: SEC Disclosure Rules Additional Information
SEC Disclosure Rules Additional Information This communication does not constitute an offer to buy, or a solicitation of an offer to sell, any securities of Fortive Corporation (“Fortive”), Stevens Holding Company, Inc. (“Newco”) or Altra Industrial Motion Corp. (“Altra”). In connection with Altra’s
Slide 4: Safe Harbor Statement
Safe Harbor Statement Cautionary Statement Regarding Forward Looking Statements: All statements, other than statements of historical fact included in this release are forward-looking statements, as that term is defined in the Private Securities Litigation Reform Act of 1995. These statements include
Slide 5: Agenda and Speakers
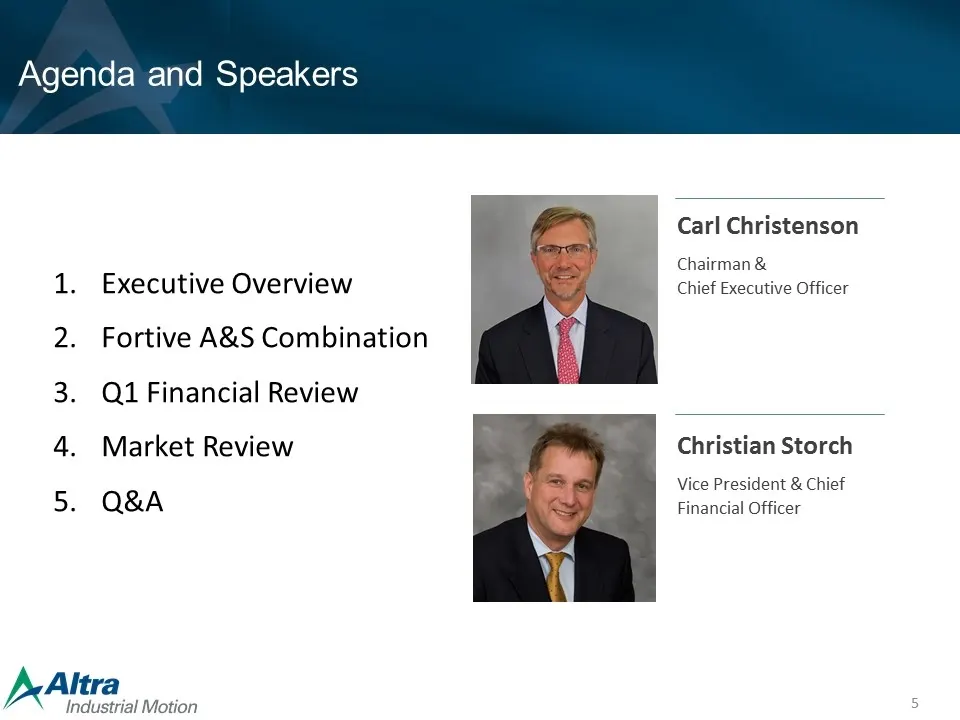
Executive Overview Fortive A&S Combination Q1 Financial Review Market Review Q&A Agenda and Speakers Carl Christenson Chairman & Chief Executive Officer Christian Storch Vice President & Chief Financial Officer
Slide 6: First-Quarter 2018 Highlights
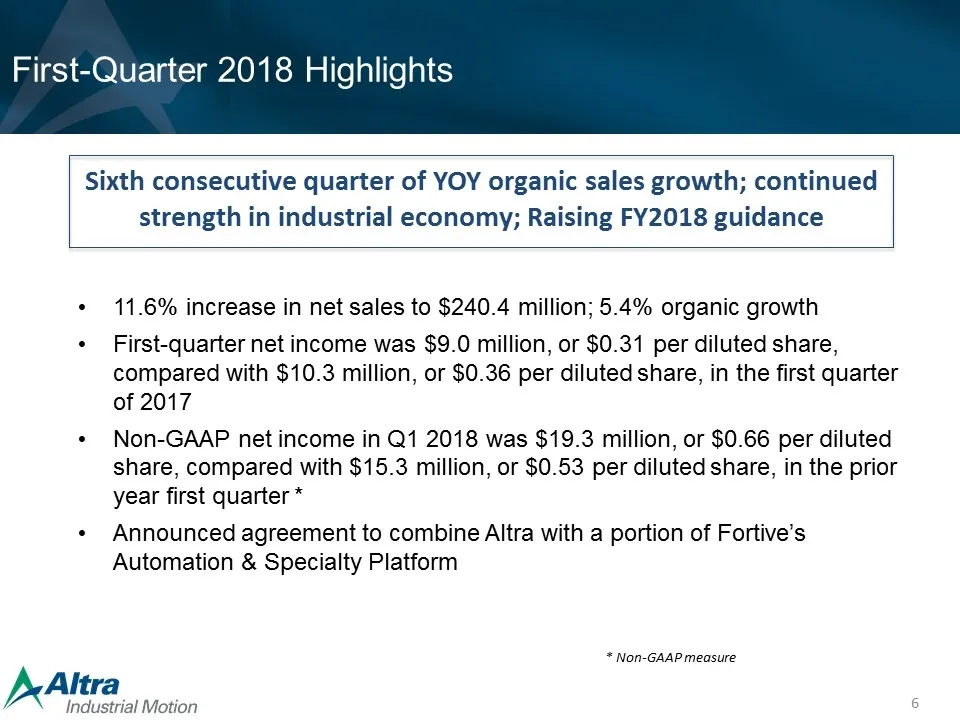
Sixth consecutive quarter of YOY organic sales growth; continued strength in industrial economy; Raising FY2018 guidance 11.6% increase in net sales to $240.4 million; 5.4% organic growth First-quarter net income was $9.0 million, or $0.31 per diluted share, compared with $10.3 million, or $0.36 per
Slide 7: Altra Combination with Fortive's A&S Platform: Integration on Schedule
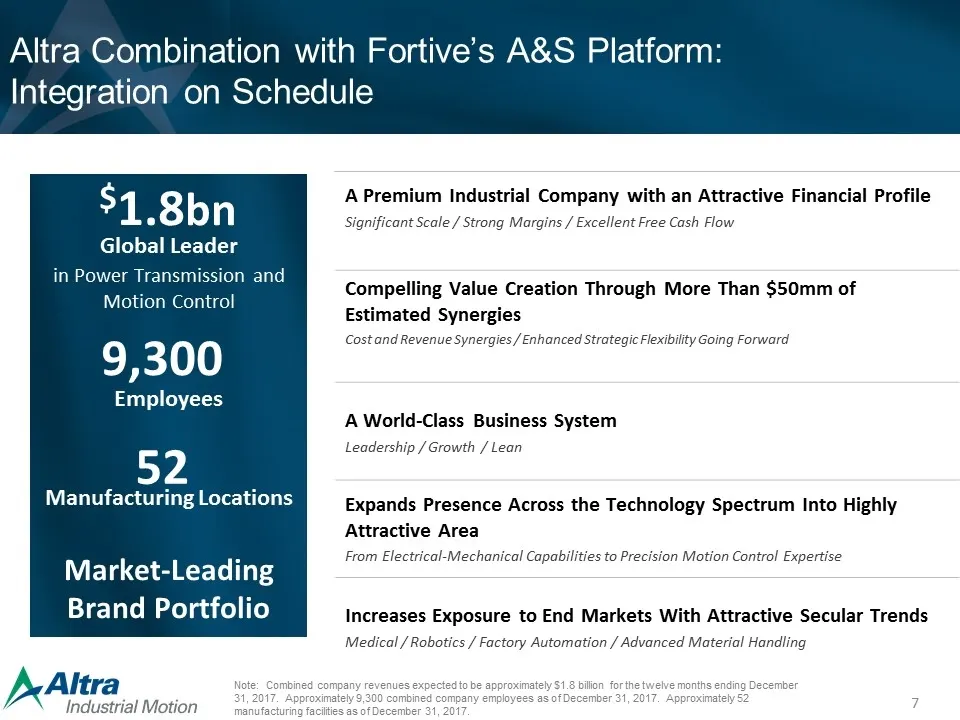
Altra Combination with Fortive’s A&S Platform: Integration on Schedule A Premium Industrial Company with an Attractive Financial Profile Significant Scale / Strong Margins / Excellent Free Cash Flow Compelling Value Creation Through More Than $50mm of Estimated Synergies Cost and Revenue Synergies /
Slide 8: Q1 2018 Financial Highlights
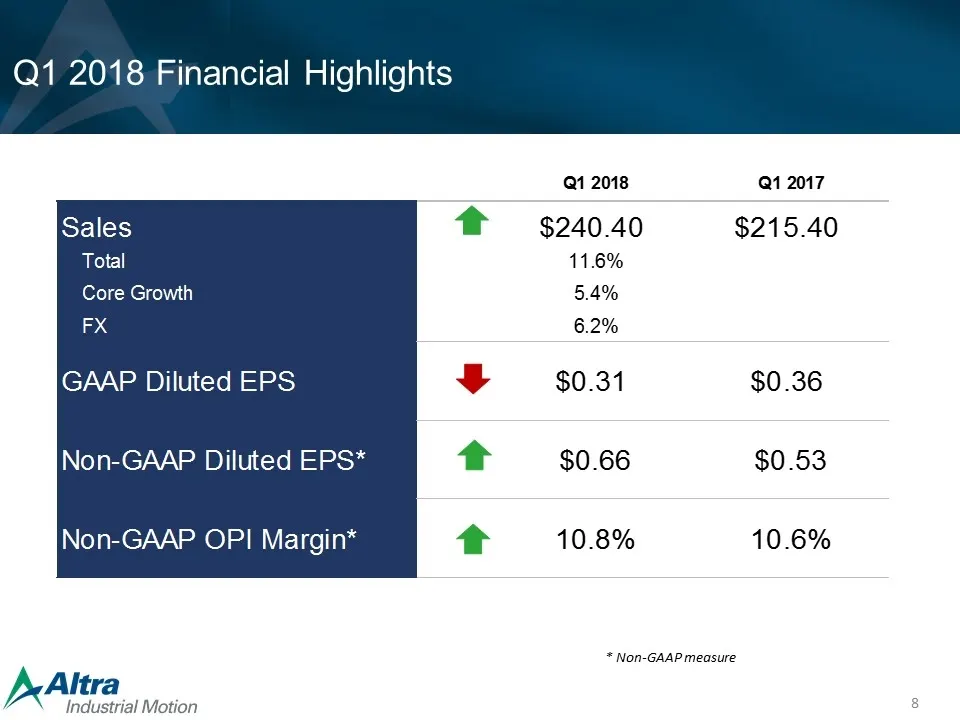
Q1 2018 Financial Highlights * Non-GAAP measure Sales Total Core Growth FX GAAP Diluted EPS Non-GAAP Diluted EPS* Non-GAAP OPI Margin* Q1 2018 Q1 2017 $240.40 $215.40 11.6% 5.4% 6.2% $0.31 $0.36 $0.66 $0.53 10.8% 10.6%
Slide 9: Balance Sheet Highlights
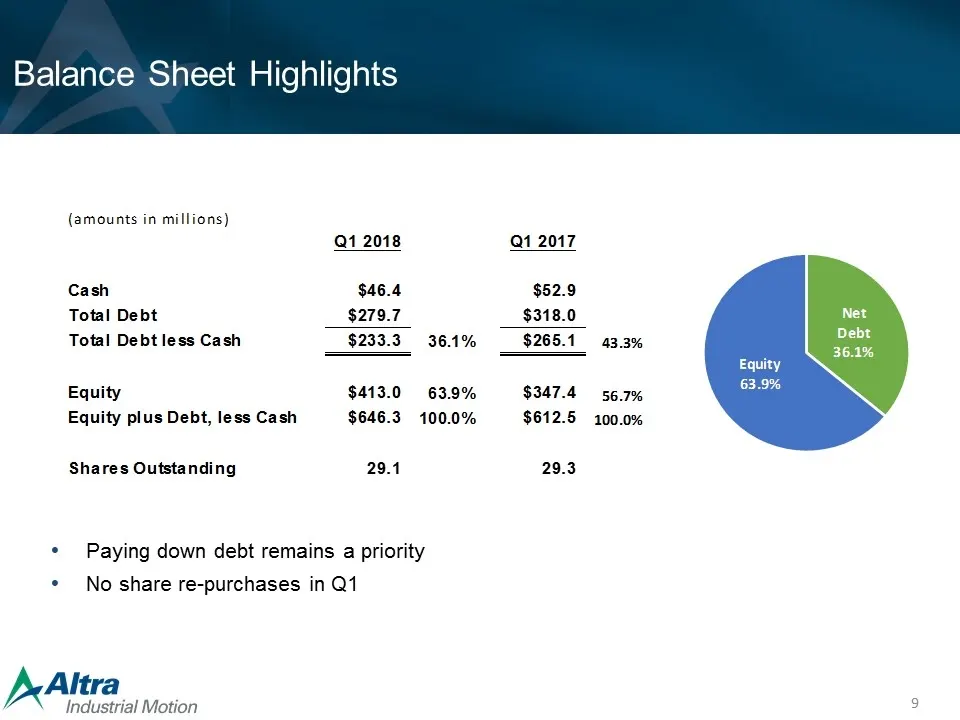
Balance Sheet Highlights Paying down debt remains a priority No share re-purchases in Q1 (amounts in millions) Q1 2018 Q1 2017 Cash$46.4 $52.9 Total Debt$279.7 $318.0 Total Debt less Cash$233.3 36.1% $265.1 43.3% Equity$413.0 63.9% $347.4 56.7% Equity plus Debt, less Cash$646.3 100.0% $612.5 100.0%
Slide 10: 2018 Guidance: Raising Top and Bottomline Expectations
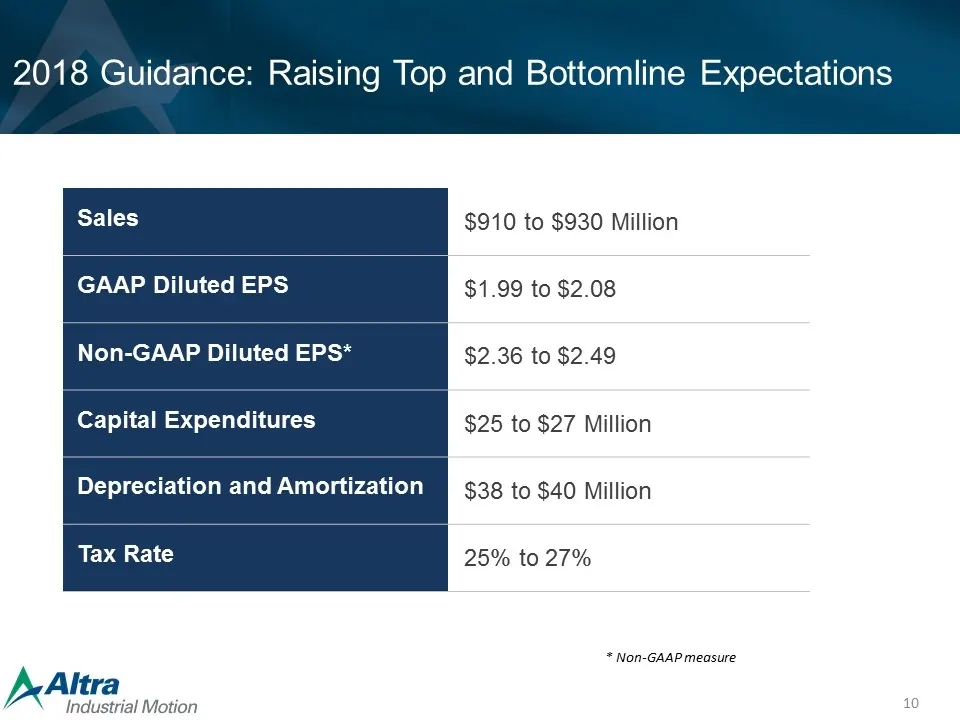
2018 Guidance: Raising Top and Bottomline Expectations Sales $910 to $930 Million GAAP Diluted EPS $1.99 to $2.08 Non-GAAP Diluted EPS* $2.36 to $2.49 Capital Expenditures $25 to $27 Million Depreciation and Amortization $38 to $40 Million Tax Rate 25% to 27% * Non-GAAP measure
Slide 11: End Market Review: Growth Across Nearly All Markets
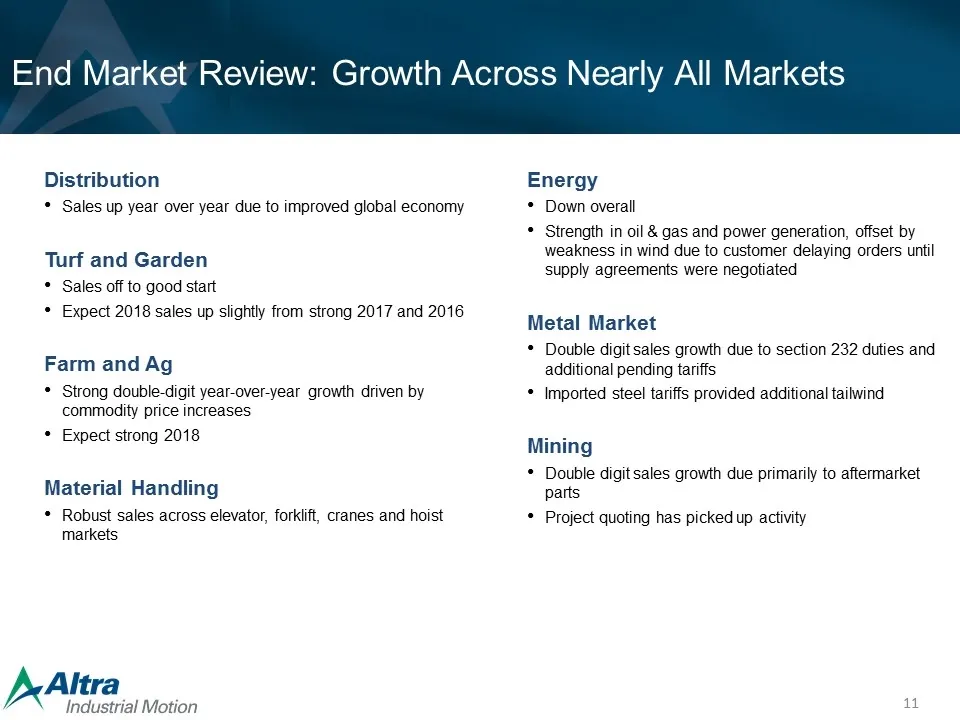
End Market Review: Growth Across Nearly All Markets Distribution Sales up year over year due to improved global economy Turf and Garden Sales off to good start Expect 2018 sales up slightly from strong 2017 and 2016 Farm and Ag Strong double-digit year-over-year growth driven by commodity price incr
Slide 12: Summary
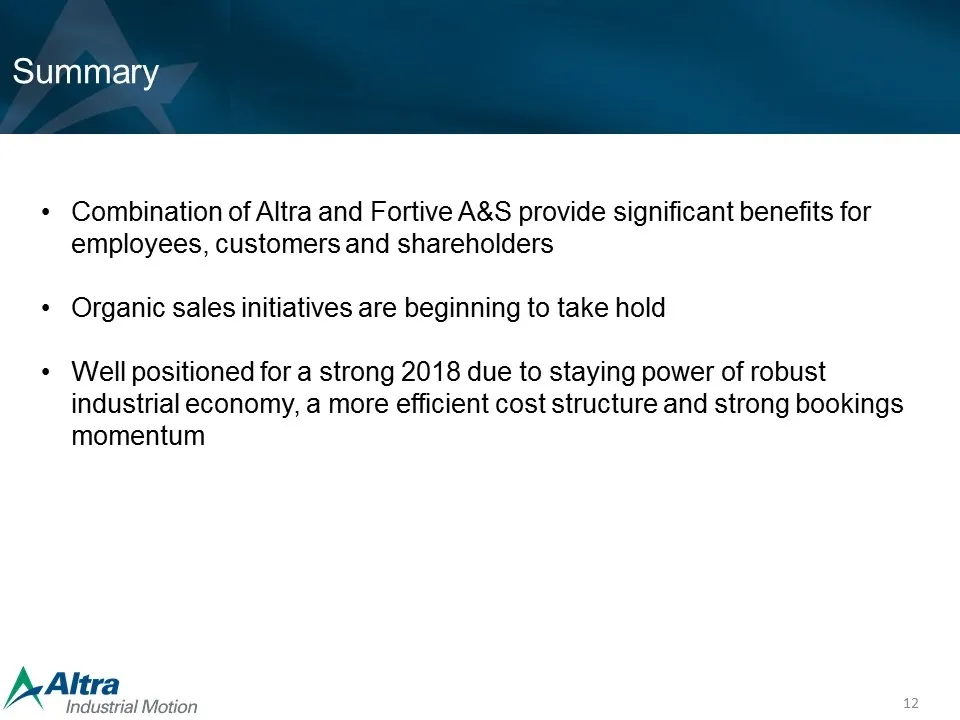
Summary Combination of Altra and Fortive A&S provide significant benefits for employees, customers and shareholders Organic sales initiatives are beginning to take hold Well positioned for a strong 2018 due to staying power of robust industrial economy, a more efficient cost structure and strong boo
Slide 13: Discussion of Non-GAAP Measures
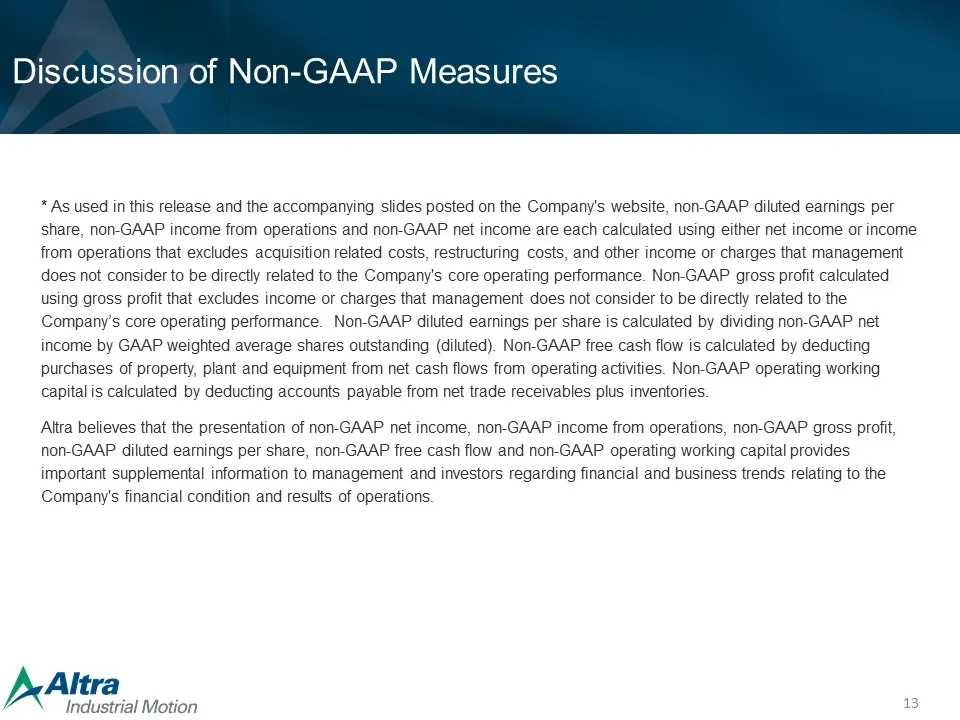
Discussion of Non-GAAP Measures * As used in this release and the accompanying slides posted on the Company's website, non-GAAP diluted earnings per share, non-GAAP income from operations and non-GAAP net income are each calculated using either net income or income from operations that excludes acqu
Slide 14: Appendix Non-GAAP Measures
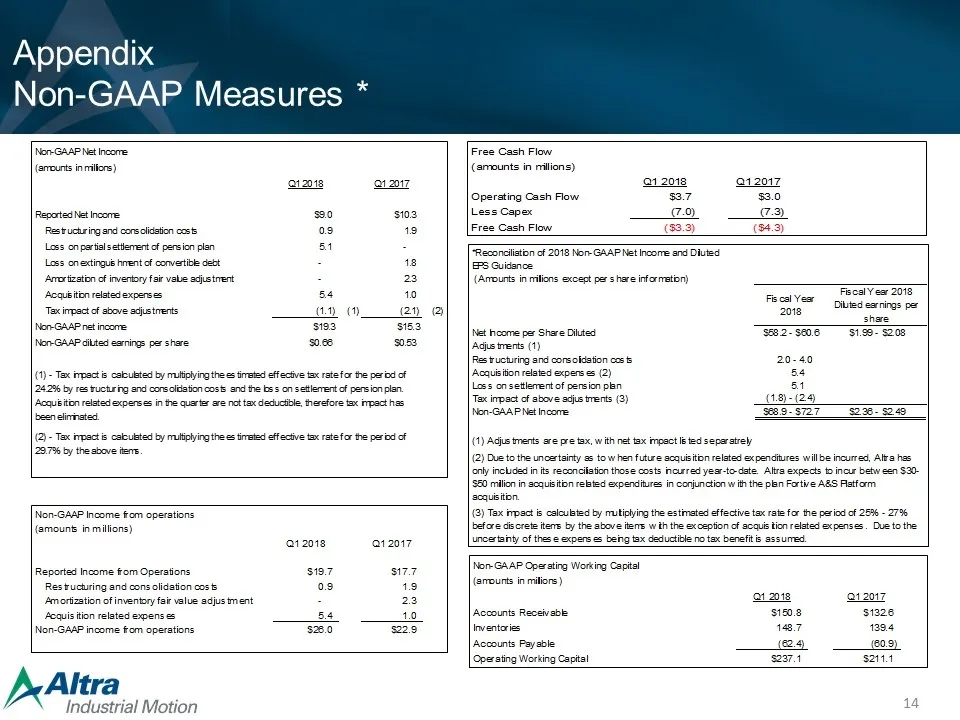
Appendix Non-GAAP Measures * Non-GAAP Income from operations ( amounts in millions) Q1 2017 Q1 2016 Reported Income from Operations $17.7 $15.0 Restructuring and consolidation costs 1.9 1.6 Amortization of inventory fair value adjustment 2.3 - Acquisition related expenses 1.0 Non-GAAP income from op
Slide 15: Appendix Non-GAAP EBITDA Reconciliation
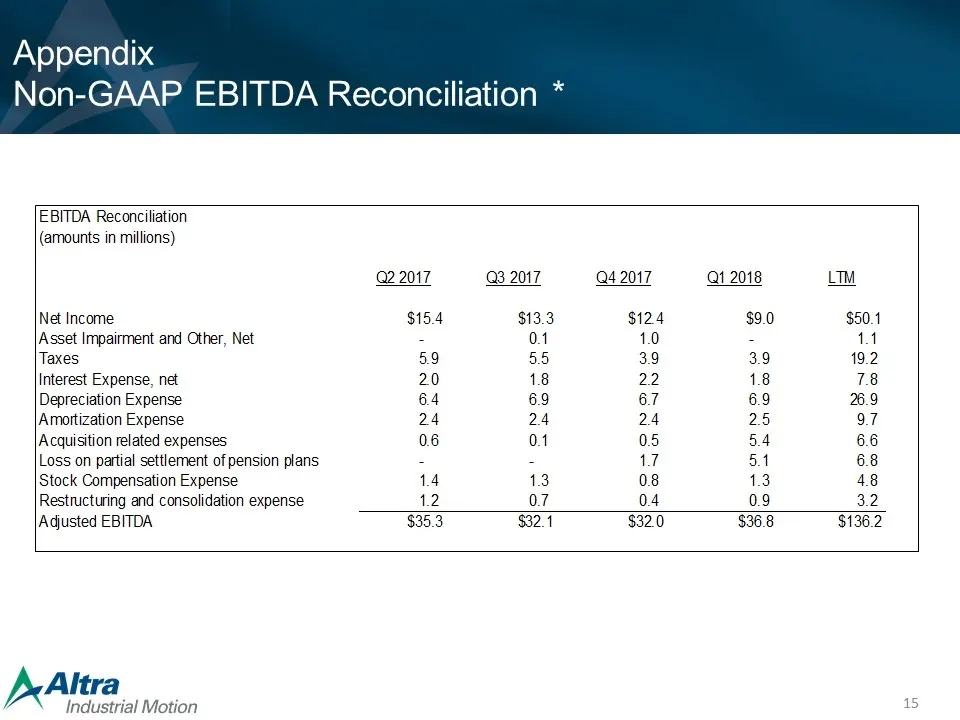
Appendix Non-GAAP EBITDA Reconciliation * EBITDA Reconciliation (amounts in millions) Q2 2017 Q3 2017 Q4 2017 Q1 2018 LTM Net Income$15.4 $13.3 $12.4 $9.0 $50.1 Asset Impairment and Other, Net - 0.1 1.0- 1.1 Taxes 5.9 5.5 3.9 3.9 19.2 Interest Expense, net 2.0 1.8 2.2 1.8 7.8 Depreciation Expense 6.
Source: SEC EDGAR · 425 filed Apr 27, 2018
More decks from Altra Industrial Motion Corp
 Q2 2022 Earnings Presentation25 slides · Jul 28, 2022
 Q1 2022 Earnings Presentation25 slides · Apr 28, 2022
 Investor Day (March 2022)135 slides · Mar 11, 2022
 Q4 2021 Earnings Presentation17 slides · Feb 16, 2022
 Q3 2021 Earnings Presentation16 slides · Oct 22, 2021
 Q2 2021 Earnings Presentation16 slides · Jul 23, 2021