Rsa Security — Investor Presentation (February 2003)
23 slides from Rsa Security's investor presentation, Feb 4, 2003
Slide 1: Seamless and Transparent e-Security Solutions for Competitive Advantage
Seamless and Transparent e-Security Solutions for Competitive Advantage February 3, 2003
Slide 2: SEC Safe Harbor Forward Looking Statements
SEC "Safe Harbor" Forward Looking Statements Various remarks that we may make about the Company's future expectations, plans and prospects constitute forward-looking statements for purposes of the safe harbor provisions under The Private Securities Litigation Reform Act of 1995. Actual results may d
Slide 3: Overview
Overview Leading supplier of IT security solutions $244M run rate company 90% Enterprise Customers 10% OEM / Developers Q4 Core operating profit of $3.3M (5.4%) Cash of approximately $103M Convertible debt $77M Market Cap of $300M
Slide 4: The Vision and the Mission
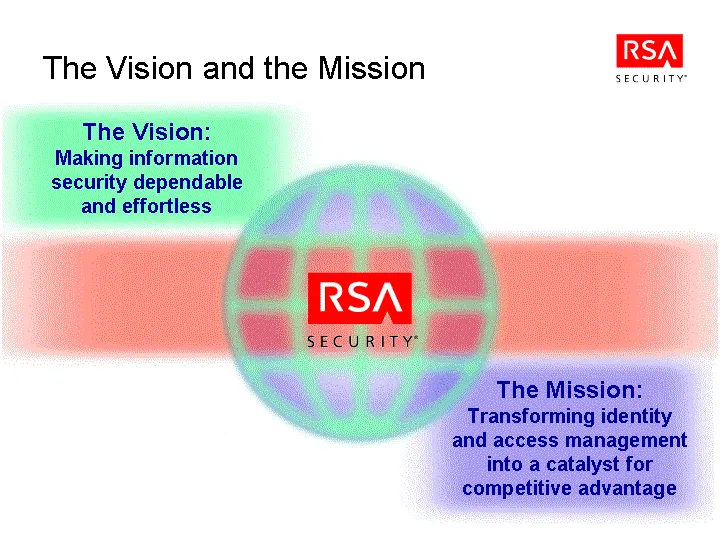
The Vision: Making information security dependable and effortless The Mission: Transforming identity and access management into a catalyst for competitive advantage The Vision and the Mission
Slide 5: Information Security Landscape
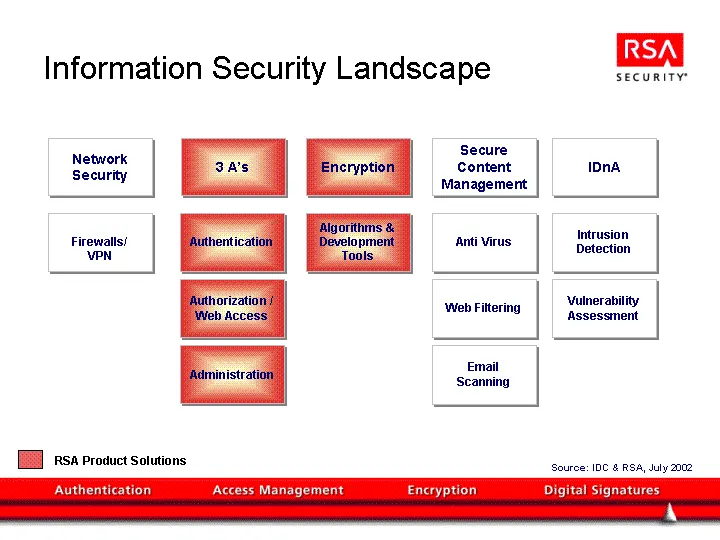
Information Security Landscape Firewalls/ VPN Network Security Authentication Authorization / Web Access Administration 3 A's Algorithms & Development Tools Encryption RSA Product Solutions Source: IDC & RSA, July 2002 Anti Virus Web Filtering Email Scanning Secure Content Management Intrusion Detec
Slide 6: Leadership in e-Security
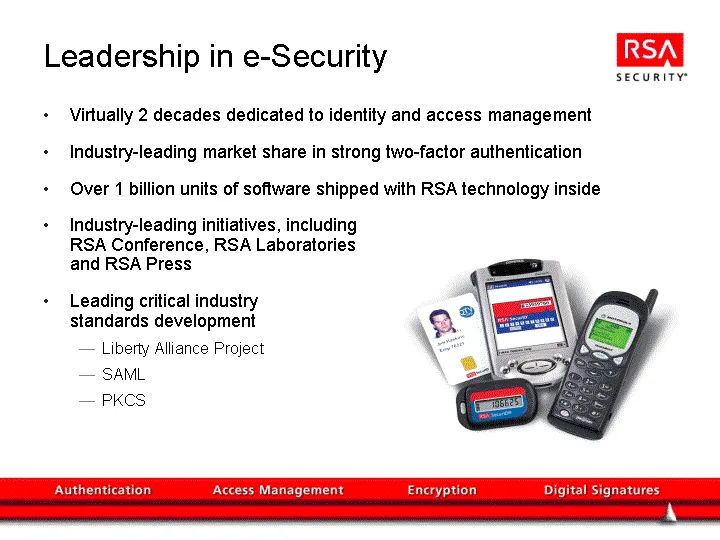
Leadership in e-Security Virtually 2 decades dedicated to identity and access management Industry-leading market share in strong two-factor authentication Over 1 billion units of software shipped with RSA technology inside Industry-leading initiatives, including RSA Conference, RSA Laboratories and
Slide 7: Traditional RSA Strong Authentication Market
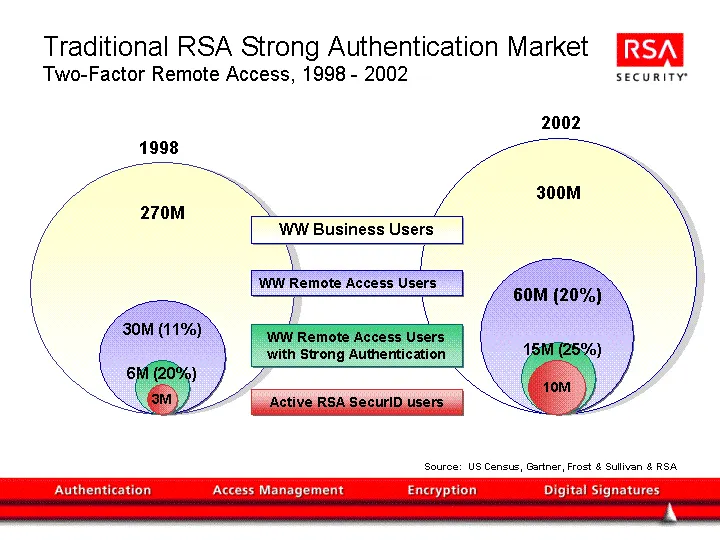
Traditional RSA Strong Authentication Market Two-Factor Remote Access, 1998 - 2002 270M 30M (11%) 6M (20%) 1998 3M 300M 60M (20%) 15M (25%) 2002 10M WW Business Users WW Remote Access Users WW Remote Access Users with Strong Authentication Active RSA SecurID users Source: US Census, Gartner, Frost &
Slide 8: Advancing e-Business
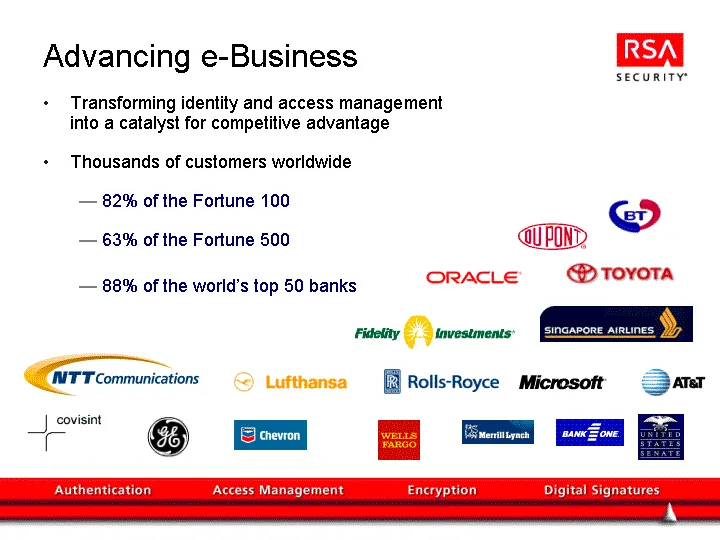
Advancing e-Business Transforming identity and access management into a catalyst for competitive advantage Thousands of customers worldwide 82% of the Fortune 100 63% of the Fortune 500 88% of the world's top 50 banks
Slide 9: Lufthansa Airlines
Lufthansa Airlines Problem 15,000 flight personnel require access to detailed, sensitive information before each flight Disseminating information to flight personnel in restricted airport areas before each flight Costly and inflexible, didn't support dynamic nature of flight schedule changes Solutio
Slide 10: Seamless and Transparent Solutions
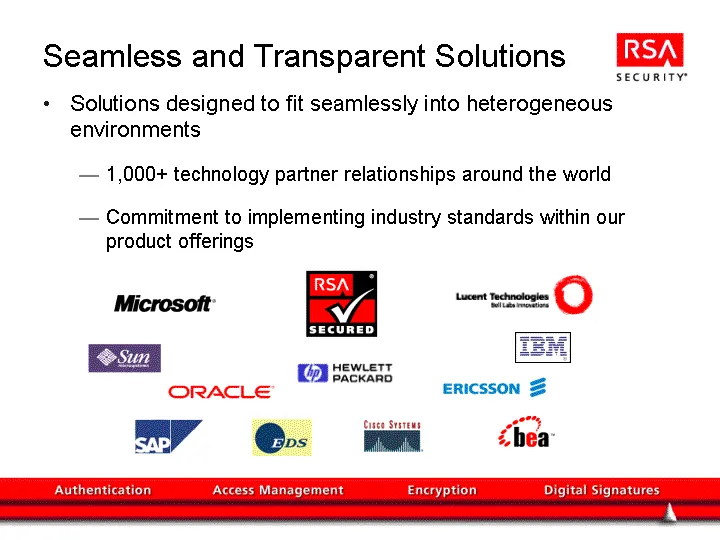
Seamless and Transparent Solutions Solutions designed to fit seamlessly into heterogeneous environments 1,000+ technology partner relationships around the world Commitment to implementing industry standards within our product offerings
Slide 11: Identity & Access Management: Expanding the Value Proposition
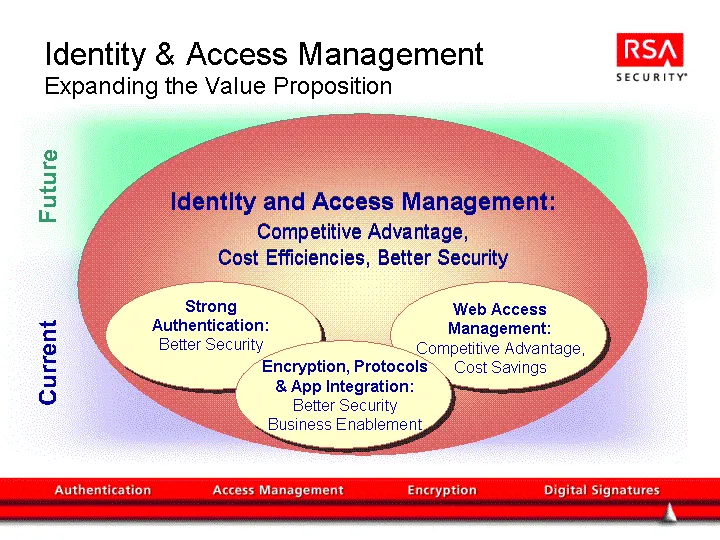
Future Current Identity & Access Management Expanding the Value Proposition Identity and Access Management: Competitive Advantage, Cost Efficiencies, Better Security Strong Authentication: Better Security Web Access Management: Competitive Advantage, Cost Savings Encryption, Protocols & App Integrat
Slide 12: Software Systems Customer
Software Systems Customer Problem $2 billion software company, 6,000 employees in 28 countries Provide secure authentication for all employees to all internal resources Control access and privileges for all employees to all internal Web-based applications Solution RSA SecurID authentication to RSA K
Slide 13: Financial Summary
Financial Summary Results from Core Operations 1997-2002 Revenue Trends Key Vertical Markets Q4 Financial Results Financial Position & Model Investment Summary
Slide 14: Financial Results 1997-2002 Core Operations
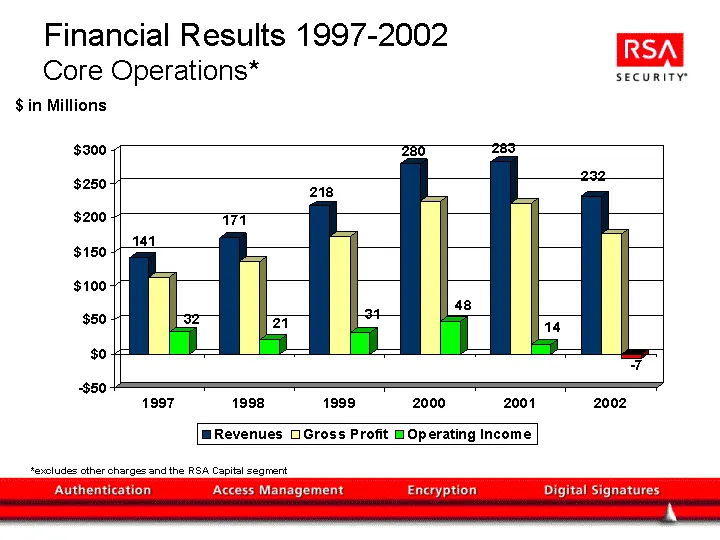
Financial Results 1997-2002 Core Operations* 1997 1998 1999 2000 2001 2002 Revenues 141 171 218 280 283 232 Gross Profit 113 136 173 225 222 176.8 Operating Income 32 21 31 48 14 -7 $ in Millions *excludes other charges and the RSA Capital segment
Slide 15: Core Operating Results Q4 2001-Q4 2002
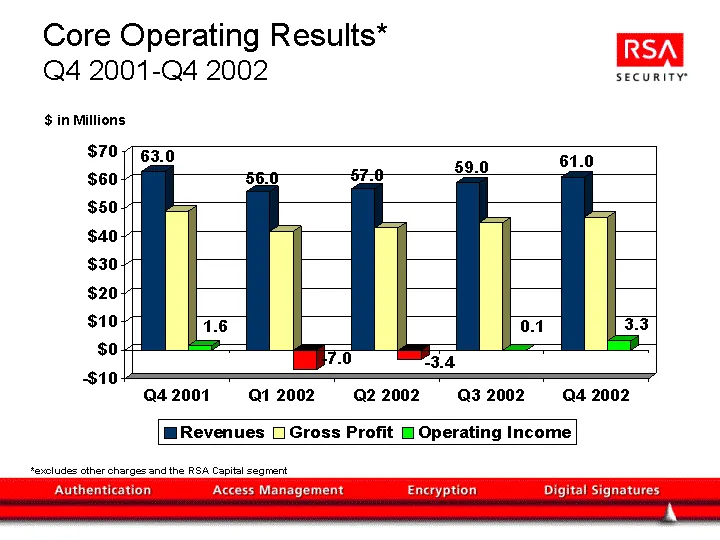
Core Operating Results* Q4 2001-Q4 2002 Q4 2001 Q1 2002 Q2 2002 Q3 2002 Q4 2002 Revenues 63 56 57 59 61 Gross Profit 49 42 43 45 47 Operating Income 1.6 -7 -3.4 0.1 3.3 $ in Millions *excludes other charges and the RSA Capital segment
Slide 16: Revenue Trends Q1 2001-Q4 2002
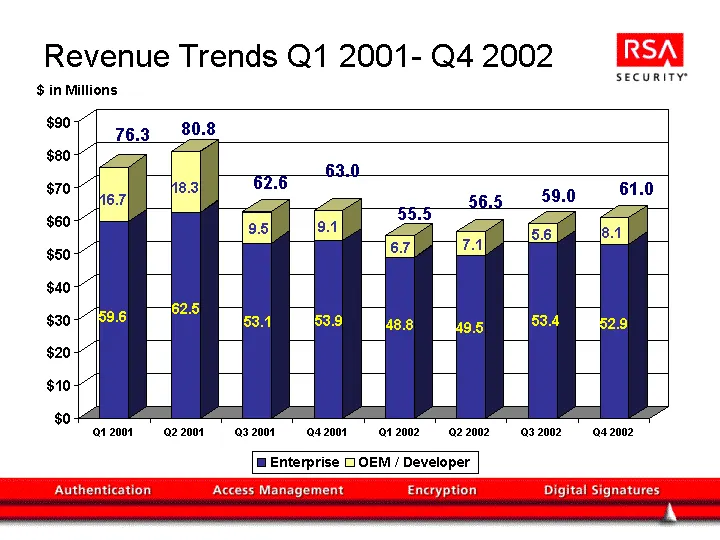
Revenue Trends Q1 2001- Q4 2002 59.6 16.7 62.5 18.3 53.1 9.5 53.9 9.1 48.8 6.7 49.5 7.1 53.4 5.6 52.9 8.1 $0 $10 $20 $30 $40 $50 $60 $70 $80 $90 Q1 2001 Q2 2001 Q3 2001 Q4 2001 Q1 2002 Q2 2002 Q3 2002 Q4 2002 Enterprise OEM / Developer $ in Millions 62.6 63.0 55.5 56.5 59.0 61.0 80.8 76.3
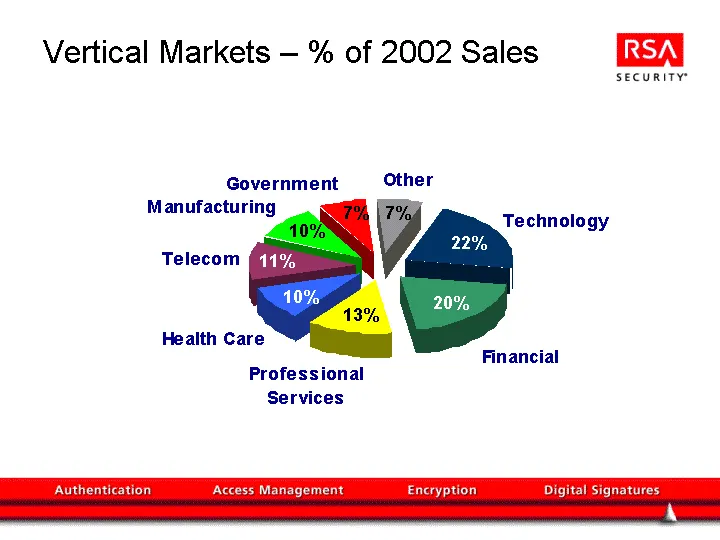
Slide 17: Vertical Markets - % of 2002 Sales
Vertical Markets - % of 2002 Sales Technology Financial Professional Services Health Care Telecom Manufacturing Government Other East 0.22 0.2 0.13 0.1 0.11 0.1 0.07 0.07 22% 20% 13% 10% 11% 10% 7% 7%
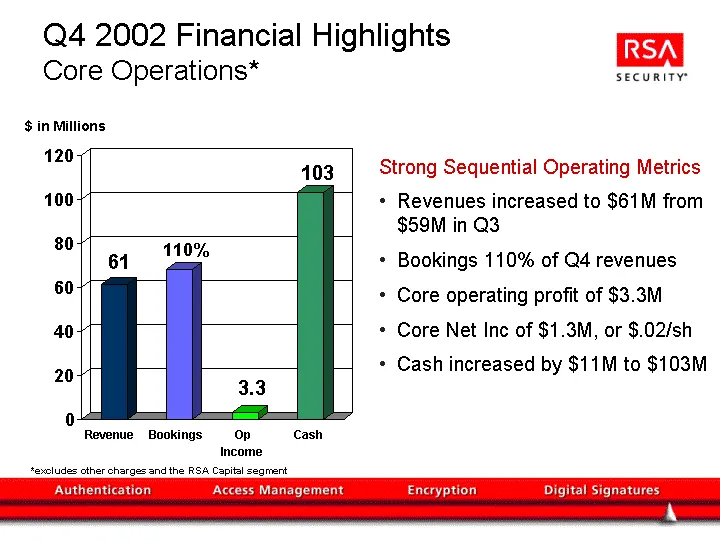
Slide 18: Q4 2002 Financial Highlights
Q4 2002 Financial Highlights Core Operations* Strong Sequential Operating Metrics Revenues increased to $61M from $59M in Q3 Bookings 110% of Q4 revenues Core operating profit of $3.3M Core Net Inc of $1.3M, or $.02/sh Cash increased by $11M to $103M 61 3.3 103 0 20 40 60 80 100 120 Revenue Bookings
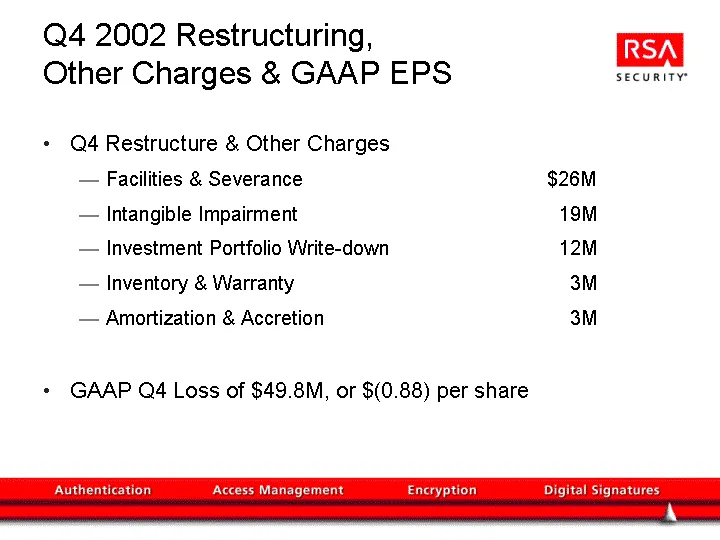
Slide 19: Q4 2002 Restructuring, Other Charges & GAAP EPS
Q4 2002 Restructuring, Other Charges & GAAP EPS Q4 Restructure & Other Charges Facilities & Severance $26M Intangible Impairment 19M Investment Portfolio Write-down 12M Inventory & Warranty 3M Amortization & Accretion 3M GAAP Q4 Loss of $49.8M, or $(0.88) per share
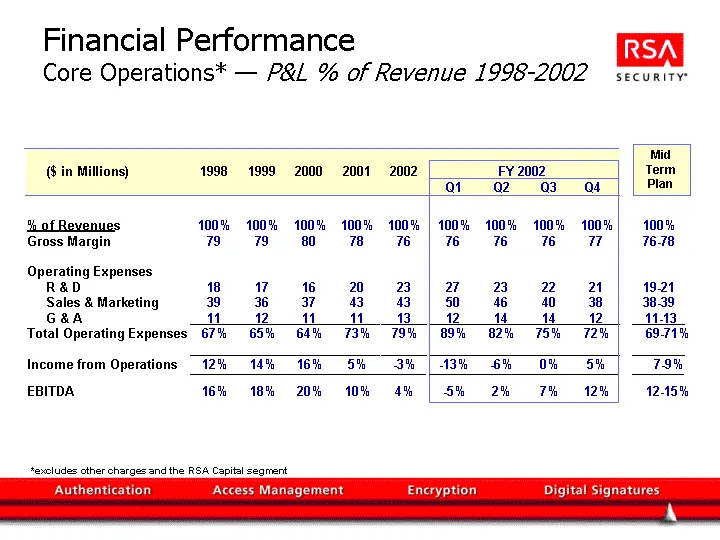
Slide 20: Financial Performance Core Operations P&L % of Revenue
Financial Performance Core Operations* - P&L % of Revenue 1998-2002 % of Revenues 100% 100% 100% 100% Gross Margin 79 79 80 78 Operating Expenses R & D 18 17 16 20 Sales & Marketing 39 36 37 43 G & A 11 12 11 11 Total Operating Expenses 67% 65% 64% 73% Income from Operations 12% 14% 16% 5% EBITDA 16
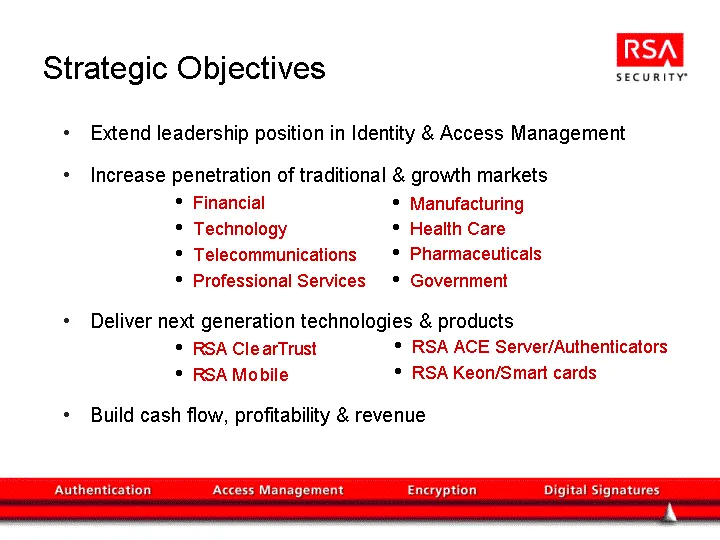
Slide 21: Strategic Objectives
Extend leadership position in Identity & Access Management Increase penetration of traditional & growth markets Financial Technology Telecommunications Professional Services Deliver next generation technologies & products RSA ClearTrust RSA Mobile Build cash flow, profitability & revenue Manufacturi
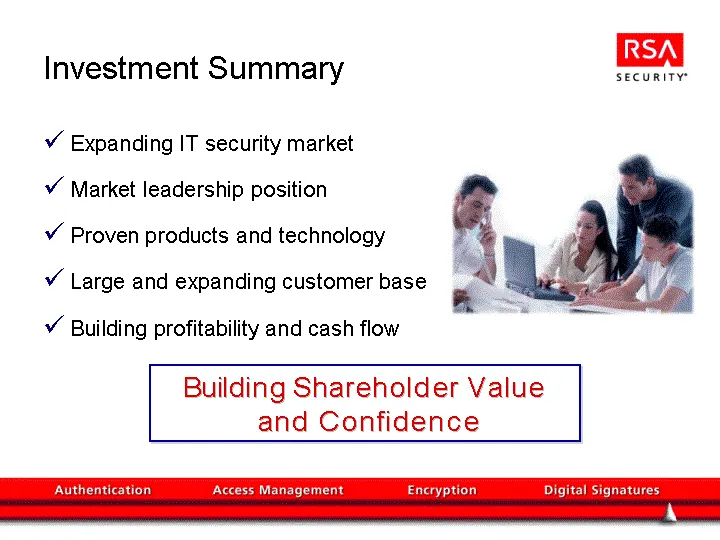
Slide 22: Investment Summary
Investment Summary Expanding IT security market Market leadership position Proven products and technology Large and expanding customer base Building profitability and cash flow Building Shareholder Value and Confidence
Slide 23: RSA Security
SECURITY® www.rsasecurity.com Authentication Access Management Encryption Digital Signature:
Source: SEC EDGAR · 8-K filed Feb 4, 2003
More decks from Rsa Security Inc
 Merger or Acquisition (June 2006)29 slides · Jun 30, 2006
 Investor Presentation (May 2006)31 slides · May 10, 2006
 Investor Presentation (December 2005)19 slides · Dec 9, 2005
 Investor Presentation (November 2005)23 slides · Nov 3, 2005
 Investor Presentation (July 2005)18 slides · Jul 29, 2005
 Investor Presentation (April 2005)24 slides · Apr 28, 2005