Novelis — Investor Day (May 2005)
73 slides from Novelis's investor day presentation, May 20, 2005

Slide 1: Delivering on Our Strategy
Delivering on Our Strategy Novelis Analyst Meeting May 19, 2005

Slide 2
Slide 3: Safe Harbor Statement
a Safe Harbor Statement HUFL ‘The slides included in this presentation (the "Presentation’) contain proprietary information regarding the operations of Novelis Inc. ¢’Novelis"). The information herein has been prepared on the basis of information provided by Alcan and other sources deemed reliable.

Slide 4: Oswego Plant Tour
Novelis Oswego Plant Tour
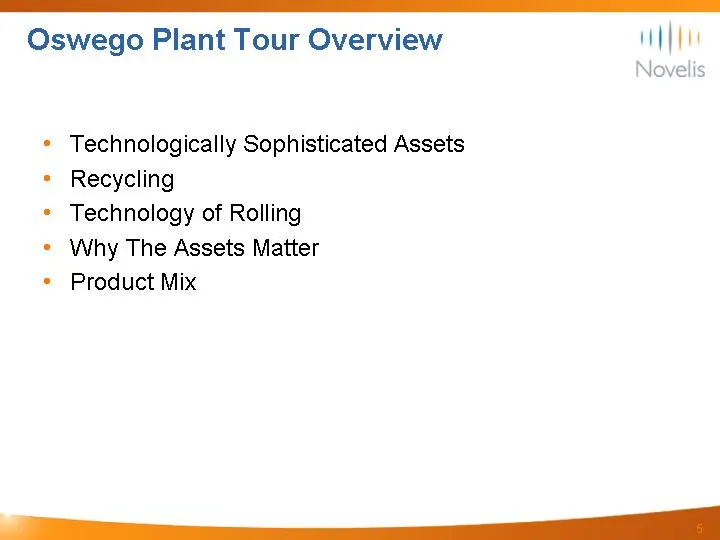
Slide 5: Oswego Plant Tour Overview
Oswego Plant Tour Overview * Technologically Sophisticated Assets * Recycling * Technology of Rolling « Why The Assets Matter * Product Mix
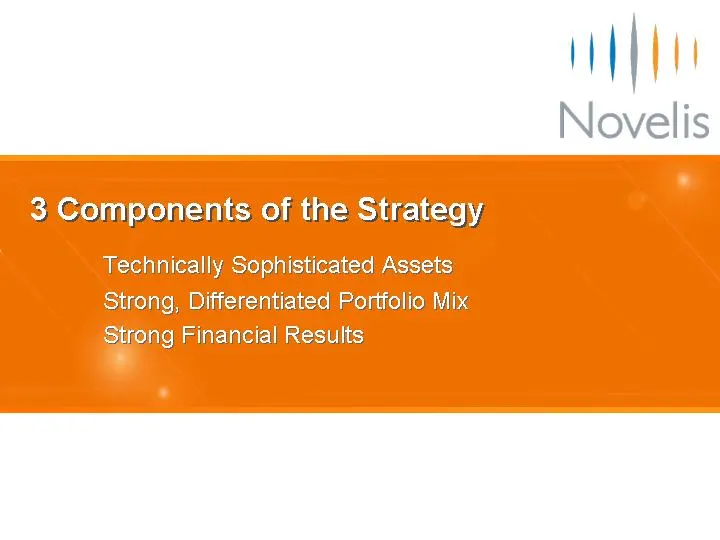
Slide 6: Components of the Strategy
ML Novelis C. 3 Components of the Strategy

Slide 7: Technically Sophisticated Assets
\|| Novelis Technically Sophisticated Assets
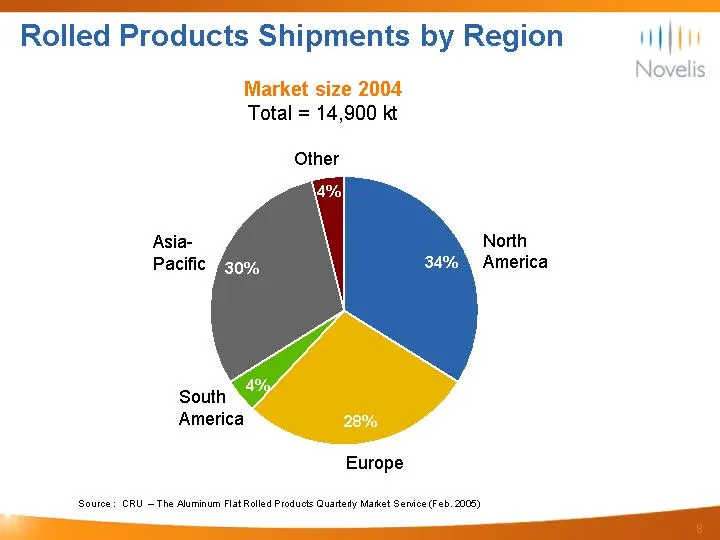
Slide 8: Rolled Products Shipments by Region
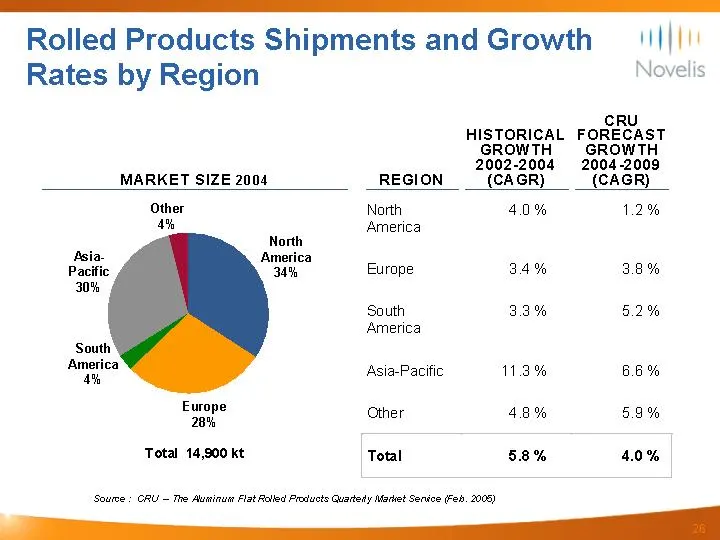
Rolled Products Shipments by Region ult Nov Market size 2004 Total = 14,900 kt Other Asia- North Pacific America South SW America Europe Source: CRU — The Aluminum FlatRolled Products Quartefy Maket Service Fab, 2005) c
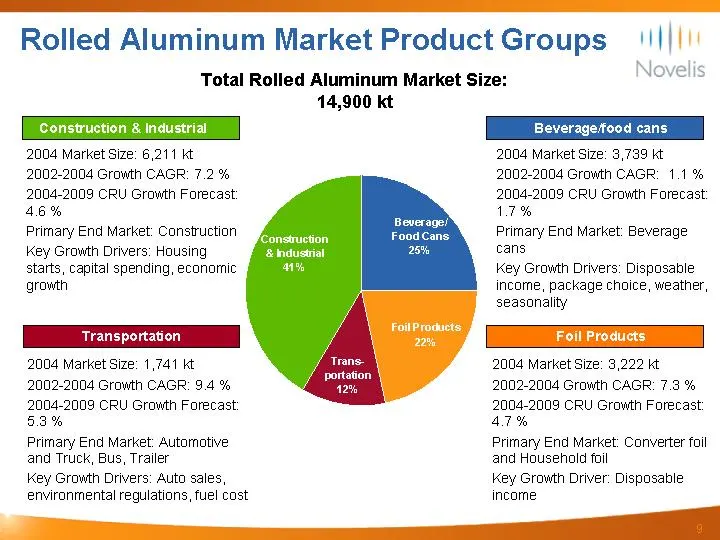
Slide 9: Rolled Aluminum Market Product Groups
Construction & industrial 2004 Market Size: 6,211 Kt 2002-2004 Growth CAGR: 7.2% 2004-2009 CRU Growth Forecast 46% Primary End Market: Construction key Growth Drivers: Housing starts, capital spending, economic growth Transportation 2004 Market Size: 1,741 Kt 2002-2004 Growth CAGR: 9.4% 2004-2009 CR
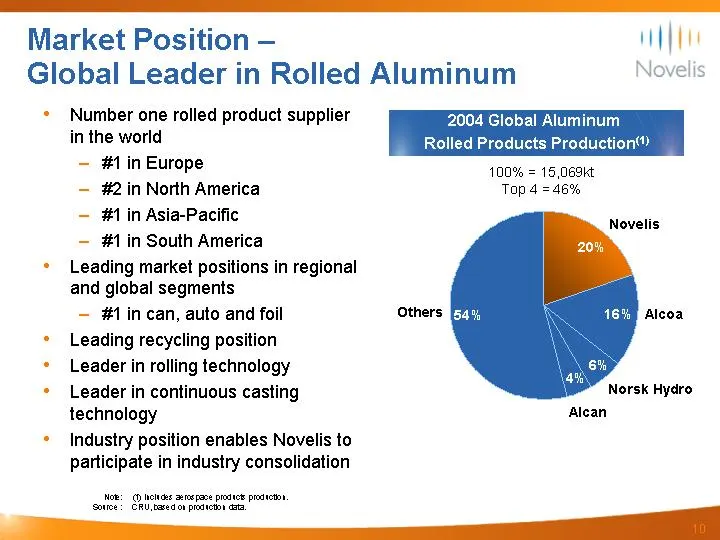
Slide 10: Market Position
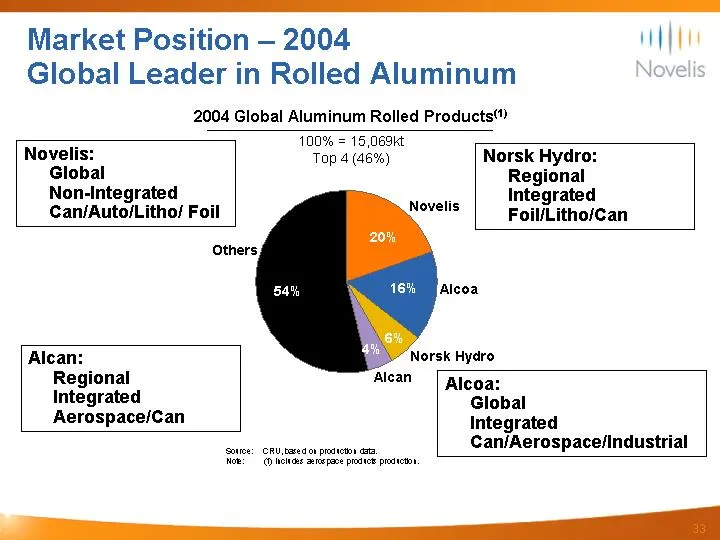
a Market Position — HAY Global Leader in Rolled Aluminum Novelis * Number one rolled product supplier 2004 Global Aluminum ‘#1 In Europe 100% = 15,069K¢ — #2 in North America Top 4 =46% — #1 in Asia-Pacific — #1 in South America * Leading market positions in regional and global segments — #1 in can,
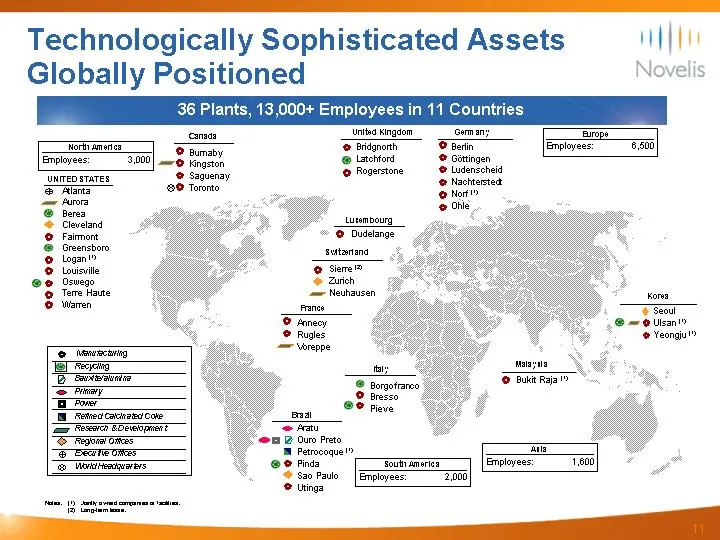
Slide 11: Technologically Sophisticated Assets: Globally Positioned
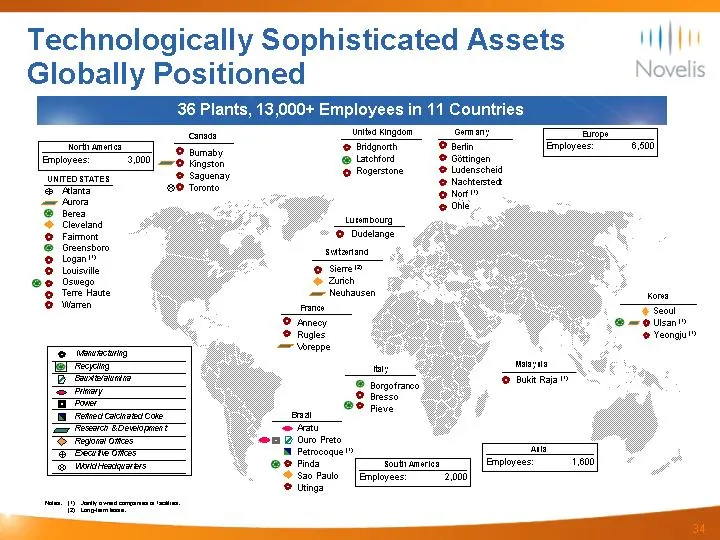
Technologically Sophisticated Assets ALLL Globally Positioned Ne 36 Plants, 13,000+ Employees in 11 Countries conse unt Kngcom ‘coma; PoE % Bidoroth Bein Tai en | _ 2 oma Epo aaa] 8 Soe Seas pret f@ Rogerstine © Ludenscheld UNITED ATER query rnin @ Aina 20 Tororo = furor © Berea “3 © Cleveland ap __
Slide 12: Strong, Differentiated Portfolio Mix
\|| Novelis strong, Differentiated Portfolio Mix
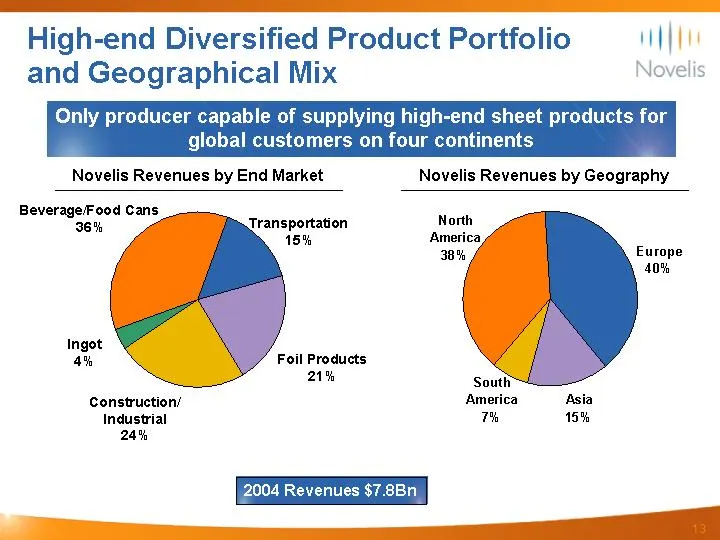
Slide 13: High-end Diversified Product Portfolio and Geographical Mix
High-end Diversified Product Portfolio HUFL and Geographical Mix Only producer capable of supplying high-end sheet products for global customers on four continents Novelis Revenues by End Market Novelis Revenues by Geography Beverage/Food Cans 36% Transportation 15% North America, 38% Ingot 4% Foil

Slide 14: Market Stability
Novelis Market Stability
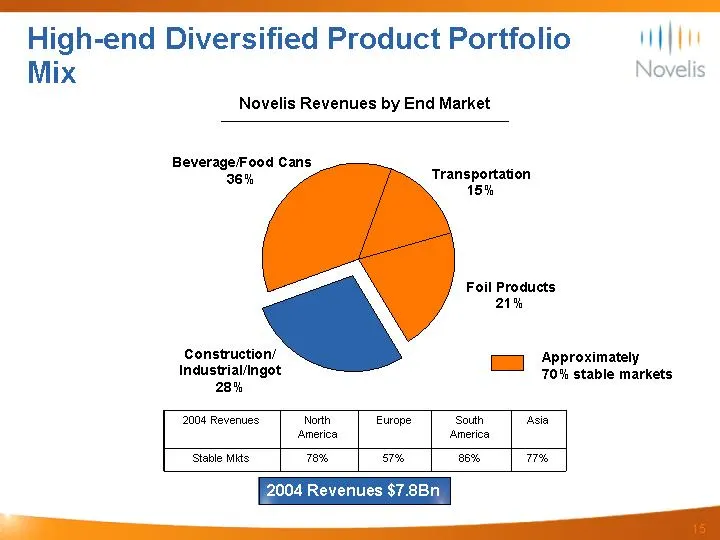
Slide 15: High-end Diversified Product Portfolio Mix
High-end Diversified Product Portfolio HAY Mix No Novelis Revenues by End Market Beverage/Food Cans 36% Transportation 15% Foil Products 21% Construction/ ay AP Proximatety Industrialingot 70% stable markets 28% 2004 Revenues North Europe South Asia America America ‘Stable Mts 78% 51% 86% 17% 2004 R
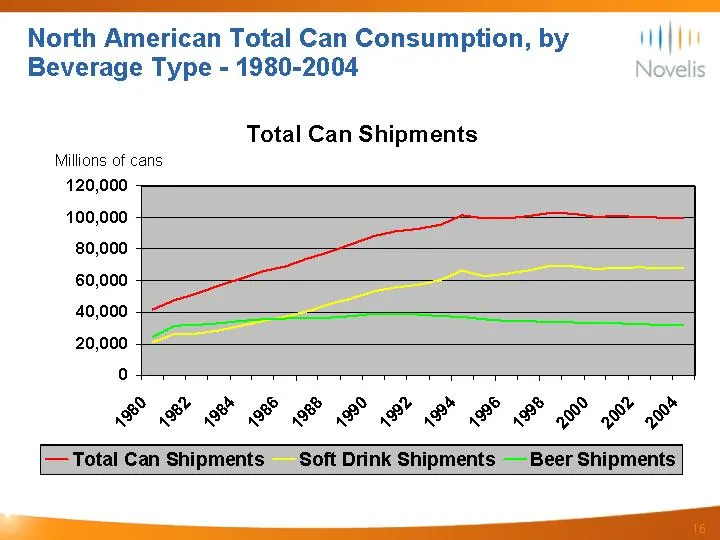
Slide 16: North American Total Can Consumption by Beverage Type
North American Total Can Consumption, by WAPI Beverage Type - 1980-2004 Total Can Shipments Millions of cans 120,000 100,000 80,000 60,000 40,000 20,000 0 Ph EFF FEE EHSL ES S sb Ss —Total Can Shipments ‘Soft Drink Shipments — Beer Shipments ——_— — ———— =
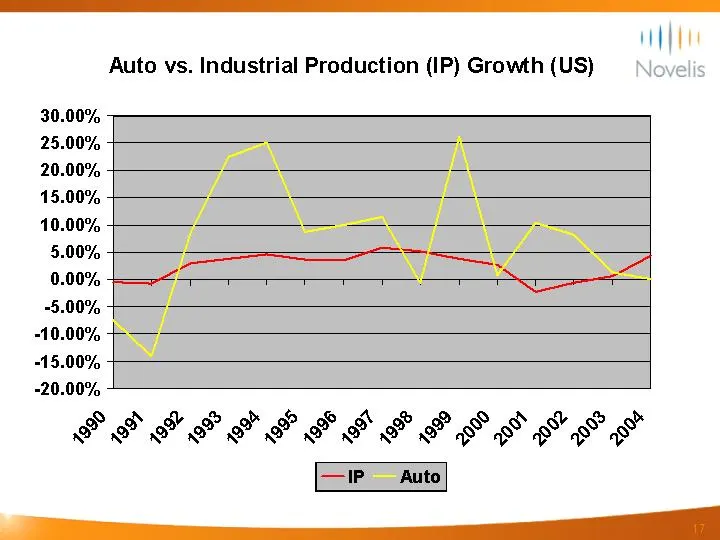
Slide 17: Auto vs. Industrial Production Growth (US)
me Auto vs. Industrial Production (IP) Growth (US) 30.00% 25.00% TaN 20.00% 15.00% f— Ry 10.00% AN i 5.00% i 0.00% T u 5.00% 10.00% 15.00% -20.00% Sd SP oP PP © A ODM DD DP a n° 3° PD = 2” & PPP PPP PPP PS SP es of —IP Auto ——_
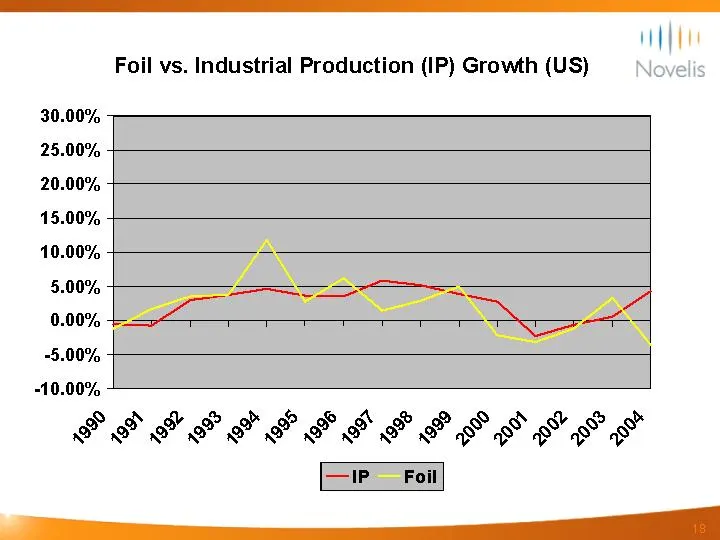
Slide 18: Foil vs. Industrial Production Growth (US)
mn Foil vs. Industrial Production (IP) Growth (US) 30.00% 25.00% 20.00% 15.00% 10.00% 5.00% 0.00% 5.00% 10.00% Sd SP oP PP © A ODM DD DP a n° 3° PD = 2” & PPP PPP PPP PS SP es of —IP__ Foil —_ — ——
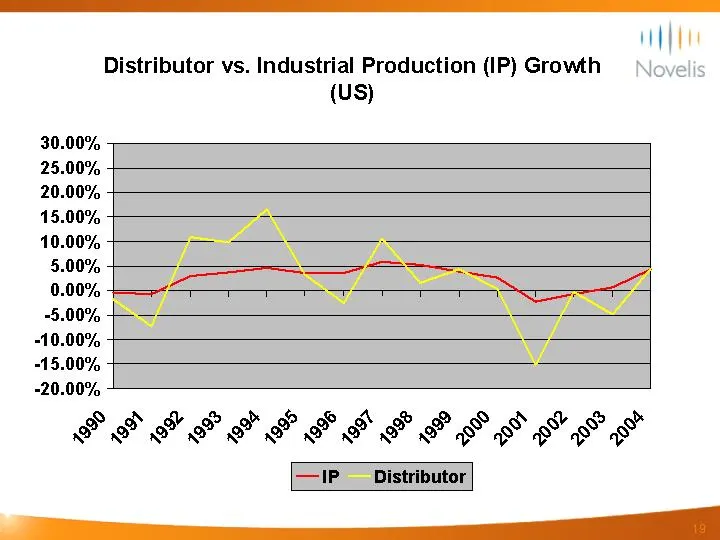
Slide 19: Distributor vs. Industrial Production Growth (US)
ee me Distributor vs. Industrial Production (IP) Growth (Us) 30.00% 25.00% 20.00% 15.00% 10.00% 5.00% 0.00% T T T T T 5.00% 10.00% 15.00% -20.00% Sd Sh Dm oP oO Ah hm OM OD a n° 3° PD Ss S PP PP PP PP PP SS 2 S os —IP__ Distributor ———_ ———

Slide 20: Strong Financial Results
\|| Novelis strong Financial Results
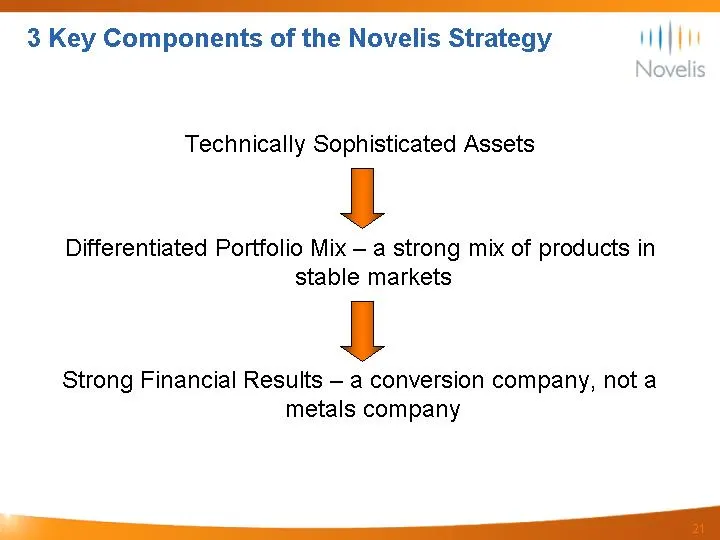
Slide 21: Key Components of the Novelis Strategy
3 Key Components of the Novelis Strategy HUFL Technically Sophisticated Assets § Differentiated Portfolio Mix — a strong mix of products in stable markets § Strong Financial Results — a conversion company, not a metals company —_—
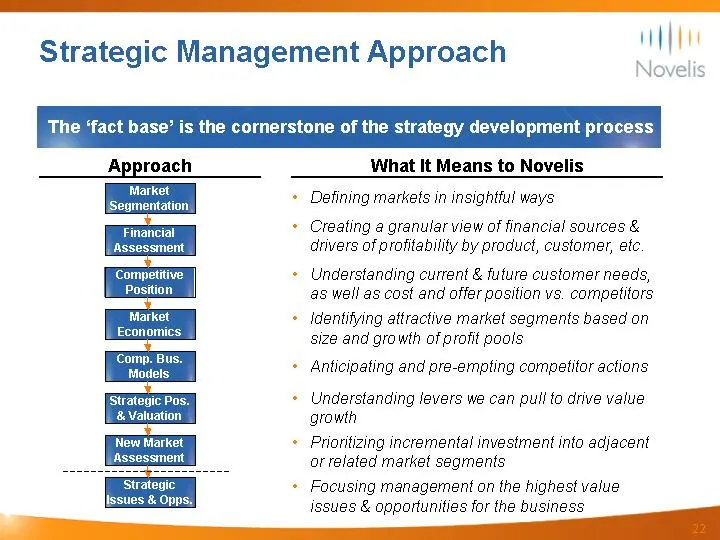
Slide 22: Strategic Management Approach
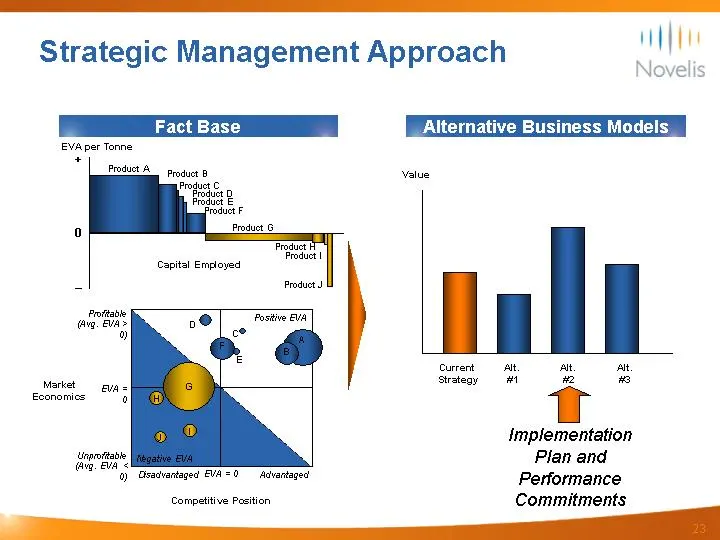
Strategic Management Approach The ‘fact base’ is the cornerstone of the strategy development process Approach What It Means to Novelis Market Segmentation: Financial Assessment Competitive Position Market Economics ‘Comp. Bus. Models Strategic Pos. & Valuation New Market Assessment Strategic issues
Slide 23: Strategic Management Approach
Strategic Management Approach ayn EVApar Tenne Protabie es Festive BVA e Current al a at Market aya e Strategy #1 fa Economies : T implementation aoa Plan and 1) Gsadvartaged EVA= 0 Advantage Pertomiante, Competitive Position Commitments

Slide 24: Financial Growth Strategy
\|| Novelis Financial Growth Strategy
Slide 25: Regional Income & LME Price
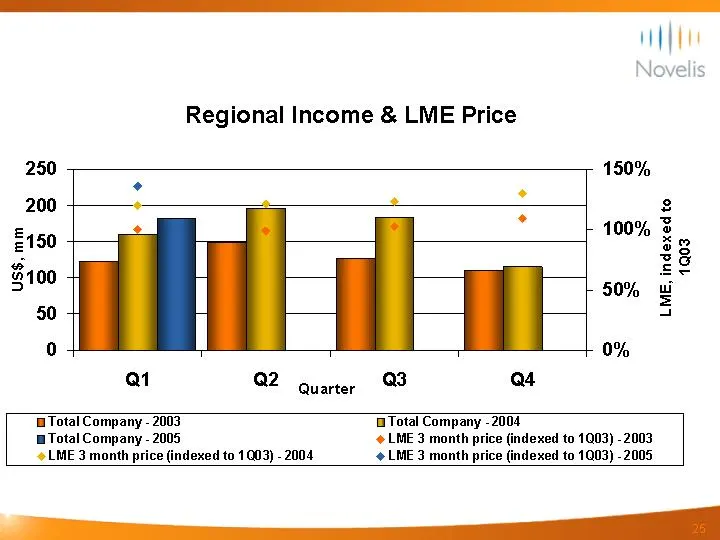
Regional Income & LME Price 250 150% a6 oa 200 " 2 2 @ Lepanan E150 | 100% B10 + ze 8 | 50% wi so | z o4 0% at C2 guarter 9 a4 BiTotal Company - 2003 Total Company 2004 Total Company - 2005 @LME 3 month price (indexed to 1003) -2003 ¢LME 3 month price (indexed to 1003) - 2004 @LME 3 month price (ind
Slide 26: Rolled Products Shipments and Growth Rates by Region
Rolled Products Shipments and Growth Rates by Region CRU HISTORICAL FORECAST GROWTH GROWTH 2002-2004 2004-2009 MARKET SIZE 2004 REGION (CAGR) (CAGR) Other North 40% 1.2% America North America 344% Europe 34% 3.8% South 33% 5.2% America America yy Y rl Asia-Pacific 11.3% 66% Europe yy Y pli Other 48%
Slide 27: Examples of Cost Cutting Activities
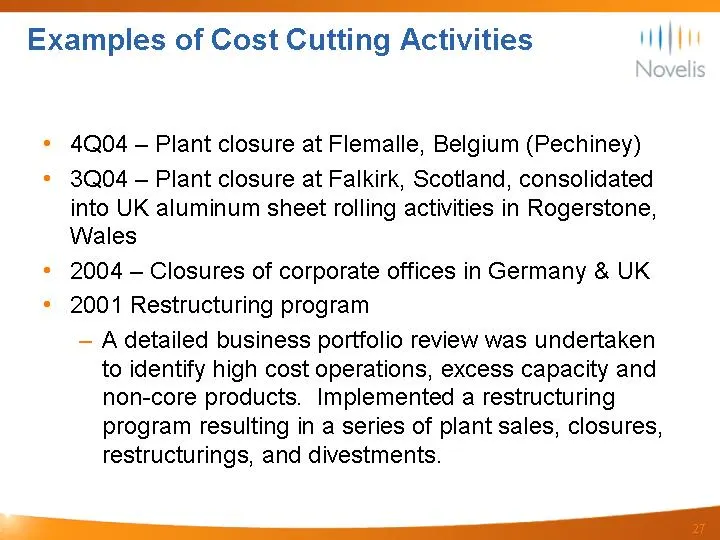
Examples of Cost Cutting Activities HAY * 4Q04 - Plant closure at Flemalle, Belgium (Pechiney) * 3Q04 - Plant closure at Falkirk, Scotland, consolidated into UK aluminum sheet rolling activities in Rogerstone, Wales * 2004 — Closures of corporate offices in Germany & UK * 2001 Restructuring program
Slide 28: Novelis Strategy
Novelis Novelis Strategy
Slide 29: Key Components of the Novelis Strategy
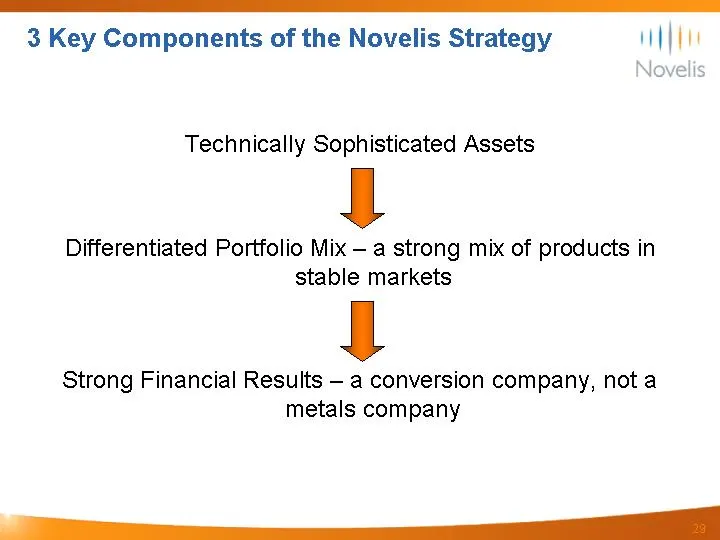
3 Key Components of the Novelis Strategy HUFL Technically Sophisticated Assets § Differentiated Portfolio Mix — a strong mix of products in stable markets § Strong Financial Results — a conversion company, not a metals company —— —————
Slide 30: Focus and Strategy
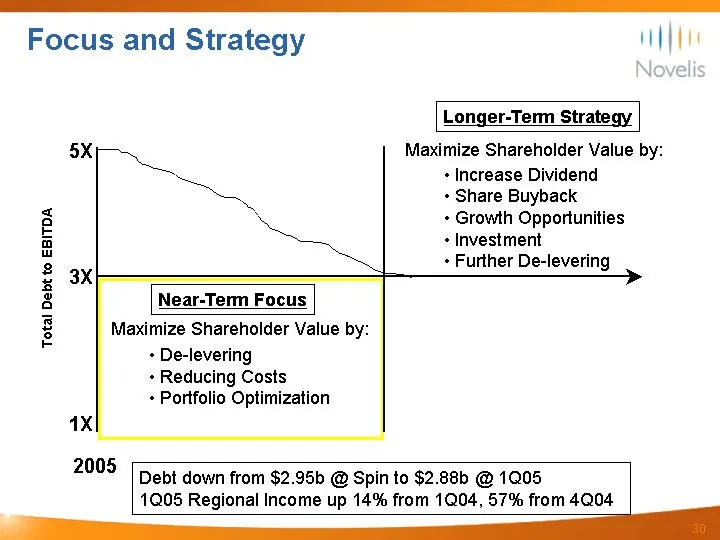
Focus and Strategy HAY Total Debt to EBITDA 2005 Longer-Term Strategy 5X a Maximize Shareholder Value by: + Increase Dividend an + Share Buyback + Growth Opportunities + Investment + Further De-levering Near-Term Focus Maximize Shareholder Value by: + De-levering + Reducing Costs + Portfolio Optimiz
Slide 31: Components of the Strategy
ML Novelis C. 3 Components of the Strategy
Slide 32
Slide 33: Market Position — 2004
Market Position — 2004 HUFL Global Leader in Rolled Aluminum . 2004 Global Aluminum Rolled Products‘) 100% = 15,069Kt Novelis: Top 4 (46%) Norsk Hydro: Global Regional Non-Integrated Integrated Can/Auto/Litho/ Foil Novells | Foil/Litho/Can Others ‘Alcan: Norsk Hydro Regional Alcoa: Integrated Global
Slide 34: Technologically Sophisticated Assets: Globally Positioned
Technologically Sophisticated Assets ALLL Globally Positioned Ne 36 Plants, 13,000+ Employees in 11 Countries conse unt Kngcom ‘coma; PoE % Bidoroth Bein Tai en | _ 2 oma Epo aaa] 8 Soe Seas pret f@ Rogerstine © Ludenscheld UNITED ATER query rnin @ Aina 20 Tororo = furor © Berea “3 © Cleveland ap __
Slide 35: Industry Structure — Consolidating
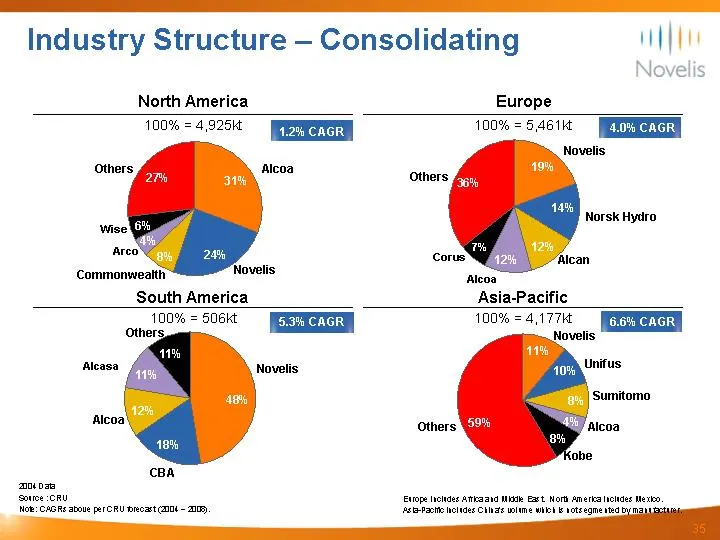
Industry Structure — Consolidating yy North America Europe 100% = 4,925K 100% = 5,461K Commonweatth South America Asia-Pacific 100% = 506K 100% = 4,177K Novelis ‘sovce oR Evope oe aan Mite Eart Word amerka Hohe Meno Nok: CAGRS stove per CRU recat es CAhge ile WEE aoteege
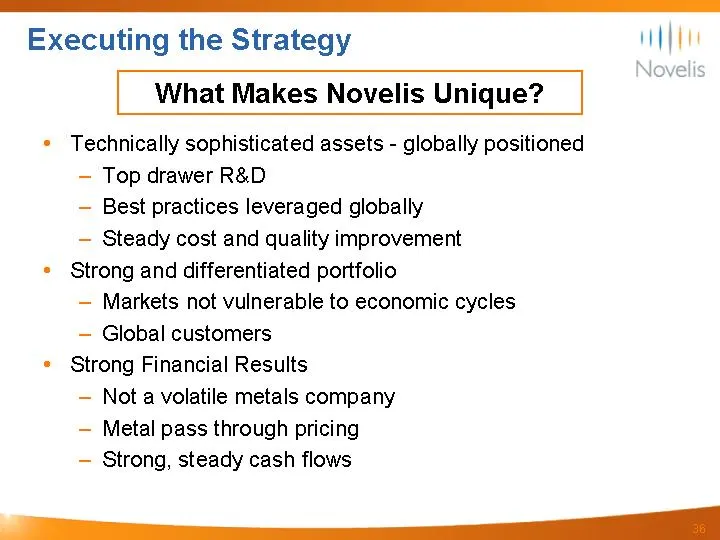
Slide 36: Executing the Strategy
Executing the Strategy yp What Makes Novelis Unique? * Technically sophisticated assets - globally positioned — Top drawer R&D — Best practices leveraged globally — Steady cost and quality improvement * Strong and differentiated portfolio — Markets not vulnerable to economic cycles — Global customer
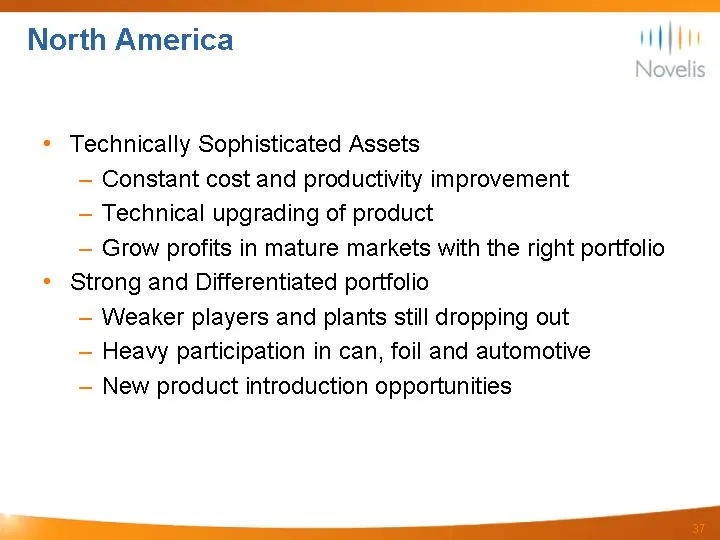
Slide 37: North America
a North America HAY * Technically Sophisticated Assets — Constant cost and productivity improvement — Technical upgrading of product — Grow profits in mature markets with the right portfolio * Strong and Differentiated portfolio — Weaker players and plants still dropping out — Heavy participation in
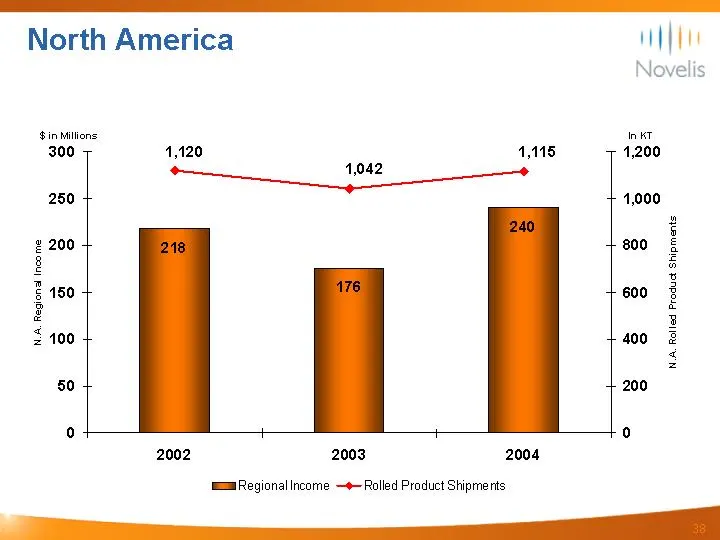
Slide 38: North America
a North America $n Mitione 300 1,120 1,115 1,200 ~— 1,042 + 250 : 1,000 i 2 200 800 8 fa 2 2 5 150 600 2 é 3 $100 400 2 4 50 200 o+ +o 2002 2003 2004 =aRegional income —e Rolled Product Shipments
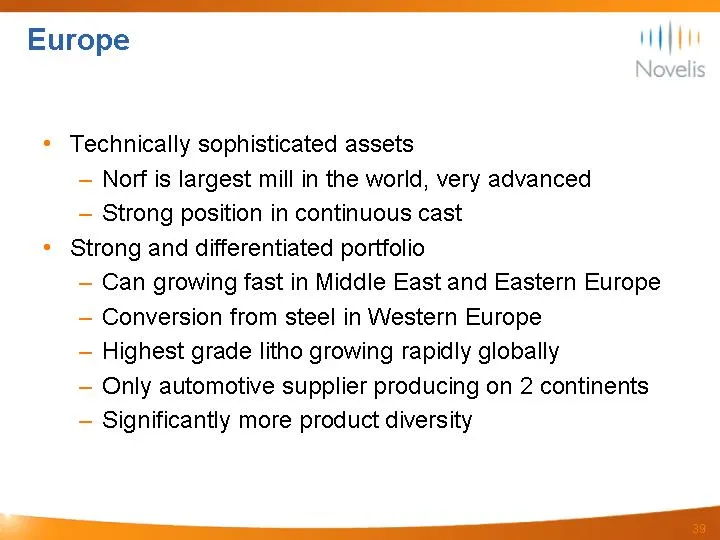
Slide 39: Europe
a Europe me * Technically sophisticated assets — Nort is largest mill in the world, very advanced — Strong position in continuous cast * Strong and differentiated portfolio — Can growing fast in Middle East and Eastern Europe — Conversion from steel in Western Europe — Highest grade litho growing ra
Slide 40: Europe
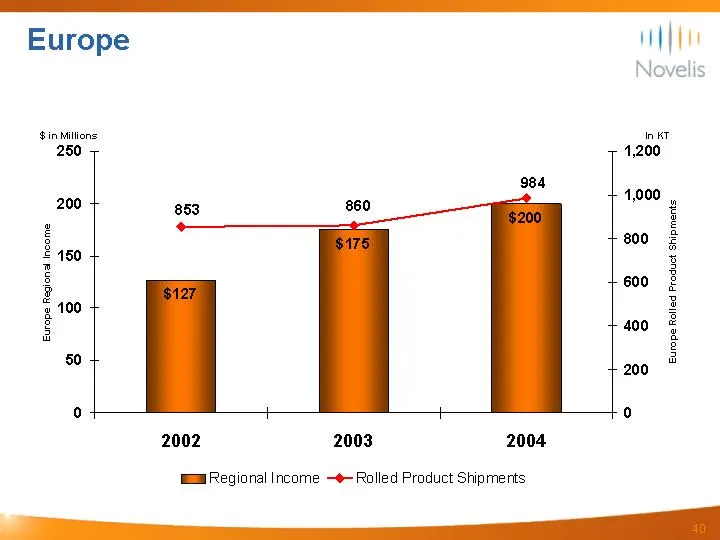
Europe 250 1,200 oe 1,000 200 853 860 “e : i 5 800 F = 150 3 > 600 é ‘q 100 2 & 400 50 200 ® Or t t +O 2002 2003 2004 E@aRegional Income -¢-Rolled Product Shipments
Slide 41: South America
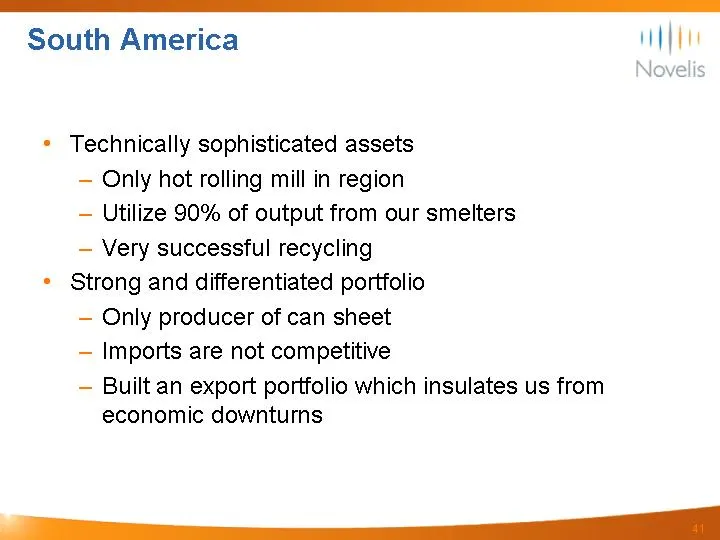
a South America HUFL * Technically sophisticated assets — Only hot rolling mill in region — Utilize 90% of output from our smelters — Very successful recycling * Strong and differentiated portfolio — Only producer of can sheet — Imports are not competitive — Built an export portfolio which insulates
Slide 42: South America
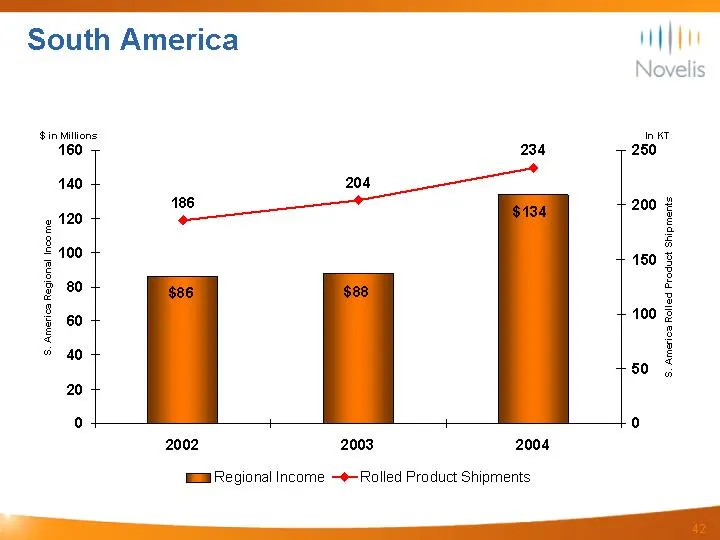
a South America int 160 234 250 SinMitions 140 204 186 200 150 00 40 0 20 o + +O 2002 2003 2004 28 8 8 g 8 8, America Regional Inco me g 8 a 5. America Rolled Product Shipments E@aRegional Income -¢-Ralled Product Shipments
Slide 43: Asia
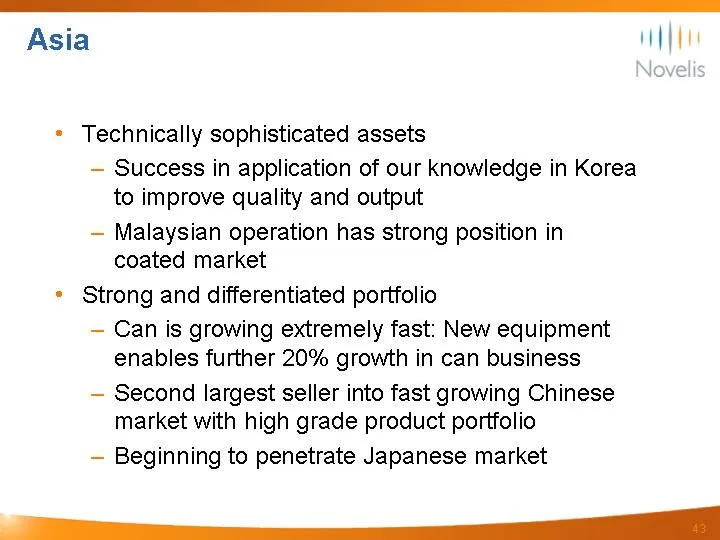
a Asia wt * Technically sophisticated assets — Success in application of our knowledge in Korea to improve quality and output — Malaysian operation has strong position in coated market * Strong and differentiated portfolio — Can is growing extremely fast: New equipment enables further 20% growth in
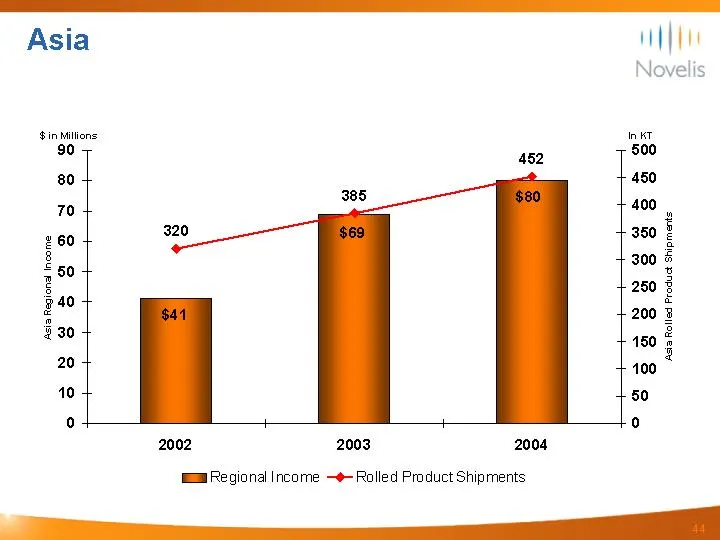
Slide 44: Asia
Asia $inMitons init 90 452 500 80 450 “a 385 400, 60 320 350} 8 300 5 £50 g . 250 3 3 40 é : 200 8 #30 150 4 20 100 10 50 of Lo 2002 2003 2004 E@aRegiona Income —¢ Rolled Product Shipments
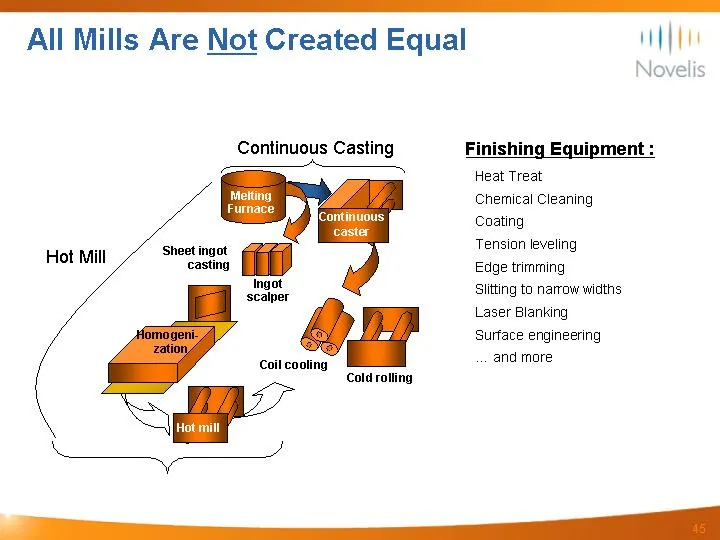
Slide 45: All Mills Are Not Created Equal
All Mills Are Not Created Equal Continuous Casting a _—~ Melting Furnace Sheet ingot casting Ingot scalper Hot Mill Coil cooling ee Cold rolling inishing Equipment : Heat Treat Chemical Cleaning Coating Tension leveling Edge trimming Sitting to narrow widths Laser Blanking Surface engineering and mo
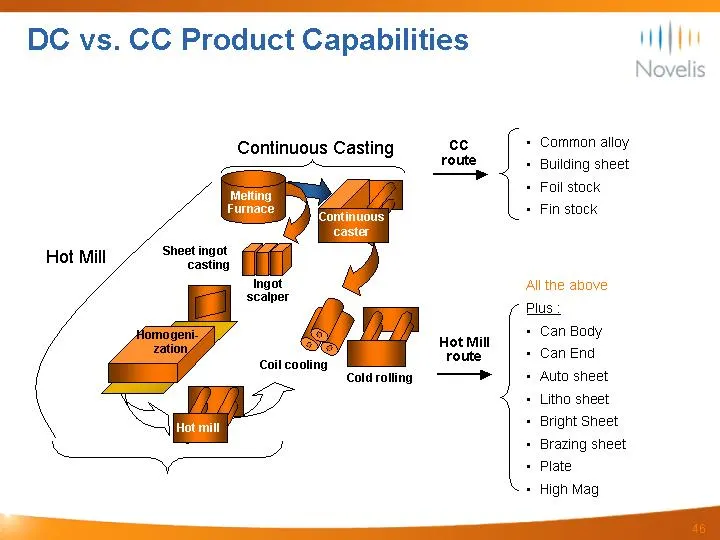
Slide 46: DC vs. CC Product Capabilities
DC vs. CC Product Capabilities Continuous Casting marie a _—~ — Melting Furnace , Sheet ingot Hot Mill eon na Ingot sealer Hot Mill Coil cooling rope Cold rolling =< ee Common alloy Building sheet Foil stack Fin stock All the above Plus Can Body Can End Auto sheet Litho sheet Bright Sheet Brazing sh
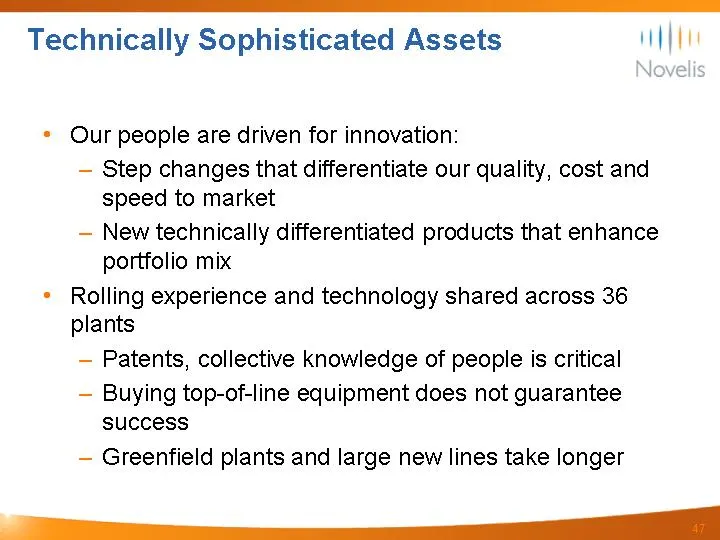
Slide 47: Technically Sophisticated Assets
a Technically Sophisticated Assets HAY * Our people are driven for innovation: — Step changes that differentiate our quality, cost and speed to market — New technically differentiated products that enhance portfolio mix * Rolling experience and technology shared across 36 plants — Patents, collectiv
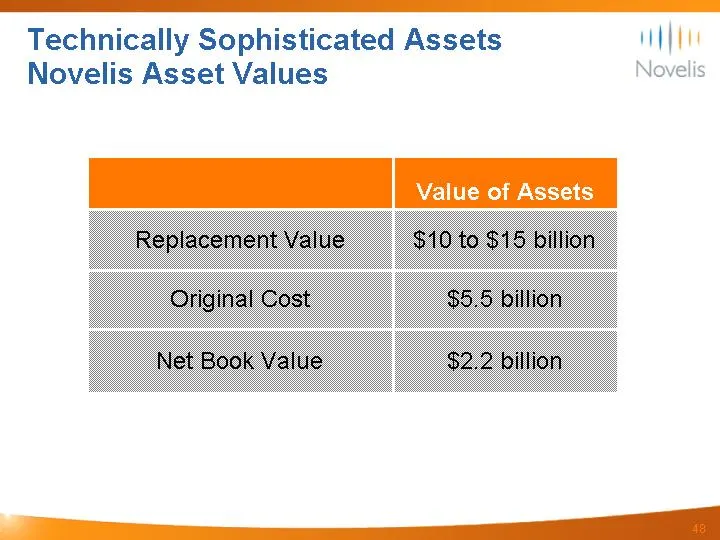
Slide 48: Technically Sophisticated Assets: Novelis Asset Values
Technically Sophisticated Assets | Novelis Asset Values Novelis
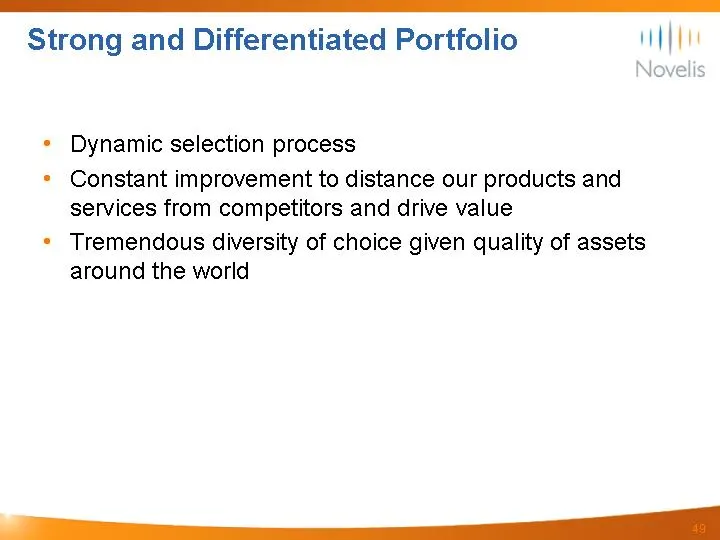
Slide 49: Strong and Differentiated Portfolio
a Strong and Differentiated Portfolio HUFL * Dynamic selection process * Constant improvement to distance our products and services from competitors and drive value * Tremendous diversity of choice given quality of assets around the world
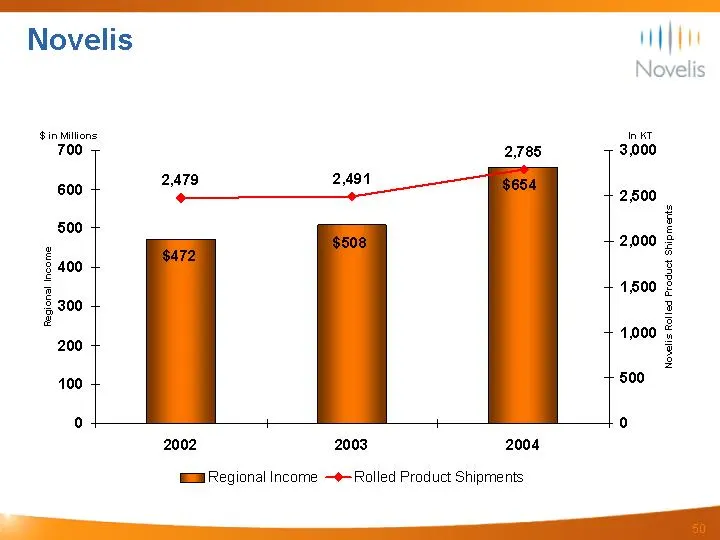
Slide 50: Novelis Regional Income and Shipments
Novelis Sin bilions init 700 2,785 3,000 2.479 2,491 600 2.500 500 2 a 2900 2 400 3 A 1500 2 © 300 3 & 100 § 200 3 “100 500 of Lo 2002 2003 2004 E=aRegional Income —¢-Ralled Product Shipments ——

Slide 51
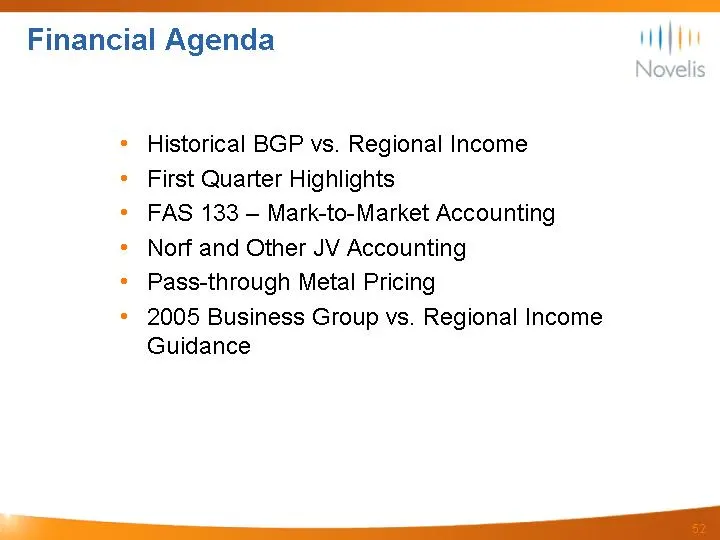
Slide 52: Financial Agenda
a Financial Agenda HAY * Historical BGP vs. Regional Income ° First Quarter Highlights e FAS 133 —- Mark-to-Market Accounting « Norf and Other JV Accounting « Pass-through Metal Pricing * 2005 Business Group vs. Regional Income Guidance
Slide 53: Historical BGP vs. Regional Income
\|| Novelis Historical| BGP vs. Regional Income
Slide 54: New Reporting Structure: Regional Income vs. Business Group Profit
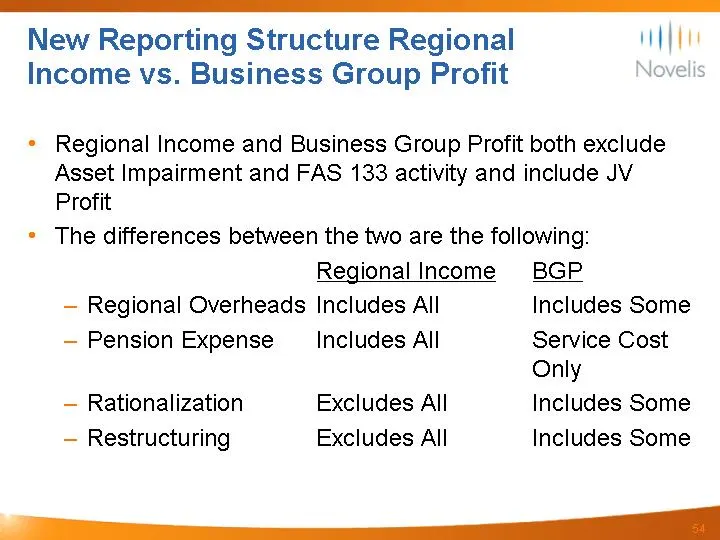
New Reporting Structure Regional HAY Income vs. Business Group Profit . « Regional Income and Business Group Profit both exclude Asset Impairment and FAS 133 activity and include JV Profit ° The differences between the two are the following: Regional Income BGP — Regional Overheads Includes All Incl
Slide 55: Regional Income
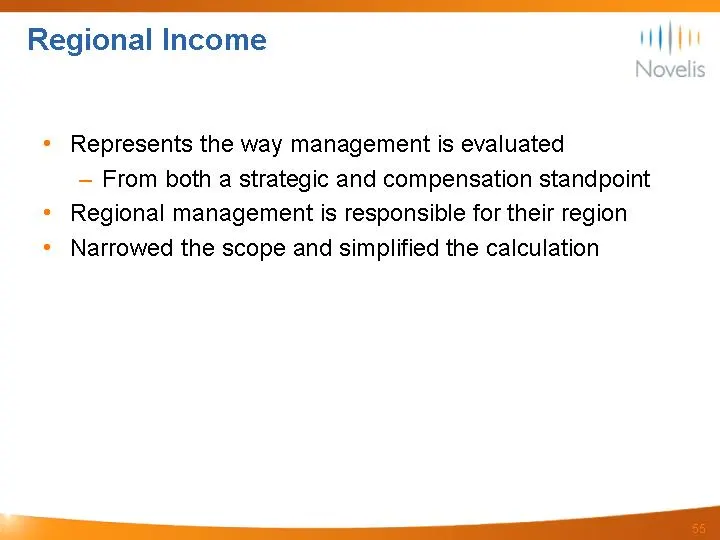
a Regional Income HAY * Represents the way management is evaluated — From both a strategic and compensation standpoint « Regional management is responsible for their region * Narrowed the scope and simplified the calculation
Slide 56: Reconciliation of Total Regional Income
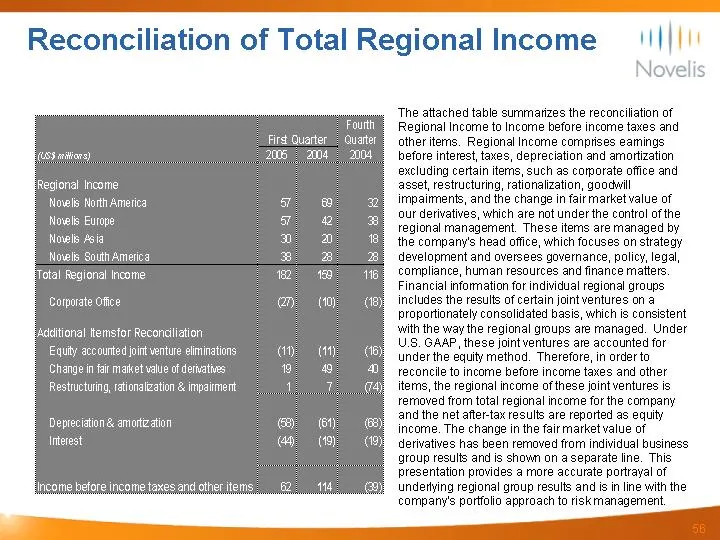
Reconciliation of Total Regional Income Regional income Nowell North Nowlls Europe Nowlls Asta Nowis South America Total Regional income orporate Office ulitional temsfor Reconciliation Equty accounted joint venture eliminations (Change in fat matket value of deratves Restructuing, raonalzation & im
Slide 57: 1st Quarter Highlights
\|| Novelis 1° Quarter Highlights
Slide 58: Recap of 1st Quarter Performance
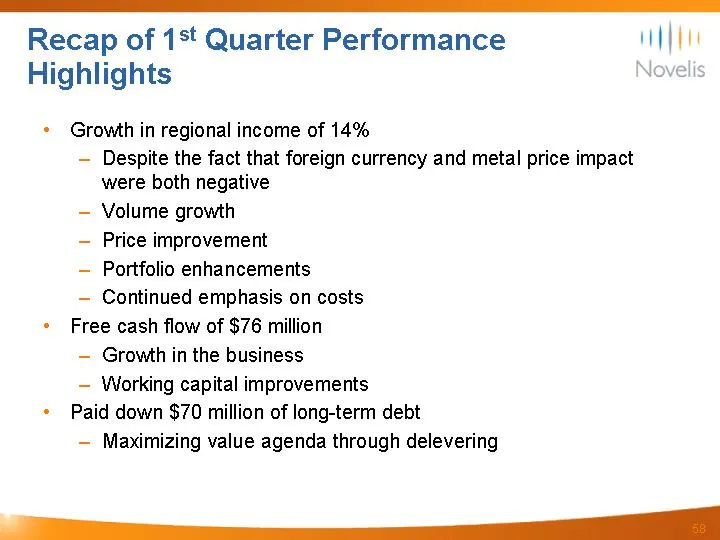
Recap of 1st Quarter Performance HUFL Highlights * Growth in regional income of 14% — Despite the fact that foreign currency and metal price impact were both negative — Volume growth — Price improvement — Portfolio enhancements — Continued emphasis on costs * Free cash flow of $76 million — Growth i
Slide 59: Capital Expenditures by Quarter
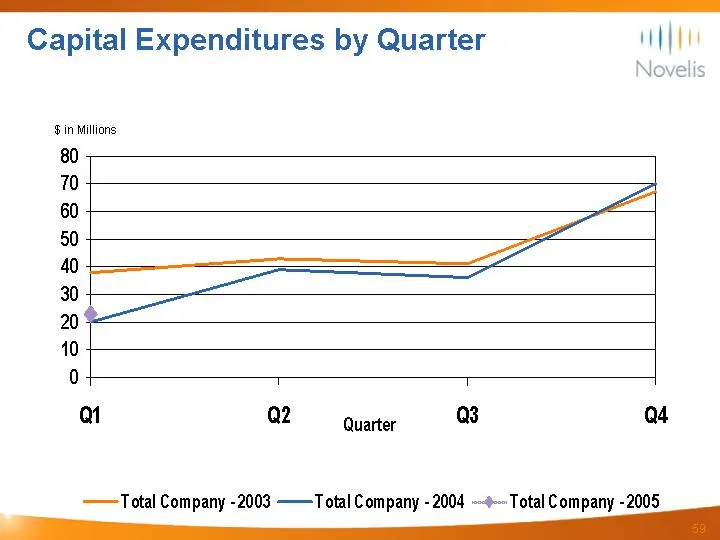
Capital Expenditures by Quarter HAY 8 in Millions 80 70 60 50 0 T T at Q2 quarter «8 a4 ——Total Company -2003 ——Total Company - 2004 ~-¢---Total Company -2005 fl
Slide 60: FAS Mark to Market Accounting
\|| Novelis FAS 133 Mark to Market Accounting,
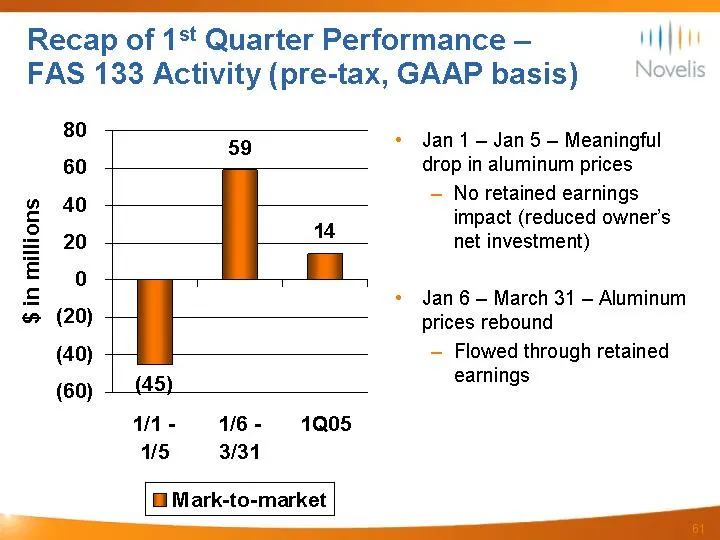
Slide 61: Recap of 1st Quarter Performance — FAS Activity
Recap of 1*t Quarter Performance — wey FAS 133 Activity (pre-tax, GAAP basis) e 80 5 60 + 40 + $ in millions 59 . 14 (45) qi41- 1/6- 1005 5 3/31 @ Mark-to-market Jan 1 — Jan 5 - Meaningful drop in aluminum prices — No retained earnings impact (reduced owner’s net investment) Jan 6 — March 31 - Alumi
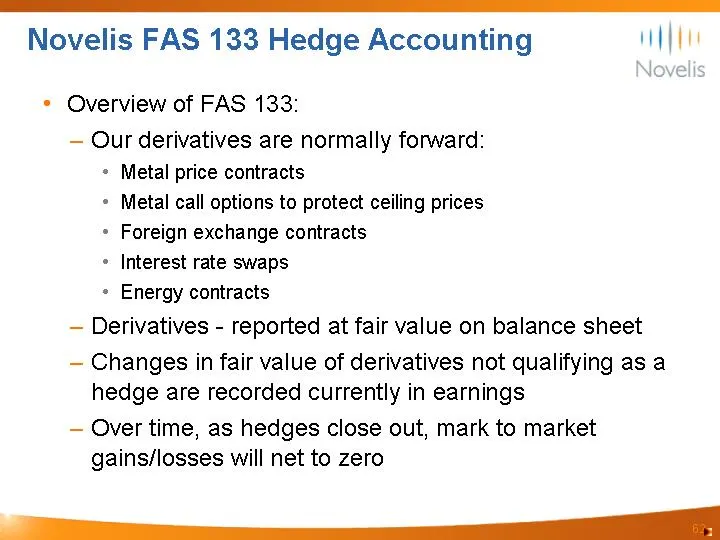
Slide 62: Novelis FAS Hedge Accounting
Novelis FAS 133 Hedge Accounting yy * Overview of FAS 133: — Our derivatives are normally forward: + Metal price contracts * Metal call options to protect ceiling prices * Foreign exchange contracts + Interest rate swaps « Energy contracts — Derivatives - reported at fair value on balance sheet — Ch
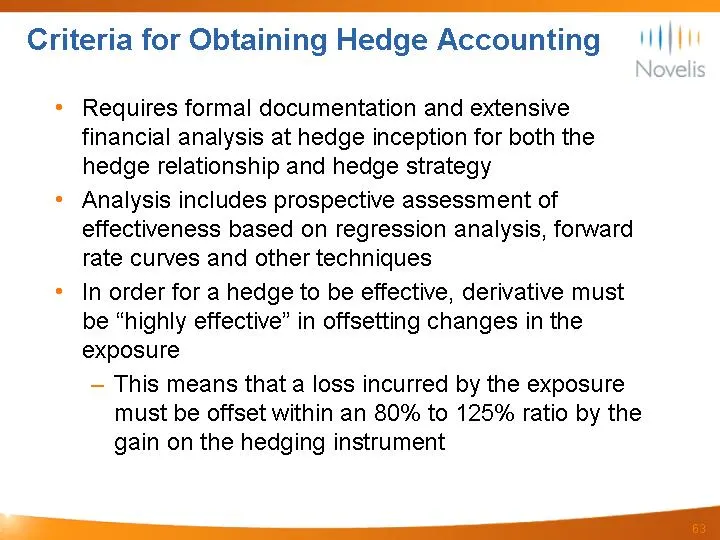
Slide 63: Criteria for Obtaining Hedge Accounting
a Criteria for Obtaining Hedge Accounting — |||//'' « Requires formal documentation and extensive financial analysis at hedge inception for both the hedge relationship and hedge strategy « Analysis includes prospective assessment of effectiveness based on regression analysis, forward rate curves and
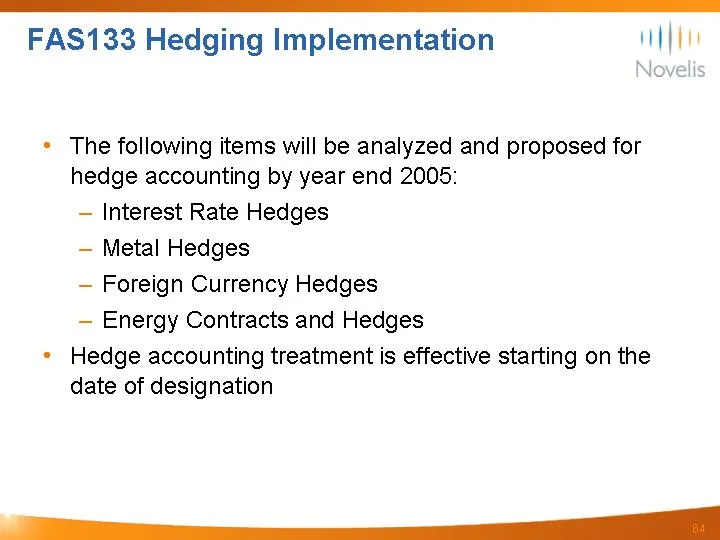
Slide 64: FAS133 Hedging Implementation
FAS133 Hedging Implementation HAY * The following items will be analyzed and proposed for hedge accounting by year end 2005: — Interest Rate Hedges — Metal Hedges — Foreign Currency Hedges — Energy Contracts and Hedges * Hedge accounting treatment is effective starting on the date of designation —_
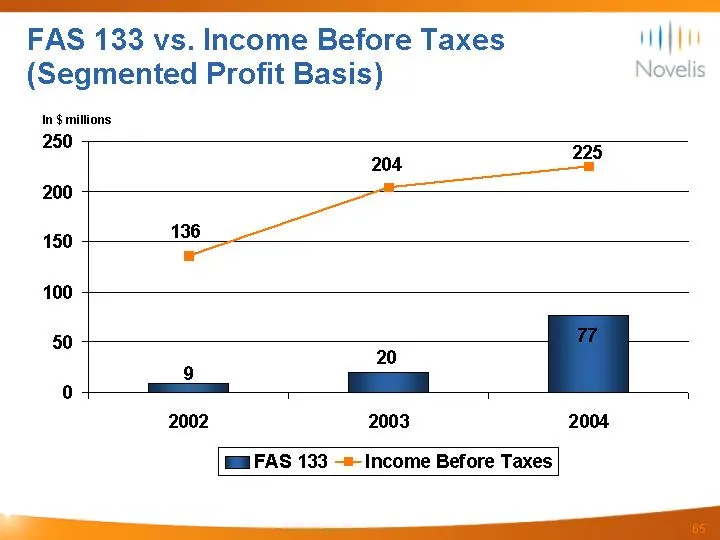
Slide 65: FAS vs. Income Before Taxes
FAS 133 vs. Income Before Taxes HAY (Segmented Profit Basis) Novelis In $ millions 250 204 5 200 450 136 100 50 , 20 0 =——s : | a | . , 2002 2003 2004 FAS 133 -=- Income Before Taxes
Slide 66: Norf and Other JV Accounting
\|| Novelis Norf and) Other JV Accounting
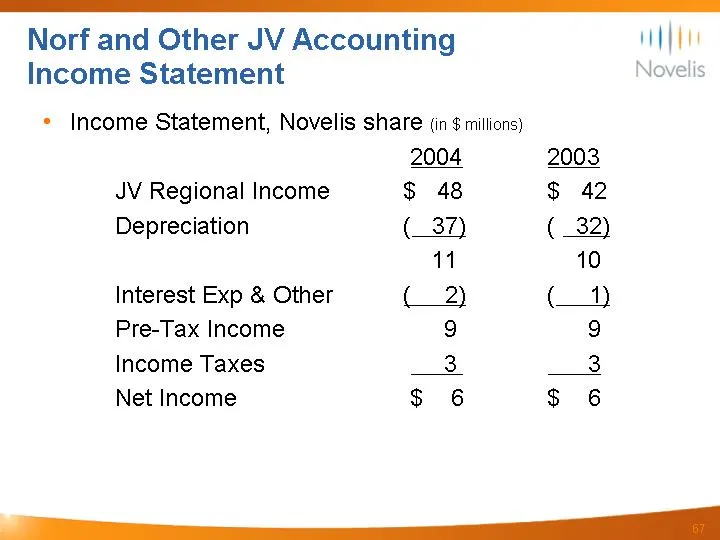
Slide 67: Norf and Other JV Accounting: Income Statement
Norf and Other JV Accounting yy Income Statement Novelis « Income Statement, Novelis share (in $ millions) 2004 2003 JV Regional Income $ 48 $ 42 Depreciation (_37) ( 32) 11 10 Interest Exp & Other (2) (__1) Pre-Tax Income 9 9 Income Taxes 3 _ 3 Net Income $ 6 $ 6
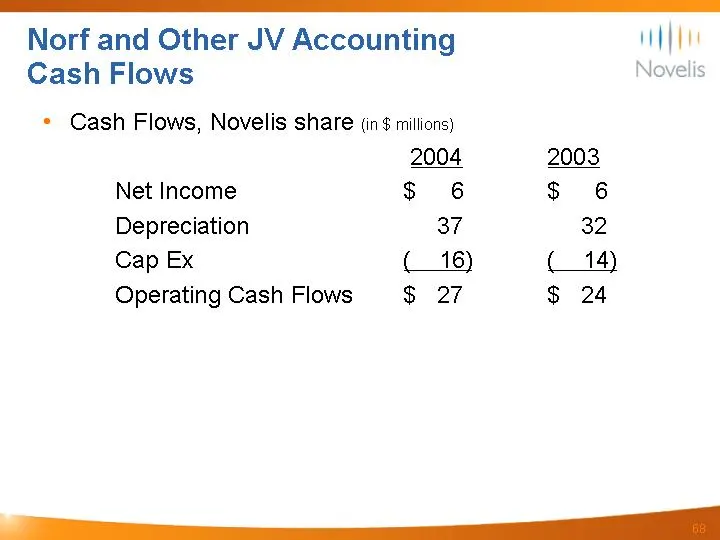
Slide 68: Norf and Other JV Accounting: Cash Flows
Norf and Other JV Accounting Cash Flows * Cash Flows, Novelis share (in $ millions) 2004 2003 Net Income $ 6 $ 6 Depreciation 37 32 Cap Ex (__16) (14) Operating Cash Flows $ 27 $ 24

Slide 69: Pass Through Metal Pricing
\|| Novelis Pass Through Metal Pricing
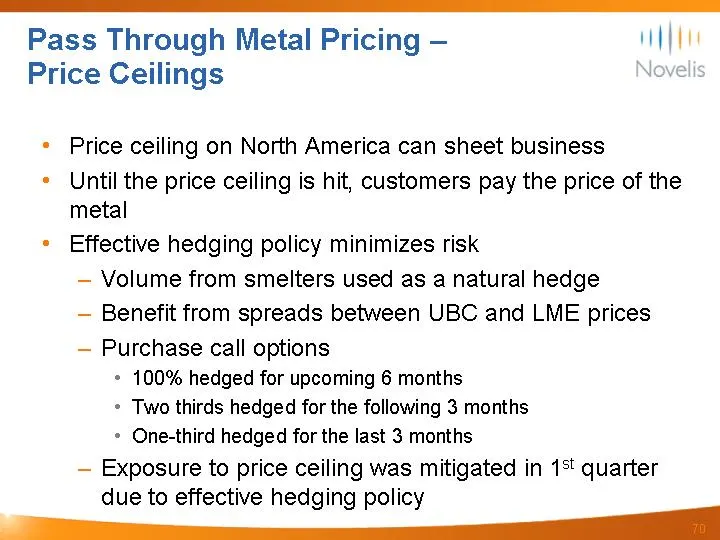
Slide 70: Pass Through Metal Pricing — Price Ceilings
Pass Through Metal Pricing — yy Price Ceilings . * Price ceiling on North America can sheet business « Until the price ceiling is hit, customers pay the price of the metal ° Effective hedging policy minimizes risk — Volume from smelters used as a natural hedge — Benefit from spreads between UBC and
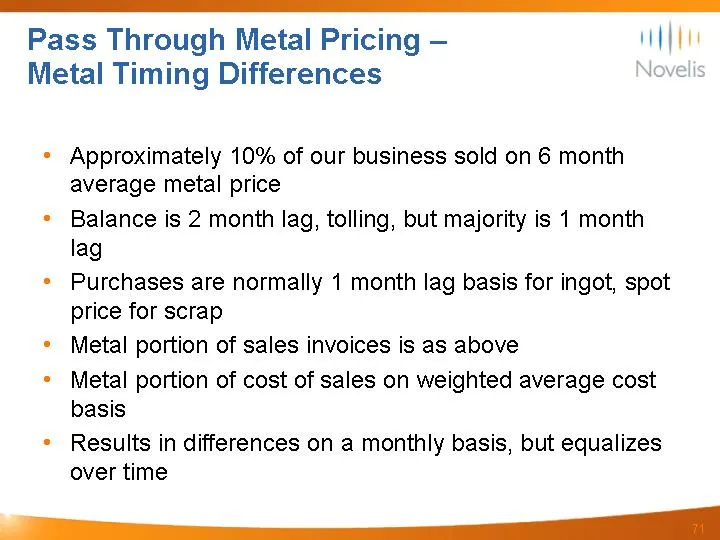
Slide 71: Pass Through Metal Pricing — Metal Timing Differences
Pass Through Metal Pricing — yp Metal Timing Differences . ° Approximately 10% of our business sold on 6 month average metal price * Balance is 2 month lag, tolling, but majority is 1 month lag * Purchases are normally 1 month lag basis for ingot, spot price for scrap * Metal portion of sales invoic
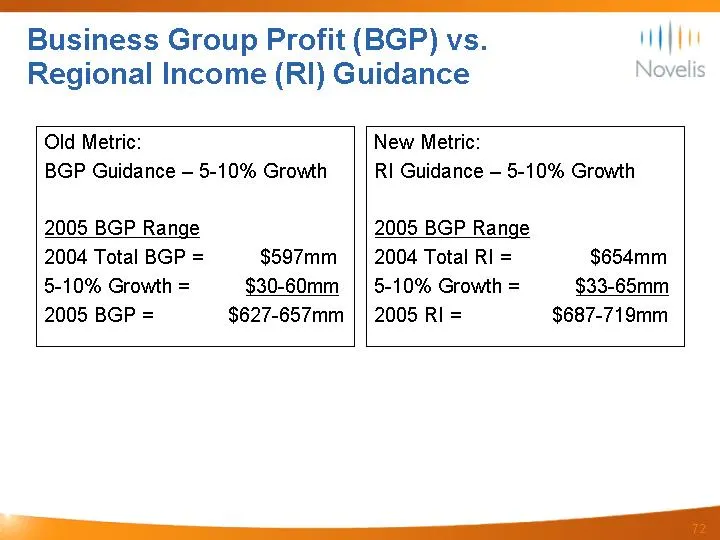
Slide 72: Business Group Profit vs. Regional Income Guidance
Business Group Profit (BGP) vs. HAY Regional Income (RI) Guidance e Old Metric: New Metric: BGP Guidance — 5-10% Growth RI Guidance - 5-10% Growth 2005 BGP Range 2005 BGP Range 2004 Total BGP = $597mm_ | | 2004 Total RI = $654mm 5-10% Growth = $30-60mm | | 5-10% Growth = $33-65mm 2005 BGP = $627-657
Slide 73: Question & Answer
ML Novelis Novelis Inc. Question & Answer oO YW
Source: SEC EDGAR · 8-K filed May 20, 2005
More decks from Novelis Inc.
 Q2 FY2027 Earnings Presentation20 slides · Nov 5, 2026
 Q2 FY2027 Earnings Presentation31 slides · Nov 5, 2026
 Q1 FY2027 Earnings Presentation21 slides · Aug 5, 2026
 Q1 FY2027 Earnings Presentation31 slides · Aug 5, 2026
 Q4 FY2026 Earnings Presentation33 slides · May 19, 2026
 Q3 FY2026 Earnings Presentation33 slides · Feb 11, 2026