Altra Industrial Motion — Q2 2016 Earnings Presentation
11 slides from Altra Industrial Motion's earnings presentation, Jul 21, 2016

Slide 1: Second Quarter 2016 Results
Second Quarter 2016 Results July 21, 2016 10:00 AM ET Dial In Number 877-407-8293 Domestic 201-689-8349 International Webcast at www.altramotion.com Replay Through August 4, 2016 877-660-6853 Domestic 201-612-7415 International Conference ID: # 13641048 Webcast Replay at www.altramotion.com
Slide 2: Safe Harbor Statement
Safe Harbor Statement Cautionary Statement Regarding Forward Looking Statements All statements, other than statements of historical fact included in this release are forward-looking statements, as that term is defined in the Private Securities Litigation Reform Act of 1995. These statements include,
Slide 3: Second Quarter 2016 Highlights
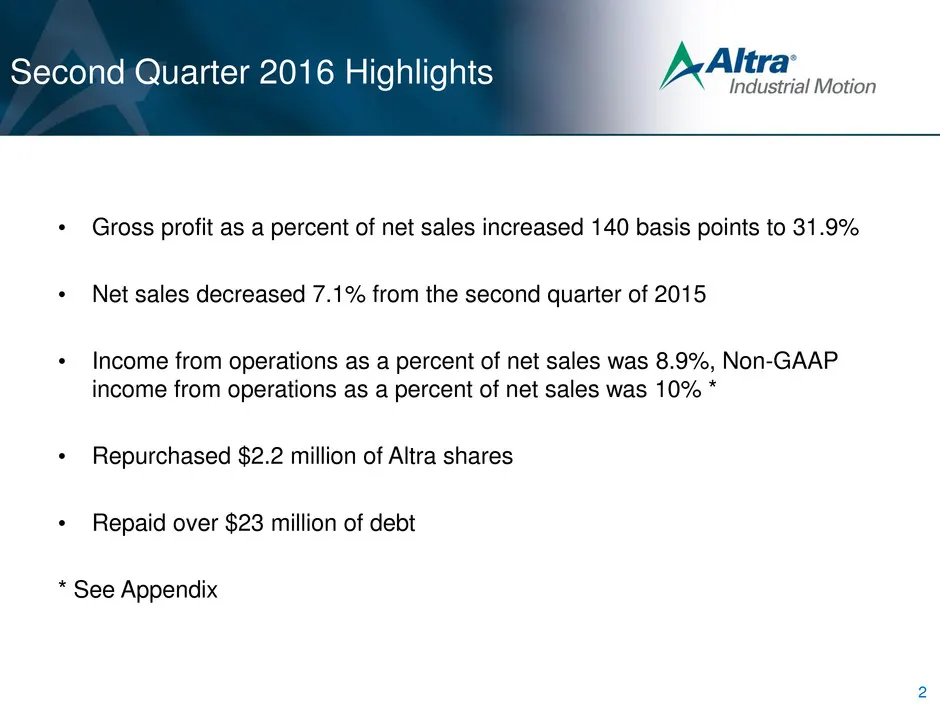
Second Quarter 2016 Highlights • Gross profit as a percent of net sales increased 140 basis points to 31.9% • Net sales decreased 7.1% from the second quarter of 2015 • Income from operations as a percent of net sales was 8.9%, Non-GAAP income from operations as a percent of net sales was 10% * • Re
Slide 4: End Market Review
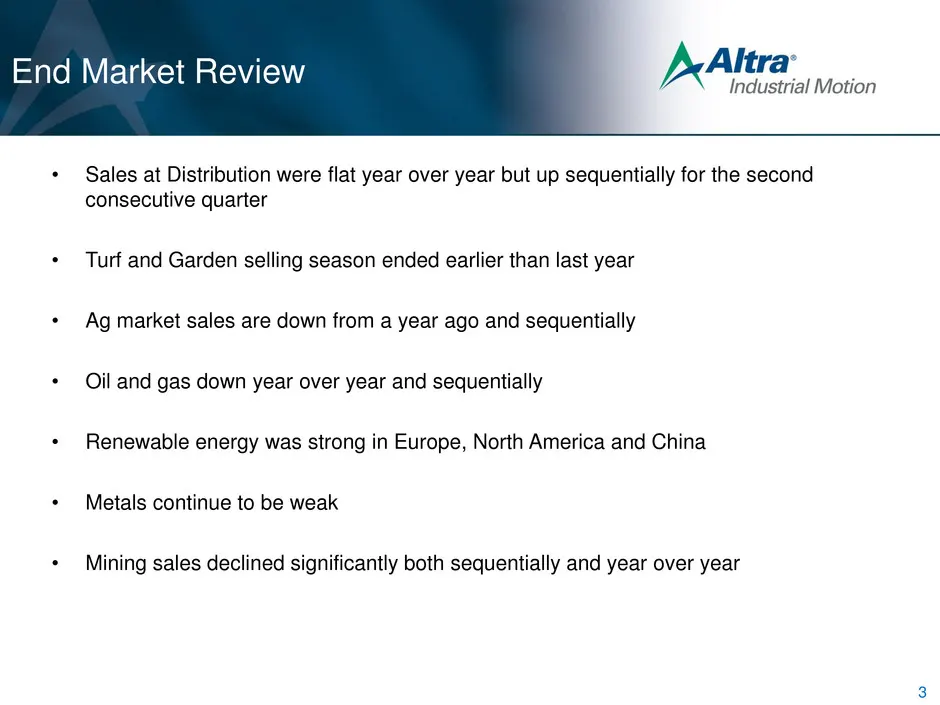
End Market Review • Sales at Distribution were flat year over year but up sequentially for the second consecutive quarter • Turf and Garden selling season ended earlier than last year • Ag market sales are down from a year ago and sequentially • Oil and gas down year over year and sequentially • Ren
Slide 5: Q2 2016 Financial Highlights
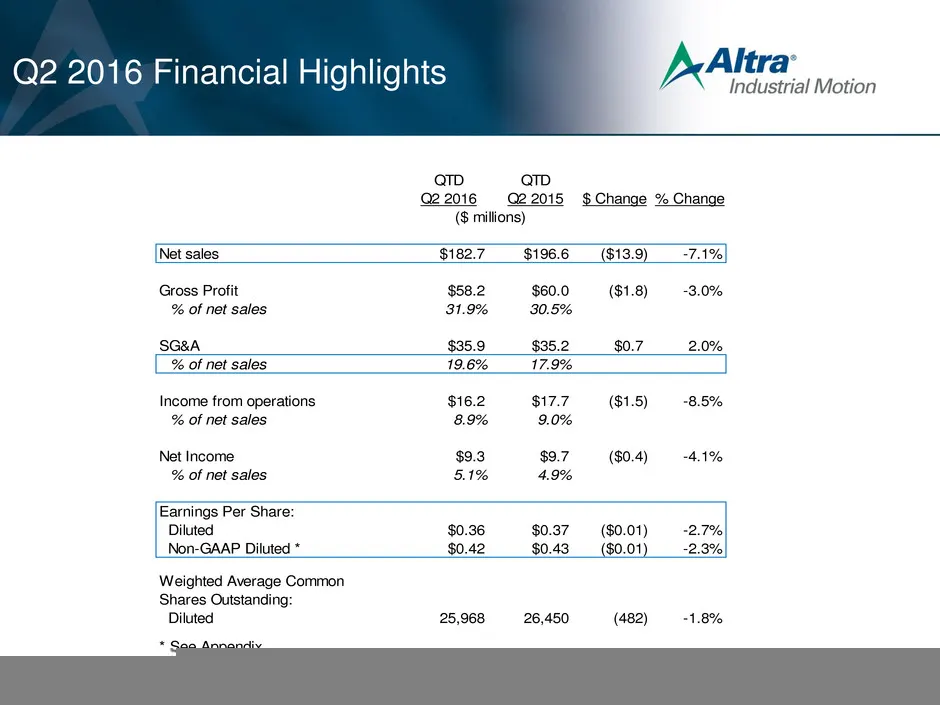
Q2 2016 Financial Highlights 4 QTD QTD Q2 2016 Q2 2015 $ Change % Change Net sales $182.7 $196.6 ($13.9) -7.1% Gross Profit $58.2 $60.0 ($1.8) -3.0% % of net sales 31.9% 30.5% SG&A $35.9 $35.2 $0.7 2.0% % of net sales 19.6% 17.9% Income from operations $16.2 $17.7 ($1.5) -8.5% % of net sales 8.9% 9.
Slide 6: Selected Segment Data
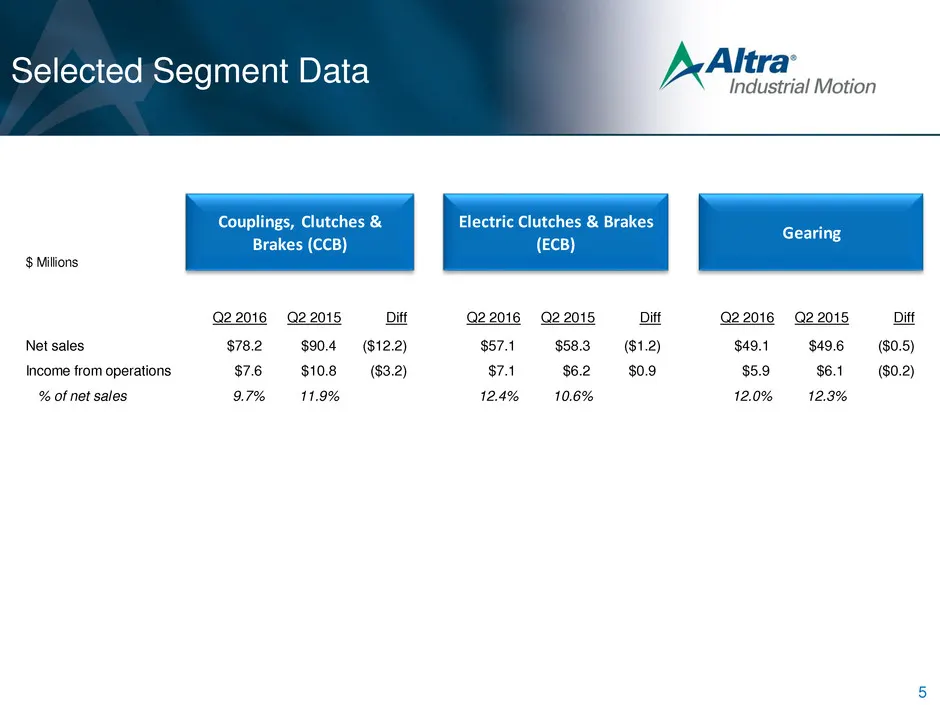
Selected Segment Data 5 Q2 2016 Q2 2015 Diff Q2 2016 Q2 2015 Diff Q2 2016 Q2 2015 Diff Net sales $78.2 $90.4 ($12.2) $57.1 $58.3 ($1.2) $49.1 $49.6 ($0.5) Income from operations $7.6 $10.8 ($3.2) $7.1 $6.2 $0.9 $5.9 $6.1 ($0.2) % of net sales 9.7% 11.9% 12.4% 10.6% 12.0% 12.3% $ Millions Couplings,
Slide 7: Balance Sheet Highlights
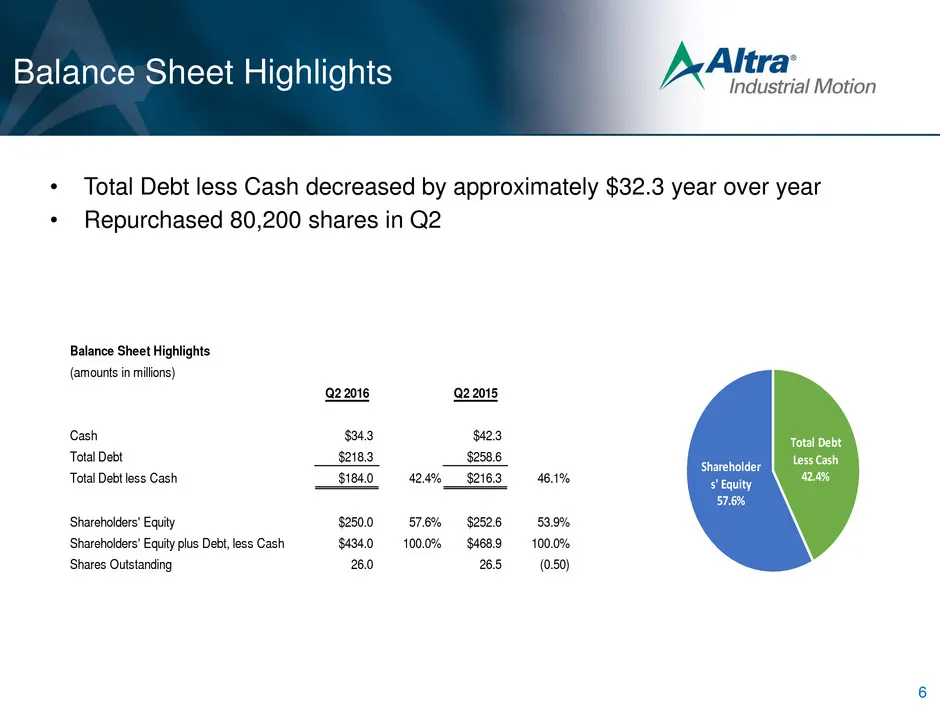
Balance Sheet Highlights • Total Debt less Cash decreased by approximately $32.3 year over year • Repurchased 80,200 shares in Q2 6 Balance Sheet Highlights (amounts in millions) Q2 2016 Q2 2015 C sh $34.3 $42.3 Total Debt $218.3 $258.6 Total Debt less Cash $184.0 42.4% $216.3 46.1% Shareholders' Eq
Slide 8: 2016 Guidance
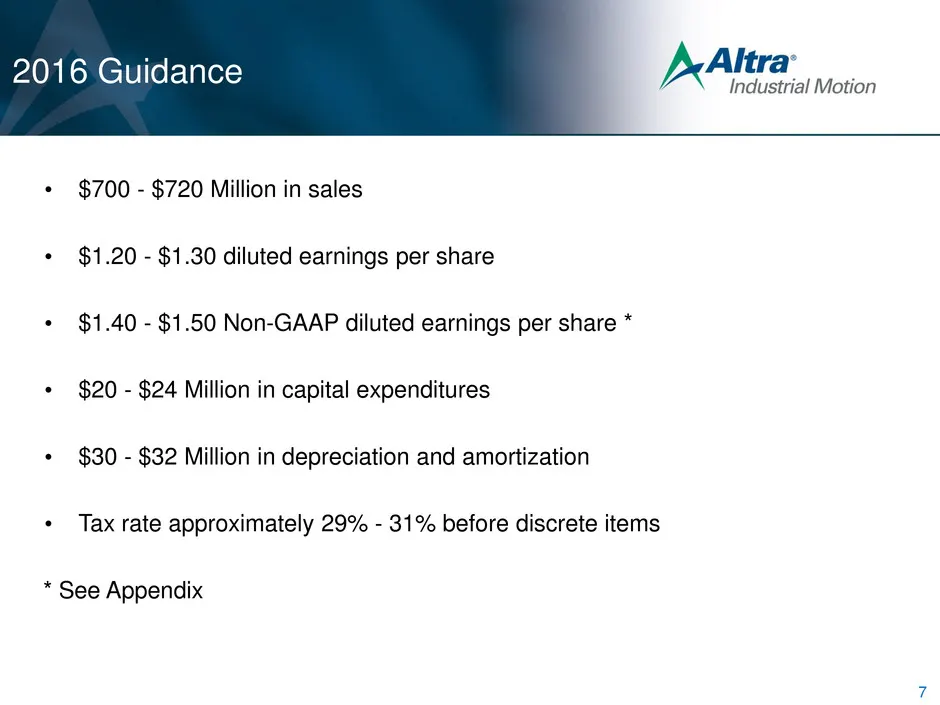
2016 Guidance • $700 - $720 Million in sales • $1.20 - $1.30 diluted earnings per share • $1.40 - $1.50 Non-GAAP diluted earnings per share * • $20 - $24 Million in capital expenditures • $30 - $32 Million in depreciation and amortization • Tax rate approximately 29% - 31% before discrete items * Se
Slide 9: Business Simplification On Track
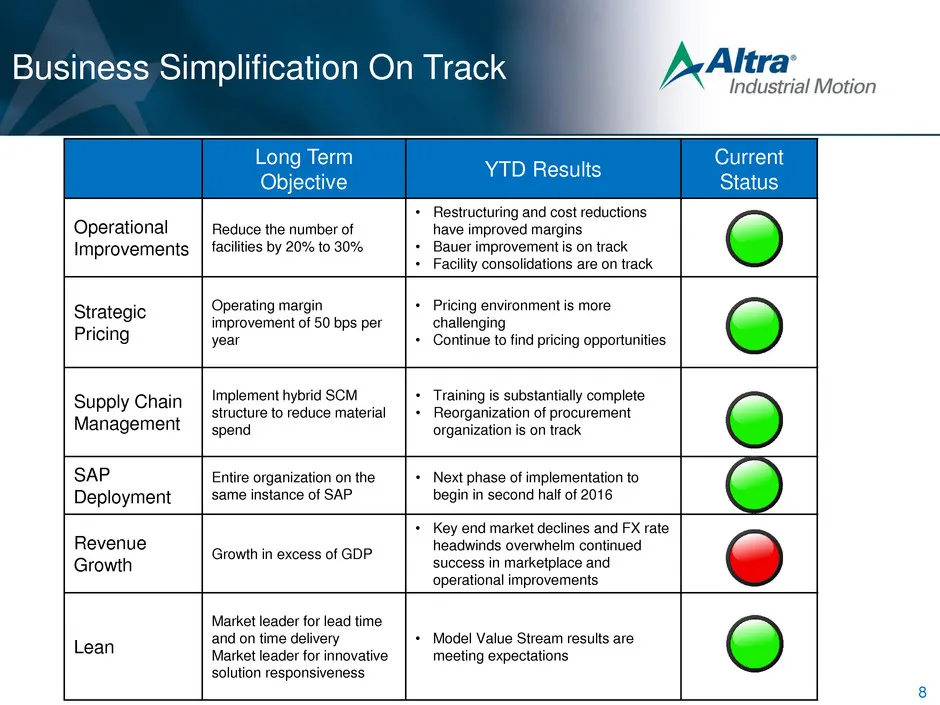
Business Simplification On Track 8 Long Term Objective YTD Results Current Status Operational Improvements Reduce the number of facilities by 20% to 30% • Restructuring and cost reductions have improved margins • Bauer improvement is on track • Facility consolidations are on track Strategic Pricing
Slide 10: Discussion of Non-GAAP Measures
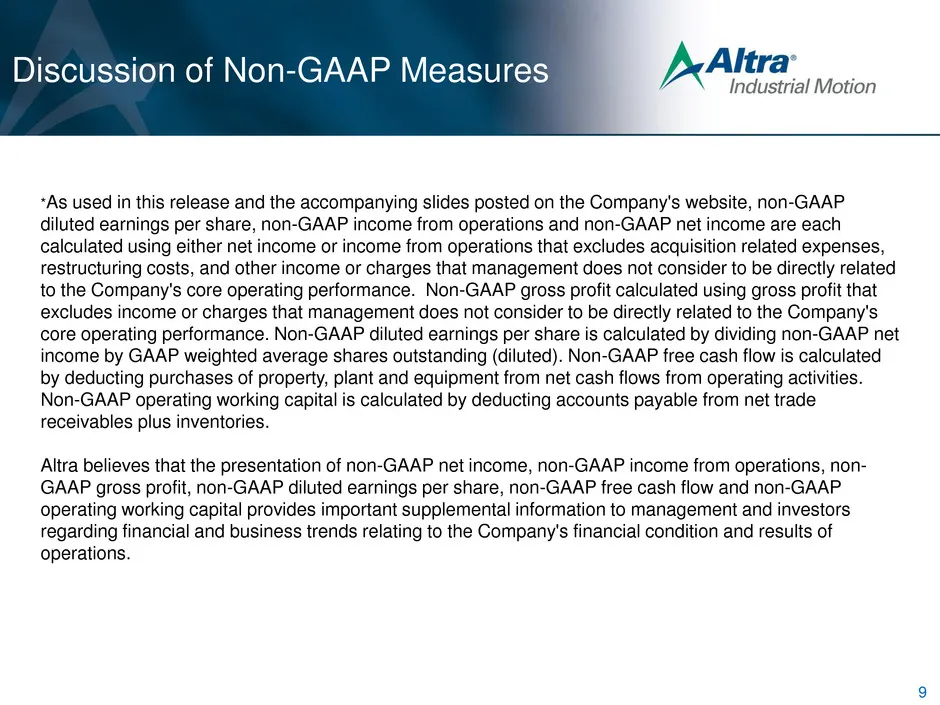
Discussion of Non-GAAP Measures *As used in this release and the accompanying slides posted on the Company's website, non-GAAP diluted earnings per share, non-GAAP income from operations and non-GAAP net income are each calculated using either net income or income from operations that excludes acqui
Slide 11: Appendix Non-GAAP Measures
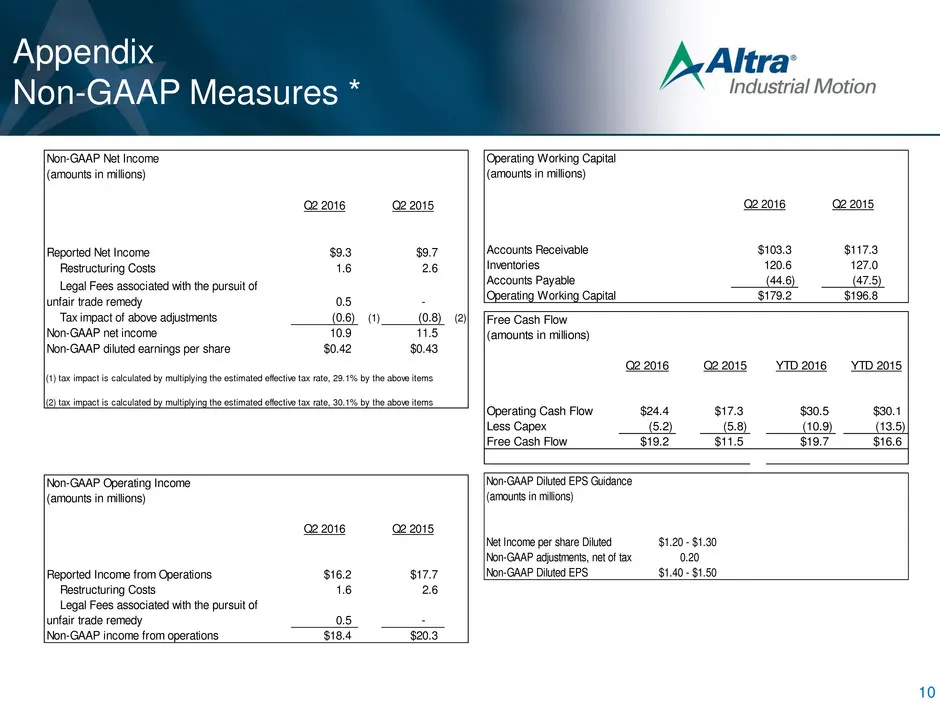
Appendix Non-GAAP Measures * 10 Non-GAAP Net Income (amounts in millions) Q2 2016 Q2 2015 Reported Net Income $9.3 $9.7 Restructuring Costs 1.6 2.6 Legal Fees associated with the pursuit of unfair trade remedy 0.5 - Tax impact of above adjustments (0.6) (1) (0.8) (2) Non-GAAP net income 10.9 11.5 No
Source: SEC EDGAR · 8-K filed Jul 21, 2016
More decks from Altra Industrial Motion Corp
 Q2 2022 Earnings Presentation25 slides · Jul 28, 2022
 Q1 2022 Earnings Presentation25 slides · Apr 28, 2022
 Investor Day (March 2022)135 slides · Mar 11, 2022
 Q4 2021 Earnings Presentation17 slides · Feb 16, 2022
 Q3 2021 Earnings Presentation16 slides · Oct 22, 2021
 Q2 2021 Earnings Presentation16 slides · Jul 23, 2021