Altra Industrial Motion — Q3 2017 Earnings Presentation
12 slides from Altra Industrial Motion's earnings presentation, Oct 20, 2017

Slide 1: Third Quarter 2017 Results
Third Quarter 2017 Results October 20, 2017 10:00 AM ET Dial In Number 877-407-8293 Domestic 201-689-8349 International Webcast at www.altramotion.com Replay Through November 3, 2017 877-660-6853 Domestic 201-612-7415 International Conference ID: # 13672230 Webcast Replay at www.altramotion.com Exhi
Slide 2: Safe Harbor Statement
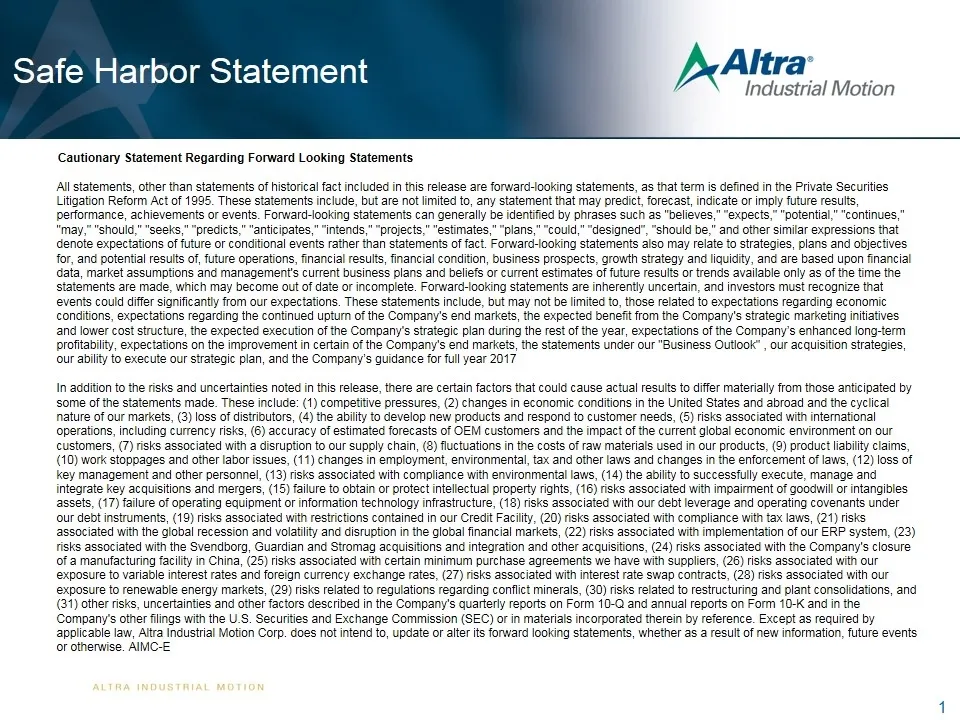
Safe Harbor Statement Cautionary Statement Regarding Forward Looking Statements All statements, other than statements of historical fact included in this release are forward-looking statements, as that term is defined in the Private Securities Litigation Reform Act of 1995. These statements include,
Slide 3: Third Quarter 2017 Highlights
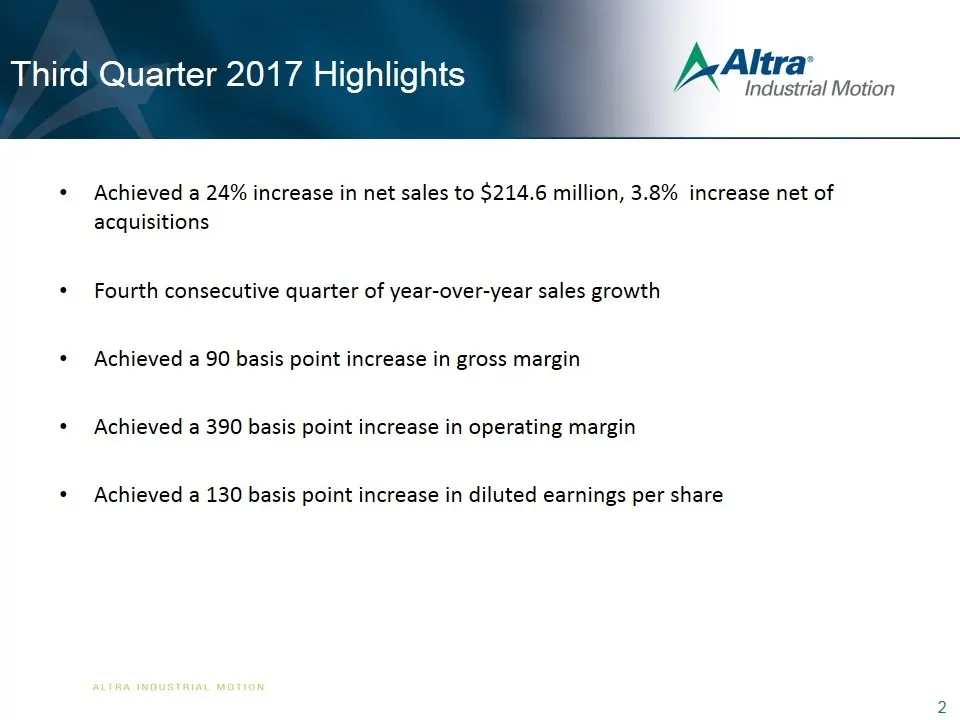
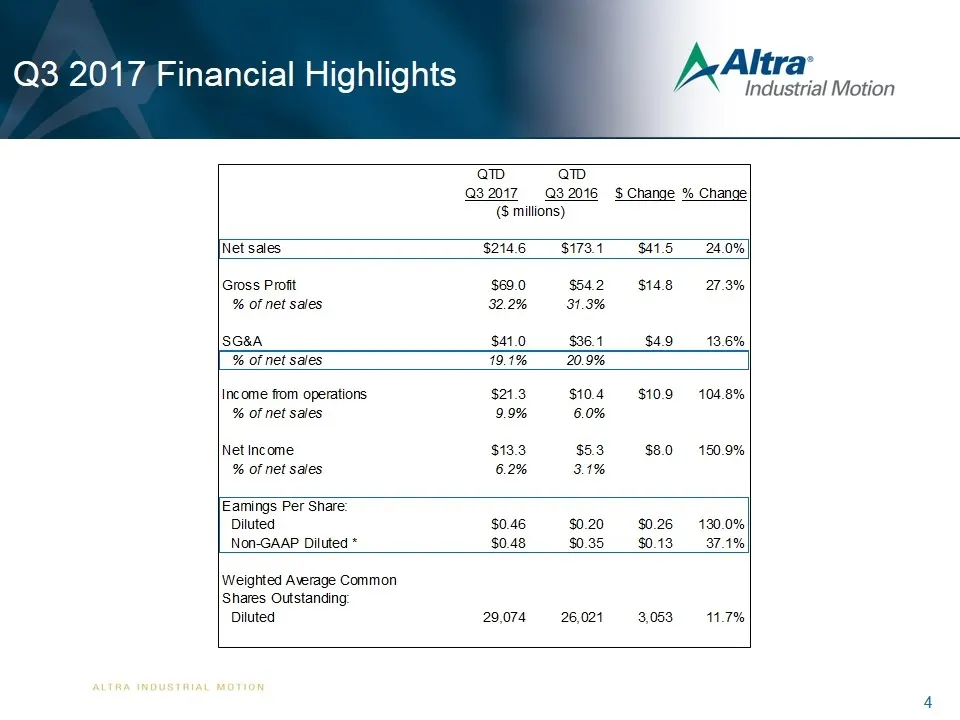
Third Quarter 2017 Highlights Achieved a 24% increase in net sales to $214.6 million, 3.8% increase net of acquisitions Fourth consecutive quarter of year-over-year sales growth Achieved a 90 basis point increase in gross margin Achieved a 390 basis point increase in operating margin Achieved a 130
Slide 4: End Market Review
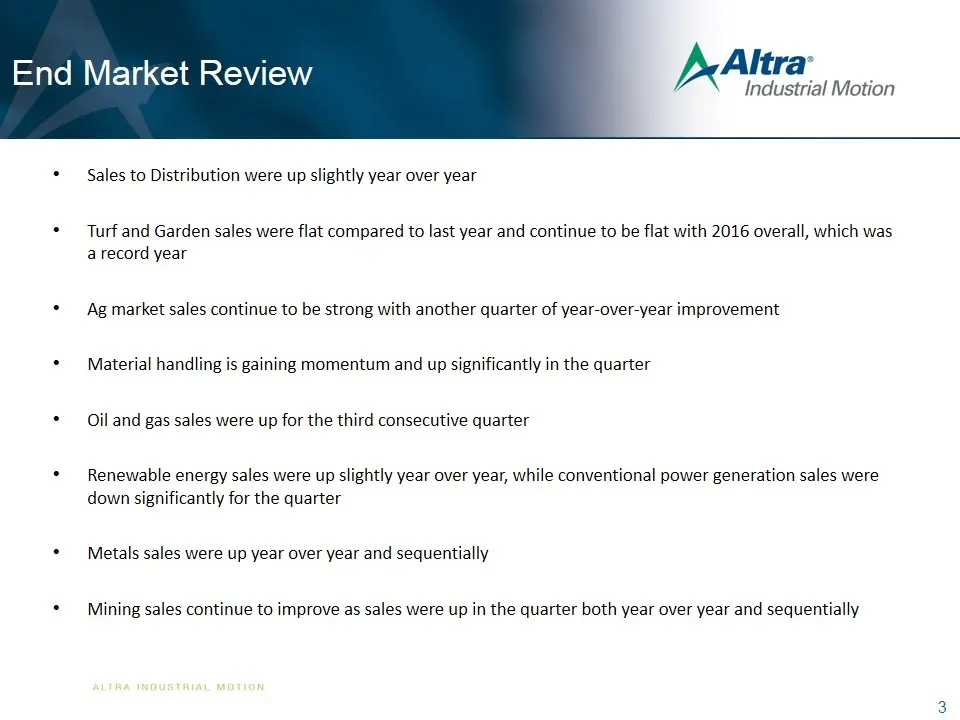
End Market Review Sales to Distribution were up slightly year over year Turf and Garden sales were flat compared to last year and continue to be flat with 2016 overall, which was a record year Ag market sales continue to be strong with another quarter of year-over-year improvement Material handling
Slide 5: Q3 2017 Financial Highlights
Q3 2017 Financial Highlights 4 Net Income (amounts in millions) Q1 2017 Q1 2016 Reported Net Income $10.3 $8.8 Restructuring and consolidation costs 1.9 1.6 Loss on extinguishment of convertible debt 1.8 - Amortization of inventory fair value adjustment 2.3 - Acquisition related expenses 1.0 - Tax i
Slide 6: Selected Segment Data
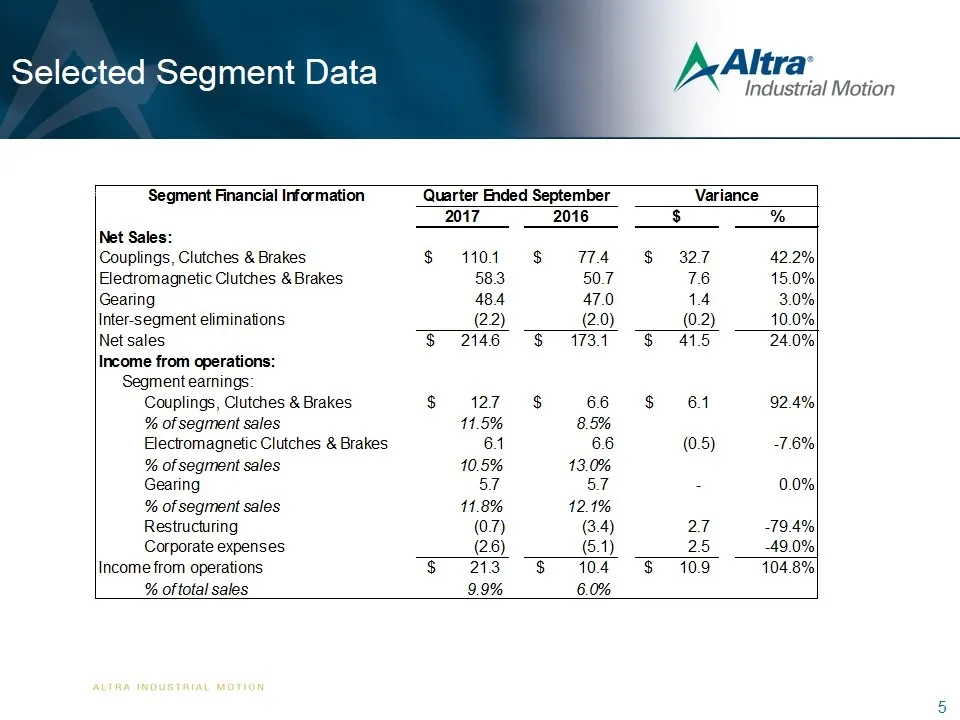
Selected Segment Data 5 Segment Financial Information Quarter Ended March 31, Variance 2017 2016 $ % Net Sales: Couplings , Clutches & Brakes $ 106.2 $ 75.6 $ 30.6 40.5% Electromagnetic Clutches & Brakes 63.9 57.3 6.5 11.4% Gearing 47.0 48.9 (1.9) -3.9% Inter-segment eliminations (1.7) (1.4) (0.3) 1
Slide 7: Balance Sheet Highlights
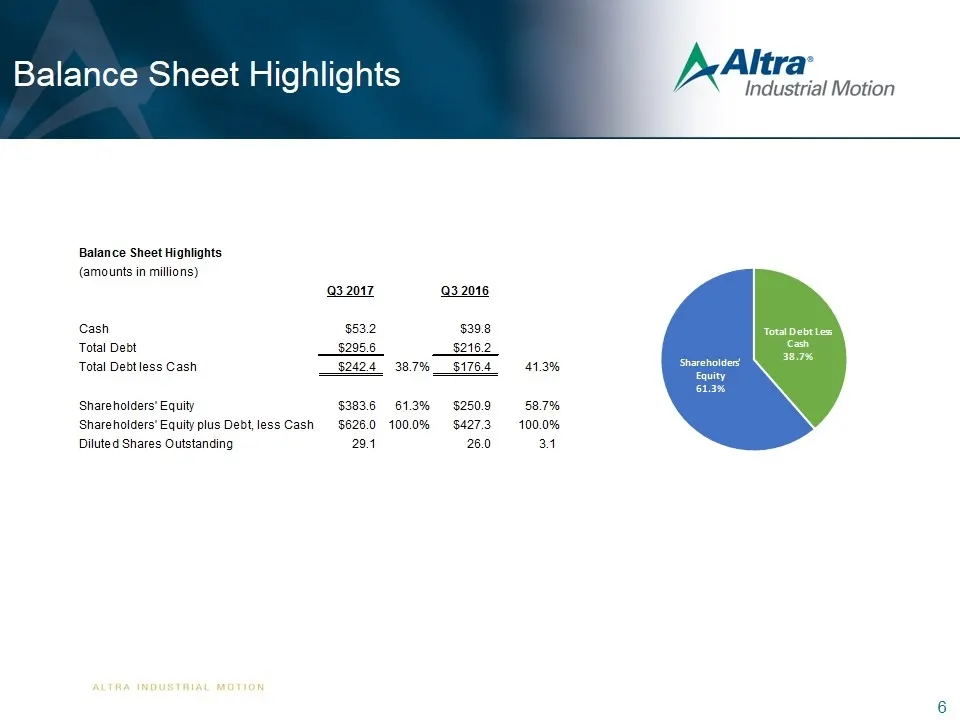
Balance Sheet Highlights 6 Balance Sheet Highlights (amounts in millions) Q3 2017 Q3 2016 Cash $53.2 $39.8 Total Debt $295.6 $216.2 Total Debtless Cash $242.4 38.7% $176.4 41.3% Shareholders’ Equity $383.6 61.3% $250.9 58.7% Shareholders’ Equity plus Debt, less Cash $626.0 100.0% $427.3 100.0% Dilut
Slide 8: 2017 Guidance
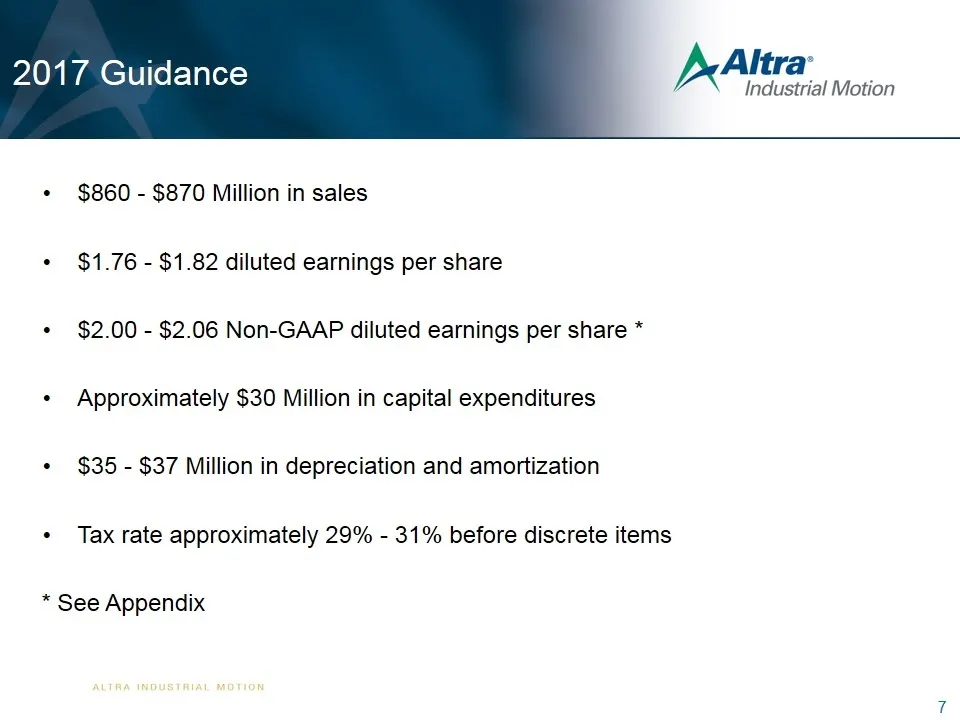
2017 Guidance $860 - $870 Million in sales $1.76 - $1.82 diluted earnings per share $2.00 - $2.06 Non-GAAP diluted earnings per share * Approximately $30 Million in capital expenditures $35 - $37 Million in depreciation and amortization Tax rate approximately 29% - 31% before discrete items * See Ap
Slide 9: Summary
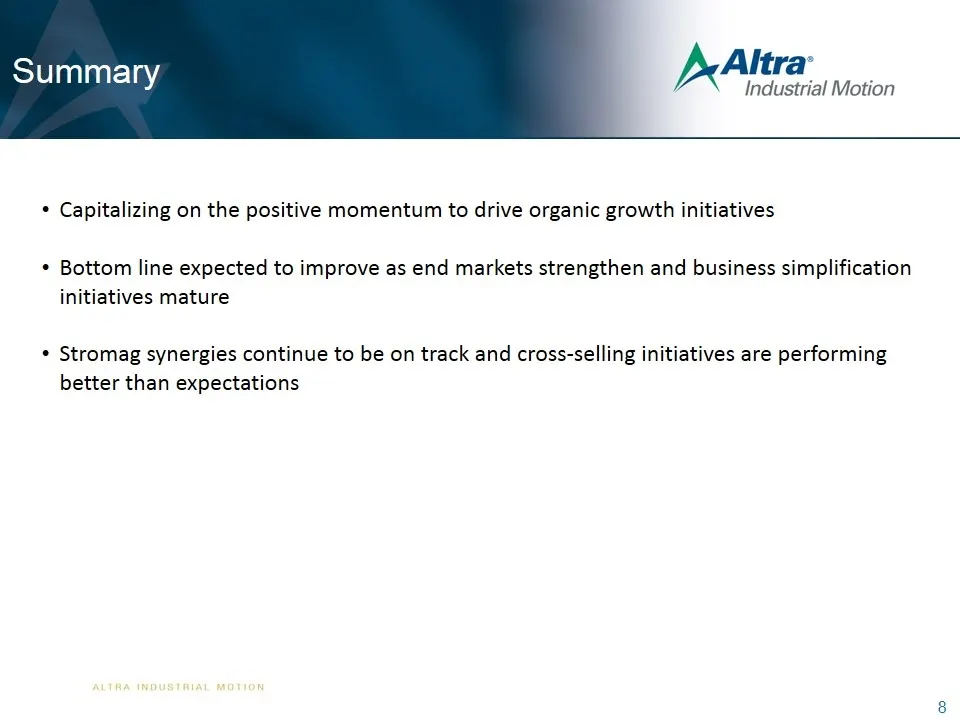
Summary Capitalizing on the positive momentum to drive organic growth initiatives Bottom line expected to improve as end markets strengthen and business simplification initiatives mature Stromag synergies continue to be on track and cross-selling initiatives are performing better than expectations 8
Slide 10: Discussion of Non-GAAP Measures
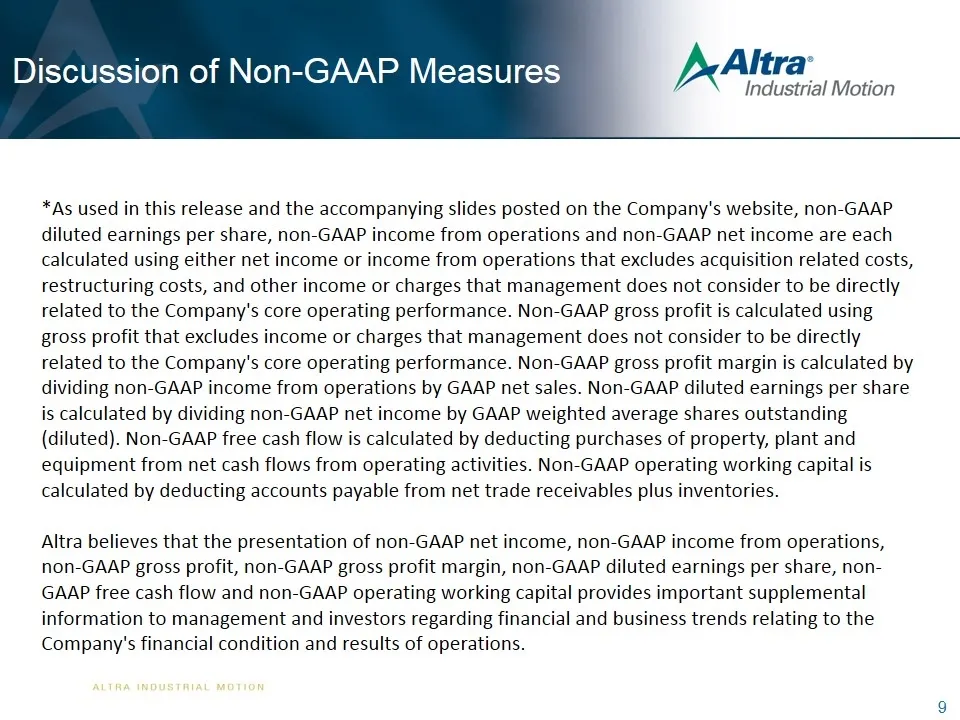
Discussion of Non-GAAP Measures *As used in this release and the accompanying slides posted on the Company's website, non-GAAP diluted earnings per share, non-GAAP income from operations and non-GAAP net income are each calculated using either net income or income from operations that excludes acqui
Slide 11: Appendix Non-GAAP Measures
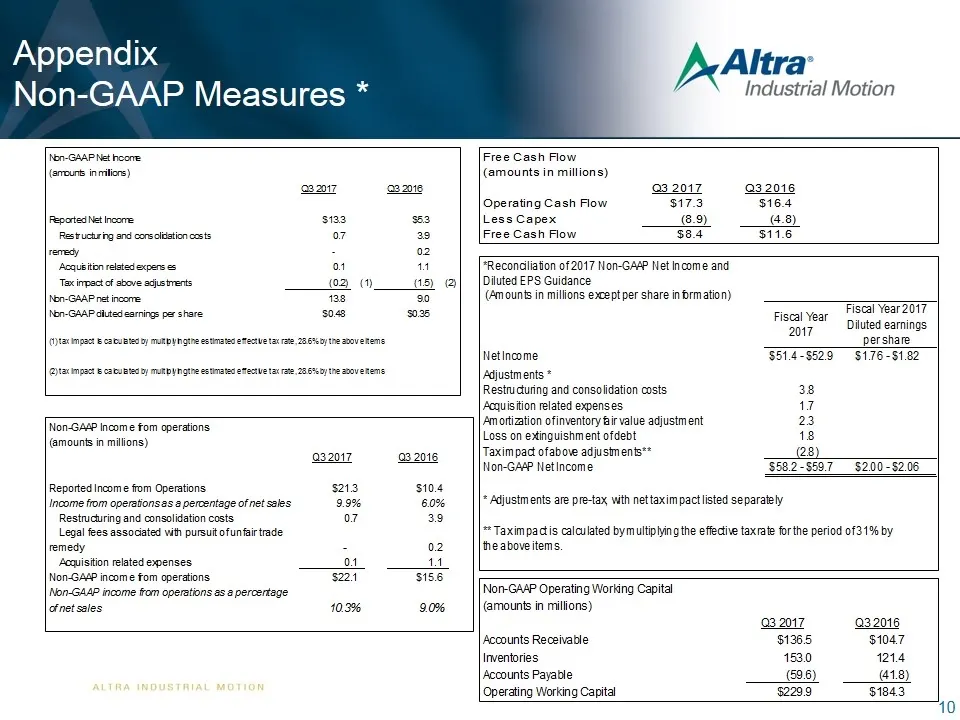
Appendix Non-GAAP Measures * 10 Non-GAAP Net Income (amounts in millions) Q1 2017 Q1 2016 Reported Net Income $10.3 $8.8 Restructuring and consolidation costs 1.9 1.6 Loss on extinguishment of convertible debt 1.8 - Amortization of inventory fair value adjustment 2.3 - Acquisition related expenses 1
Slide 12: Appendix Non-GAAP EBITDA Reconciliation
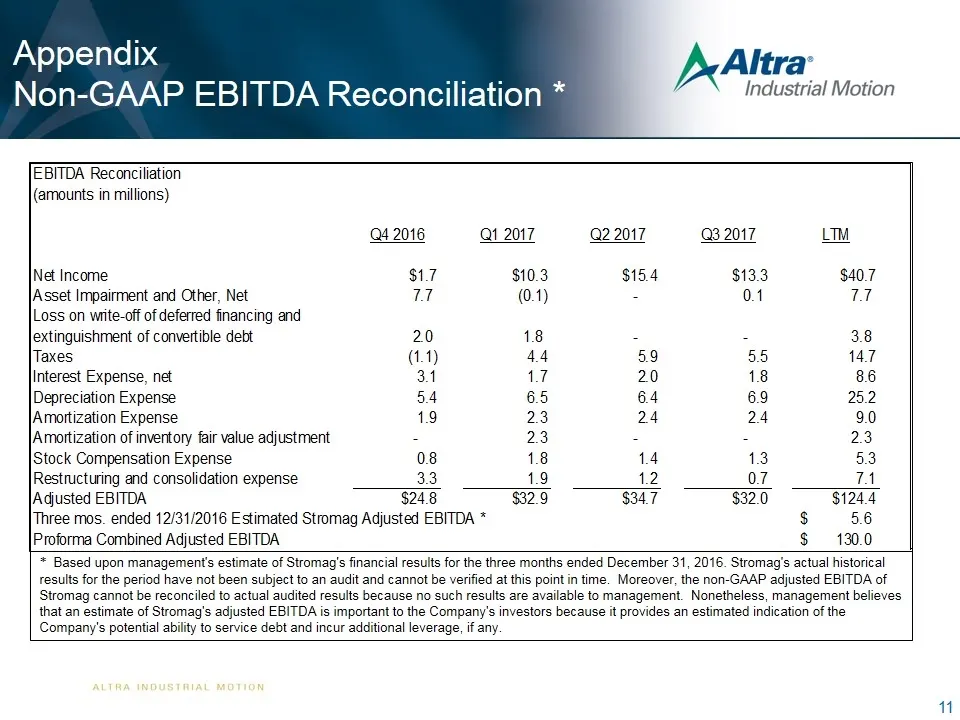
Appendix Non-GAAP EBITDA Reconciliation * 11 * Based upon management's estimate of Stromag's financial results for the three months ended December 31, 2016. Stromag's actual historical results for the period have not been subject to an audit and cannot be verified at this point in time. Moreover, th
Source: SEC EDGAR · 8-K filed Oct 20, 2017
More decks from Altra Industrial Motion Corp
 Q2 2022 Earnings Presentation25 slides · Jul 28, 2022
 Q1 2022 Earnings Presentation25 slides · Apr 28, 2022
 Investor Day (March 2022)135 slides · Mar 11, 2022
 Q4 2021 Earnings Presentation17 slides · Feb 16, 2022
 Q3 2021 Earnings Presentation16 slides · Oct 22, 2021
 Q2 2021 Earnings Presentation16 slides · Jul 23, 2021