State Bank Financial Corporation
State Bank Financial — 2013 Gulf South Bank Conference
21 slides from State Bank Financial's conference presentation, May 13, 2013
Slide 1: State Bank Financial Corporation 2013 Gulf South Bank Conference
State Bank Financial Corporation 2013 Gulf South Bank Conference Tom Wiley - Vice Chairman and President Tom Callicutt - Executive Vice President and CFO May 13, 2013
Slide 2: Cautionary Note Regarding Forward-Looking Statements
2 Cautionary Note Regarding Forward-Looking Statements Certain statements contained in this earnings deck that are not statements of historical fact may constitute forward-looking statements. These forward-looking statements, which are based on certain assumptions and describe our future plans, stra
Slide 3: Contents
3 State Bank Financial Corporation Profile……………………………………………….…………………………………………………..……. 1Q 2013 Results ………………………………………………....................................…………………………………………………….…….. Company Characteristics..….……………………………………………………………………………………………………………………………. Strategic Priorities…………………………………………………………
Slide 4: State Bank Financial Corporation Profile
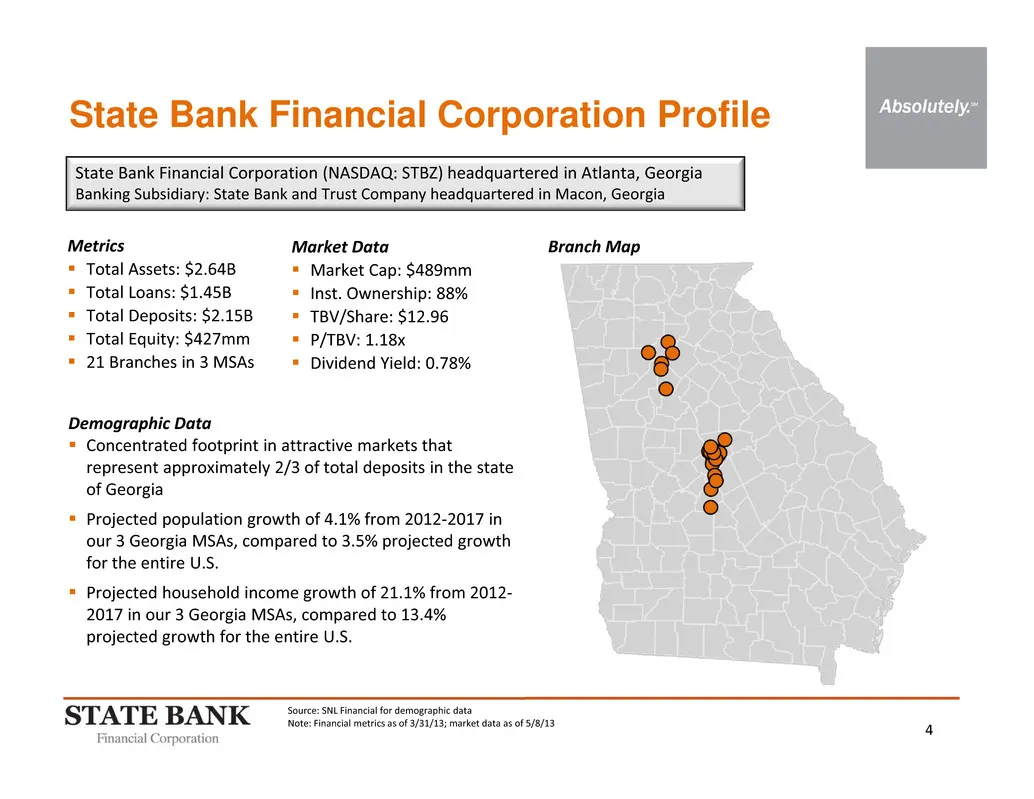
4 State Bank Financial Corporation (NASDAQ: STBZ) headquartered in Atlanta, Georgia Banking Subsidiary: State Bank and Trust Company headquartered in Macon, Georgia State Bank Financial Corporation Profile Market Data Market Cap: $489mm Inst. Ownership: 88% TBV/Share: $12.96 P/TBV: 1.18x D
Slide 5: 1Q 2013 Results
Absolutely. 1Q 2013 Results STATE BANK Financial Corporation
Slide 6: 1Q 2013 Results Summary
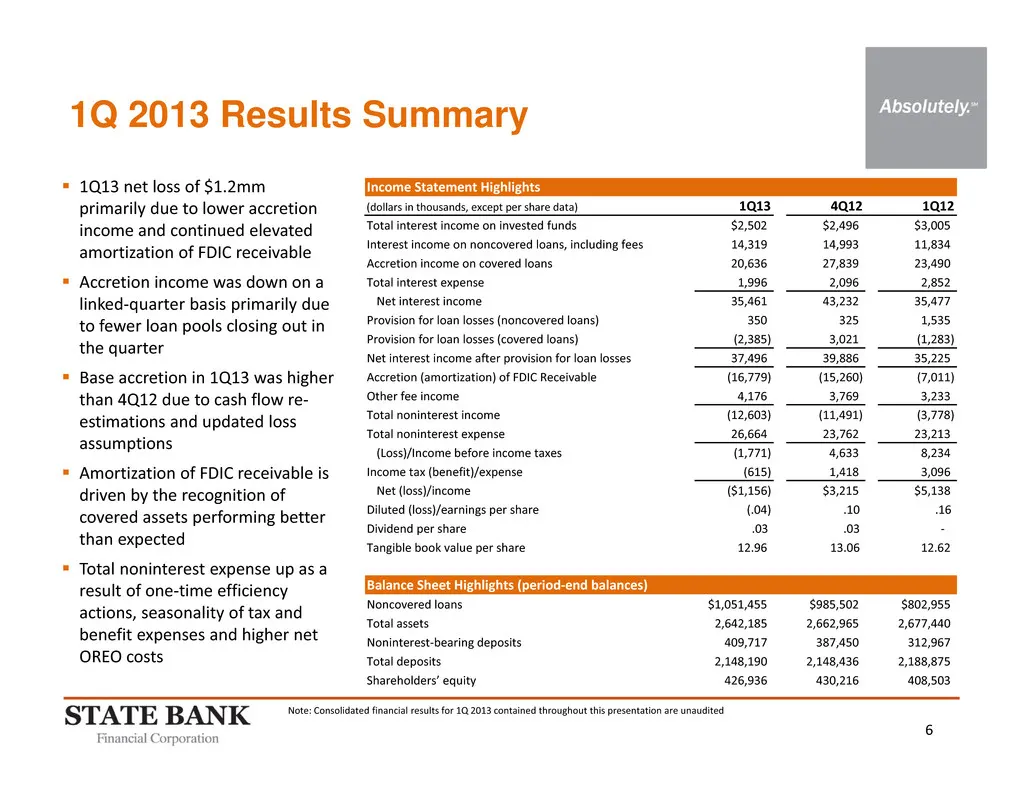
6 1Q 2013 Results Summary Note: Consolidated financial results for 1Q 2013 contained throughout this presentation are unaudited 1Q13 net loss of $1.2mm primarily due to lower accretion income and continued elevated amortization of FDIC receivable Accretion income was down on a linked‐quarter bas
Slide 7: Revised Accounting for Loss Share Assets
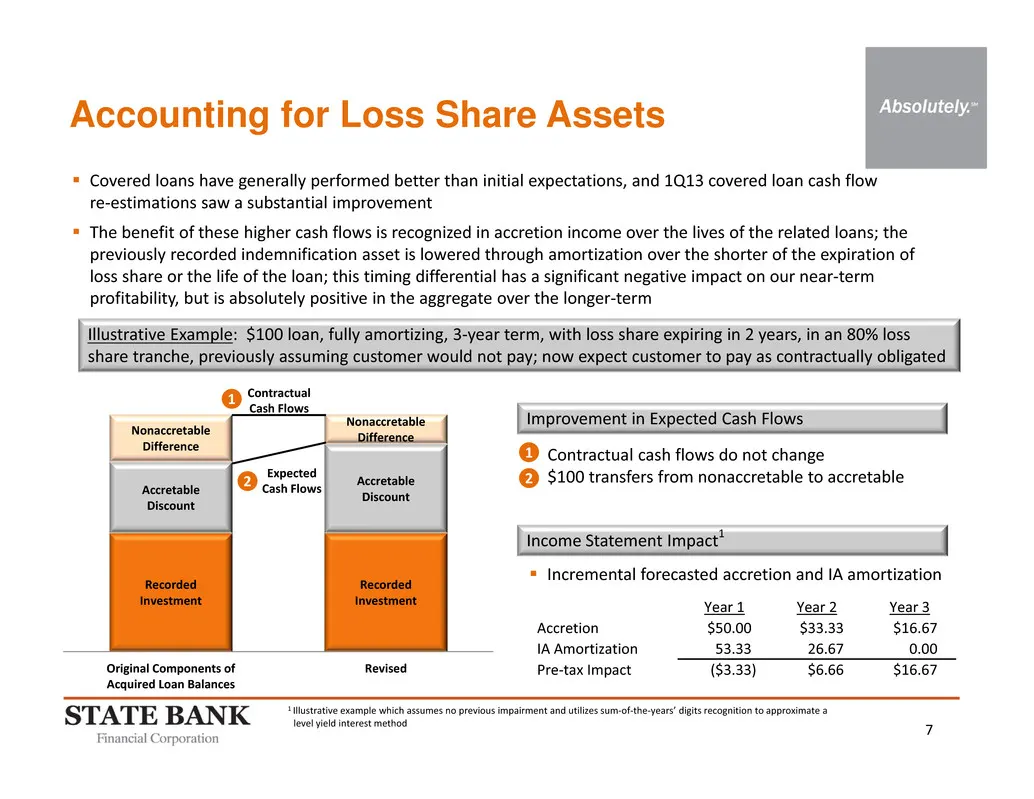
7 Contractual Cash Flows Recorded Investment Recorded Investment Accretable Discount Accretable Discount Nonaccretable Difference Nonaccretable Difference Original Components of Acquired Loan Balances Revised Accounting for Loss Share Assets Covered loans have generally performed better than initi
Slide 8: Timing of Recognition Obscured Fundamentally Positive Trends
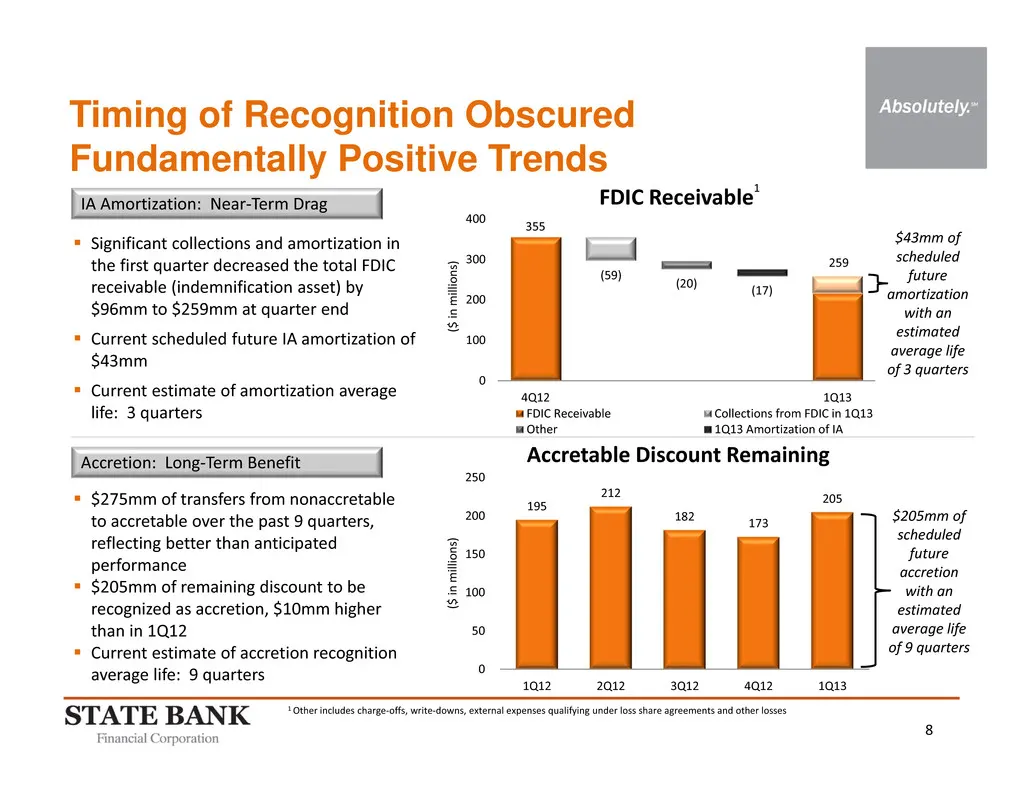
8 355 (59) (20) (17) 259 0 100 200 300 400 4Q12 1Q13 FDIC Receivable1 FDIC Receivable Collections from FDIC in 1Q13 Other 1Q13 Amortization of IA Timing of Recognition Obscured Fundamentally Positive Trends ( $ i n m i l l i o n s ) Significant collections and amortization in the first quarter dec
Slide 9: Company Characteristics
Absolutely.” Company Characteristics STATE BANK Financial Corporation
Slide 10: Well Positioned Franchise
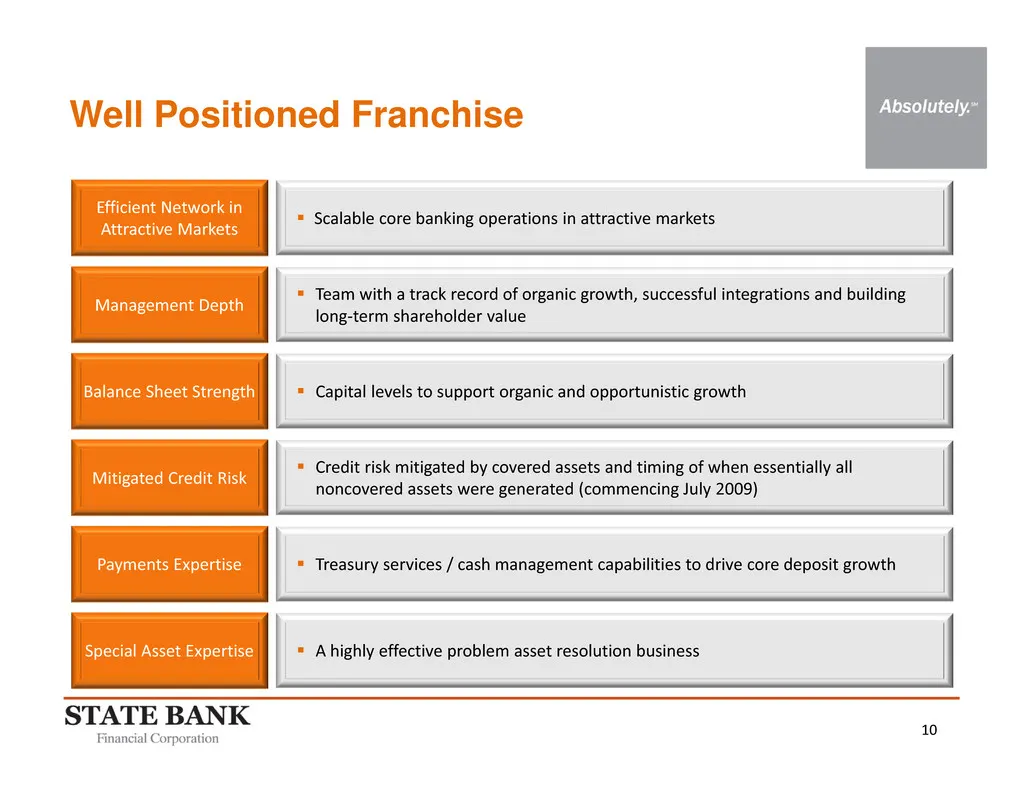
10 Well Positioned Franchise Efficient Network in Attractive Markets Special Asset Expertise Mitigated Credit Risk Balance Sheet Strength Management Depth Scalable core banking operations in attractive markets A highly effective problem asset resolution business Capital levels to support organ
Slide 11: Efficient Network in Attractive Markets
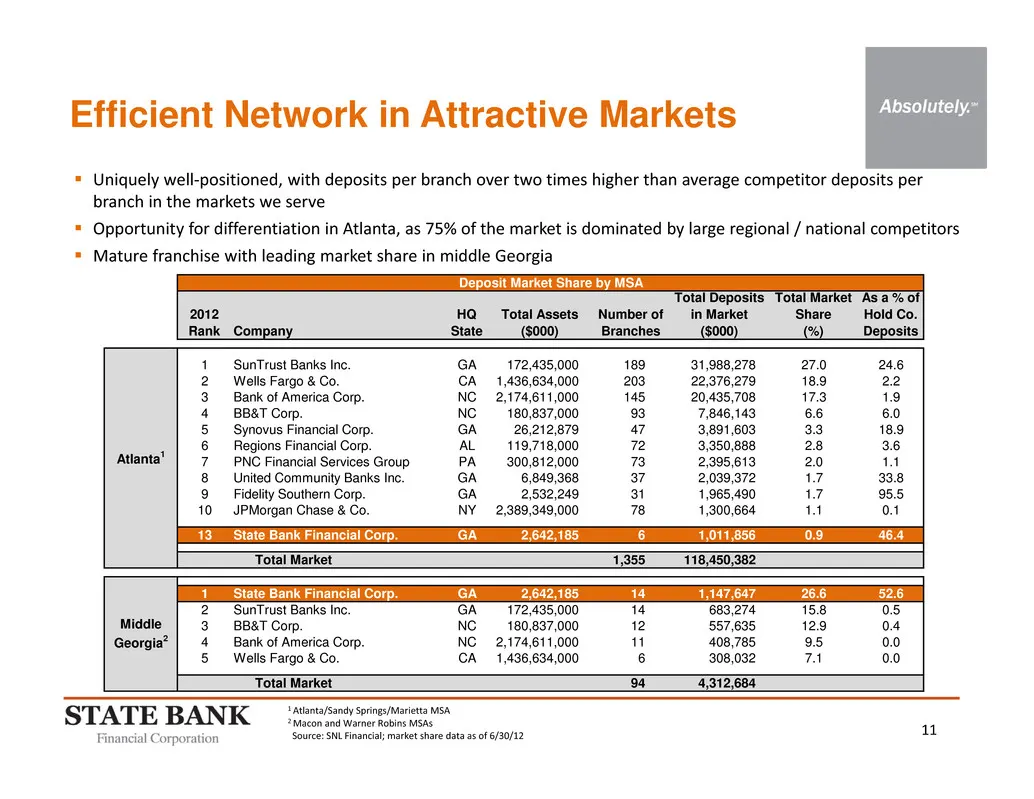
11 Efficient Network in Attractive Markets Uniquely well‐positioned, with deposits per branch over two times higher than average competitor deposits per branch in the markets we serve Opportunity for differentiation in Atlanta, as 75% of the market is dominated by large regional / national compe
Slide 12: Management Depth
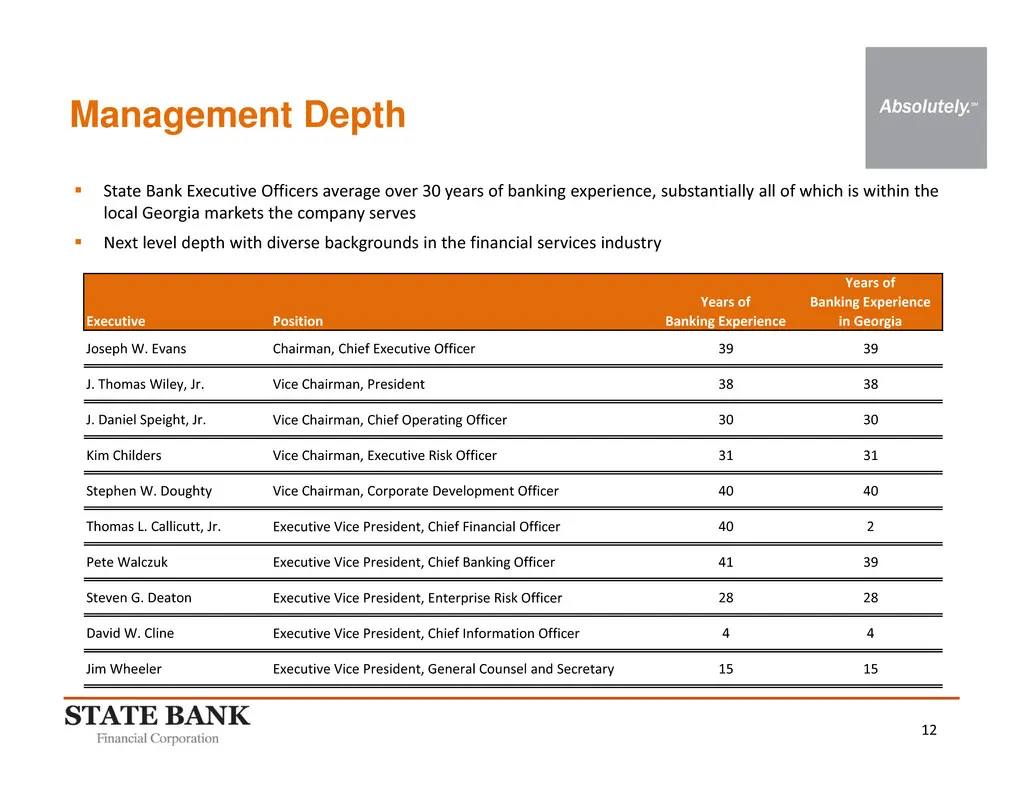
12 Management Depth State Bank Executive Officers average over 30 years of banking experience, substantially all of which is within the local Georgia markets the company serves Next level depth with diverse backgrounds in the financial services industry Executive Position Years of Banking Experi
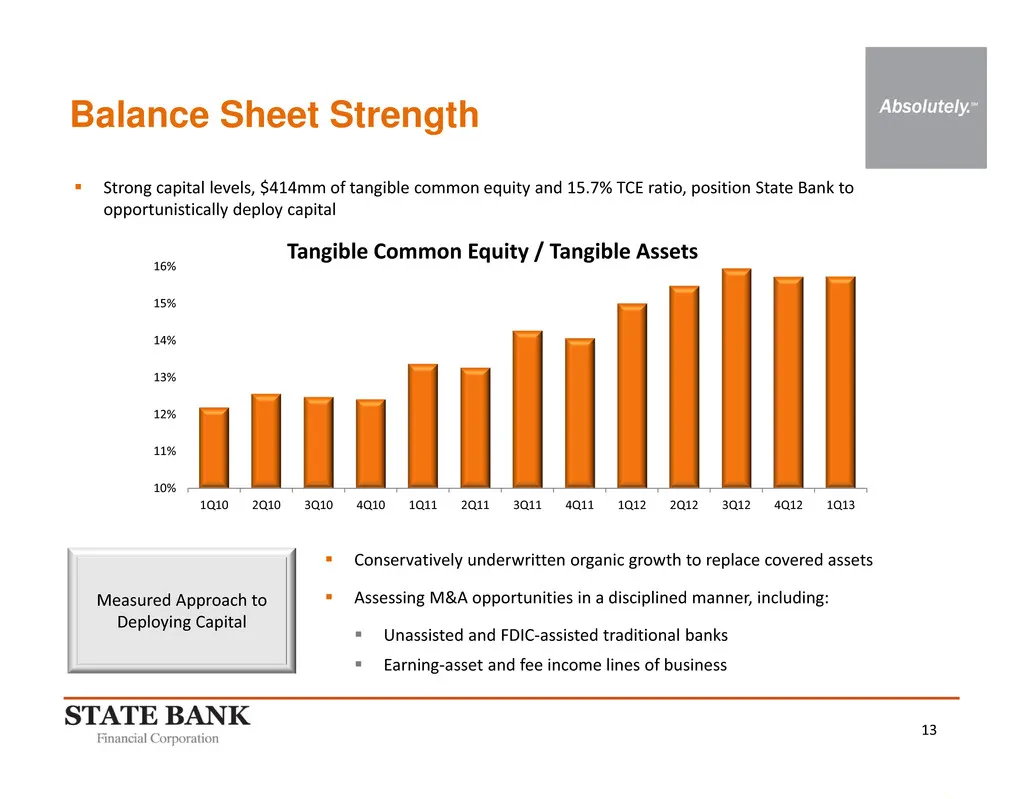
Slide 13: Balance Sheet Strength
13 Balance Sheet Strength Strong capital levels, $414mm of tangible common equity and 15.7% TCE ratio, position State Bank to opportunistically deploy capital 10% 11% 12% 13% 14% 15% 16% 1Q10 2Q10 3Q10 4Q10 1Q11 2Q11 3Q11 4Q11 1Q12 2Q12 3Q12 4Q12 1Q13 Tangible Common Equity / Tangible Assets Con
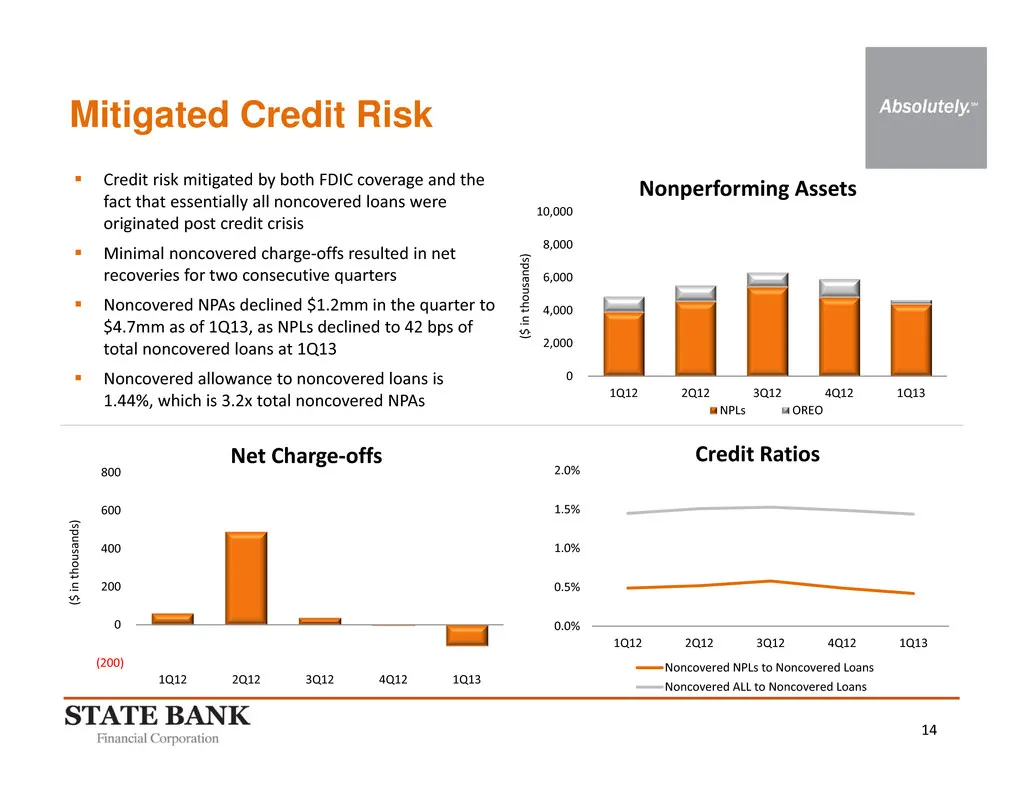
Slide 14: Mitigated Credit Risk
14 Mitigated Credit Risk Credit risk mitigated by both FDIC coverage and the fact that essentially all noncovered loans were originated post credit crisis Minimal noncovered charge‐offs resulted in net recoveries for two consecutive quarters Noncovered NPAs declined $1.2mm in the quarter to $4

Slide 15: Payments Expertise
15 Payments Expertise Delivering differentiated service through 17 Certified Treasury Professionals across the entire organization Investing in payments technologies that embrace “convenience,” “choice” and “quality” as client‐facing differentiators Enhances our treasury services / cash manage
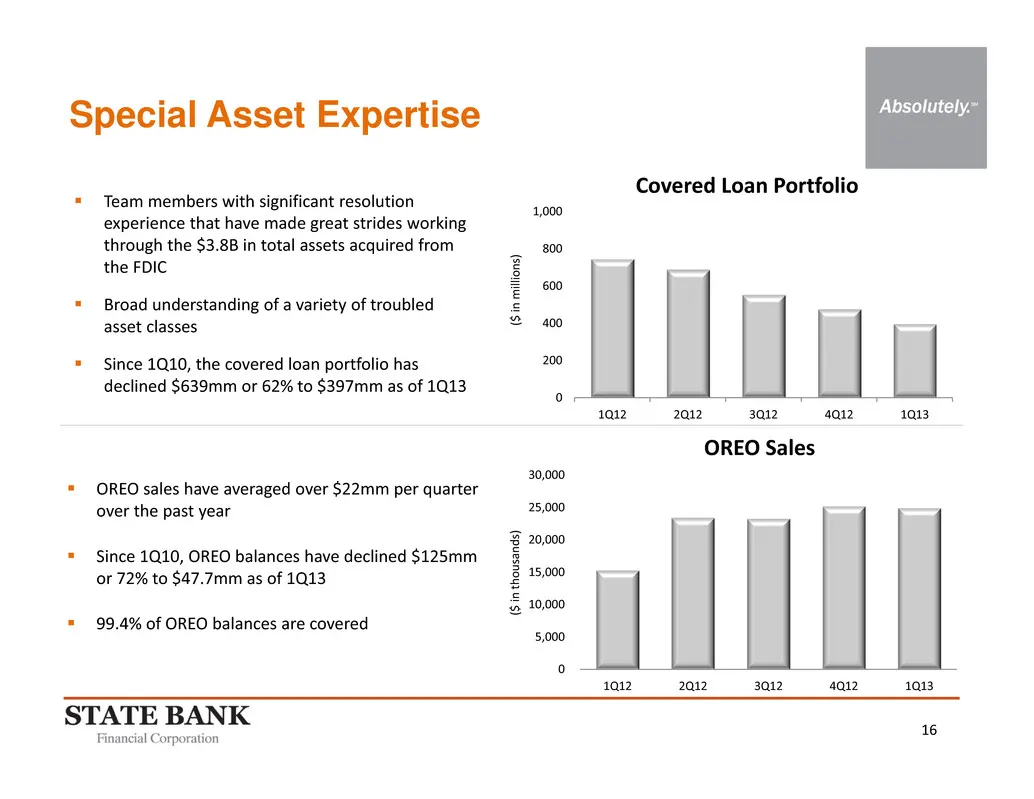
Slide 16: Special Asset Expertise
16 Special Asset Expertise Team members with significant resolution experience that have made great strides working through the $3.8B in total assets acquired from the FDIC Broad understanding of a variety of troubled asset classes Since 1Q10, the covered loan portfolio has declined $639mm or
Slide 17: Strategic Priorities
Absolutely. Strategic Priorities STATE BANK Financial Corporation
Slide 18: Strategic Priorities: Efficiency
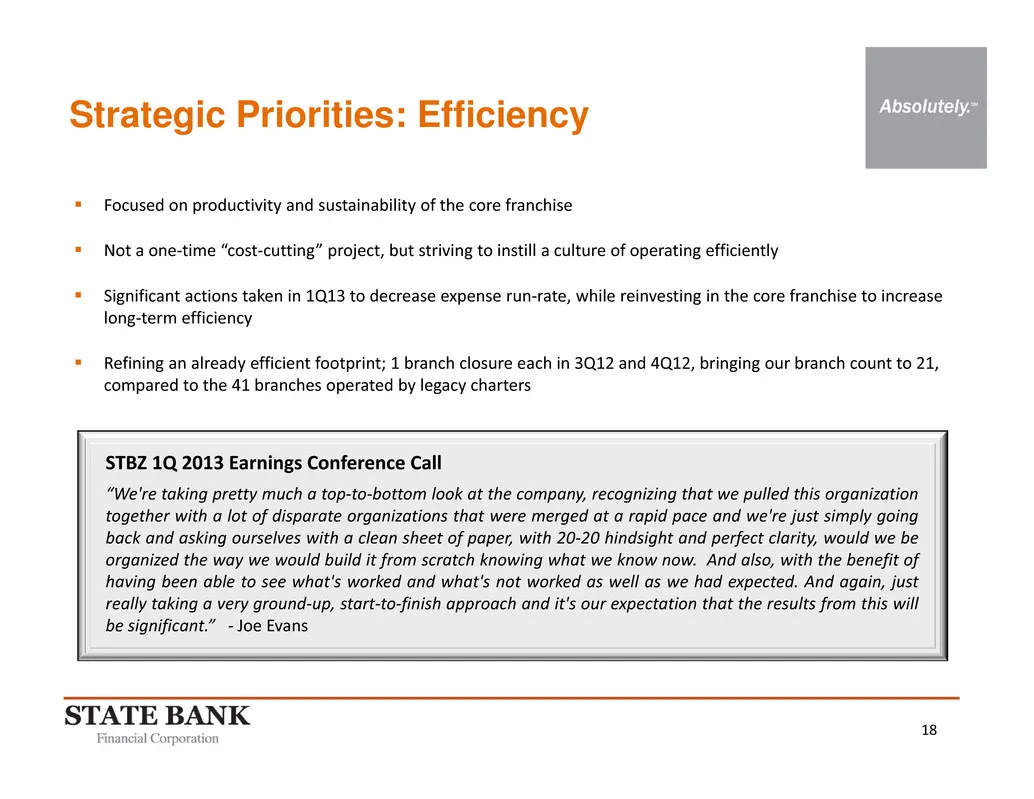
18 Focused on productivity and sustainability of the core franchise Not a one‐time “cost‐cutting” project, but striving to instill a culture of operating efficiently Significant actions taken in 1Q13 to decrease expense run‐rate, while reinvesting in the core franchise to increase long‐term ef
Slide 19: Strategic Priorities: Funding
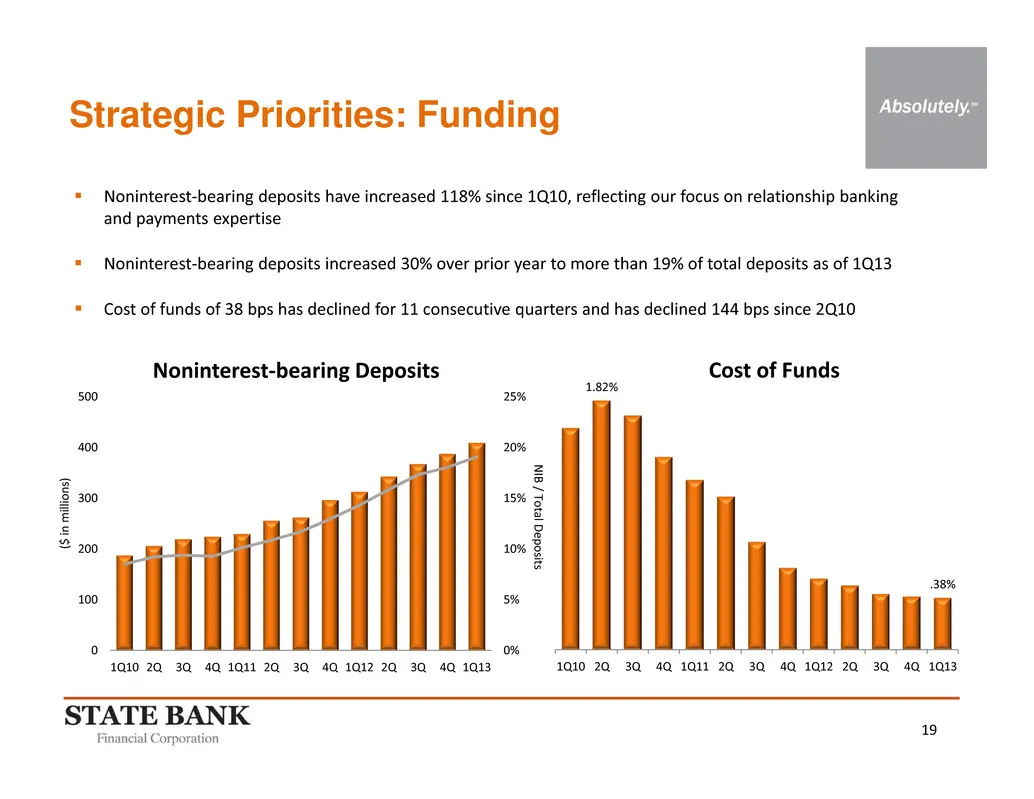
19 0% 5% 10% 15% 20% 25% 0 100 200 300 400 500 1Q10 2Q 3Q 4Q 1Q11 2Q 3Q 4Q 1Q12 2Q 3Q 4Q 1Q13 Noninterest‐bearing Deposits Noninterest‐bearing deposits have increased 118% since 1Q10, reflecting our focus on relationship banking and payments expertise Noninterest‐bearing deposits increased 30% o
Slide 20: Strategic Priorities: Earning Assets
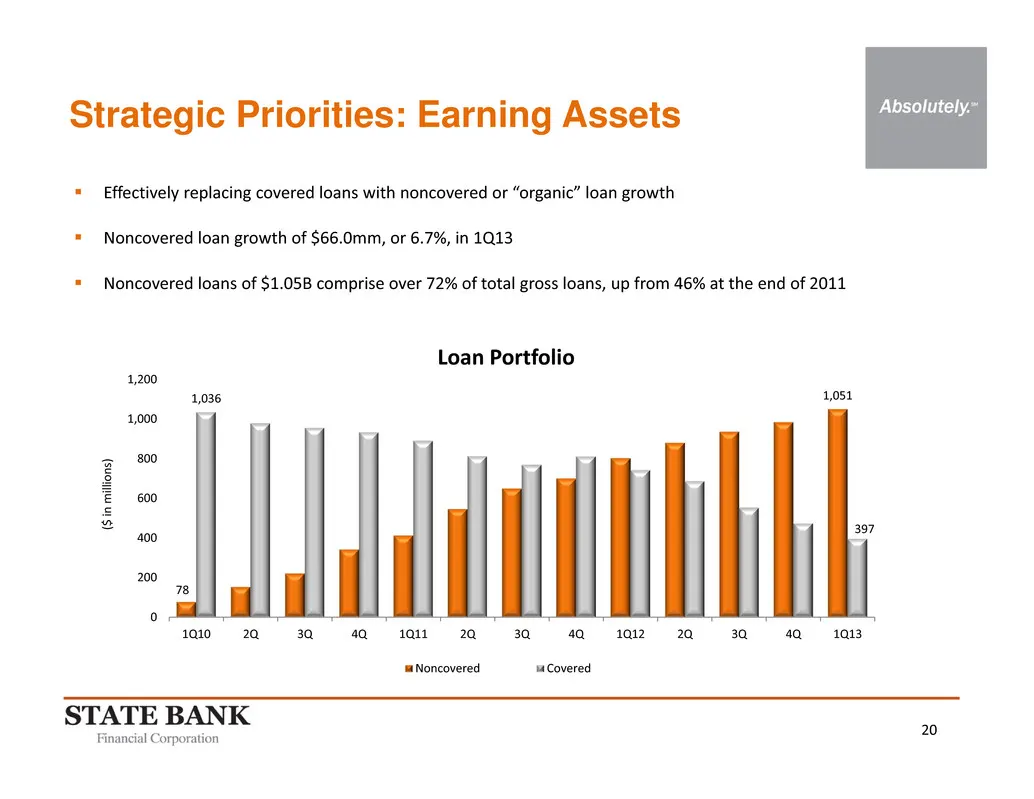
20 78 1,0511,036 397 0 200 400 600 800 1,000 1,200 1Q10 2Q 3Q 4Q 1Q11 2Q 3Q 4Q 1Q12 2Q 3Q 4Q 1Q13 Loan Portfolio Noncovered Covered Effectively replacing covered loans with noncovered or “organic” loan growth Noncovered loan growth of $66.0mm, or 6.7%, in 1Q13 Noncovered loans of $1.05B compri
Slide 21: Summary
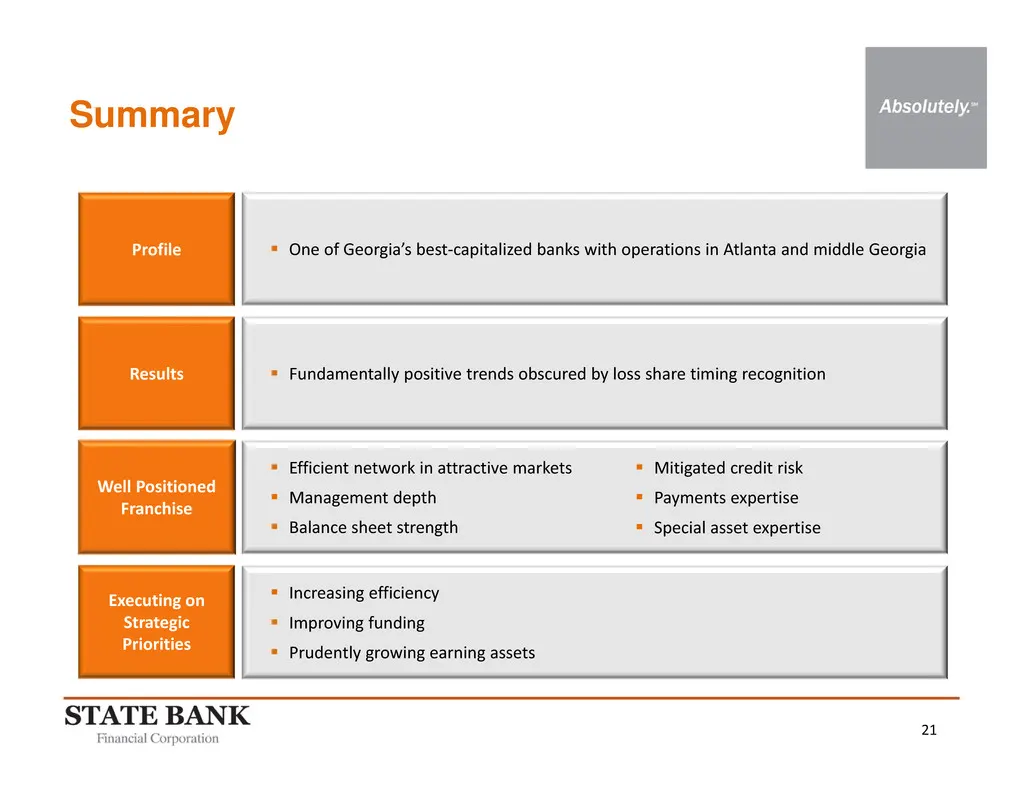
21 Summary Results Well Positioned Franchise Executing on Strategic Priorities Fundamentally positive trends obscured by loss share timing recognition Efficient network in attractive markets Management depth Balance sheet strength Increasing efficiency Improving funding Prudently growi
Source: SEC EDGAR · 8-K filed May 13, 2013
More decks from State Bank Financial Corporation
 Merger or Acquisition (May 2018)20 slides · May 14, 2018
 Investor Presentation (May 2018)18 slides · May 7, 2018
 Q1 2018 Earnings Presentation11 slides · Apr 26, 2018
 Q4 2017 Earnings Presentation14 slides · Jan 25, 2018
 Investor Presentation (December 2017)18 slides · Dec 11, 2017
 Q3 2017 Earnings Presentation12 slides · Oct 26, 2017