Duke Realty — 2011 BMO North American Real Estate Conference
29 slides from Duke Realty's conference presentation, Sep 26, 2011
Slide 1: 2011 BMO North American Real Estate Conference
RELIABLE. ANSWERS. 2011 BMO North American Real Estate Conference September 21– 22, 2011 Exhibit 99.1
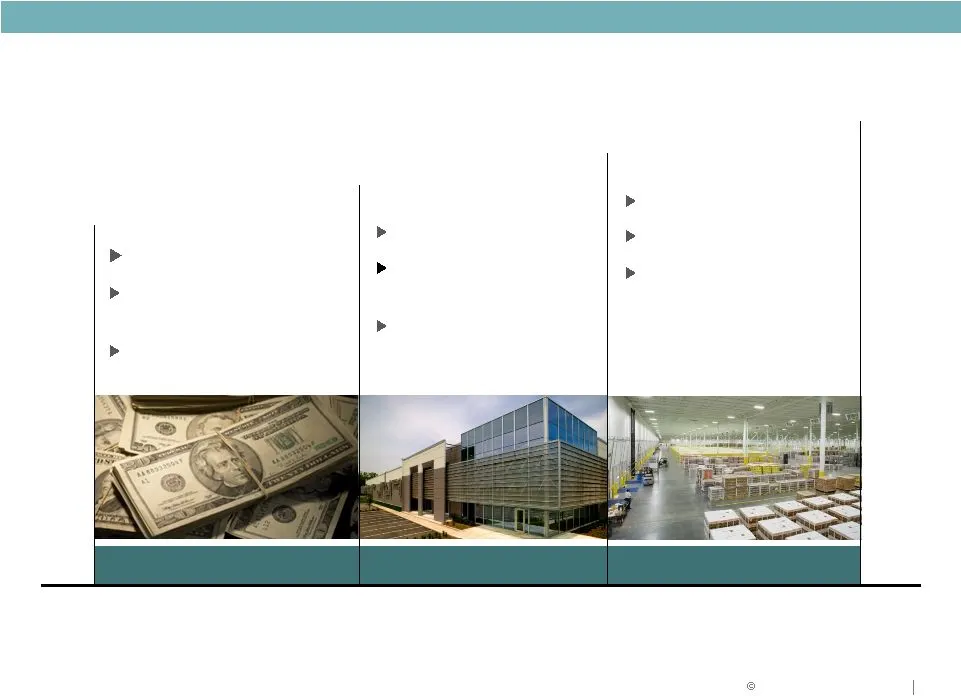
Slide 2: Where we've been and where we're going
RELIABLE. ANSWERS . 2009 2010 2011 and beyond FOCUS: Liquidity More than $1.5 billion capital raised Strategy refined FOCUS: Strategy execution Operating fundamentals Balance sheet strength FOCUS: Asset quality Cash flow growth Shareholder return Where we’ve been and where we’re going…
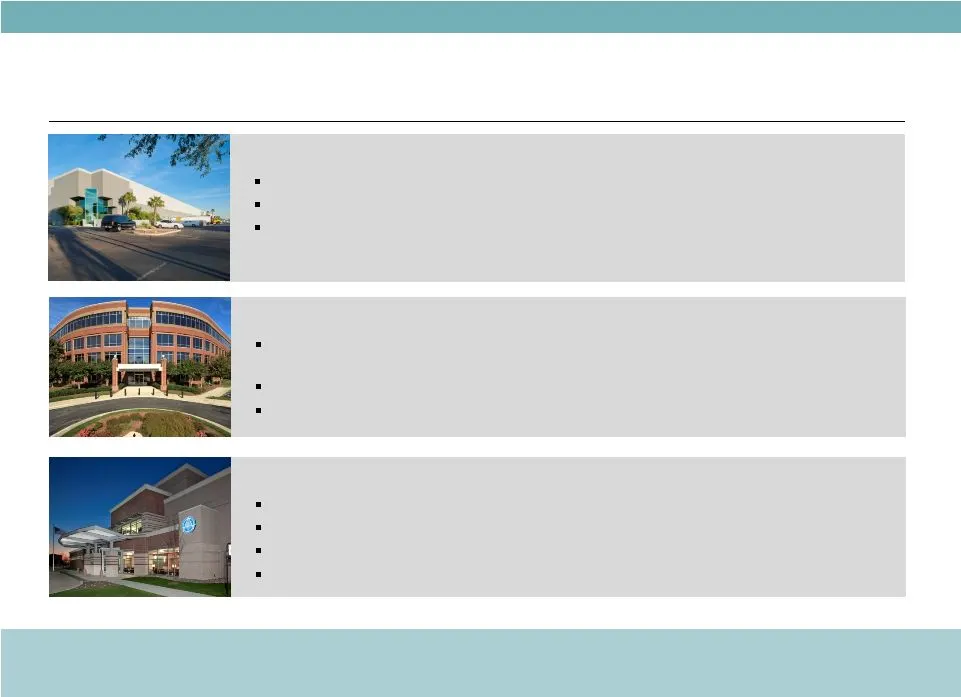
Slide 3: Market Outlook
RELIABLE. ANSWERS . Suburban Office Market Still Challenging Economic and federal budget uncertainty limiting business investment and expansion decisions GDP growth below earlier projections again . . . Office sector recovery continuing, but slowly Medical Office Traction Remains Operators re-visiti
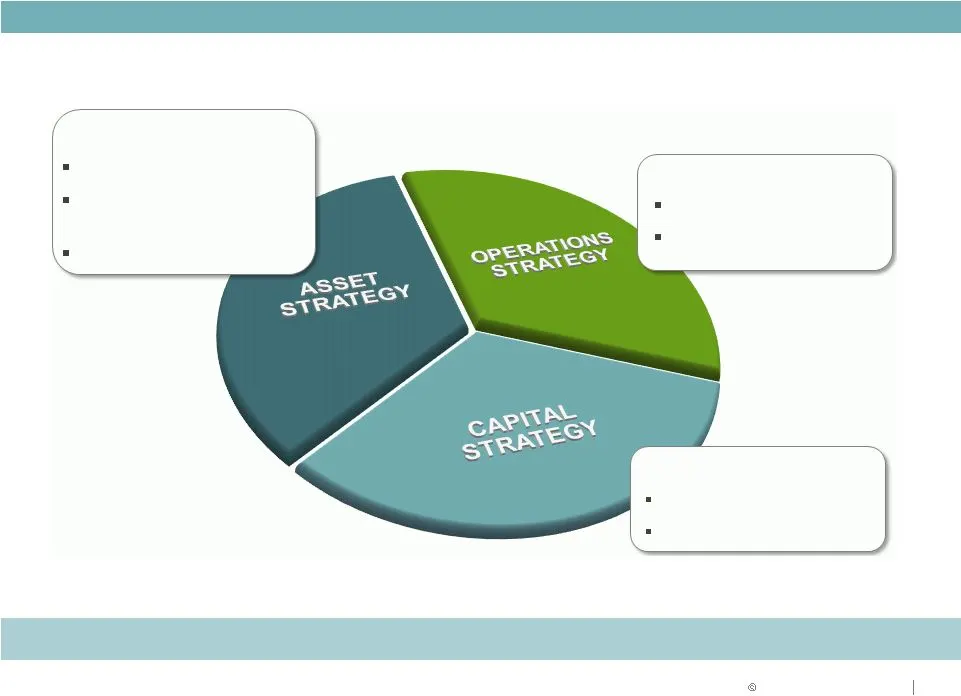
Slide 4: Strategy for Success
RELIABLE. ANSWERS . Strategy for Success Delivering on what we say we will do Focus on: Portfolio repositioning Strategic acquisitions & Dispositions Development opportunities Focus on: Increasing cash flow Maximizing return on Assets Focus on: Improving coverage ratios Improving ratings
Slide 5: 2011 Goals and Objectives Q2 2011 Update
RELIABLE. ANSWERS . 2011 Goals and Objectives Q2 2011 Update Strategic Focus • Lease-up portfolio, manage cap ex; reach positive same property income growth • Balance execution with capital strategy relative to level and quality of cash flow and same property NOI; Debt to EBITDA <7.0x • Development
Slide 6: Asset Strategy: Portfolio Strategy
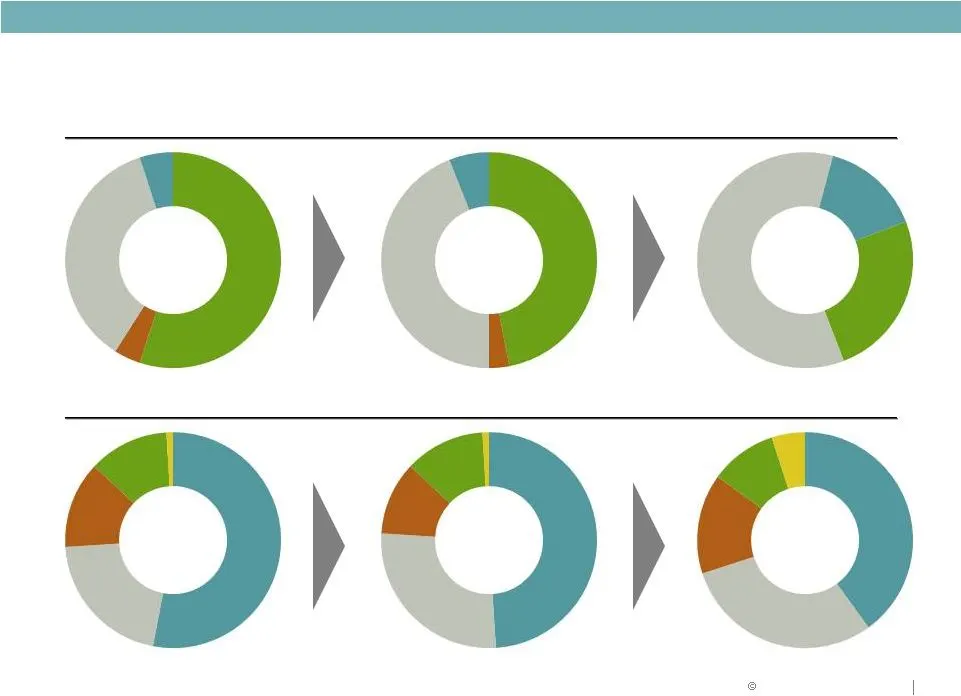
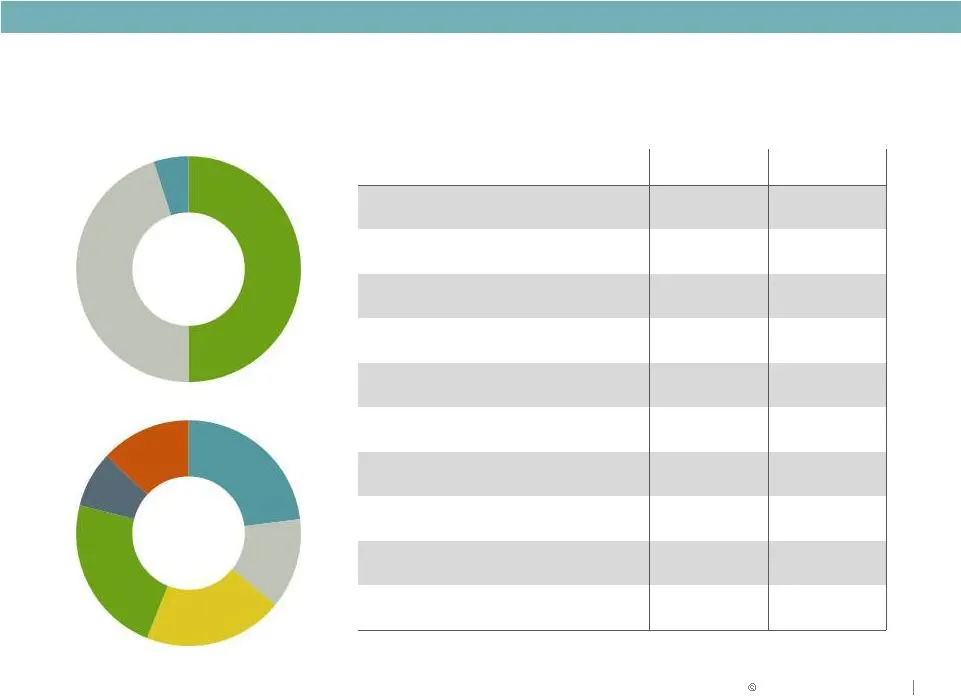
ASSET STRATEGY Portfolio Strategy BY PRODUCT BY GEOGRAPHY Q2 2011 Q2 2011 Southeast 21% Southeast 27% Southeast 30% Midwest 53% West 1% South 12% East 13% East 12% South 11% West 2% Midwest 48% East 15% South 10% West 5% Midwest 40% Office 25% Medical Office 15% Industrial 60% Office 45% Medical Off
Slide 7: Asset Strategy: Road Map
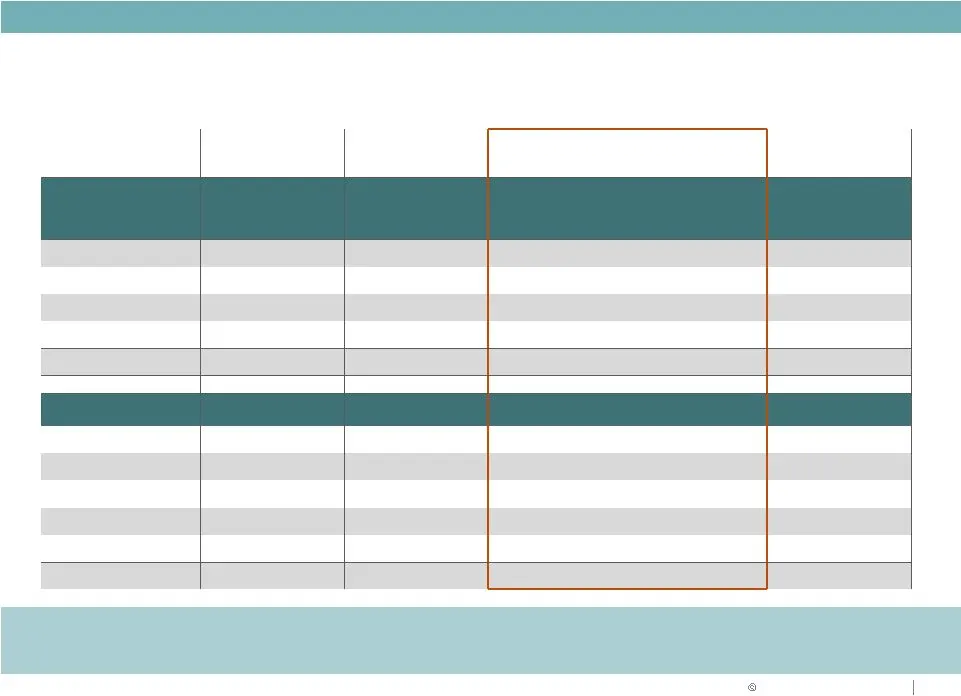
PRODUCT TYPE Amount % Amount % Proceeds from Targeted Dispositions Acquisitions/ Developments/ Repositioning Amount % REGION ASSET STRATEGY Asset Strategy: Road Map ($ in millions) Investment 9/30/09 Investment 6/30/11 ACTION PLAN Investment Industrial $2,930 36% $3,708 45% ($55) $1,130 $4,920 60% O
Slide 8: Asset Strategy: Progress To Date
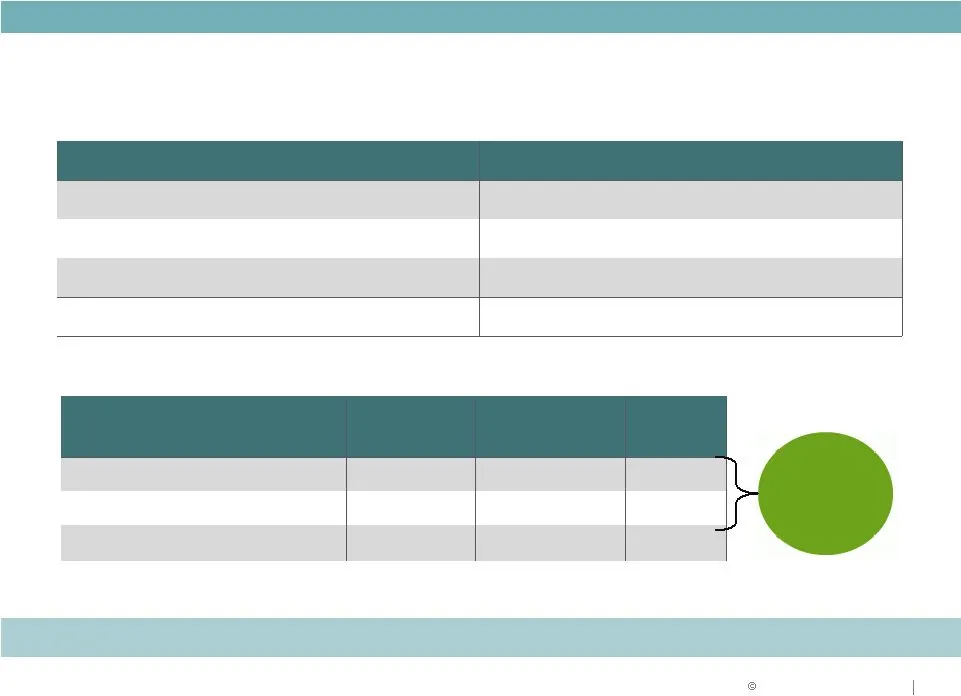
ASSET STRATEGY BUILDING ACQUISITIONS BUILDING DISPOSITIONS PRO FORMA PROGRESS TO DATE TOTAL VALUE ASSUMED DEBT NET Asset Strategy: Progress To Date Q4 2009 $15 Q4 2009 $144 Proforma Total $1,189 Proforma Total $1,157 Dispositions $1,157 ($0) $1,157 Acquisitions $1,189 ($618) $571 Excess Cash $586 Ma
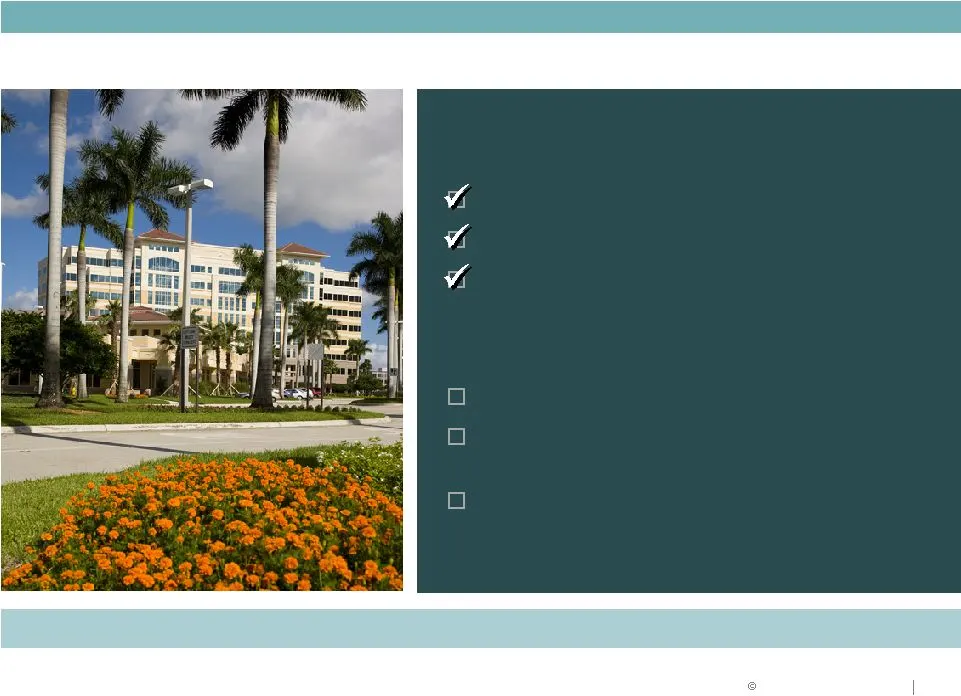
Slide 9: Quality portfolio improving with asset strategy
2010 PERFORMANCE $533.2 million of dispositions $919.1 million of acquisitions $130 million of development starts 2011 GOALS Strong backlog of dispositions & acquisitions $200 million of new development starts; $75 - $125 million medical office Continue to make significant progress on strategic plan
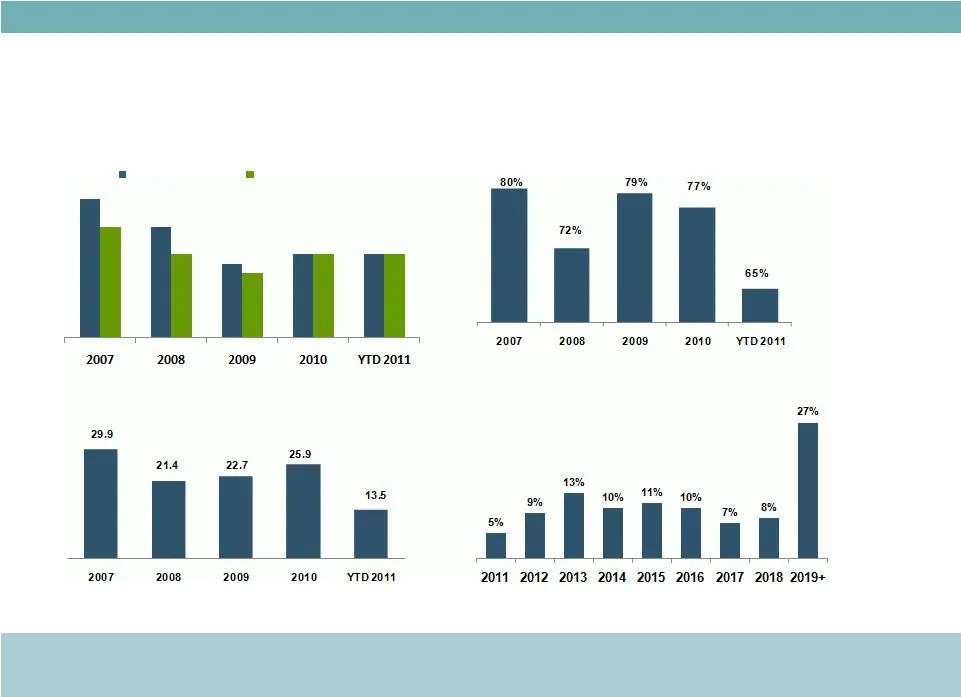
Slide 10: Operations Strategy: Consistent Operating Performance
OPERATIONS STRATEGY Demonstrated ability to maintain consistency through difficult operating environments Operations Strategy: Consistent Operating Performance Stabilized Occupancy (%) Strong historical stabilized occupancy – fundamentals improving Lease Renewals (%) Strong lease renewal percentages
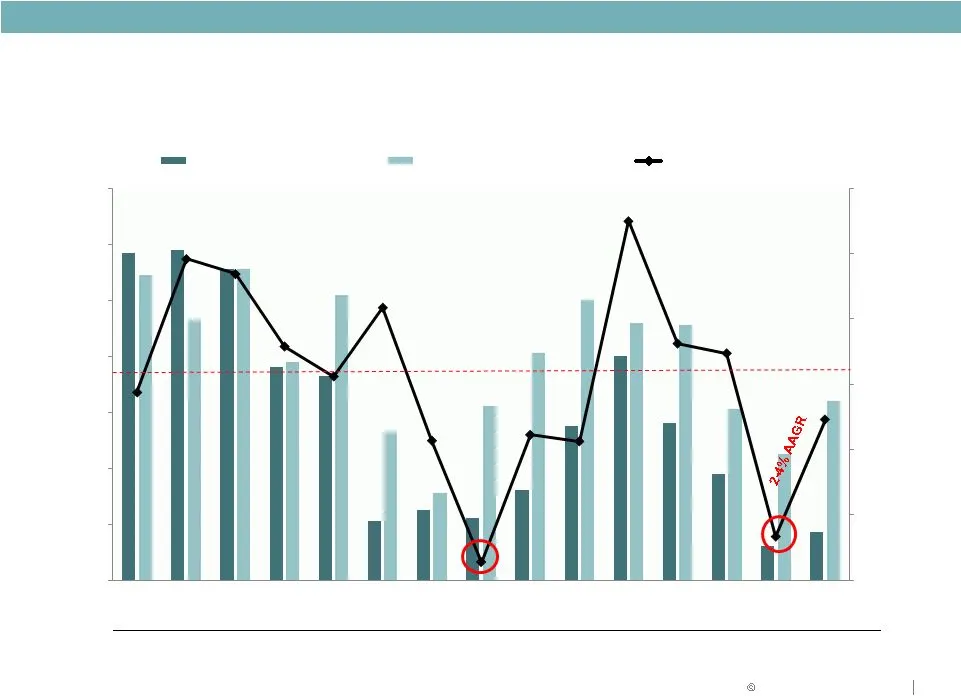
Slide 11: Historical Focus on Occupancy
OPERATIONS STRATEGY December 31 Historical Focus on Occupancy 2.3% Avg Technology Bust Market Downturn -4.00% -2.00% 0.00% 2.00% 4.00% 6.00% 8.00% 84.0% 86.0% 88.0% 90.0% 92.0% 94.0% 96.0% 98.0% Office properties in service Industrial properties in service Same Property Growth
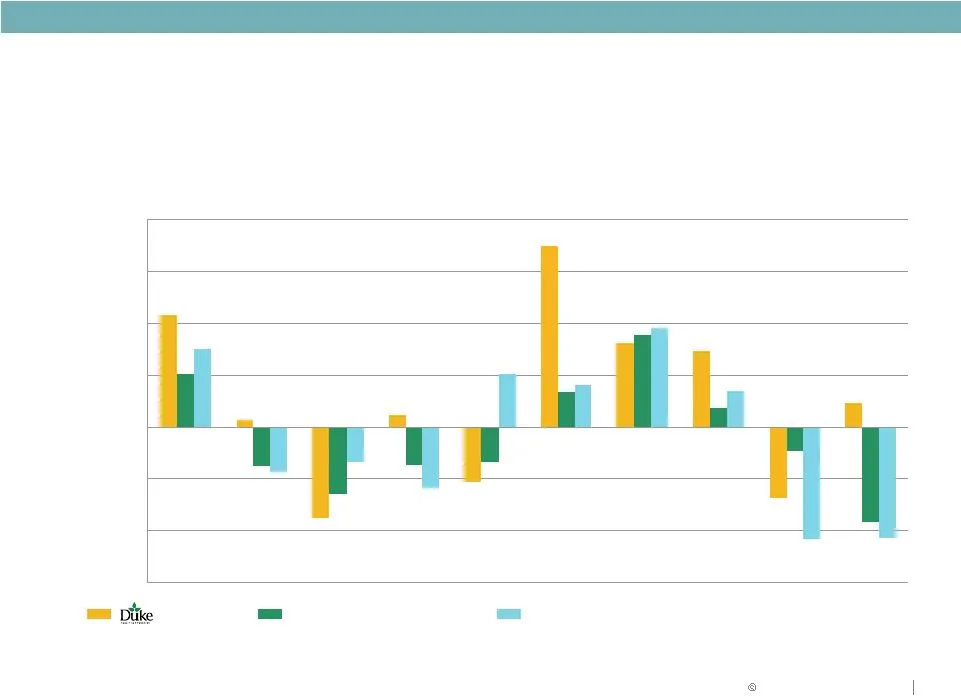
Slide 12: Consistent NOI Growth Outperformance
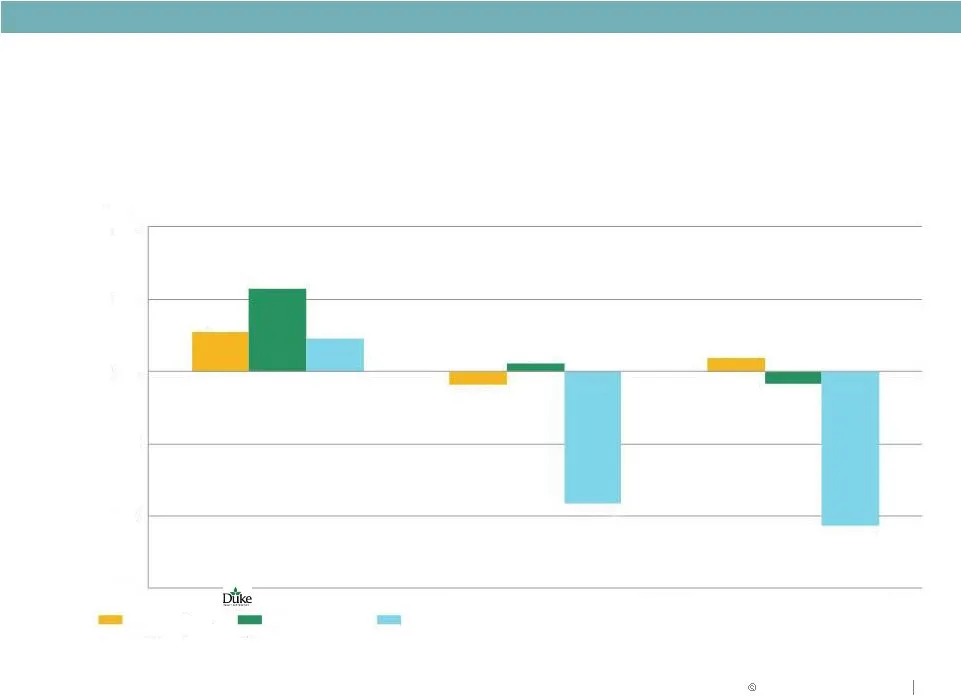
OPERATIONS STRATEGY Consistent NOI Growth Outperformance 4.4% 0.3% (3.5%) 0.5% (2.1%) 7.0% 3.3% 3.0% (2.7%) 0.9% 2.1% (1.5%) (2.6%) (1.5%) (1.3%) 1.4% 3.6% 0.8% (0.9%) (3.6%) 3.0% (1.7%) (1.3%) (2.4%) 2.1% 1.6% 3.9% 1.4% (4.3%) (4.3%) (6.0%) (4.0%) (2.0%) 0% 2% 4% 6% 8% Suburban Office Peers Industr
Slide 13: Consistent NOI Growth Outperformance (cont'd)
OPERATIONS STRATEGY Consistent NOI Growth Outperformance (cont’d) Annual Same-Store NOI Growth (1) %, y-y Relative Performance vs. Peers Notes Source SNL and company filings 4% 2% 0% (2%) (4%) (6%) 1.1% 2.3% 0.9% (0.4%) 0.2% 0.4% (3.6%) (0.3%) (4.3%) 10-Year Avg. 5-Year Avg. 1-Year Avg. Suburban Off
Slide 14: Capital Strategy: Current Liquidity Position
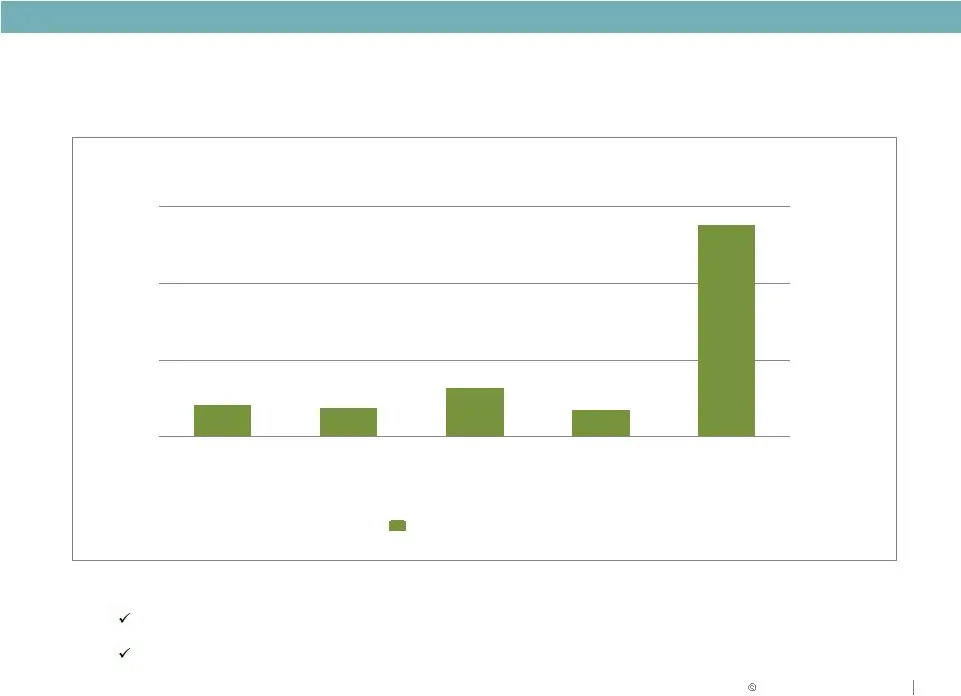
CAPITAL STRATEGY Current Liquidity Position $412 $372 $634 $351 $2,758 $0 $1,000 $2,000 $3,000 Thereafter Debt Maturity and Amortization Schedule ($ in millions) 6/30/11 • Provide for $290 Million 2011 Unsecured Bond Maturities $122 million due 8/15/11 $168 million due 12/1/11
Slide 15: Capital Strategy: Key Metrics & Goals
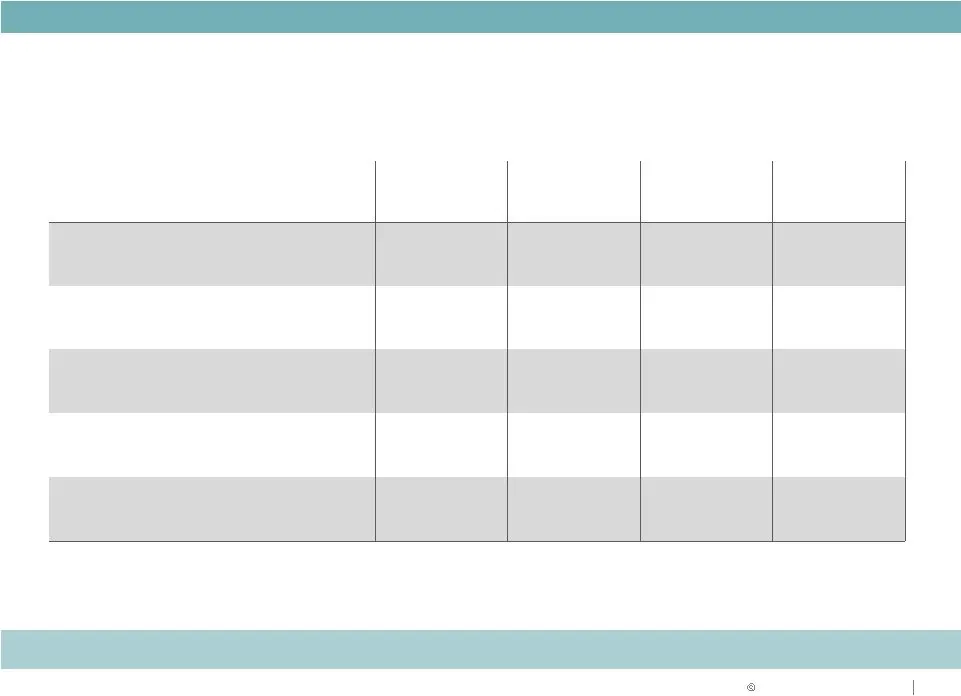
CAPITAL STRATEGY Key Metrics & Goals Actual Actual Q2 2011 Actual Goal Debt to Gross Assets 44.5% 46.3% 46.2% 45.0% Debt + Preferred to Gross Assets 54.9% 55.5% 55.4% 50.0% Fixed Charge Coverage Ratio 1.79 : 1 1.79 : 1 1.82 : 1 2.00 : 1 Debt/EBITDA 6.65 7.31 6.67 < 6.00 Debt + Preferred/EBITDA 8.47
Slide 16: Midwest Overview
MIDWEST OVERVIEW Midwest Overview Industrial Office Average Age 11.7 years 16.5 years 239,000 SF 133,000 SF 51.8 million 16.3 million 93.8% 84.1% Indianapolis 94.9% 86.9% Chicago 98.0% 86.5% Cincinnati 89.6% 81.3% St. Louis 93.0% 79.7% Columbus 97.4% 82.5% Minneapolis 85.3% 98.2% Note: All informati
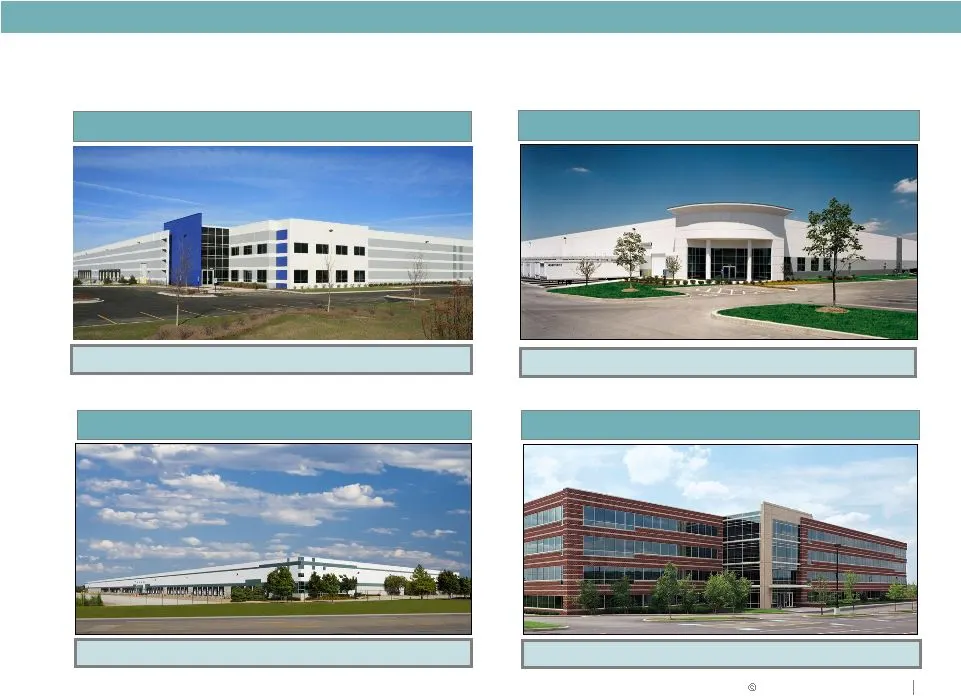
Slide 17: Midwest Overview: Recent Leasing Highlights
DukePort VI – St. Louis DukePort I – St. Louis Centre Pointe III - Cincinnati Butterfield 550 - Chicago MIDWEST OVERVIEW Recent Leasing Highlights Signed a 123,000 SF, 10 year lease Signed a 551,200 SF, 11 year lease Signed a 81,000 SF, 4 year lease Signed a 115,000 SF, 9.5 year lease
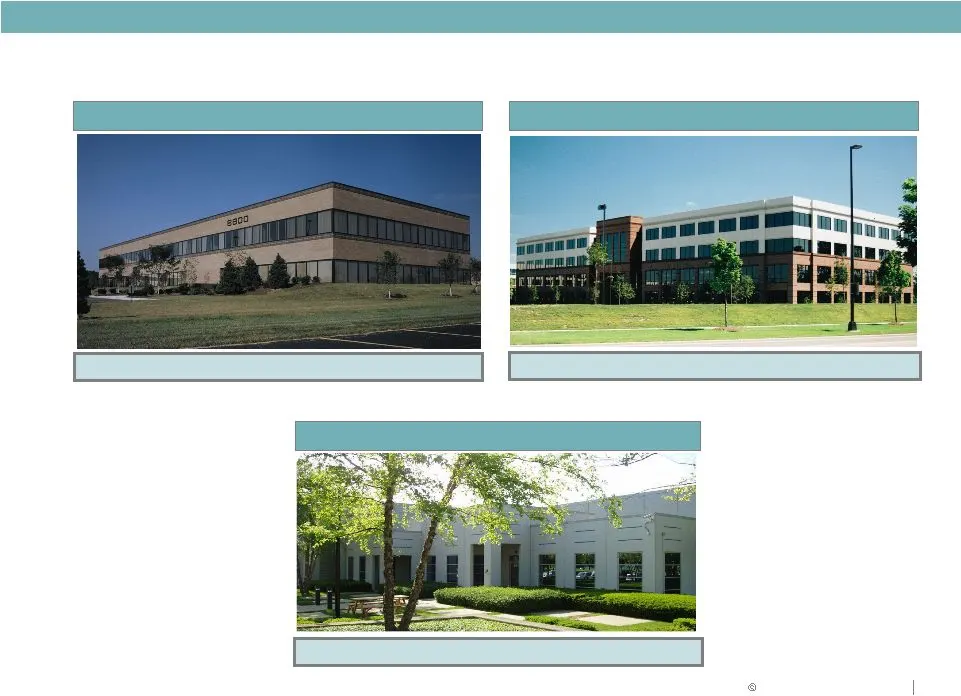
Slide 18: Midwest Overview: Repositioning Transaction Highlights
8800 Governor’s Hill - Cincinnati Emerald III – Columbus 4000 Sussex Avenue - Chicago MIDWEST OVERVIEW Repositioning Transaction Highlights Disposed of 29,000 SF Asset Disposed of 75,000 SF Asset Disposed of 46,000 SF Asset
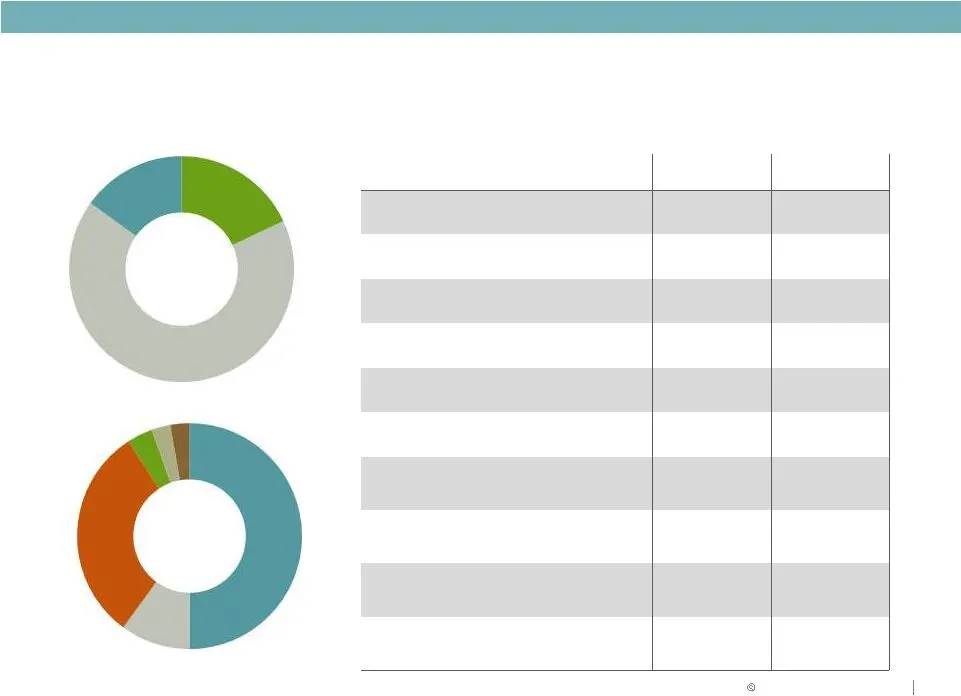
Slide 19: Southwest Overview
SOUTHWEST OVERVIEW Southwest Overview Location Product Type Industrial Office Average Age 8.5 years 6.8 years 260,000 SF 109,000 SF 21.0 million 2.1 million 85.5% 91.9% Dallas 84.5% 82.5% Nashville 80.9% 95.4% Houston 98.0% 100% Phoenix 86.7% N/A Seattle 100% N/A SoCal 100% N/A Note: All information
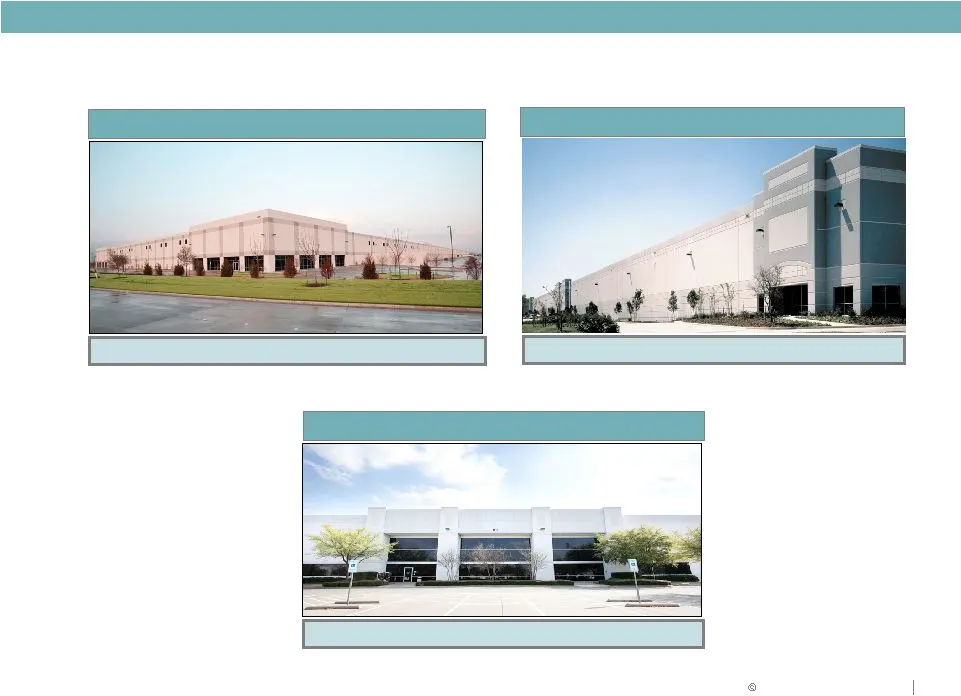
Slide 20: Southwest Overview: Recent Leasing Highlights
Point West VI - Dallas Waters Ridge I - Dallas Freeport IV - Dallas SOUTHWEST OVERVIEW Recent Leasing Highlights Signed a 263,625 SF, 7.5 year lease Signed a 125,000 SF, 3 year lease Signed a 201,000 SF, 2 year renewal lease
Slide 21: Southwest Overview: Repositioning Transaction Highlights
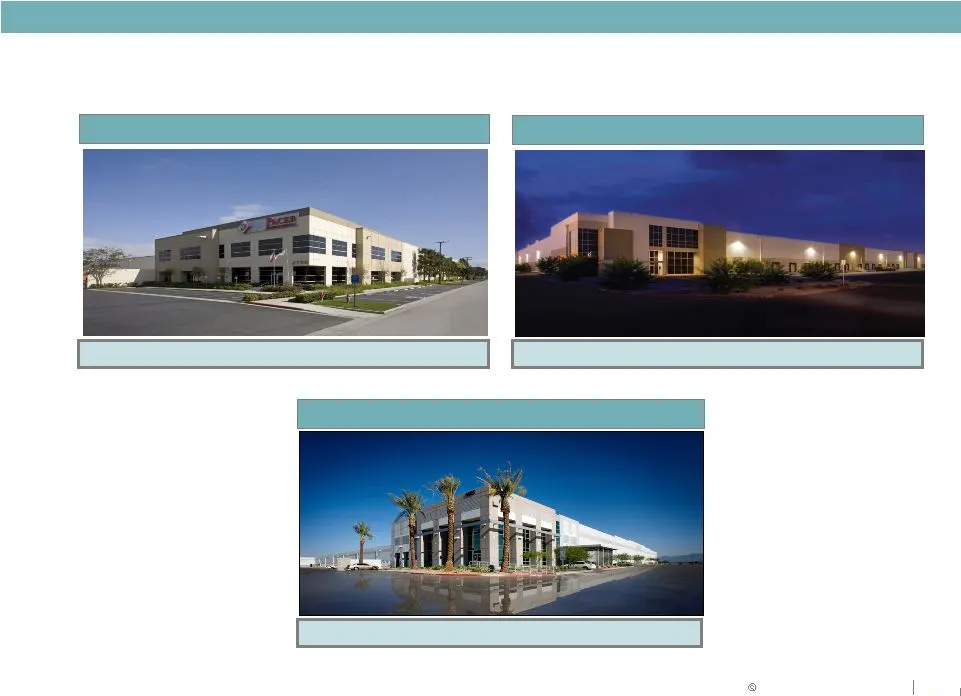
Century Business Center – Southern CA Riverside Business Center - Phoenix Buckeye Logistics Center - Phoenix SOUTHWEST OVERVIEW Repositioning Transaction Highlights Acquired 323,000 SF, 100% lease Development 405,000 SF, 100% pre-leased Acquired 604,000 SF building
Slide 22: East and Southeast Overview
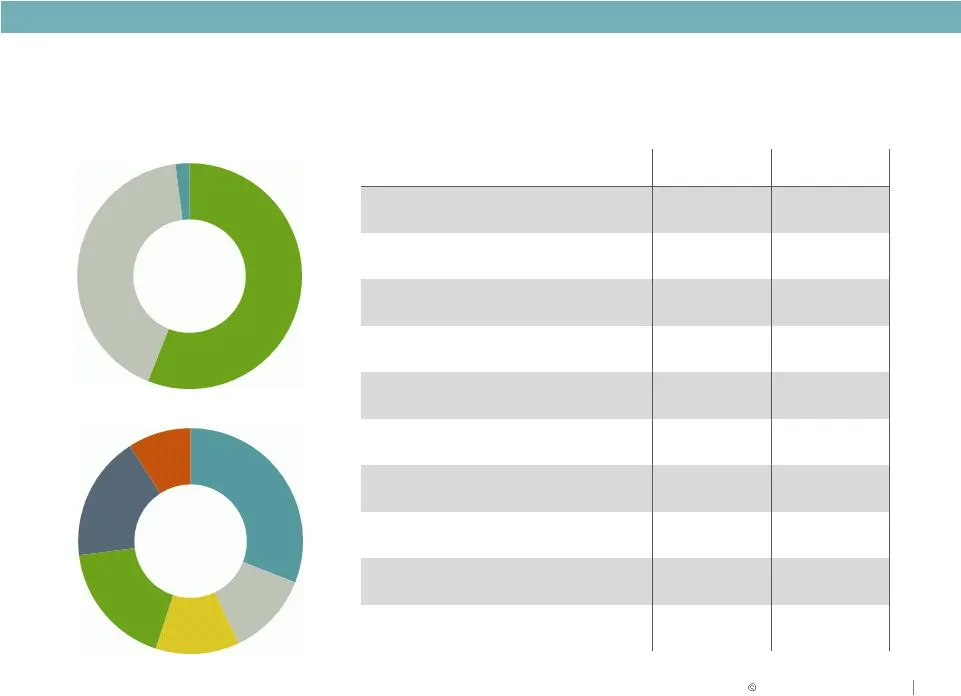
EAST & SOUTHEAST OVERVIEW East and Southeast Overview Location Product Type Industrial Office Average Age 9.1 years 10.2 years 227,000 SF 107,000 SF 27.9 million 13.7 million 88.3% 86.7% Atlanta 83.1% 83.5% South Florida 80.9% 81.7% Raleigh 96.7% 91.0% Washington D.C./Baltimore 95.5% 91.3% Central F
Slide 23: East & Southeast Overview: Recent Leasing Highlights
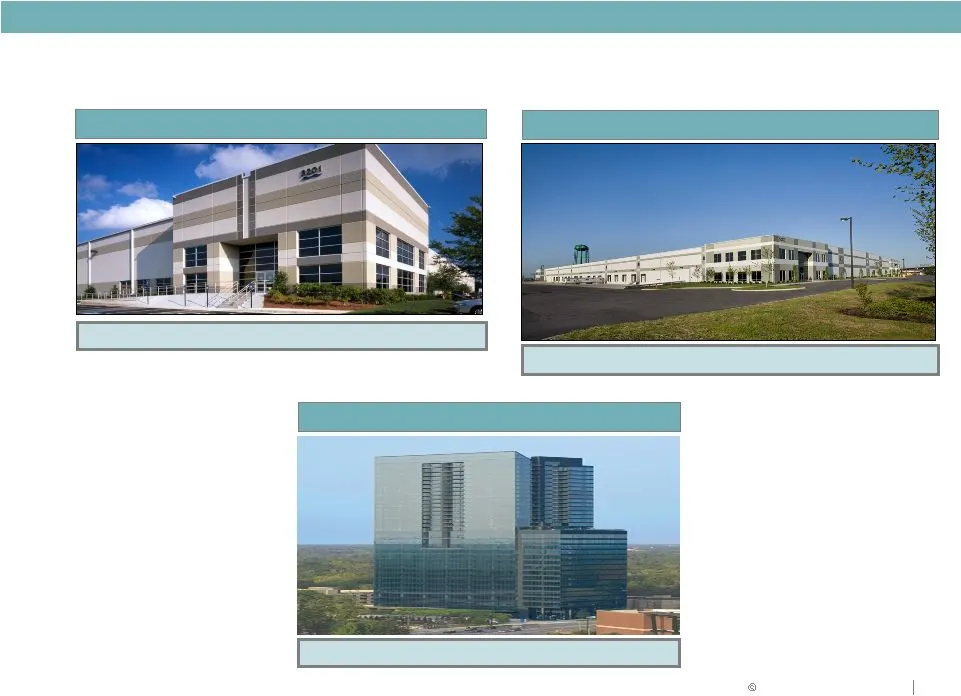
3201 Centre Parkway - Atlanta 3630 Peachtree - Atlanta 5003 Holabird Avenue - Baltimore EAST & SOUTHEAST OVERVIEW Duke Realty Corporation Recent Leasing Highlights Signed 34,000 SF, 13 year lease Signed 405,000 SF, 6 year lease Signed 161,000 SF, 5 year lease
Slide 24: East/Southeast Overview: Repositioning Transaction Highlights
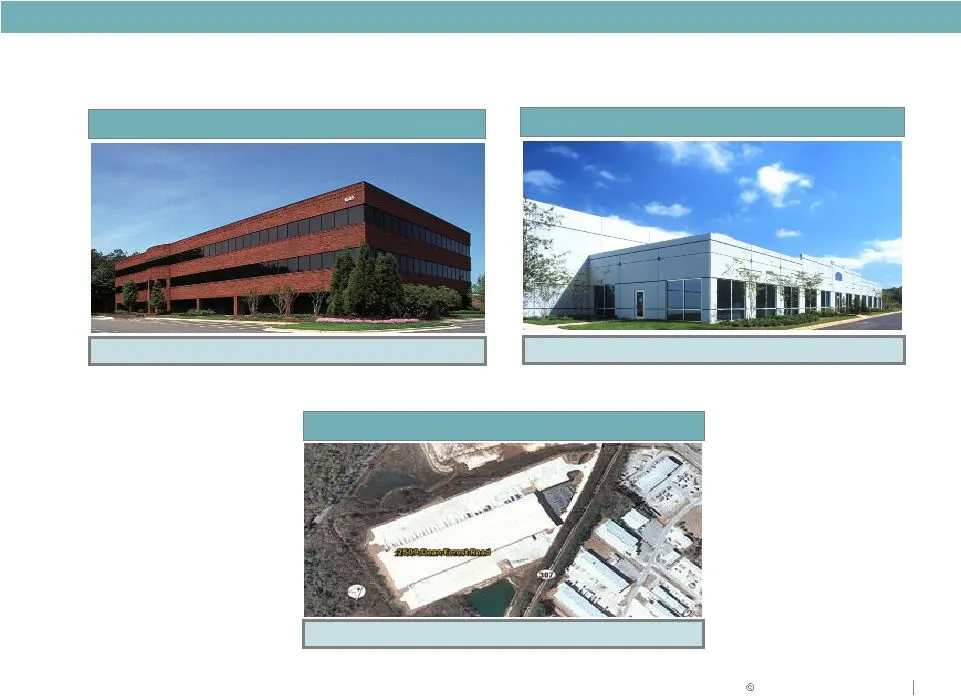
EAST/SOUTHEAST OVERVIEW 1835 Shackelford Ct - Atlanta 240 Northpoint Parkway - Atlanta 2509 Dean Forest Rd - Savannah Sold 57,000 SF Acquired 329,000 SF building Sold 223,000 SF Asset Repositioning Transaction Highlights
Slide 25: Medical Office Overview: Current Development Pipeline
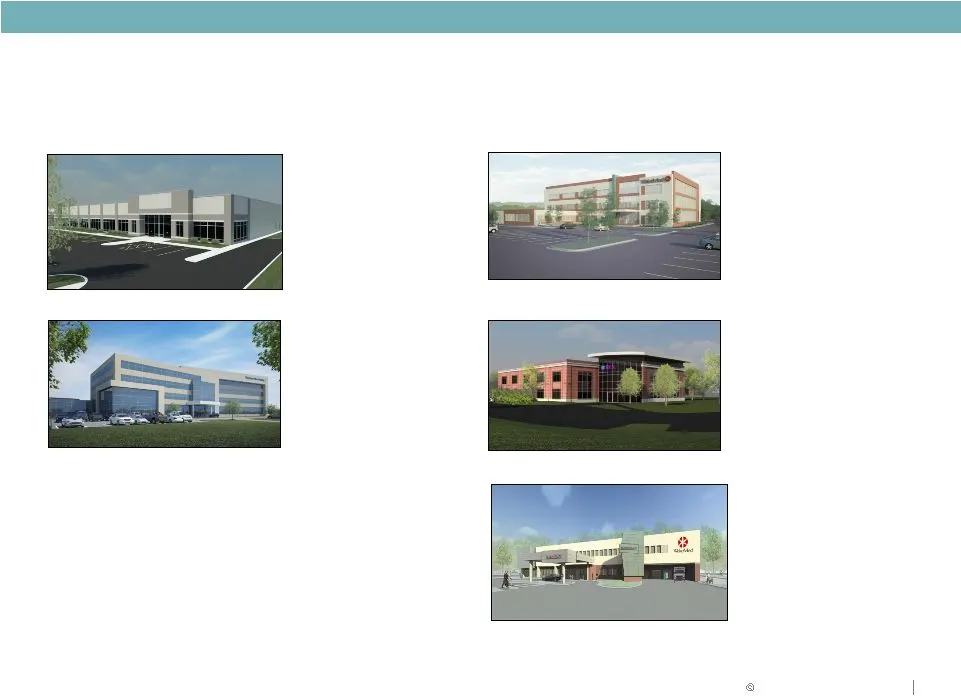
MEDICAL OFFICE OVERVIEW Current Development Pipeline Baylor McKinney MOB McKinney, TX 114,000 SF Baylor 66% pre-leased WakeMed MOB - Sunnybrook Raleigh, NC 86,000 SF Wake Med Health and Hospital 58% pre-leased REX Holly Springs MOB Raleigh, NC 30,000 SF Rex Hospital 100% pre-leased Western Ridge MOB
Slide 26: Capital Strategy: 2011 Range of Estimates
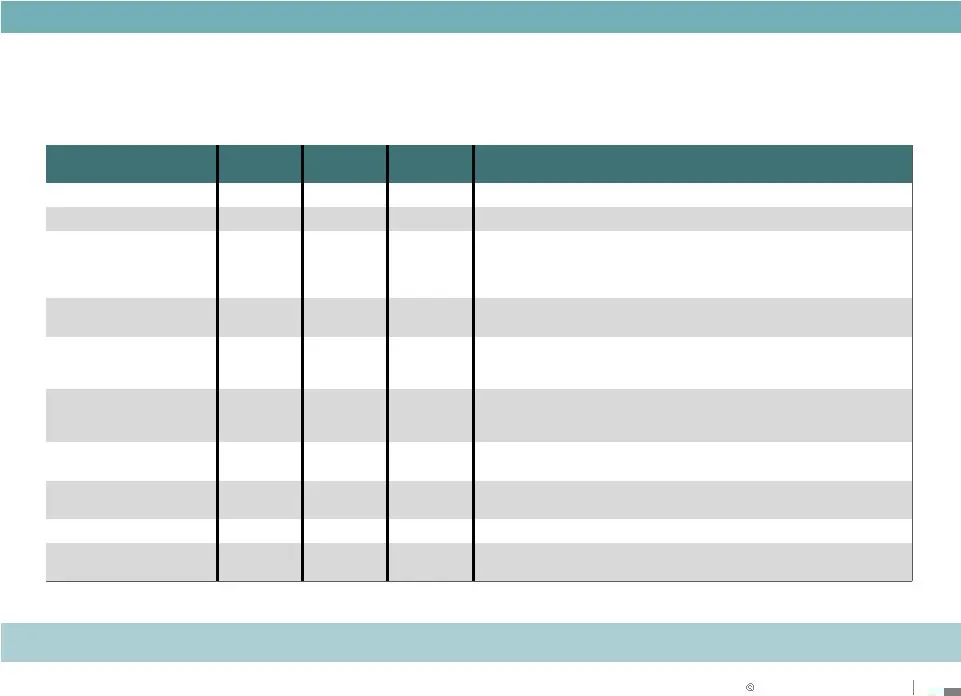
CAPITAL STRATEGY Metrics 2010 Actual Pessimistic Optimistic Key Assumptions 2011 Range of Estimates 2011 RANGE Core FFO Per Share $1.15 $1.06 $1.18 AFFO Payout Ratio 89% 100% 85% • Annual dividend maintained at $0.68 per share Average Occupancy 88.2% 87.5% 90.5% • First half expirations cause dip in
Slide 27: Positioned for NAV Growth
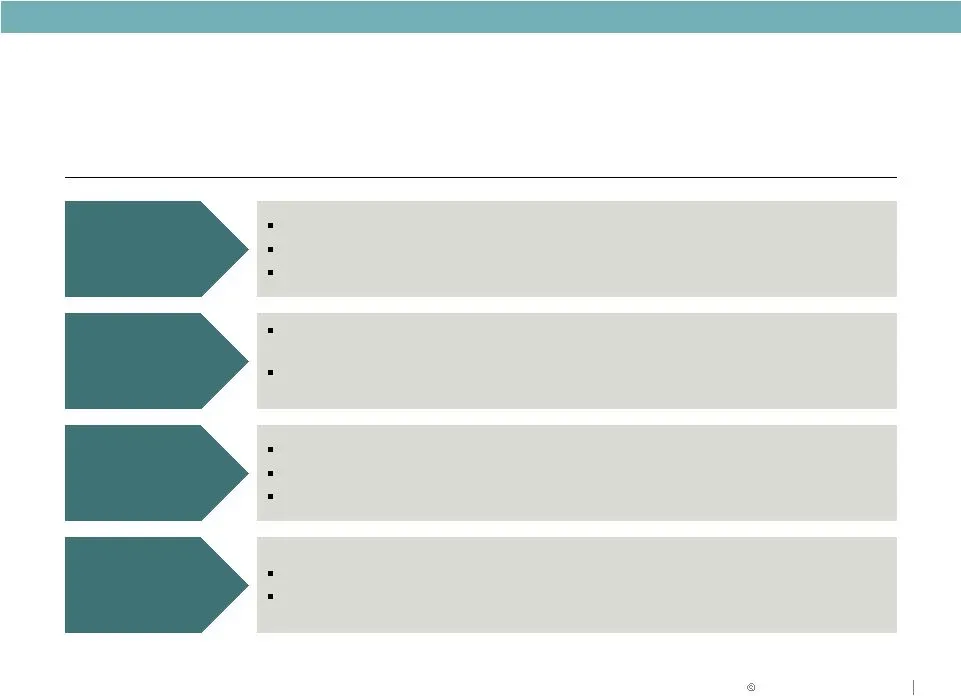
RELIABLE. ANSWERS . Lease up existing vacancy Increased management/ service fees Accretive future development Upside from land holdings Positioned for NAV Growth KEY NAV GROWTH DRIVERS Portfolio occupancy of 89%; 300-400 bps below historical levels Strong leasing pipeline Demonstrated track record o
Slide 28: Why Duke Realty?
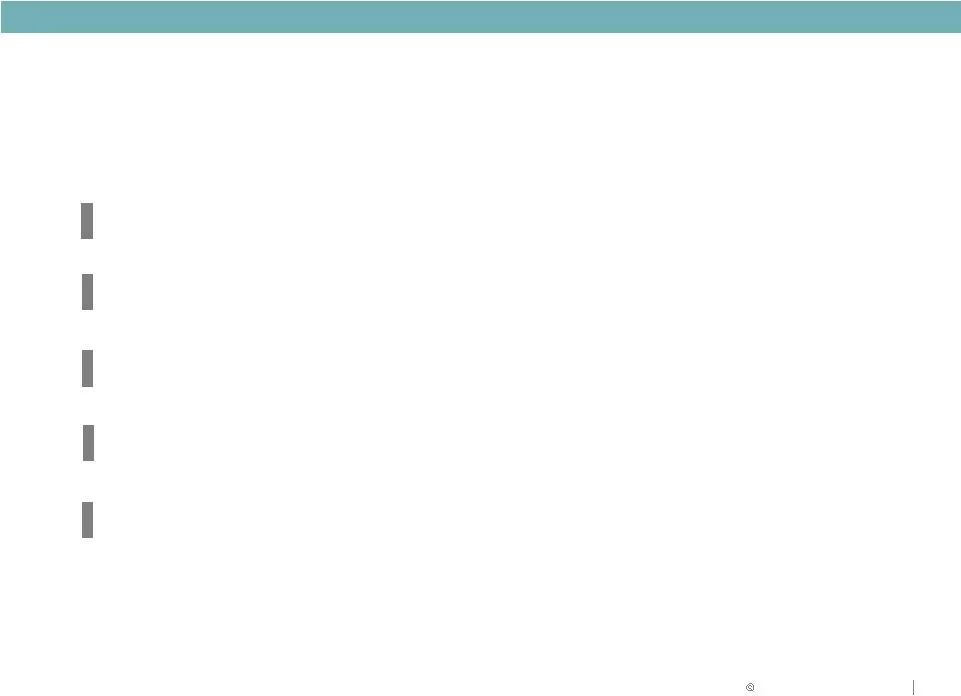
RELIABLE. ANSWERS . WHY DUKE REALTY? Quality portfolio improving with asset strategy Solid balance sheet improving with capital strategy Unmatched ability to execute on daily operations Development capabilities in place with existing land bank Talent and leadership depth to execute

Slide 29: Forward-Looking Statement
RELIABLE. ANSWERS . Forward-Looking Statement This slide presentation contains statements that constitute “forward-looking statements” within the meaning of the Securities Act of 1933 and the Securities Exchange Act of 1934 as amended by the Private Securities Litigation Reform Act of 1995. These fo
Source: SEC EDGAR · 8-K filed Sep 26, 2011
More decks from Duke Realty Corporation
 Merger or Acquisition (June 2022)14 slides · Jun 13, 2022
 Investor Presentation (June 2021)58 slides · Jun 7, 2021
 Investor Presentation (May 2021)44 slides · May 10, 2021
 Investor Presentation (February 2021)58 slides · Feb 22, 2021
 NAREIT REITworld Virtual Investor Conference 202056 slides · Nov 16, 2020
 B of A Securities 2020 Global Real Estate Conference56 slides · Sep 15, 2020