Plains Exploration & Production Company
Plains Exploration & Production — Lehman Brothers 2005 CEO Energy/Power Conference
35 slides from Plains Exploration & Production's conference presentation, Sep 6, 2005
Slide 1: Lehman Brothers 2005 CEO Energy/Power Conference
Lehman Brothers 2005 CEO Energy/Power Conference September 2005 N Y S E : P X P w w w . p l a i n s x p . c o m
Slide 2: Corporate Information
Corporate Information Corporate Headquarters Plains Exploration & Production Company 700 Milam Suite 3100 Houston, Texas 77002 Contacts James C. Flores - Chairman, President & CEO Stephen A. Thorington – EVP & CFO Scott Winters - Director of Investor Relations Joanna Pankey - Investor Relations Spec
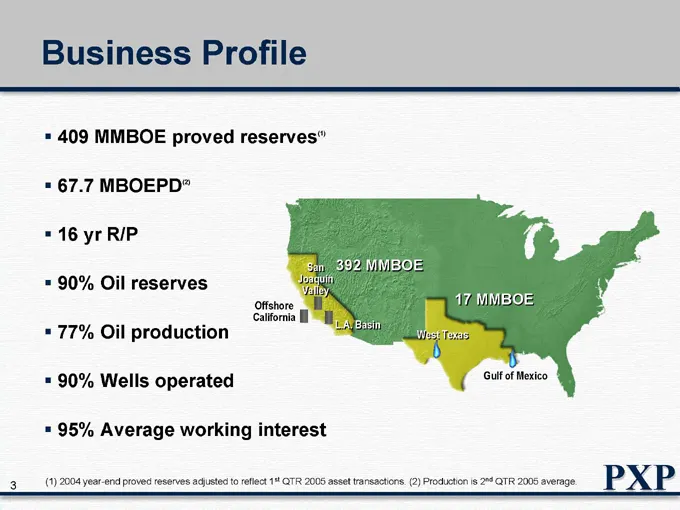
Slide 3: Business Profile
Business Profile 409 MMBOE proved reserves(1) 67.7 MBOEPD(2) 16 yr R/P 90% Oil reserves 77% Oil production 90% Wells operated 95% Average working interest Offshore California San Joaquin Valley L.A. Basin West Texas Gulf of Mexico 17 MMBOE 392 MMBOE (1) 2004 year-end proved reserves adjusted to refl
Slide 4: Value Creation Strategy
Value Creation Strategy Focus on core geographic areas to maximize free cash flow Allocate free cash flow to maximize per share growth
Slide 5: Excellent Reserve Growth
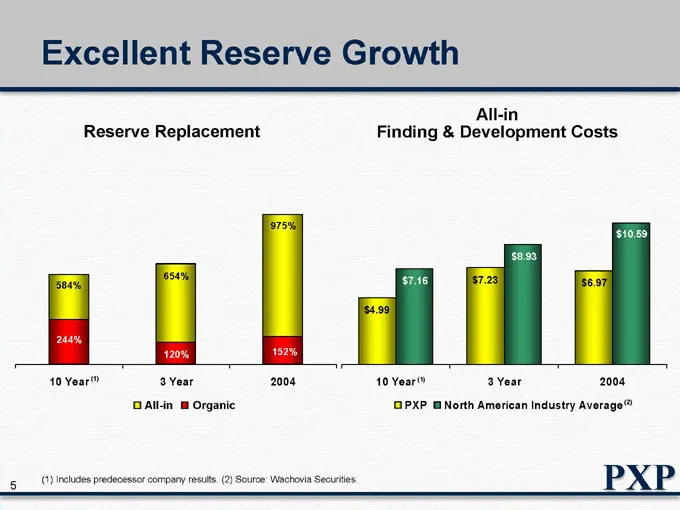
Excellent Reserve Growth Reserve Replacement All-in Finding & Development Costs 10 Year (1) 3 Year 2004 10 Year (1) 3 Year 2004 All-in Organic PXP North American Industry Average(2) 584% 244% 654% 120% 975% 152% $4.99 $7.16 $7.23 $8.93 $6.97 $10.59 (1) Includes predecessor company results. (2) Sourc
Slide 6: Production Growth
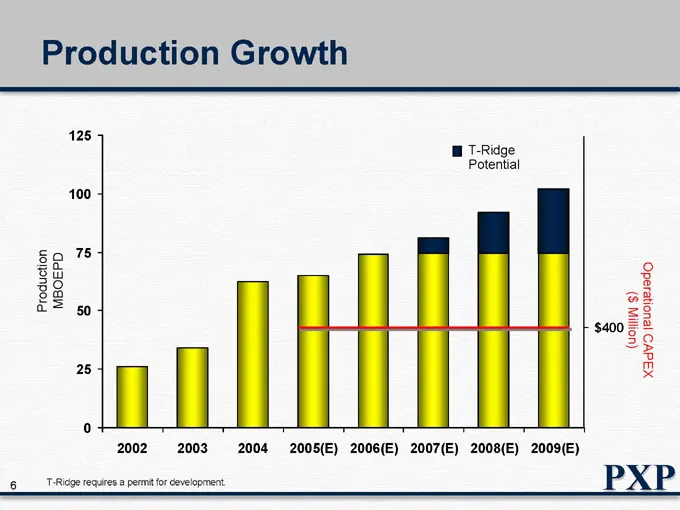
Production Growth Production MBOEPD 125 100 75 50 25 0 2002 2003 2004 2005(E) 2006(E) 2007(E) 2008(E) 2009(E) T-Ridge Potential $400 Operational CAPEX ($ Million) T-Ridge requires a permit for development.
Slide 7: Future Reserve and Production Growth
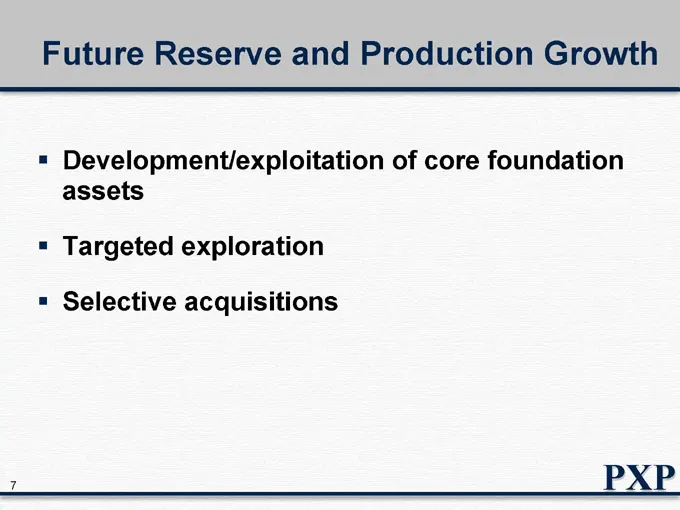
Future Reserve and Production Growth Development/exploitation of core foundation assets Targeted exploration Selective acquisitions
Slide 8: Estimated Capital Allocation
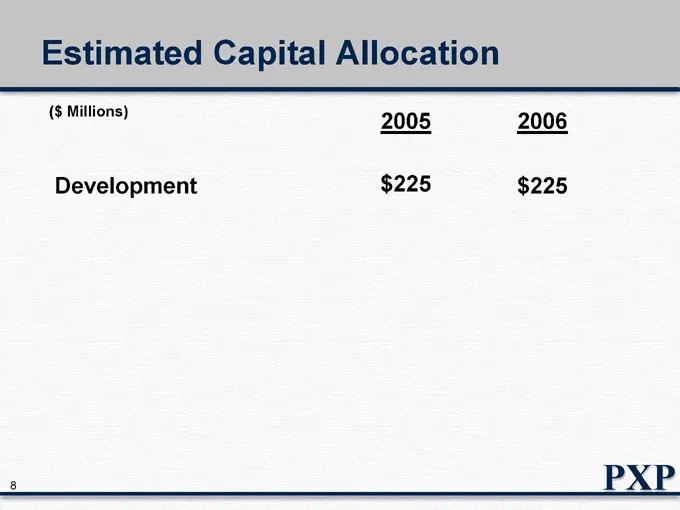
Estimated Capital Allocation ($ Millions) 2005 2006 Development $225 $225
Slide 9: Development: Los Angeles Basin
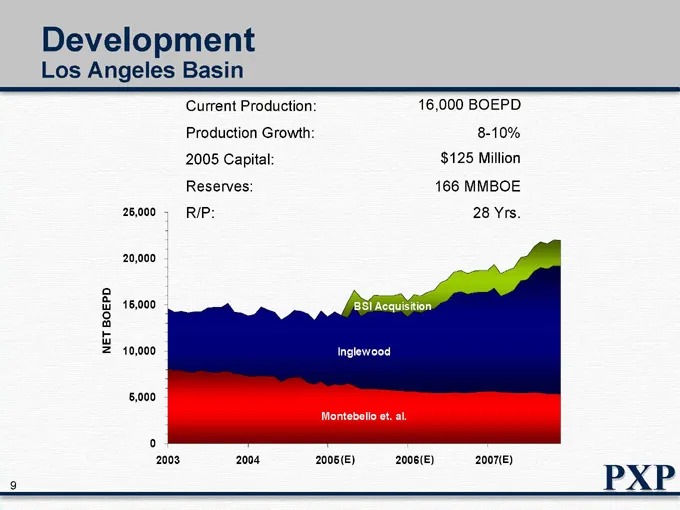
Development Los Angeles Basin Current Production: 16,000 BOEPD Production Growth: 8-10% 2005 Capital: $125 Million Reserves: 166 MMBOE R/P: 28 Yrs. NET BOEPD 25,000 20,000 15,000 10,000 5,000 0 2003 2004 2005(E) 2006(E) 2007(E) BSI Acquisition Inglewood Montebello et. al.
Slide 10: Development: Inglewood Reserves
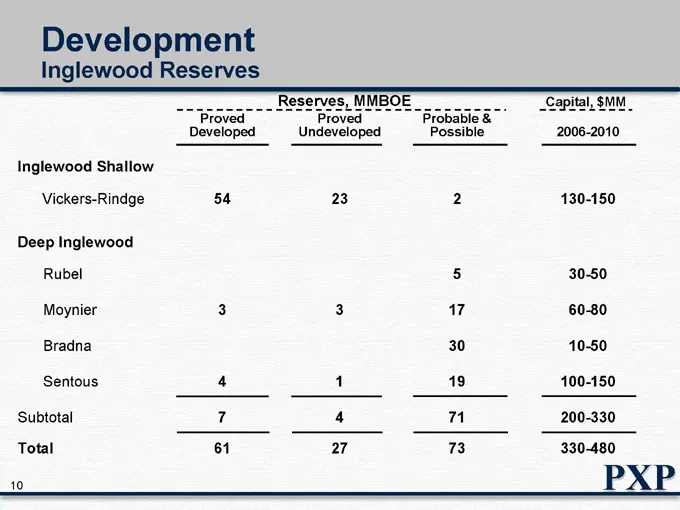
Development Inglewood Reserves Reserves, MMBOE Capital, $MM Proved Developed Proved Undeveloped Probable & Possible 2006-2010 Inglewood Shallow Vickers-Rindge 54 23 2 130-150 Deep Inglewood Rubel 5 30-50 Moynier 3 3 17 60-80 Bradna 30 10-50 Sentous 4 1 19 100-150 Subtotal 7 4 71 200-330 Total 61 27
Slide 11: Development: San Joaquin Valley
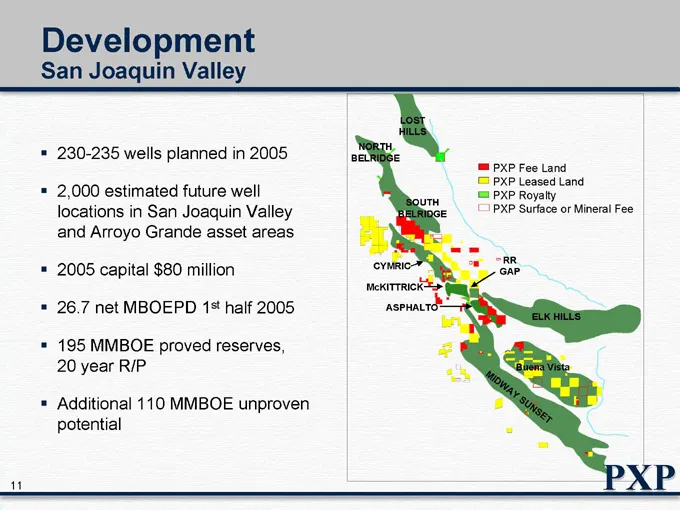
Development San Joaquin Valley 230-235 wells planned in 2005 2,000 estimated future well locations in San Joaquin Valley and Arroyo Grande asset areas 2005 capital $80 million 26.7 net MBOEPD 1st half 2005 195 MMBOE proved reserves, 20 year R/P Additional 110 MMBOE unproven potential NORTH BELRIDGE
Slide 12: Development: Point Arguello/Rocky Point
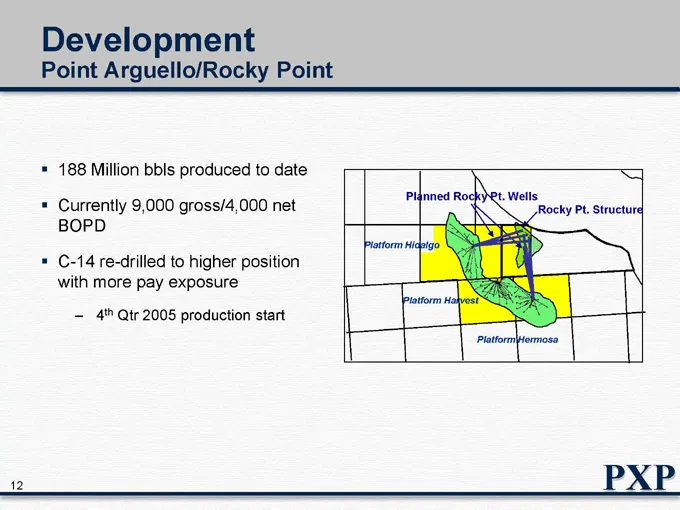
Development Point Arguello/Rocky Point 188 Million bbls produced to date Currently 9,000 gross/4,000 net BOPD C-14 re-drilled to higher position with more pay exposure 4th Qtr 2005 production start Planned Rocky Pt. Wells Rocky Pt. Structure Platform Hidalgo Platform Harvest Platform Hermosa
Slide 13: Development: Point Pedernales Field Infill Drilling
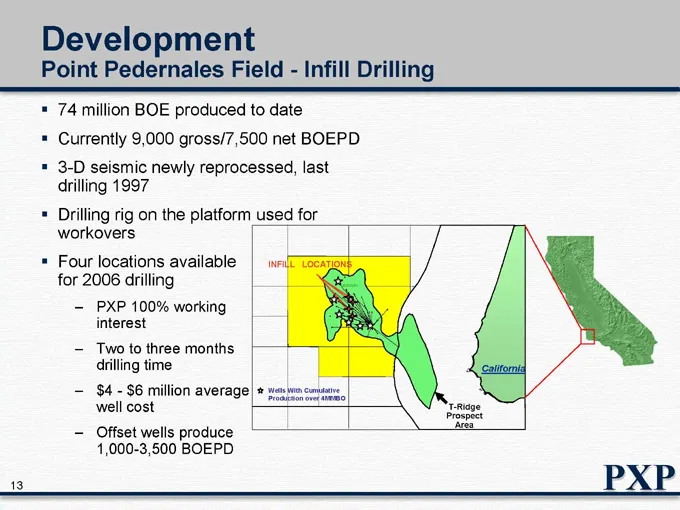
Development Point Pedernales Field—Infill Drilling 74 million BOE produced to date Currently 9,000 gross/7,500 net BOEPD 3-D seismic newly reprocessed, last drilling 1997 Drilling rig on the platform used for workovers Four locations available for 2006 drilling PXP 100% working interest Two to three
Slide 14: Estimated Capital Allocation
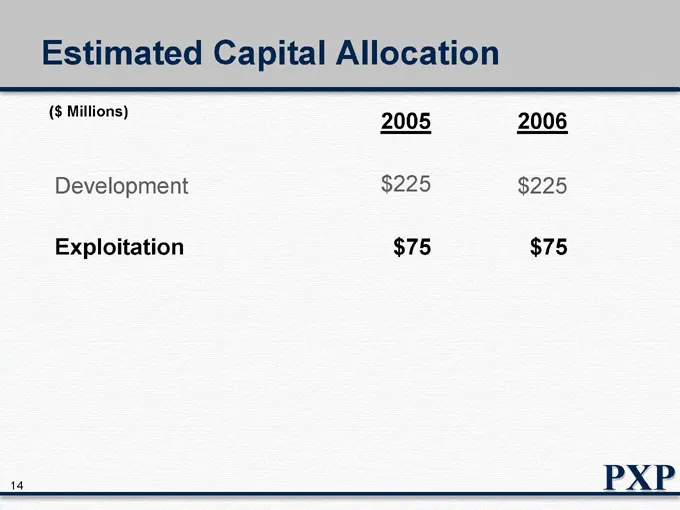
Estimated Capital Allocation ($ Millions) 2005 2006 Development $225 $225 Exploitation $75 $75
Slide 15: Exploitation - T-Ridge Opportunity
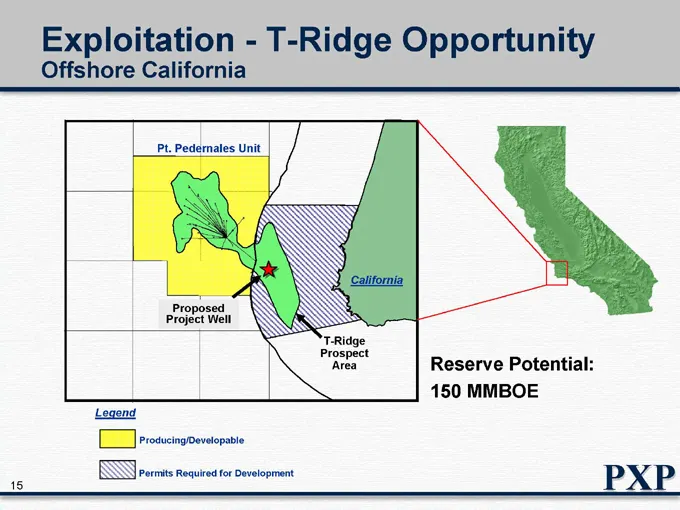
Exploitation - T-Ridge Opportunity Offshore California Pt. Pedernales Unit Proposed Project Well California T-Ridge Prospect Area Reserve Potential: 150 MMBOE Legend Producing/Developable Permits Required for Development
Slide 16: Exploitation: South Louisiana
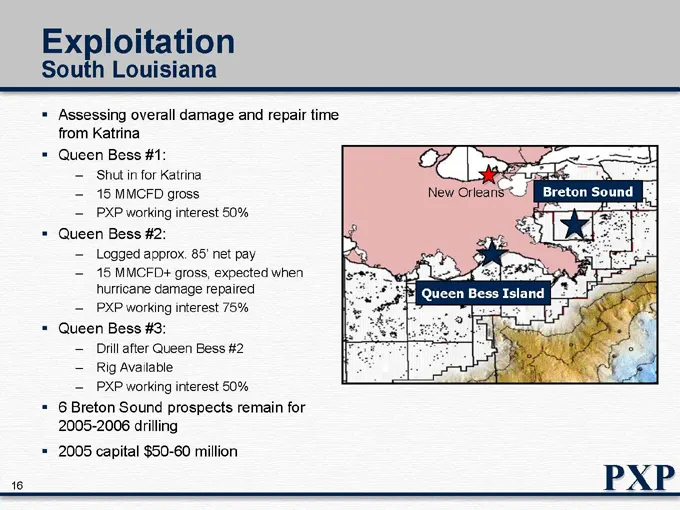
Exploitation South Louisiana Assessing overall damage and repair time from Katrina Queen Bess #1: Shut in for Katrina 15 MMCFD gross PXP working interest 50% Queen Bess #2: Logged approx. 85’ net pay 15 MMCFD+ gross, expected when hurricane damage repaired PXP working interest 75% Queen Bess #3: Dri
Slide 17: Estimated Capital Allocation
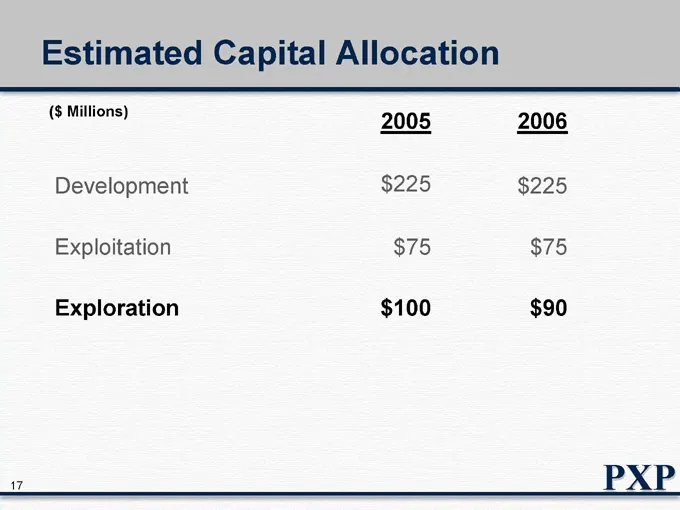
Estimated Capital Allocation ($ Millions) 2005 2006 Development $225 $225 Exploitation $75 $75 Exploration $100 $90
Slide 18: Exploration
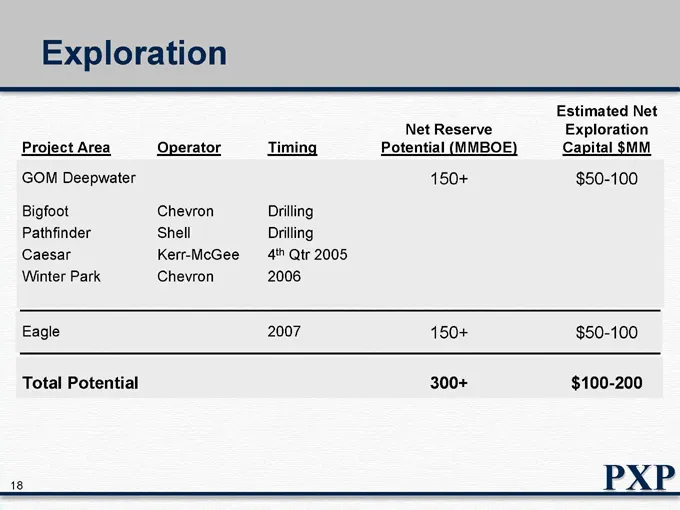
Exploration Project Area Operator Timing Net Reserve Potential (MMBOE) Estimated Net Exploration Capital $MM GOM Deepwater 150+ $50-100 Bigfoot Chevron Drilling Pathfinder Shell Drilling Caesar Kerr-McGee 4th Qtr 2005 Winter Park Chevron 2006 Eagle 2007 150+ $50-100 Total Potential 300+ $100-200
Slide 19: Exploration: L/M Miocene Trend
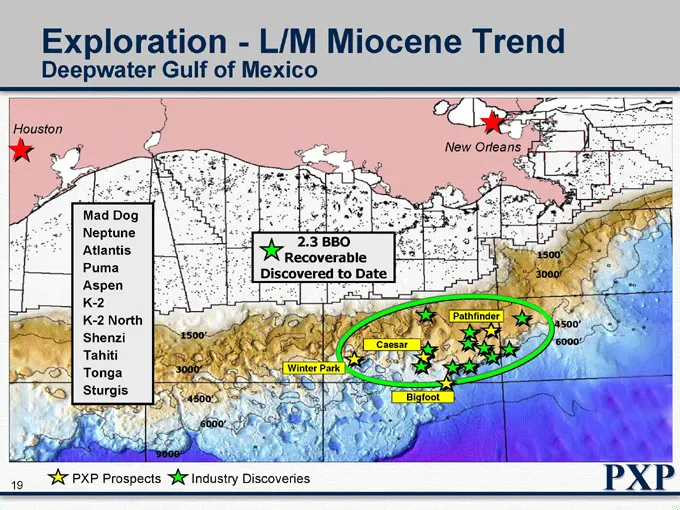
Exploration—L/M Miocene Trend Deepwater Gulf of Mexico Houston Mad Dog Neptune Atlantis Puma Aspen K-2 K-2 North Shenzi Tahiti Tonga Sturgis 2.3 BBO Recoverable Discovered to Date New Orleans 1500’ 3000’ 4500’ 6000’ Winter Park Caesar Pathfinder Bigfoot 1500’ 3000’ 4500’ 6000’ PXP Prospects Industry
Slide 20: Exploration: Caesar Prospect
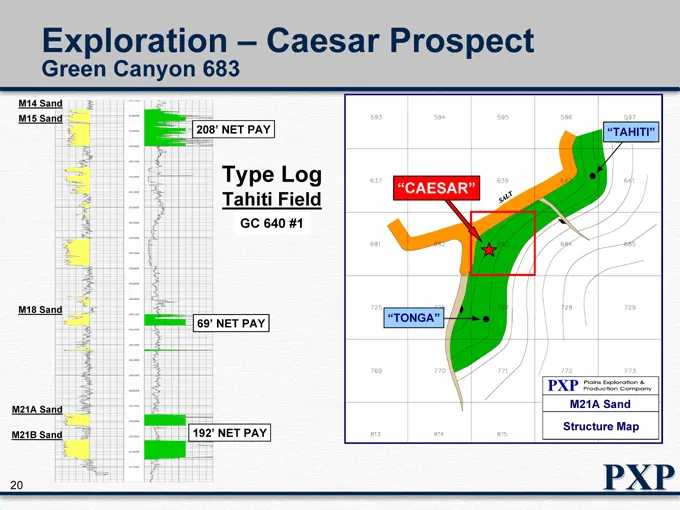
Exploration – Caesar Prospect Green Canyon 683 M14 Sand M15 Sand M18 Sand M21A Sand M21B Sand 208’ NET PAY Type Log Tahiti Field GC 640 #1 69’ NET PAY 192’ NET PAY “CAESAR” “TAHITI” “TONGA” M21A Sand Structure Map
Slide 21: Exploration: Eagle Opportunity
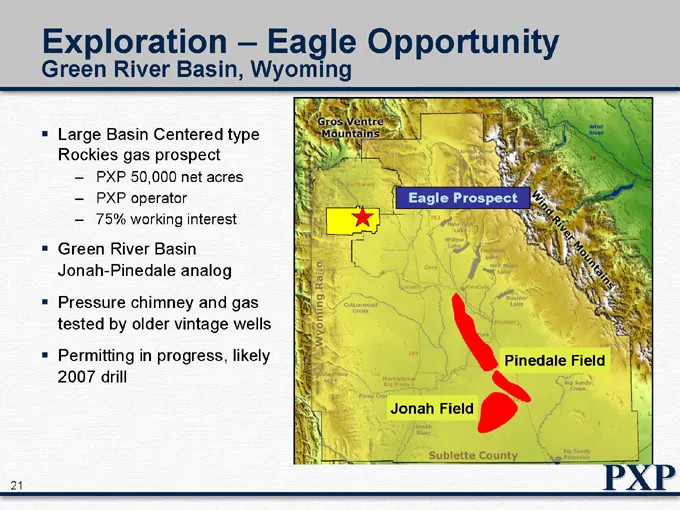
Exploration – Eagle Opportunity Green River Basin, Wyoming Large Basin Centered type Rockies gas prospect PXP 50,000 net acres PXP operator 75% working interest Green River Basin Jonah-Pinedale analog Pressure chimney and gas tested by older vintage wells Permitting in progress, likely 2007 drill Ea
Slide 22: Exploration: Eagle Opportunity
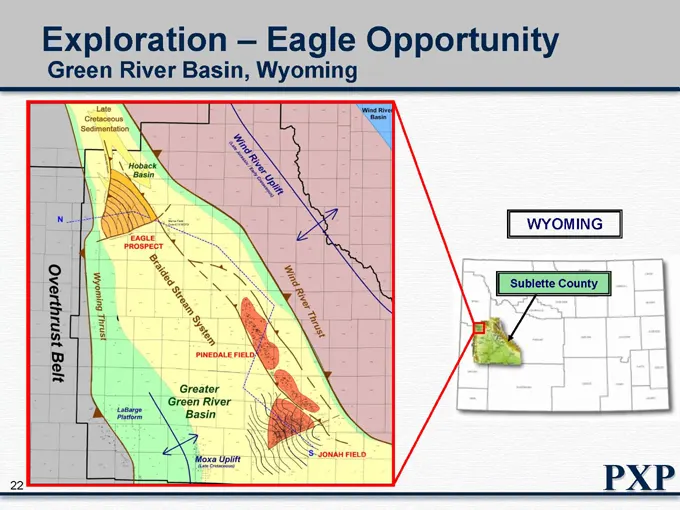
Exploration – Eagle Opportunity Green River Basin, Wyoming WYOMING Sublette County
Slide 23: Exploration: Eagle Opportunity
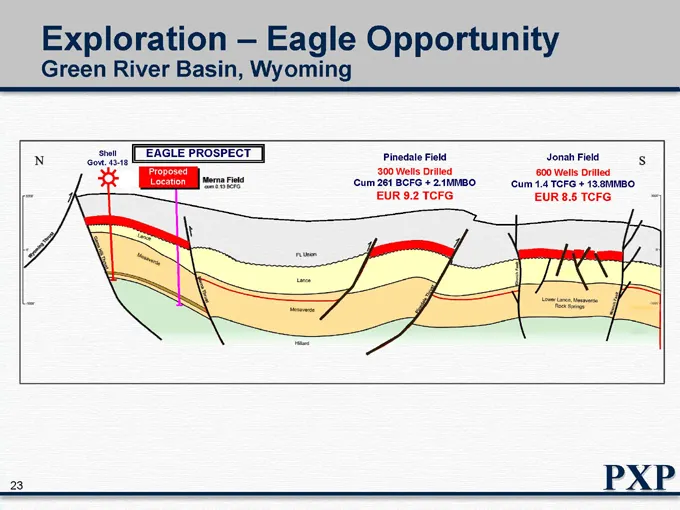
Exploration – Eagle Opportunity Green River Basin, Wyoming Shell Govt. 43-18 EAGLE PROSPECT Proposed Location Pinedale Field 300 Wells Drilled Cum 261 BCFG + 2.1MMBO EUR 9.2 TCFG Jonah Field 600 Wells Drilled Cum 1.4 TCFG + 13.8MMBO EUR 8.5 TCFG
Slide 24: Exploration: Eagle Opportunity
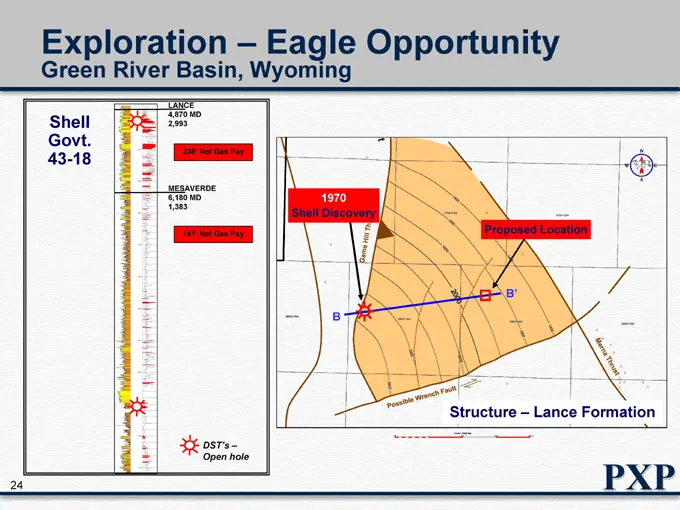
Exploration – Eagle Opportunity Green River Basin, Wyoming Shell Govt. 43-18 LANCE 4,870 MD 2,993 238’ Net Gas Pay MESAVERDE 6,180 MD 1,383 141’ Net Gas Pay DST’s – Open hole Shell Discovery Proposed Location Structure – Lance Formation
Slide 25: Exploration: Eagle Opportunity Jonah Field Strat Section
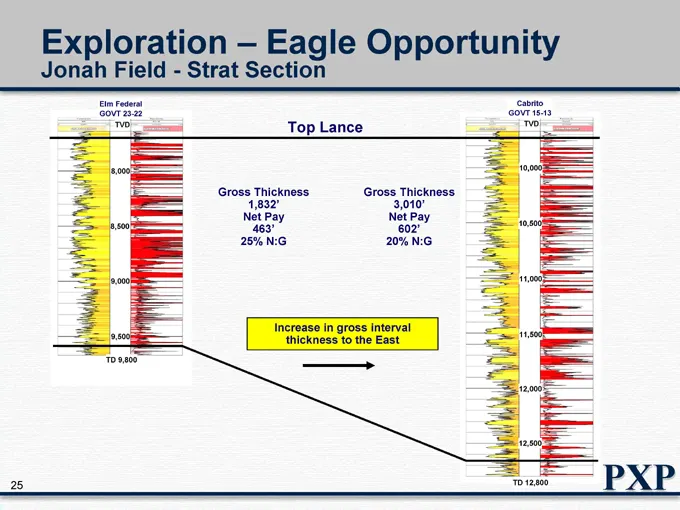
Exploration – Eagle Opportunity Jonah Field - Strat Section Elm Federal GOVT 23-22 TVD 8,000 8,500 9,000 9,500 TD 9,800 Top Lance Gross Thickness 1,832’ Net Pay 463’ 25% N:G Gross Thickness 3,010’ Net Pay 602’ 20% N:G Increase in gross interval thickness to the East Cabrito GOVT 15-13 TVD 10,000 10,
Slide 26: Exploration: Eagle Opportunity Strat Section
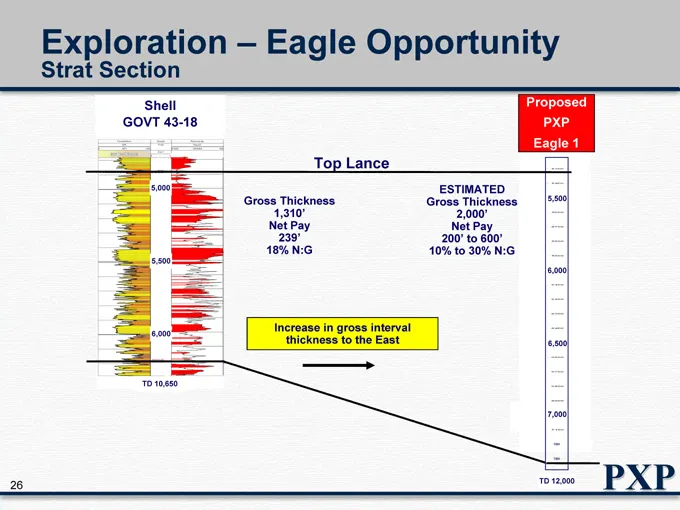
Exploration – Eagle Opportunity Strat Section Shell GOVT 43-18 5,000 5,500 6,000 TD 10,650 Top Lance Gross Thickness 1,310’ Net Pay 239’ 18% N:G ESTIMATED Gross Thickness 2,000’ Net Pay 200’ to 600’ 10% to 30% N:G Proposed PXP Eagle 1 Increase in gross interval thickness to the East 5,500 6,000 6,50
Slide 27: Estimated Capital Allocation
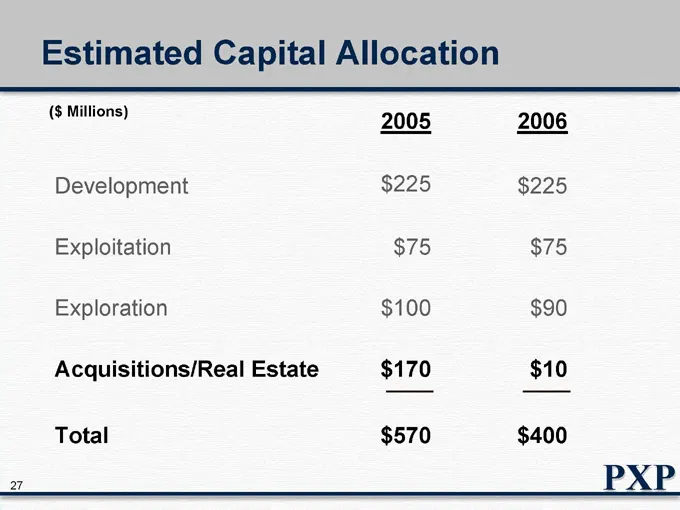
Estimated Capital Allocation ($ Millions) 2005 2006 Development $225 $225 Exploitation $75 $75 Exploration $100 $90 Acquisitions/Real Estate $170 $10 Total $570 $400
Slide 28: Financial Drivers
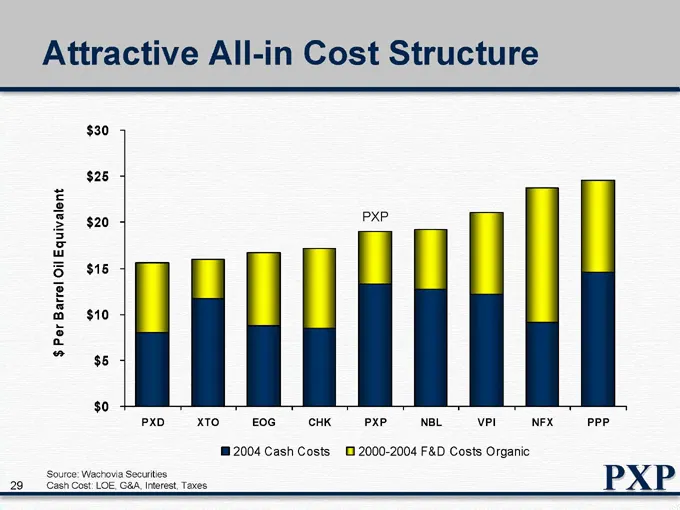
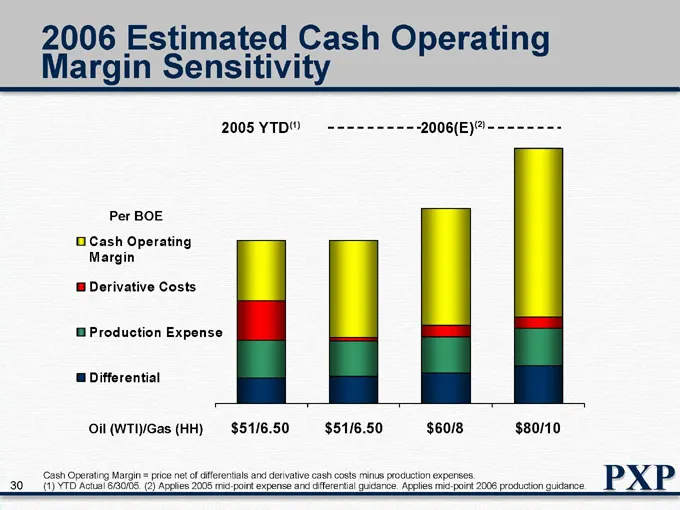
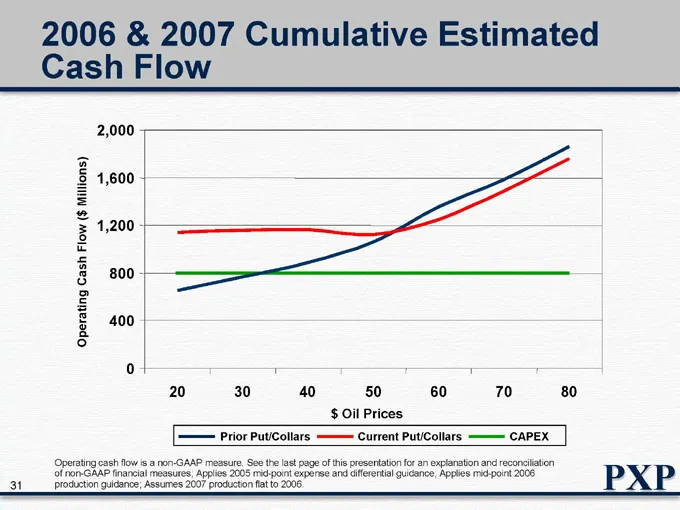
Financial Drivers Attractive all-in cost structure Improved oil price exposure resulting in higher realizations and margins Substantial free cash flow at current commodity prices
Slide 29: Attractive All-in Cost Structure
Attractive All-in Cost Structure $ Per Barrel Oil Equivalent $30 $25 $20 $15 $10 $5 $0 PXD XTO EOG CHK PXP NBL VPI NFX PPP Cash Costs 2000-2004 F&D Costs Organic Source: Wachovia Securities Cash Cost: LOE, G&A, Interest, Taxes
Slide 30: 2006 Estimated Cash Operating Margin Sensitivity
2006 Estimated Cash Operating Margin Sensitivity 2005 YTD(1) 2006(E)(2) Per BOE Cash Operating Margin Derivative Costs Production Expense Differential Oil (WTI)/Gas (HH) $51/6.50 $51/6.50 $60/8 $80/10 Cash Operating Margin = price net of differentials and derivative cash costs minus production expen
Slide 31: Cumulative Estimated Cash Flow 2006 & 2007
2006 & 2007 Cumulative Estimated Cash Flow 2,000 1,600 1,200 800 400 0 20 30 40 50 60 70 80 Operating Cash Flow ($ Millions) $ Oil Prices Prior Put/Collars Current Put/Collars CAPEX Operating cash flow is a non-GAAP measure. See the last page of this presentation for an explanation and reconciliatio
Slide 32: Cash Flow Allocation Opportunities
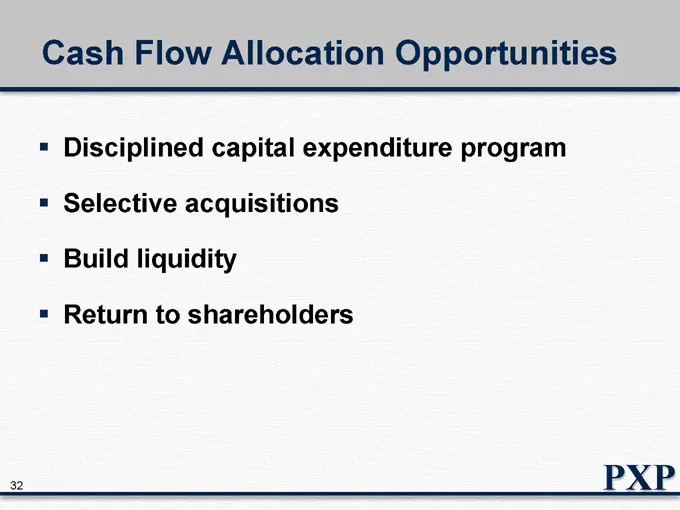
Cash Flow Allocation Opportunities Disciplined capital expenditure program Selective acquisitions Build liquidity Return to shareholders
Slide 33: Value Creation Strategy
Value Creation Strategy Focus on core geographic areas to maximize free cash flow Allocate free cash flow to maximize per share growth
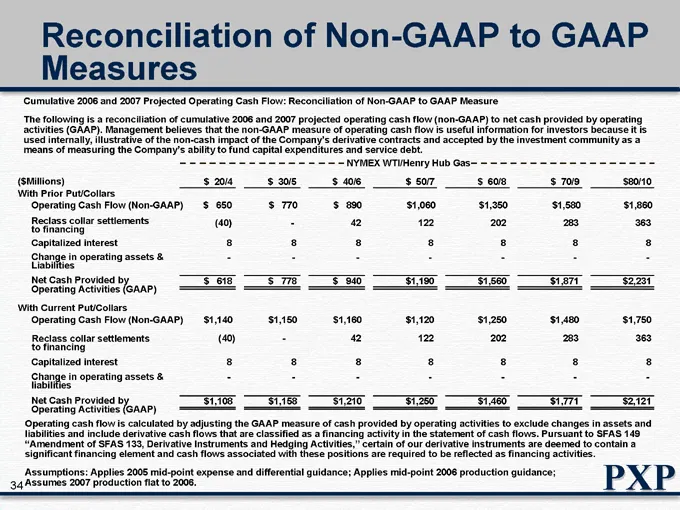
Slide 34: Reconciliation of Non-GAAP to GAAP Measures
Reconciliation of Non-GAAP to GAAP Measures Cumulative 2006 and 2007 Projected Operating Cash Flow: Reconciliation of Non-GAAP to GAAP Measure The following is a reconciliation of cumulative 2006 and 2007 projected operating cash flow (non-GAAP) to net cash provided by operating activities (GAAP). M
Slide 35: Lehman Brothers 2005 CEO Energy/Power Conference
Lehman Brothers 2005 CEO Energy/Power Conference September 2005 N Y S E : P X P w w w . p l a i n s x p . c o m
Source: SEC EDGAR · 8-K filed Sep 6, 2005
More decks from Plains Exploration & Production Company
 Global Metals, Mining & Steel Conference 201333 slides · May 14, 2013
 Q1 2013 Earnings Presentation46 slides · Apr 19, 2013
 Merger or Acquisition (February 2013)35 slides · Feb 25, 2013
 2013 Credit Suisse Energy Summit10 slides · Feb 5, 2013
 Merger or Acquisition (January 2013)30 slides · Jan 17, 2013
 Credit Suisse 2012 Energy Summit32 slides · Feb 7, 2012