DEX ONE — R.H. Donnelley — CSFB Leveraged Finance Media and Telecom Conference 2005
46 slides from DEX ONE's conference presentation, Nov 18, 2005

Slide 1: CSFB Leveraged Finance Media and Telecom Conference November 18, 2005
CSFB Leveraged Finance Media and Telecom Conference November 18, 2005
Slide 2: Safe Harbor Statement
Safe Harbor Statement Certain statements contained in this presentation regarding RHD's future operating results or performance or business plans or prospects and any other statements not constituting historical fact are "forward-looking statements" subject to the safe harbor created by the Private

Slide 3: Executive Summary
Executive Summary
Slide 4: Pro Forma Overview
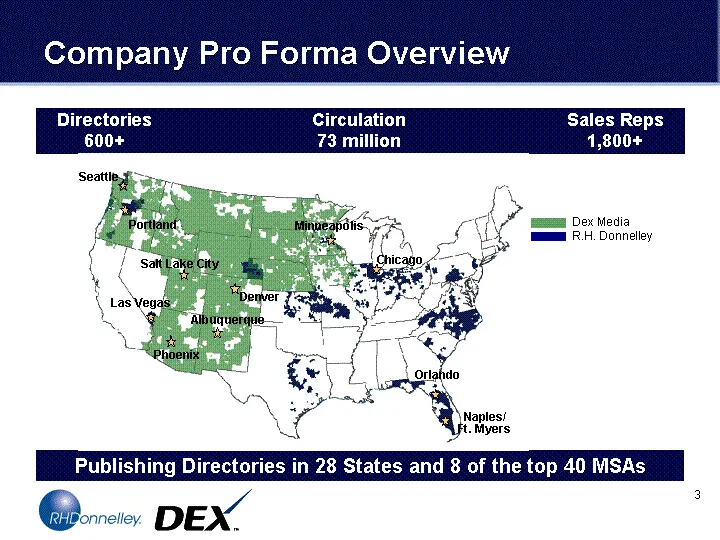
Publishing Directories in 28 States and 8 of the top 40 MSAs Directories 600+ Circulation 73 million Sales Reps 1,800+ Chicago Orlando Naples/ Ft. Myers Las Vegas Phoenix Albuquerque Seattle Denver Salt Lake City Portland Minneapolis Dex Media R.H. Donnelley Company Pro Forma Overview
Slide 5: Acquisition history and timeline
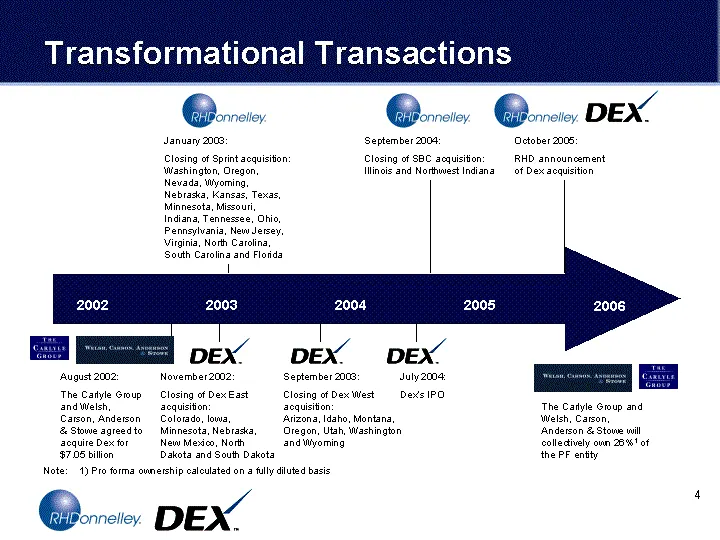
November 2002: Closing of Dex East acquisition: Colorado, Iowa, Minnesota, Nebraska, New Mexico, North Dakota and South Dakota September 2003: Closing of Dex West acquisition: Arizona, Idaho, Montana, Oregon, Utah, Washington and Wyoming September 2004: Closing of SBC acquisition: Illinois and North
Slide 6: Key Credit Considerations
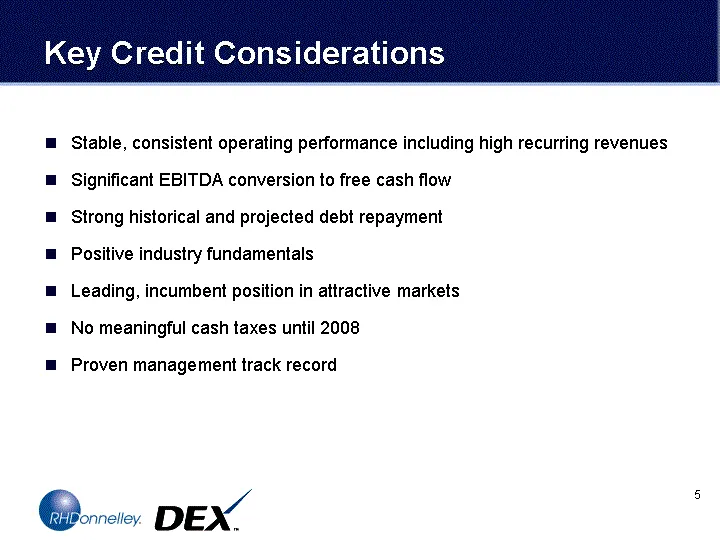
Key Credit Considerations Stable, consistent operating performance including high recurring revenues Significant EBITDA conversion to free cash flow Strong historical and projected debt repayment Positive industry fundamentals Leading, incumbent position in attractive markets No meaningful cash taxe
Slide 7: Key Transaction Terms
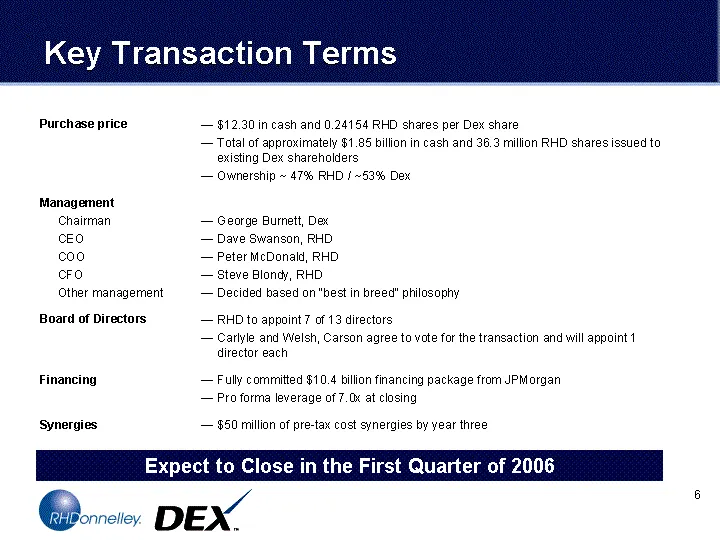
Expect to Close in the First Quarter of 2006 Purchase price - $12.30 in cash and 0.24154 RHD shares per Dex share - Total of approximately $1.85 billion in cash and 36.3 million RHD shares issued to existing Dex shareholders - Ownership ~ 47% RHD / ~53% Dex Management Chairman - George Burnett, Dex
Slide 8: Acquisition Rationale
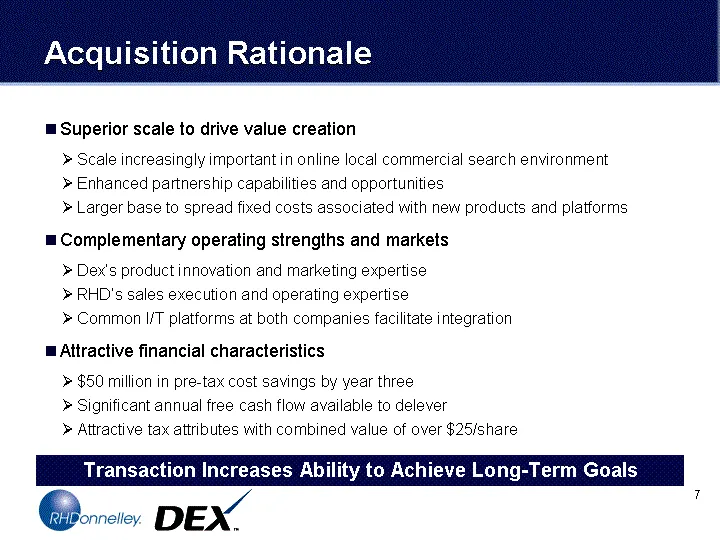
Acquisition Rationale Superior scale to drive value creation Scale increasingly important in online local commercial search environment Enhanced partnership capabilities and opportunities Larger base to spread fixed costs associated with new products and platforms Complementary operating strengths a
Slide 9: Creates The Third Largest U.S. Directory Publisher
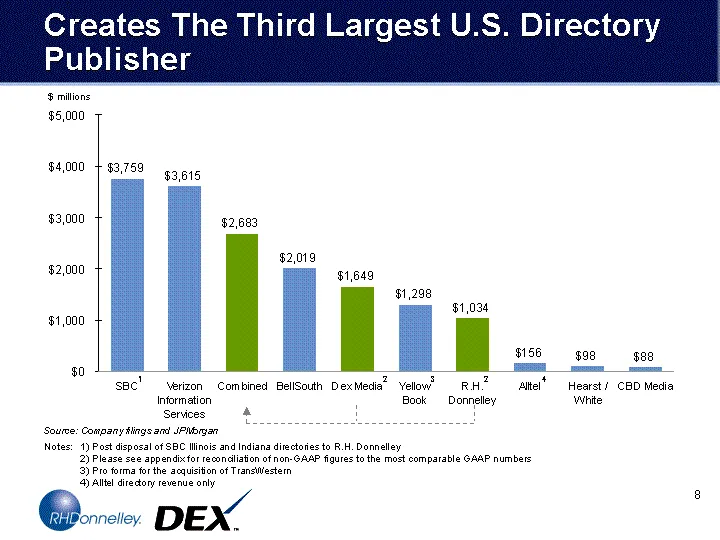
Creates The Third Largest U.S. Directory Publisher Notes: 1) Post disposal of SBC Illinois and Indiana directories to R.H. Donnelley 2) Please see appendix for reconciliation of non-GAAP figures to the most comparable GAAP numbers 3) Pro forma for the acquisition of TransWestern 4) Alltel directory

Slide 10: Industry Overview
Industry Overview
Slide 11: Strong Industry Fundamentals
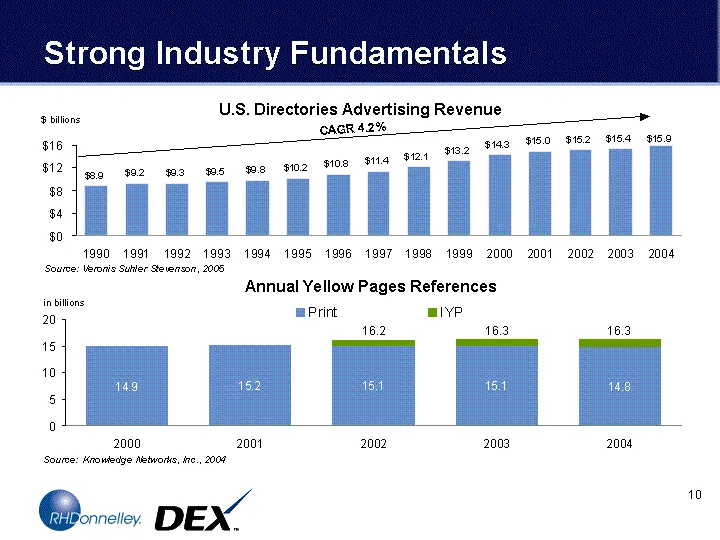
Revenue 1990 8.9 1991 9.2 1992 9.3 1993 9.5 1994 9.8 1995 10.2 1996 10.8 1997 11.4 1998 12.1 1999 13.2 2000 14.3 2001 15 2002 15.2 2003 15.36 2004 15.928 Source: Veronis Suhler Stevenson, 2005 Strong Industry Fundamentals $ billions U.S. Directories Advertising Revenue CAGR 4.2% in billions Print IY
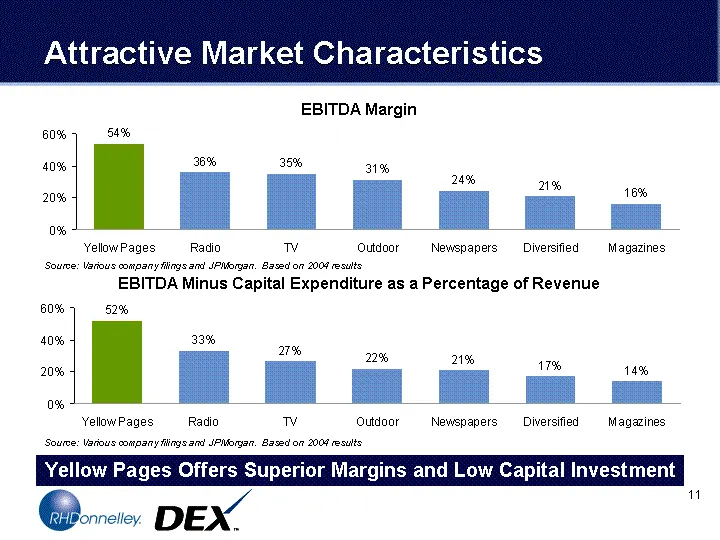
Slide 12: Yellow Pages Offers Superior Margins and Low Capital Investment
Industry Avg. EBITDA Margin Yellow Pages 0.538 Radio 0.361 TV 0.35 Outdoor 0.314 Newspapers 0.242 Diversified 0.21 Magazines 0.163 Source: Various company filings and JPMorgan. Based on 2004 results Industry Avg. EBITDA Margin Yellow Pages 0.52 Radio 0.333 TV 0.268 Outdoor 0.22 Newspapers 0.21 Diver
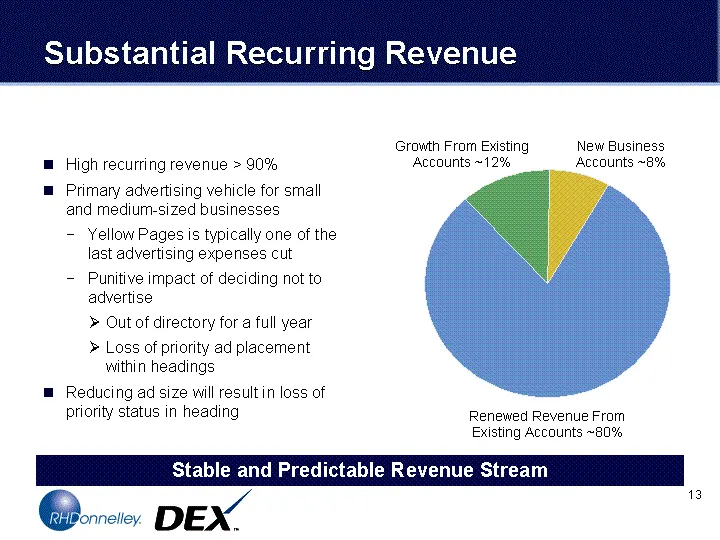
Slide 13: Stable and Predictable Revenue Stream
High recurring revenue > 90% Primary advertising vehicle for small and medium-sized businesses Yellow Pages is typically one of the last advertising expenses cut Punitive impact of deciding not to advertise Out of directory for a full year Loss of priority ad placement within headings Reducing ad si
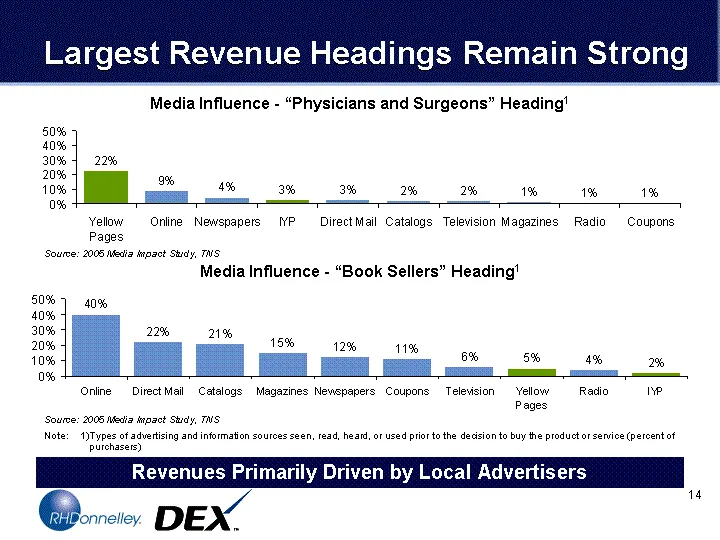
Slide 14: Revenues Primarily Driven by Local Advertisers
Largest Revenue Headings Remain Strong Media Influence - "Physicians and Surgeons" Heading1 Yellow Pages 0.22 Online 0.088 Newspapers 0.04 IYP 0.028 Direct Mail 0.025 Catalogs 0.015 Television 0.015 Magazines 0.012 Radio 0.006 Coupons 0.005 Note: 1) Types of advertising and information sources seen,
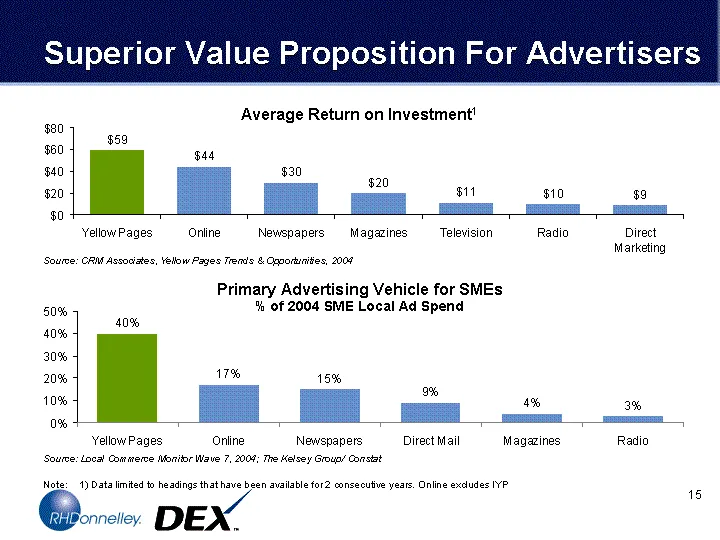
Slide 15: Superior Value Proposition For Advertisers
Average Return on Investment1 Superior Value Proposition For Advertisers Yellow Pages Online Newspapers Magazines Television Radio Direct Marketing Annual Revenue 59 44 30 20 11 10 9 Primary Advertising Vehicle for SMEs Source: Local Commerce Monitor Wave 7, 2004; The Kelsey Group/ Constat % of 2004

Slide 16: Company Overview
Company Overview
Slide 17: Business Highlights - RHD
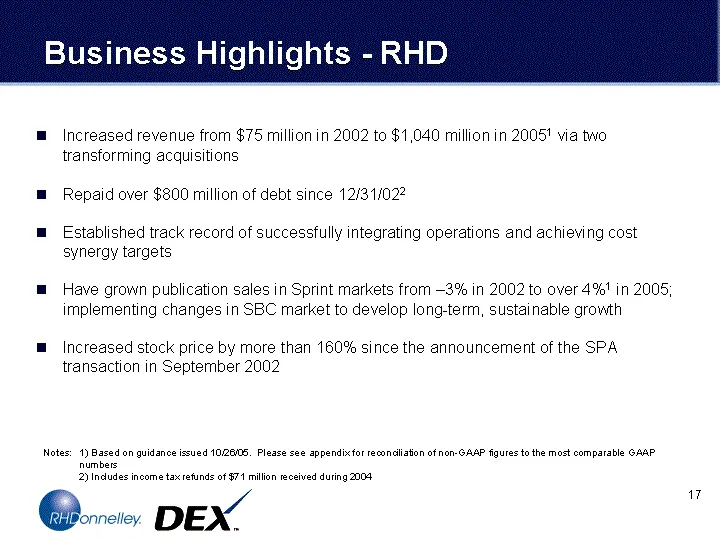
Business Highlights - RHD Increased revenue from $75 million in 2002 to $1,040 million in 20051 via two transforming acquisitions Repaid over $800 million of debt since 12/31/022 Established track record of successfully integrating operations and achieving cost synergy targets Have grown publication
Slide 18: Business Highlights - Dex
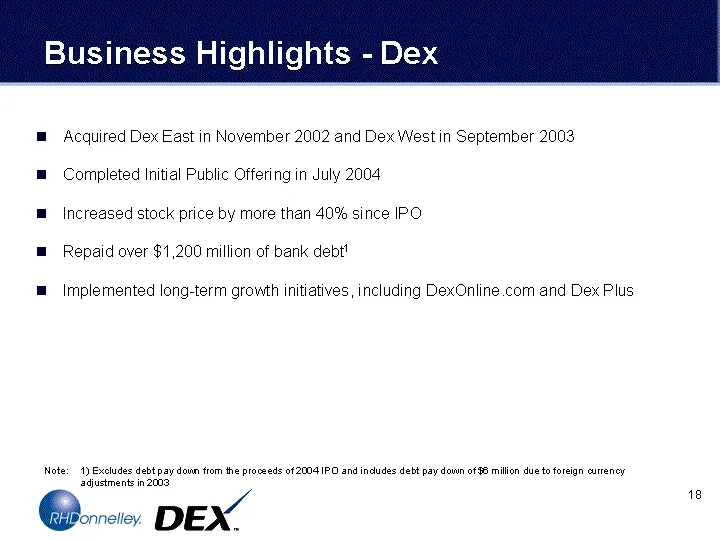
Business Highlights - Dex Acquired Dex East in November 2002 and Dex West in September 2003 Completed Initial Public Offering in July 2004 Increased stock price by more than 40% since IPO Repaid over $1,200 million of bank debt1 Implemented long-term growth initiatives, including DexOnline.com and D
Slide 19: Expand Digitally
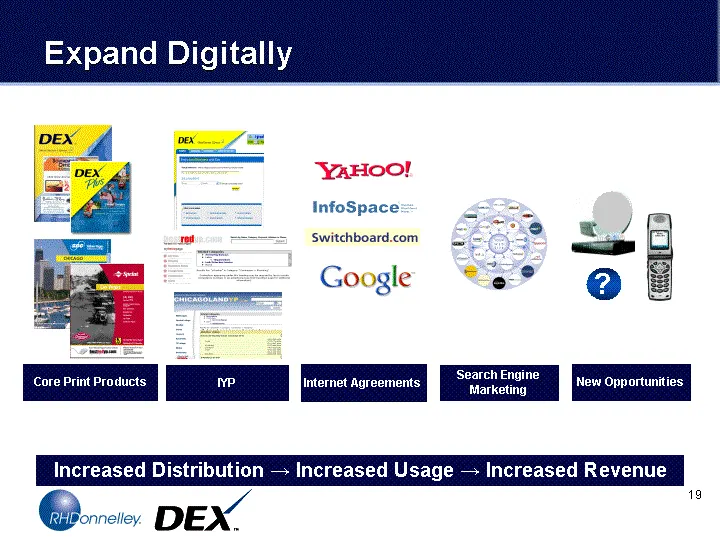
Expand Digitally Core Print Products Internet Agreements Search Engine Marketing IYP New Opportunities ? Increased Distribution ^ Increased Usage ^ Increased Revenue
Slide 20: Dex Media's Online Leadership
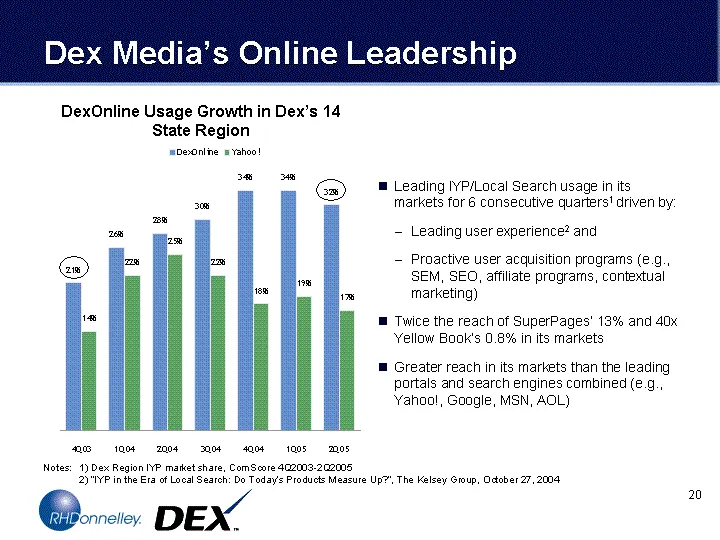
DexOnline Yahoo! Column 3 Column 4 Column 5 Column 6 Column 7 Column 8 Column 9 Column 10 Column 11 Column 12 Column 13 Column 14 Column 15 Column 16 4Q03 0.21 0.14 1Q04 0.26 0.22 2Q04 0.28 0.25 3Q04 0.3 0.22 4Q04 0.34 0.18 1Q05 0.34 0.19 2Q05 0.32 0.17 Leading IYP/Local Search usage in its markets
Slide 21: Dex's Extensive Distribution Agreements
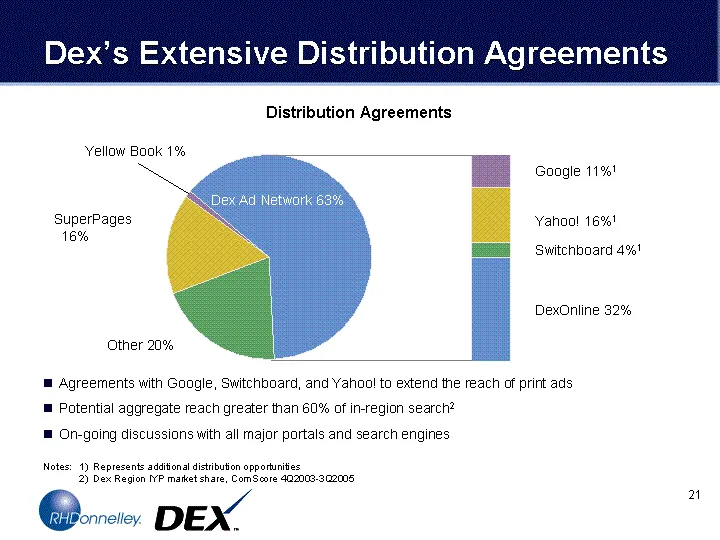
Agreements with Google, Switchboard, and Yahoo! to extend the reach of print ads Potential aggregate reach greater than 60% of in-region search2 On-going discussions with all major portals and search engines 2002 0.63 2003 0.2 2004 0.16 2005 0.01 Slice 6 Slice 7 Slice 8 Slice 9 Slice 10 Slice 11 Sli

Slide 22: Financial Update
Financial Update
Slide 23: Notes: 1) Revenue and Adj. EBITDA are adjusted to eliminate effects of purchase accounting
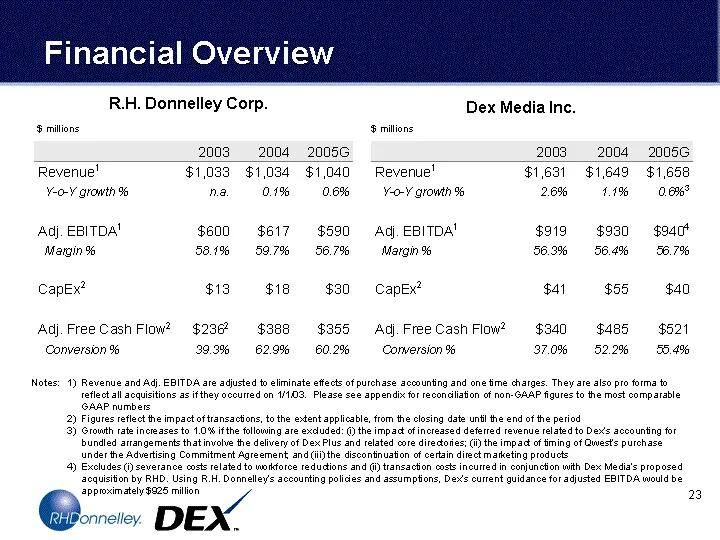
Notes: 1) Revenue and Adj. EBITDA are adjusted to eliminate effects of purchase accounting and one time charges. They are also pro forma to reflect all acquisitions as if they occurred on 1/1/03. Please see appendix for reconciliation of non-GAAP figures to the most comparable GAAP numbers 2) Figure
Slide 24: Strong Track Record Of Debt Repayment
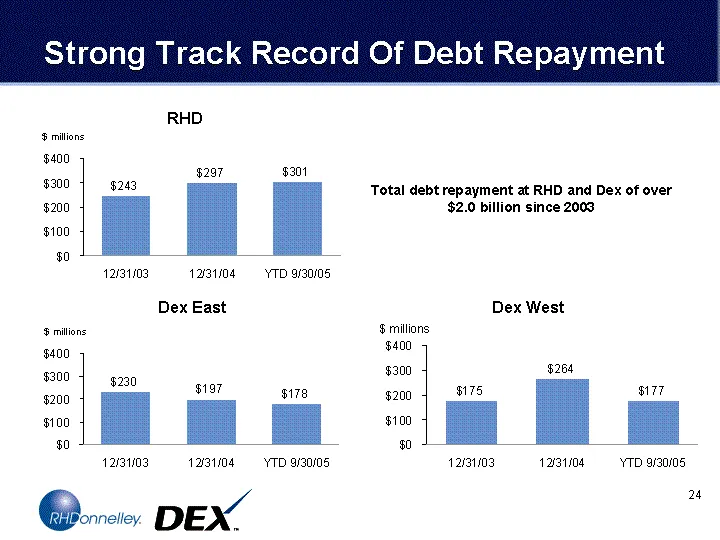
$ millions Date Column 3 Column 4 Column 5 Column 6 Column 7 Column 8 Column 9 Column 10 Column 11 Column 12 Column 13 Column 14 Column 15 Column 16 12/31/2003 243 12/31/2004 297 YTD 9/30/05 301 Total debt repayment at RHD and Dex of over $2.0 billion since 2003 Date 12/31/2003 175 12/31/2004 263.99
Slide 25: Exceptional Cash Flow: Valuable Tax Benefits
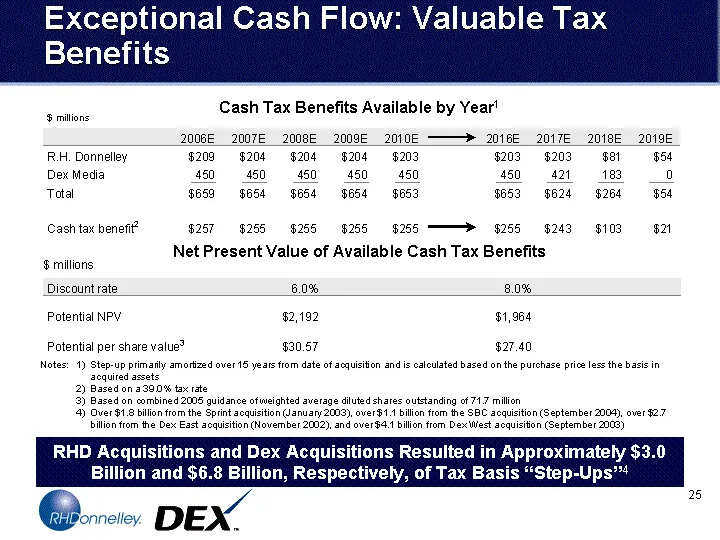
Notes: 1) Step-up primarily amortized over 15 years from date of acquisition and is calculated based on the purchase price less the basis in acquired assets 2) Based on a 39.0% tax rate 3) Based on combined 2005 guidance of weighted average diluted shares outstanding of 71.7 million 4) Over $1.8 bil
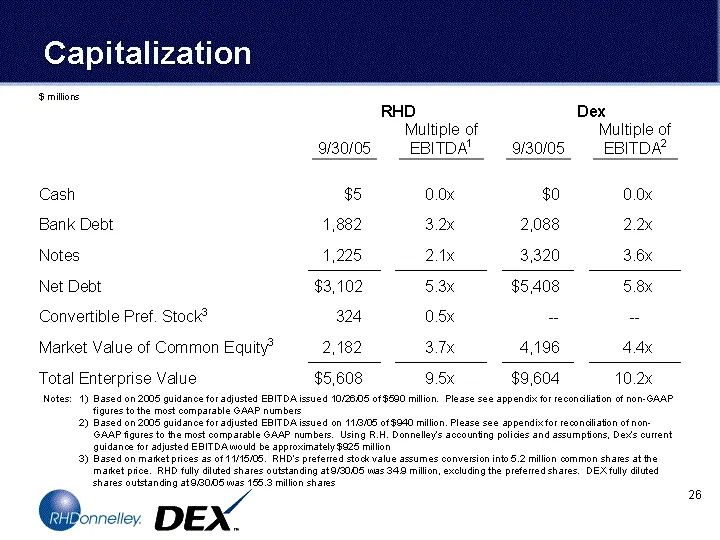
Slide 26: Capitalization
Capitalization $ millions RHD Dex Multiple of Multiple of 9/30/05 EBITDA1 9/30/05 EBITDA2 Cash $5 0.0x $0 0.0x Bank Debt 1,882 3.2x 2,088 2.2x Notes 1,225 2.1x 3,320 3.6x Net Debt $3,102 5.3x $5,408 5.8x Convertible Pref. Stock3 324 0.5x -- -- Market Value of Common Equity3 2,182 3.7x 4,196 4.4x Tot
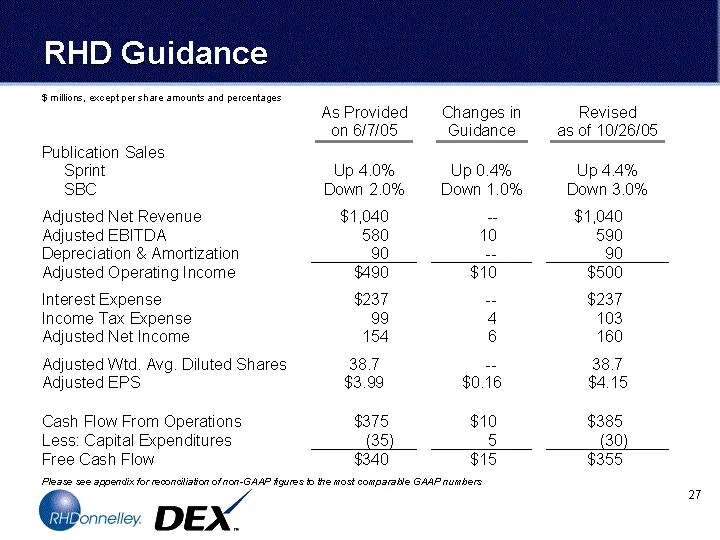
Slide 27: RHD Guidance
RHD Guidance $ millions, except per share amounts and percentages As Provided Changes in Revised on 6/7/05 Guidance as of 10/26/05 Publication Sales Sprint Up 4.0% Up 0.4% Up 4.4% SBC Down 2.0% Down 1.0% Down 3.0% Adjusted Net Revenue $1,040 -- $1,040 Adjusted EBITDA 580 10 590 Depreciation amp; Amo
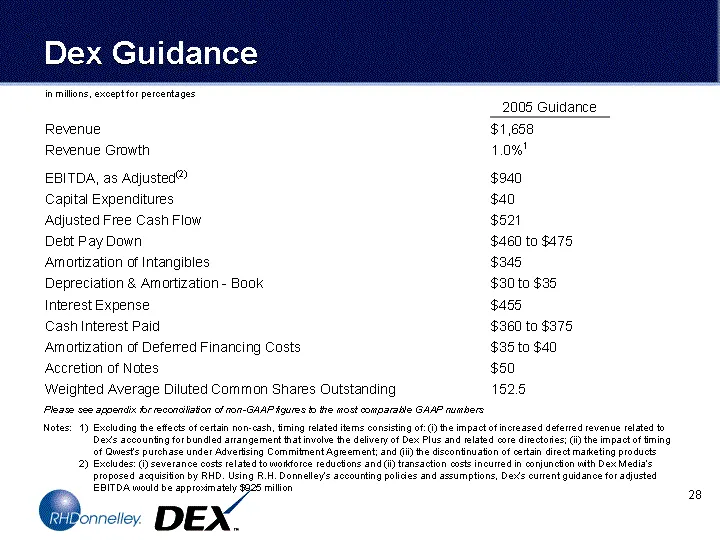
Slide 28: Dex Guidance
Dex Guidance in millions, except for percentages 2005 Guidance Revenue $1,658 Revenue Growth 1.0%1 EBITDA, as Adjusted(2) $940 Capital Expenditures $40 Adjusted Free Cash Flow $521 Debt Pay Down $460 to $475 Amortization of Intangibles $345 Depreciation amp; Amortization - Book $30 to $35 Interest E

Slide 29: Appendix
Appendix
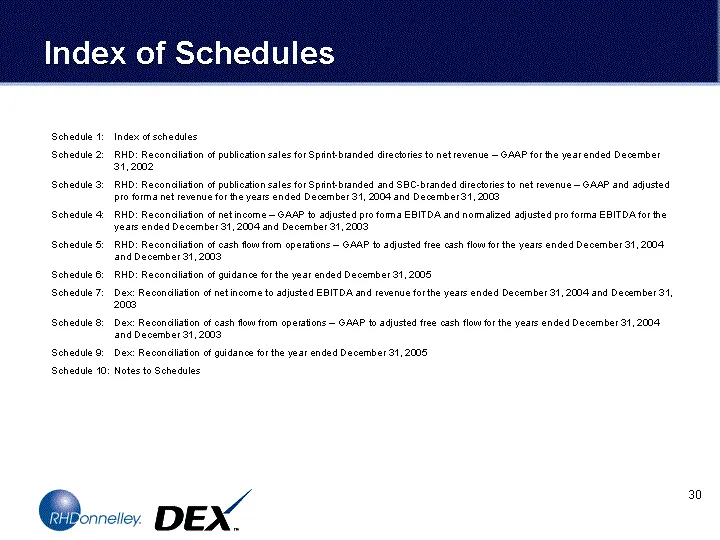
Slide 30: Index of schedules
Schedule 1: Index of schedules Schedule 2: RHD: Reconciliation of publication sales for Sprint-branded directories to net revenue - GAAP for the year ended December 31, 2002 Schedule 3: RHD: Reconciliation of publication sales for Sprint-branded and SBC-branded directories to net revenue - GAAP and
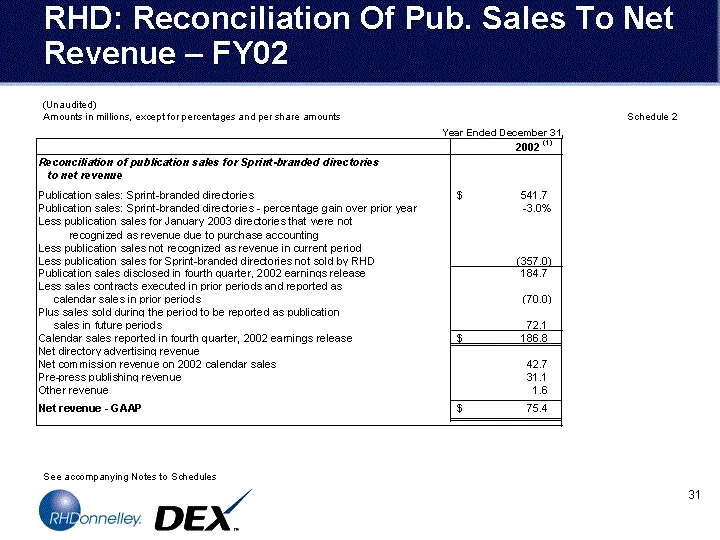
Slide 31: RHD: Reconciliation Of Pub. Sales To Net Revenue - FY02
RHD: Reconciliation Of Pub. Sales To Net Revenue - FY02 (Unaudited) Amounts in millions, except for percentages and per share amounts See accompanying Notes to Schedules Schedule 2
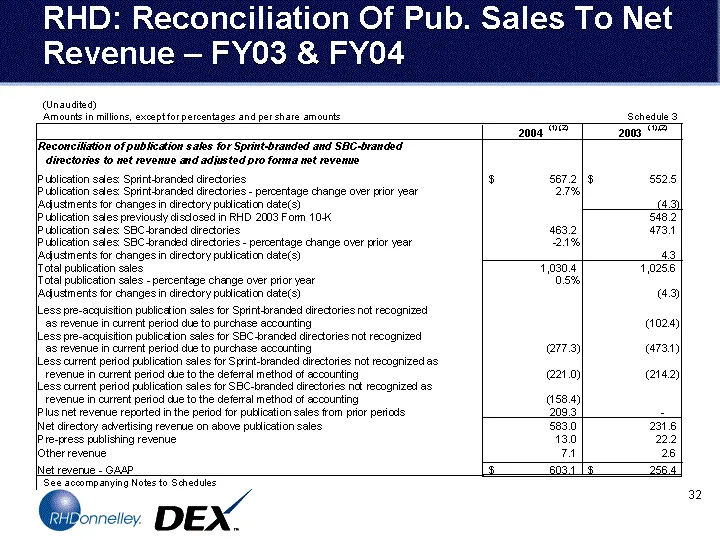
Slide 32: RHD: Reconciliation Of Pub. Sales To Net Revenue - FY03 & FY04
RHD: Reconciliation Of Pub. Sales To Net Revenue - FY03 & FY04 (Unaudited) Amounts in millions, except for percentages and per share amounts See accompanying Notes to Schedules Schedule 3
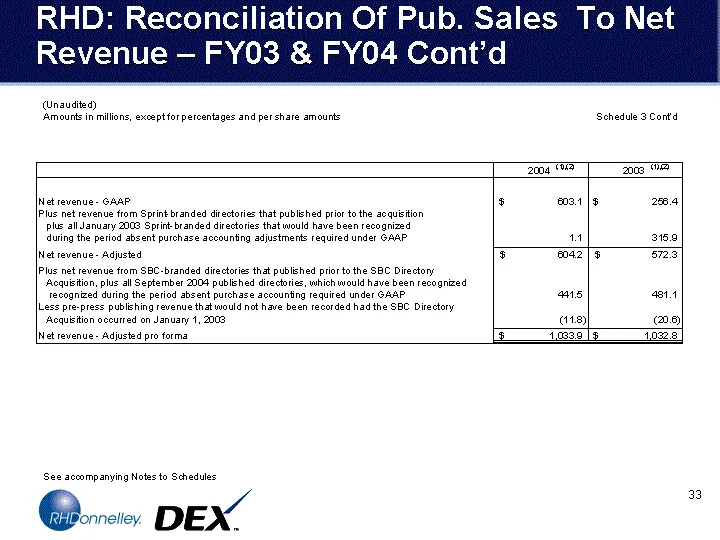
Slide 33: RHD: Reconciliation Of Pub. Sales To Net Revenue - FY03 & FY04 Cont'd
RHD: Reconciliation Of Pub. Sales To Net Revenue - FY03 & FY04 Cont'd (Unaudited) Amounts in millions, except for percentages and per share amounts See accompanying Notes to Schedules Schedule 3 Cont'd
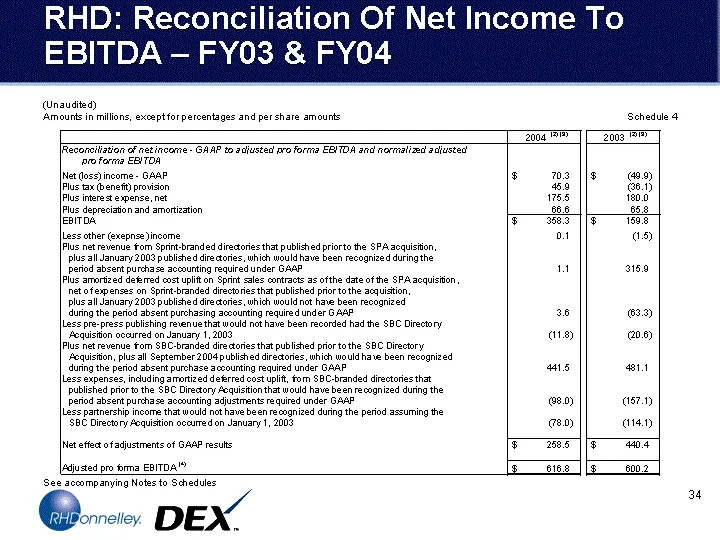
Slide 34: RHD: Reconciliation Of Net Income To EBITDA - FY03 & FY04
RHD: Reconciliation Of Net Income To EBITDA - FY03 & FY04 (Unaudited) Amounts in millions, except for percentages and per share amounts See accompanying Notes to Schedules Schedule 4
Slide 35: RHD: Reconciliation Of Net Income To EBITDA - FY03 & FY04 Cont'd
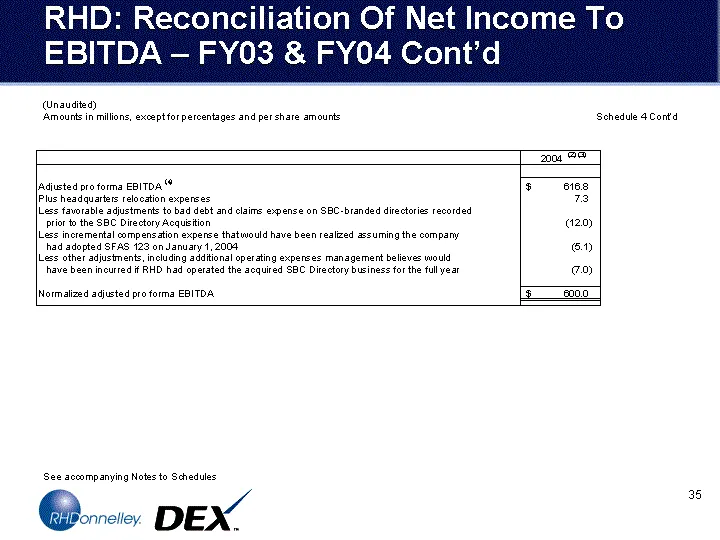
RHD: Reconciliation Of Net Income To EBITDA - FY03 & FY04 Cont'd (Unaudited) Amounts in millions, except for percentages and per share amounts See accompanying Notes to Schedules Schedule 4 Cont'd
Slide 36: RHD: Reconciliation Of Cash Flow From Operations To Adj. FCF
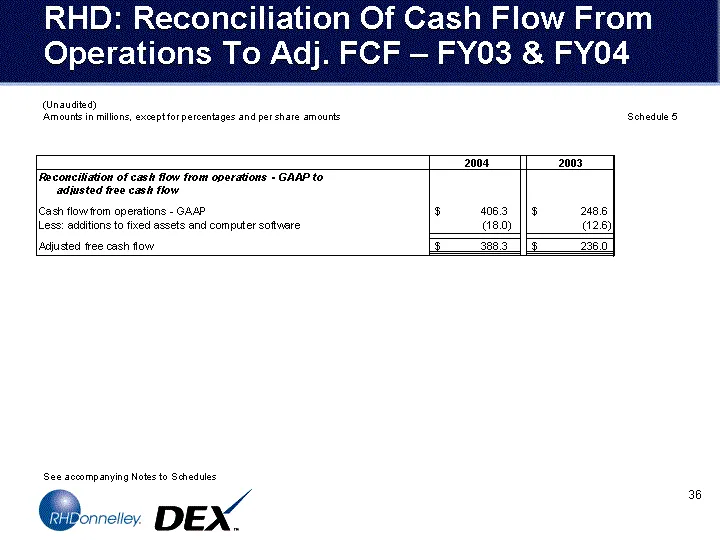
RHD: Reconciliation Of Cash Flow From Operations To Adj. FCF - FY03 & FY04 (Unaudited) Amounts in millions, except for percentages and per share amounts See accompanying Notes to Schedules Schedule 5
Slide 37: RHD: Reconciliation Of Guidance - FY05
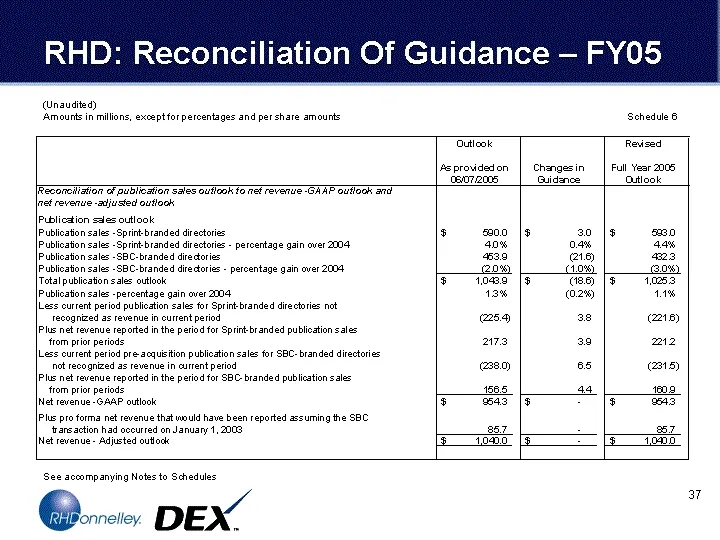
RHD: Reconciliation Of Guidance - FY05 (Unaudited) Amounts in millions, except for percentages and per share amounts See accompanying Notes to Schedules Schedule 6
Slide 38: RHD: Reconciliation Of Guidance - FY05 Cont'd
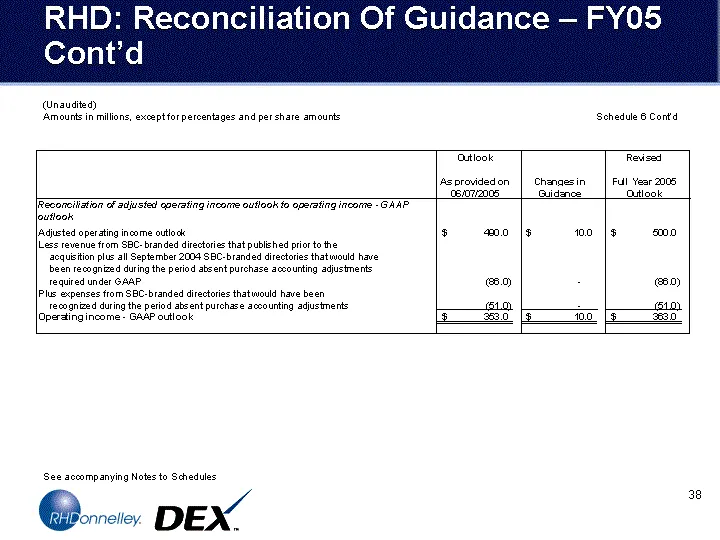
RHD: Reconciliation Of Guidance - FY05 Cont'd (Unaudited) Amounts in millions, except for percentages and per share amounts See accompanying Notes to Schedules Schedule 6 Cont'd
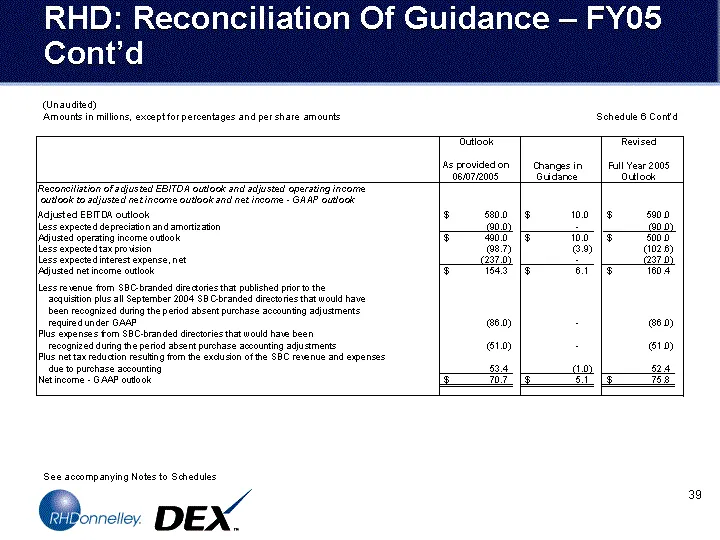
Slide 39: RHD: Reconciliation Of Guidance - FY05 Cont'd
RHD: Reconciliation Of Guidance - FY05 Cont'd (Unaudited) Amounts in millions, except for percentages and per share amounts See accompanying Notes to Schedules Schedule 6 Cont'd
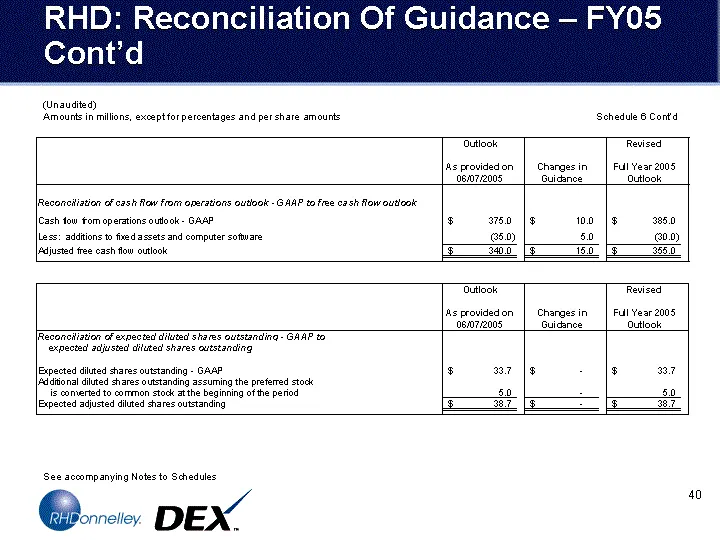
Slide 40: RHD: Reconciliation Of Guidance - FY05 Cont'd
RHD: Reconciliation Of Guidance - FY05 Cont'd (Unaudited) Amounts in millions, except for percentages and per share amounts See accompanying Notes to Schedules Schedule 6 Cont'd
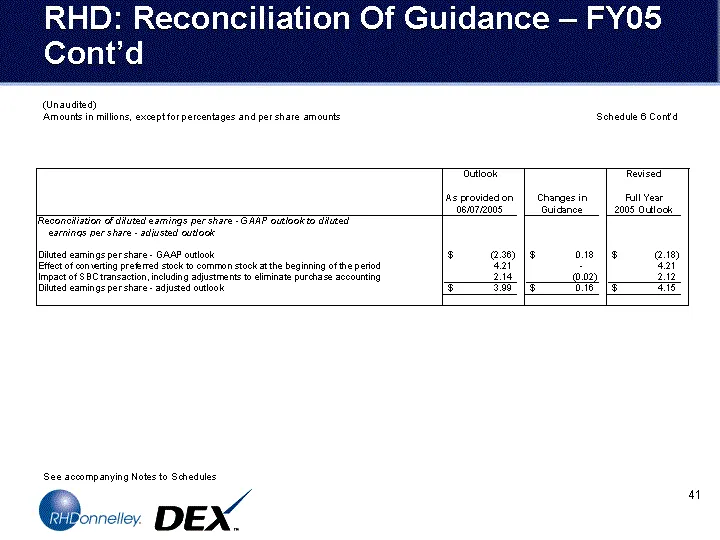
Slide 41: RHD: Reconciliation Of Guidance - FY05 Cont'd
RHD: Reconciliation Of Guidance - FY05 Cont'd (Unaudited) Amounts in millions, except for percentages and per share amounts See accompanying Notes to Schedules Schedule 6 Cont'd
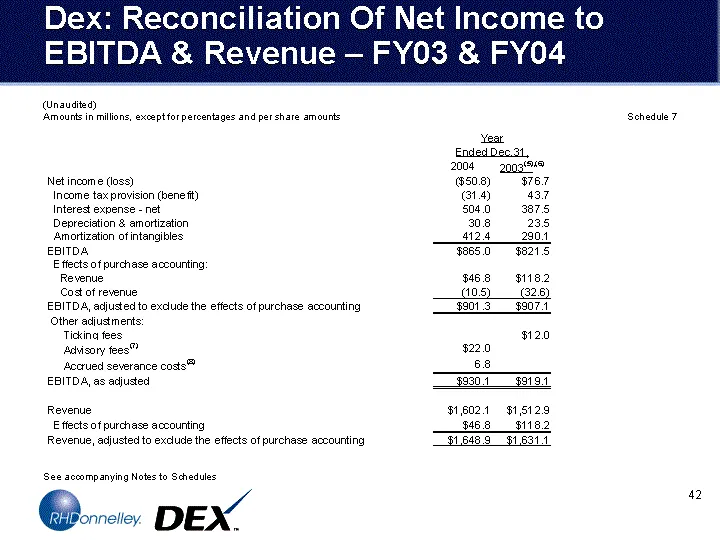
Slide 42: Dex: Reconciliation Of Net Income to EBITDA & Revenue - FY03 & FY04
Dex: Reconciliation Of Net Income to EBITDA & Revenue - FY03 & FY04 (Unaudited) Amounts in millions, except for percentages and per share amounts See accompanying Notes to Schedules Schedule 7
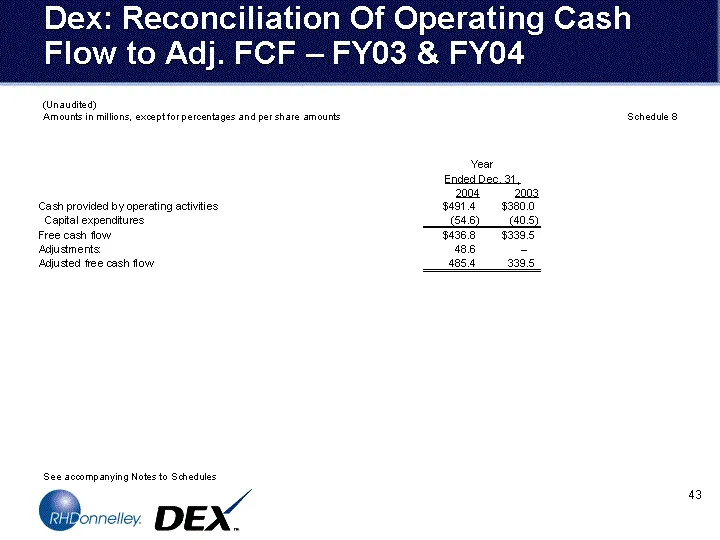
Slide 43: Dex: Reconciliation Of Operating Cash Flow to Adj. FCF - FY03 & FY04
Dex: Reconciliation Of Operating Cash Flow to Adj. FCF - FY03 & FY04 (Unaudited) Amounts in millions, except for percentages and per share amounts See accompanying Notes to Schedules Schedule 8
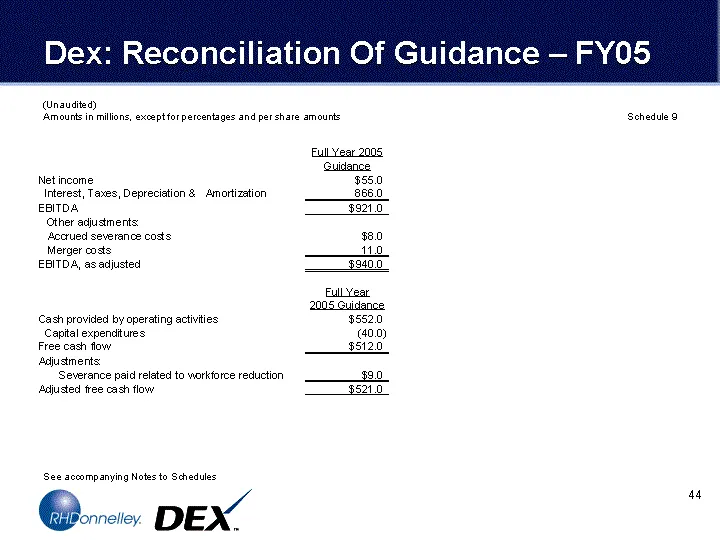
Slide 44: Dex: Reconciliation Of Guidance - FY05
Dex: Reconciliation Of Guidance - FY05 (Unaudited) Amounts in millions, except for percentages and per share amounts See accompanying Notes to Schedules Schedule 9
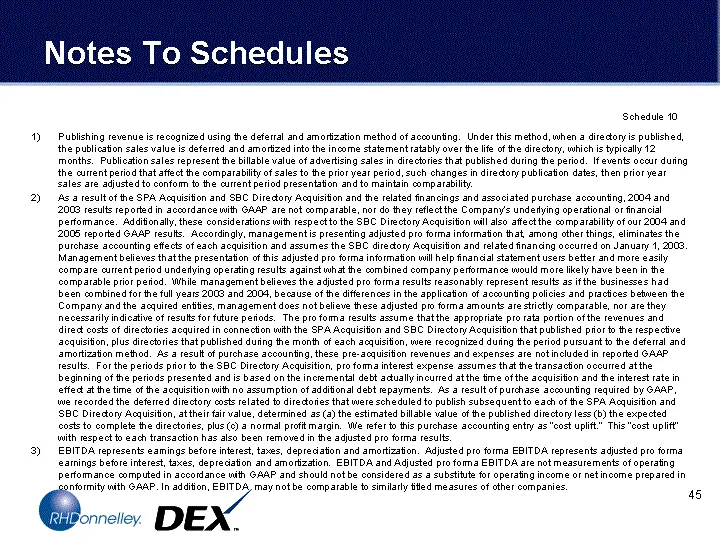
Slide 45: Notes To Schedules
Notes To Schedules Publishing revenue is recognized using the deferral and amortization method of accounting. Under this method, when a directory is published, the publication sales value is deferred and amortized into the income statement ratably over the life of the directory, which is typically 1
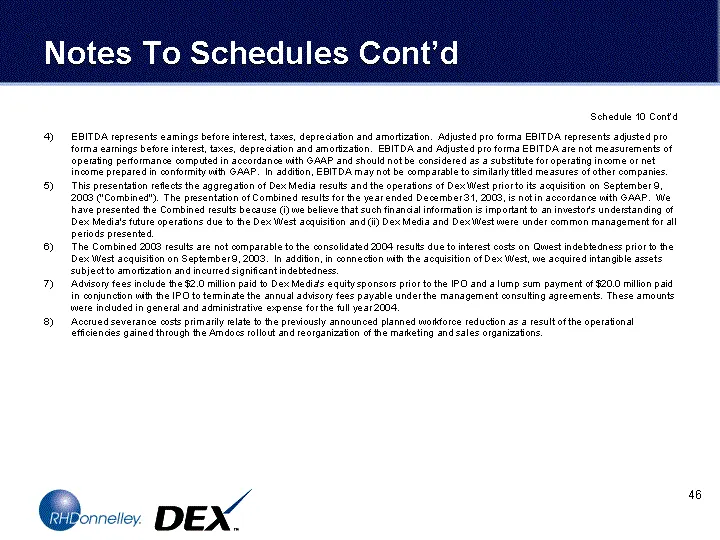
Slide 46: Notes To Schedules Cont'd
Notes To Schedules Cont'd EBITDA represents earnings before interest, taxes, depreciation and amortization. Adjusted pro forma EBITDA represents adjusted pro forma earnings before interest, taxes, depreciation and amortization. EBITDA and Adjusted pro forma EBITDA are not measurements of operating p
Source: SEC EDGAR · 425 filed Nov 18, 2005
More decks from DEX ONE Corp
 Q4 2012 Earnings Presentation17 slides · Mar 18, 2013
 Merger or Acquisition (December 2012)42 slides · Dec 6, 2012
 Merger or Acquisition (September 2012)51 slides · Sep 18, 2012
 Merger or Acquisition (August 2012)15 slides · Aug 21, 2012
 Q2 2012 Earnings Presentation16 slides · Jul 25, 2012
 Q1 2012 Earnings Presentation17 slides · Apr 26, 2012