Earthstone Energy — Investor Presentation (July 2021)
28 slides from Earthstone Energy's investor presentation, Jul 23, 2021
Slide 1: Investor Presentation July 20, 2021
1 Investor Presentation July 20, 2021
Slide 2: Disclaimer: Forward-Looking Statements
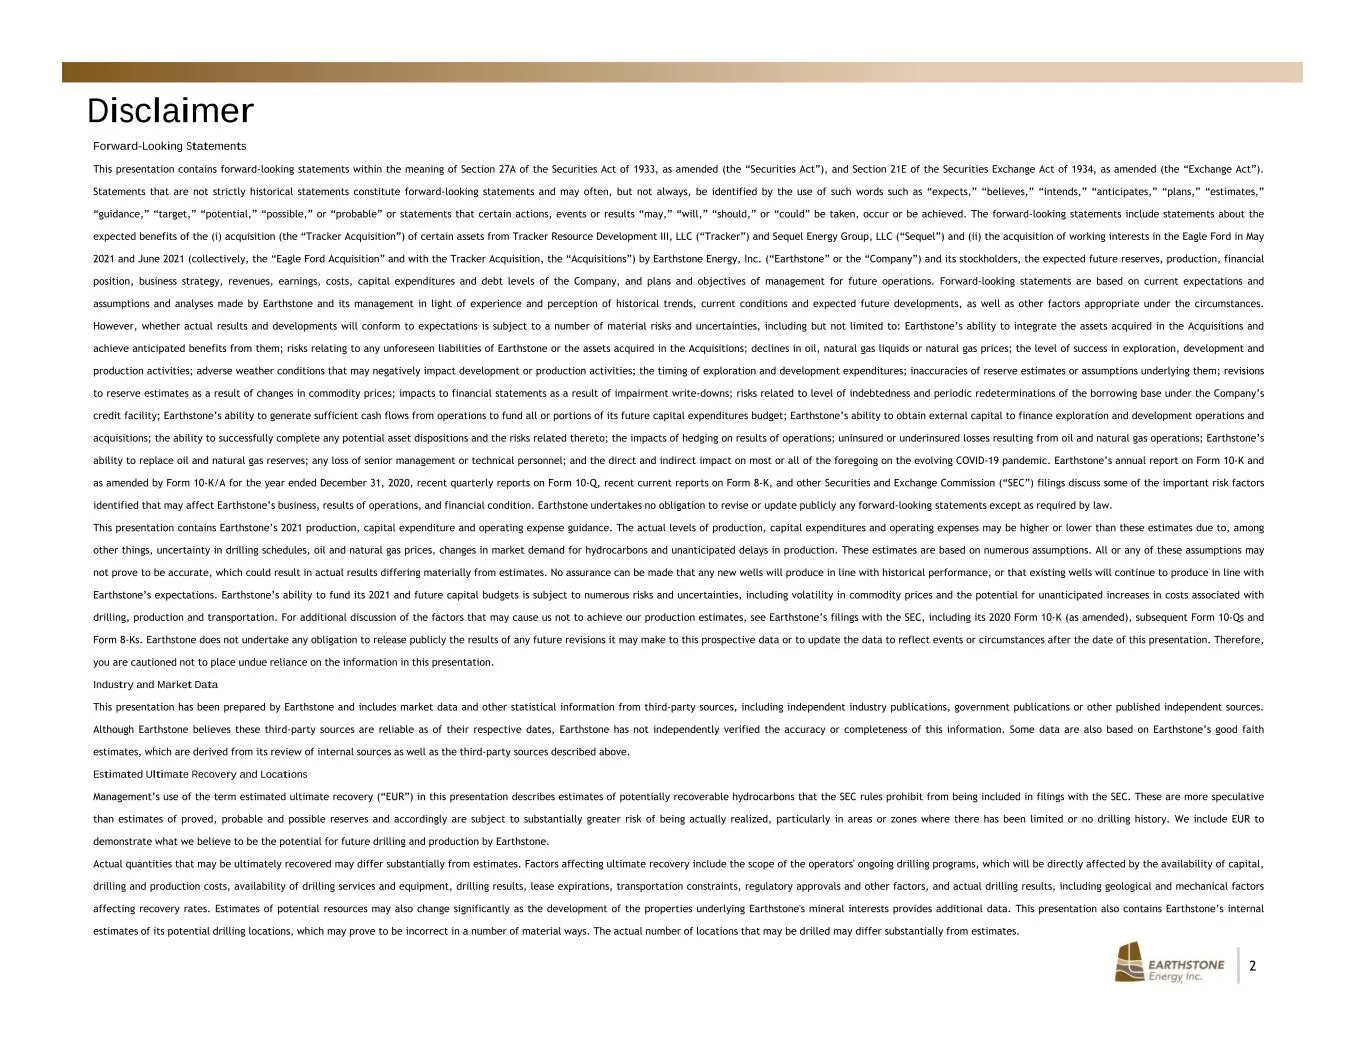
2 Disclaimer Forward-Looking Statements This presentation contains forward-looking statements within the meaning of Section 27A of the Securities Act of 1933, as amended (the “Securities Act”), and Section 21E of the Securities Exchange Act of 1934, as amended (the “Exchange Act”). Statements that a
Slide 3: Investment Highlights: Leading Small-Cap, Permian Focused Producer
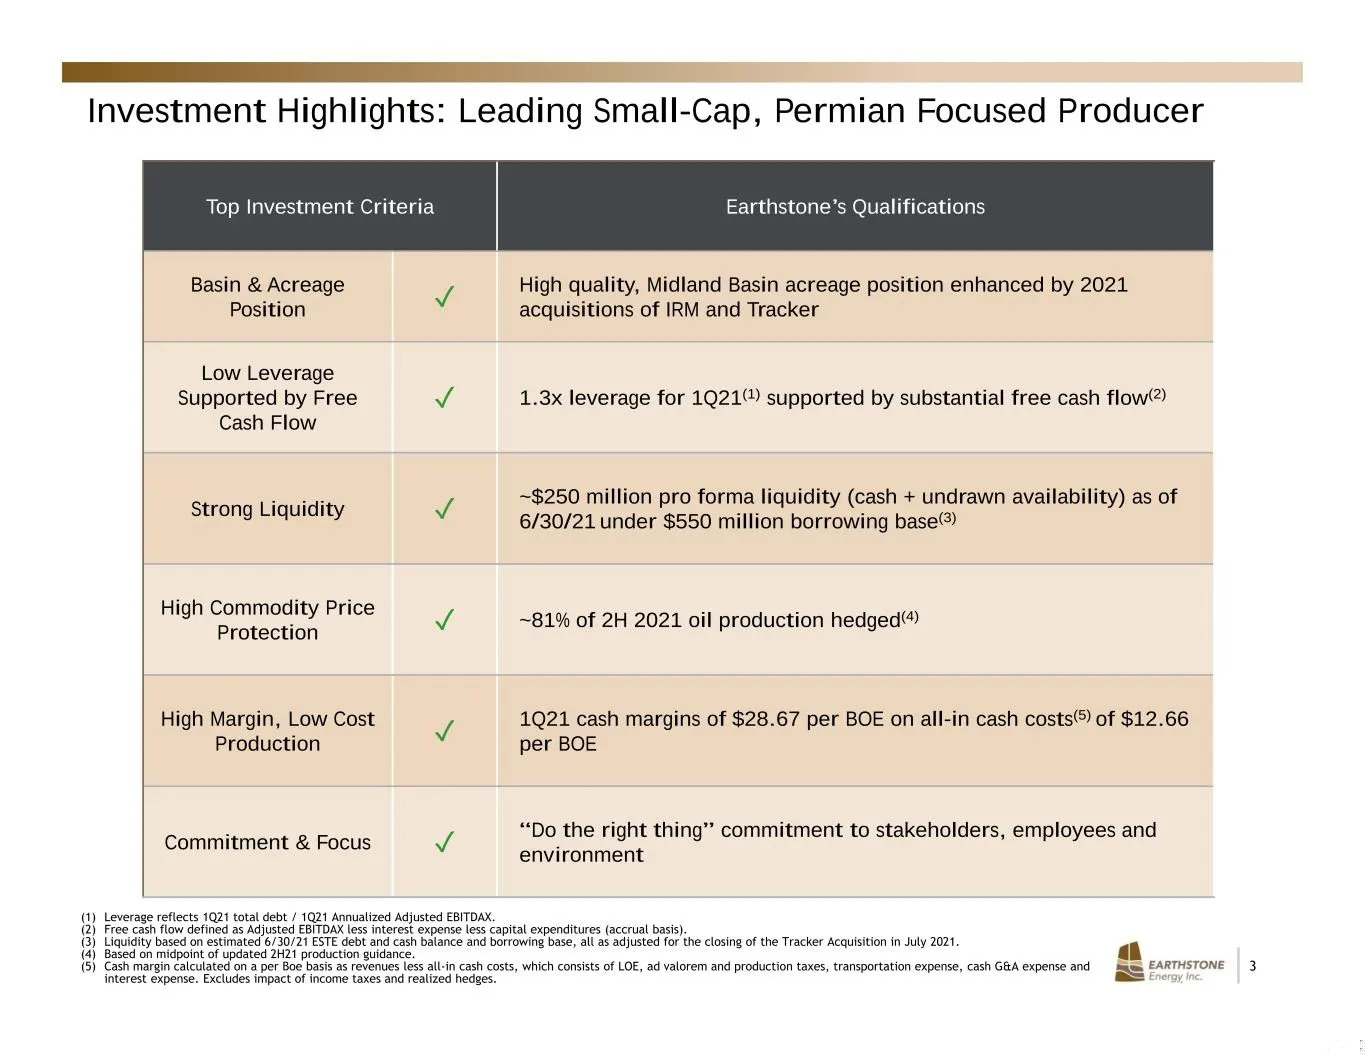
3 Investment Highlights: Leading Small-Cap, Permian Focused Producer Top Investment Criteria Earthstone’s Qualifications Basin & Acreage Position ✓ High quality, Midland Basin acreage position enhanced by 2021 acquisitions of IRM and Tracker Low Leverage Supported by Free Cash Flow ✓ 1.3x leverage f
Slide 4: Proven Leadership and Track Record of Value Creation
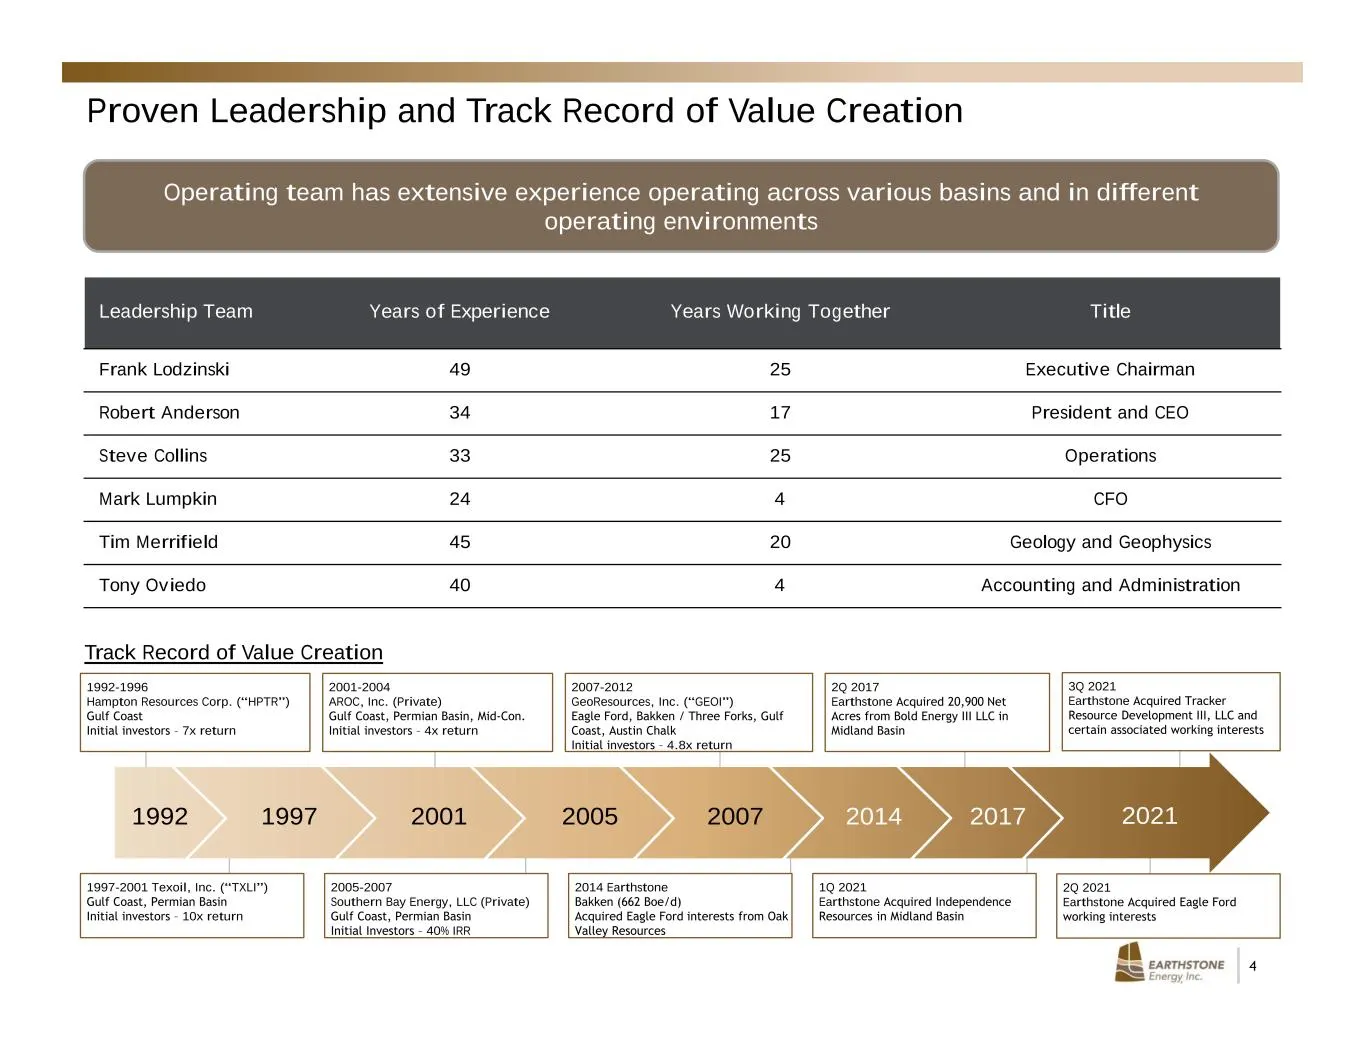
4 Proven Leadership and Track Record of Value Creation Operating team has extensive experience operating across various basins and in different operating environments Track Record of Value Creation 2007 2014 2017200520011992 1997 1992-1996 Hampton Resources Corp. (“HPTR”) Gulf Coast Initial investor
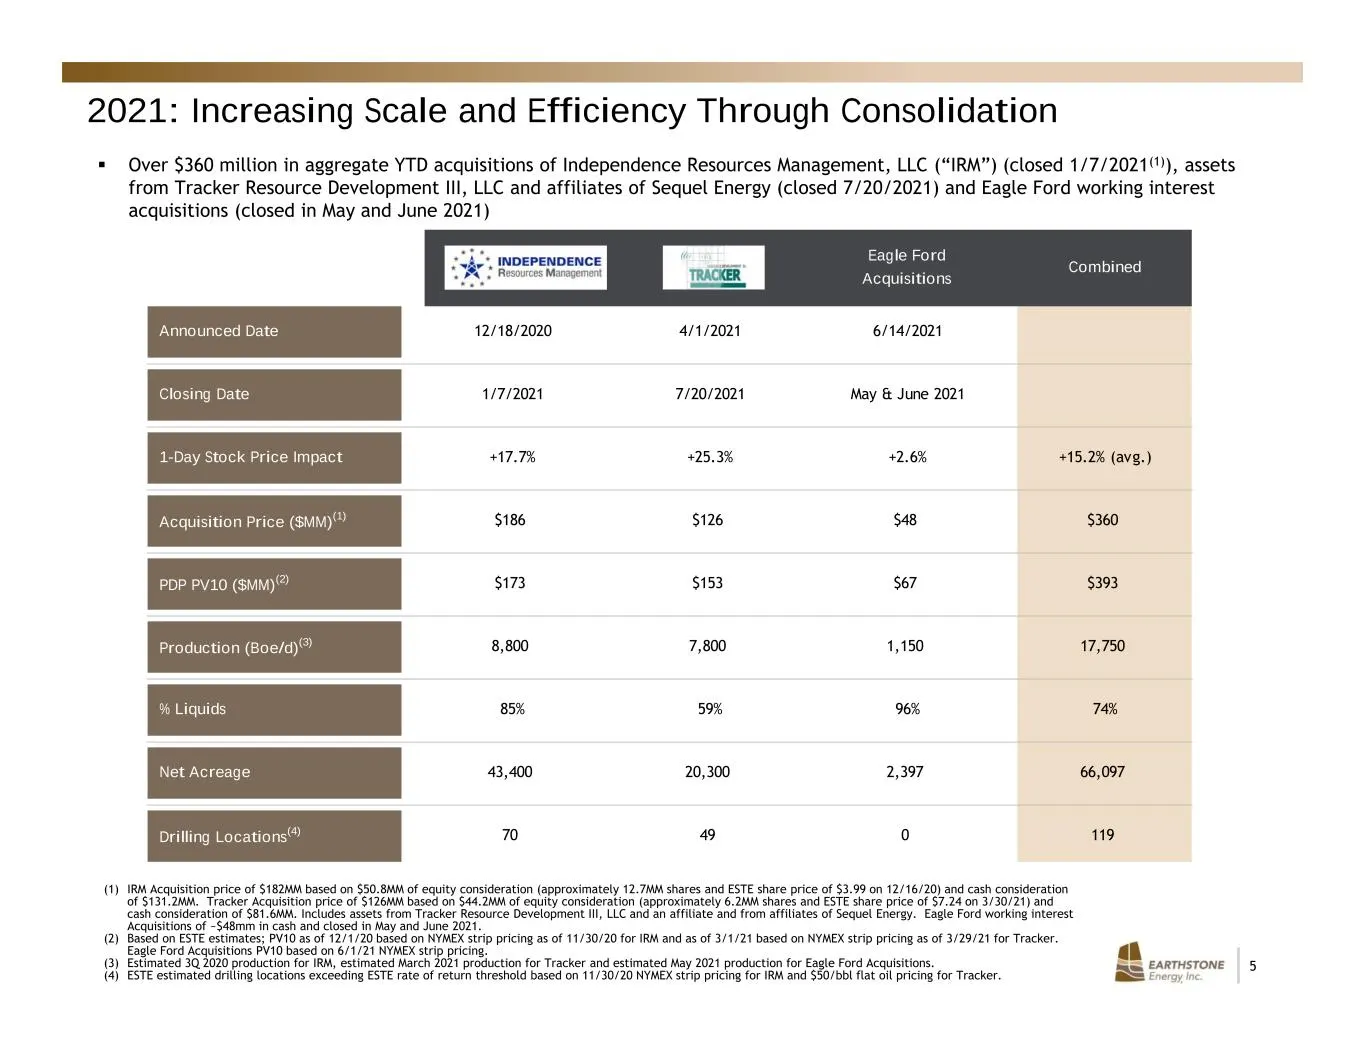
Slide 5: IRM, Tracker, Eagle Ford Acquisitions Combined
5 IRM Tracker Eagle Ford Acquisitions Combined Announced Date 12/18/2020 4/1/2021 6/14/2021 Closing Date 1/7/2021 7/20/2021 May & June 2021 1-Day Stock Price Impact +17.7% +25.3% +2.6% +15.2% (avg.) Acquisition Price ($MM)(1) $186 $126 $48 $360 PDP PV10 ($MM)(2) $173 $153 $67 $393 Production (Boe/d)
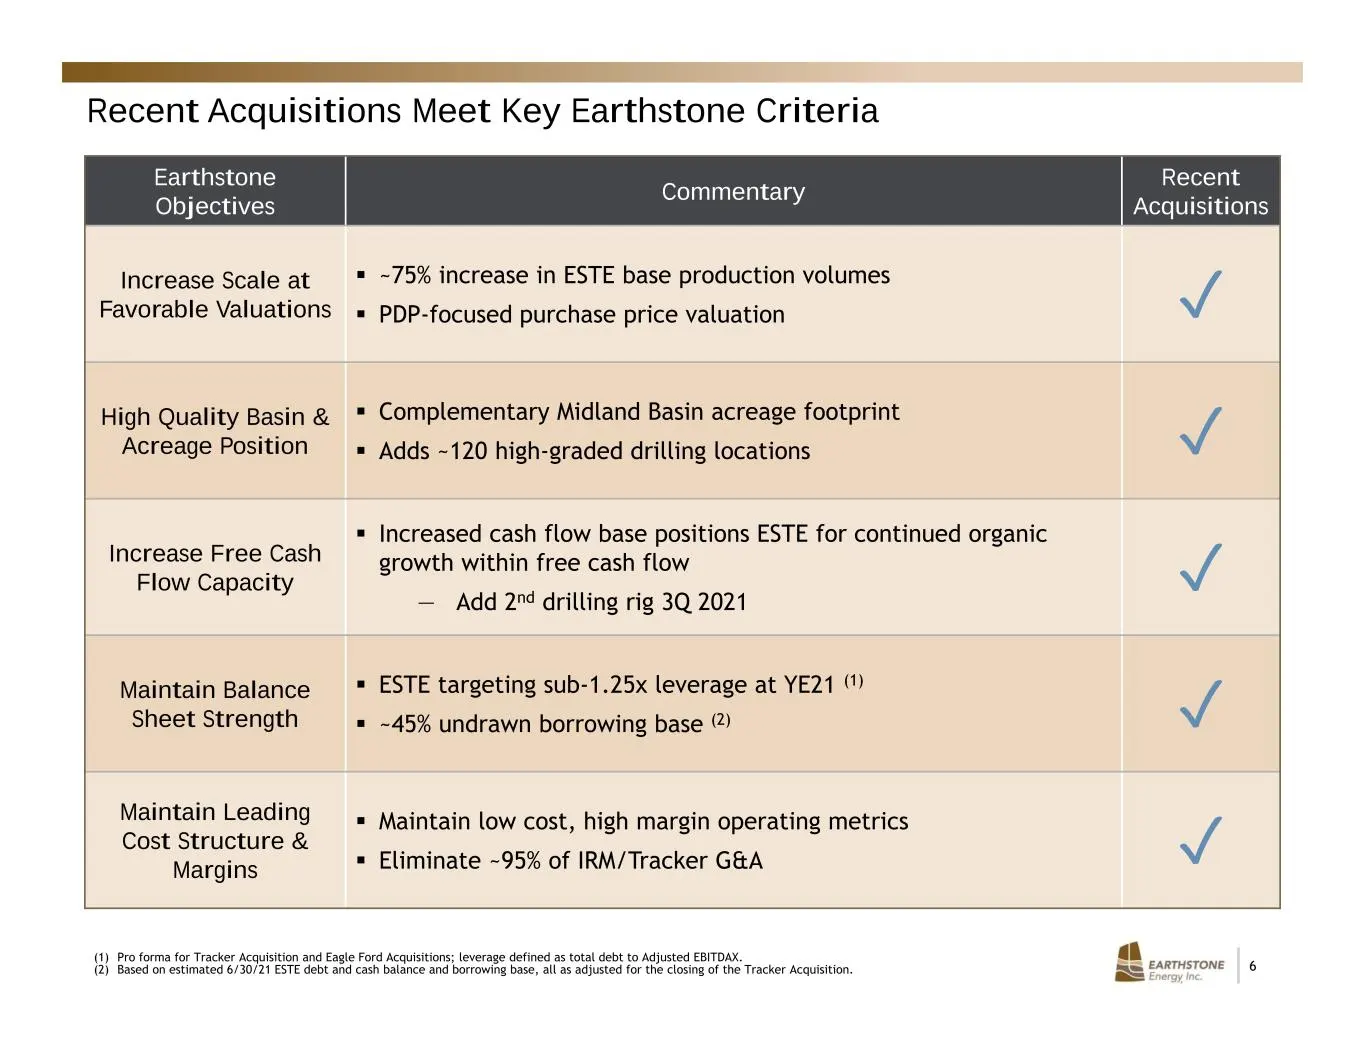
Slide 6: Recent Acquisitions Meet Key Earthstone Criteria
6 Recent Acquisitions Meet Key Earthstone Criteria Earthstone Objectives Commentary Recent Acquisitions Increase Scale at Favorable Valuations ~75% increase in ESTE base production volumes PDP-focused purchase price valuation ✓ High Quality Basin & Acreage Position Complementary Midland Basin
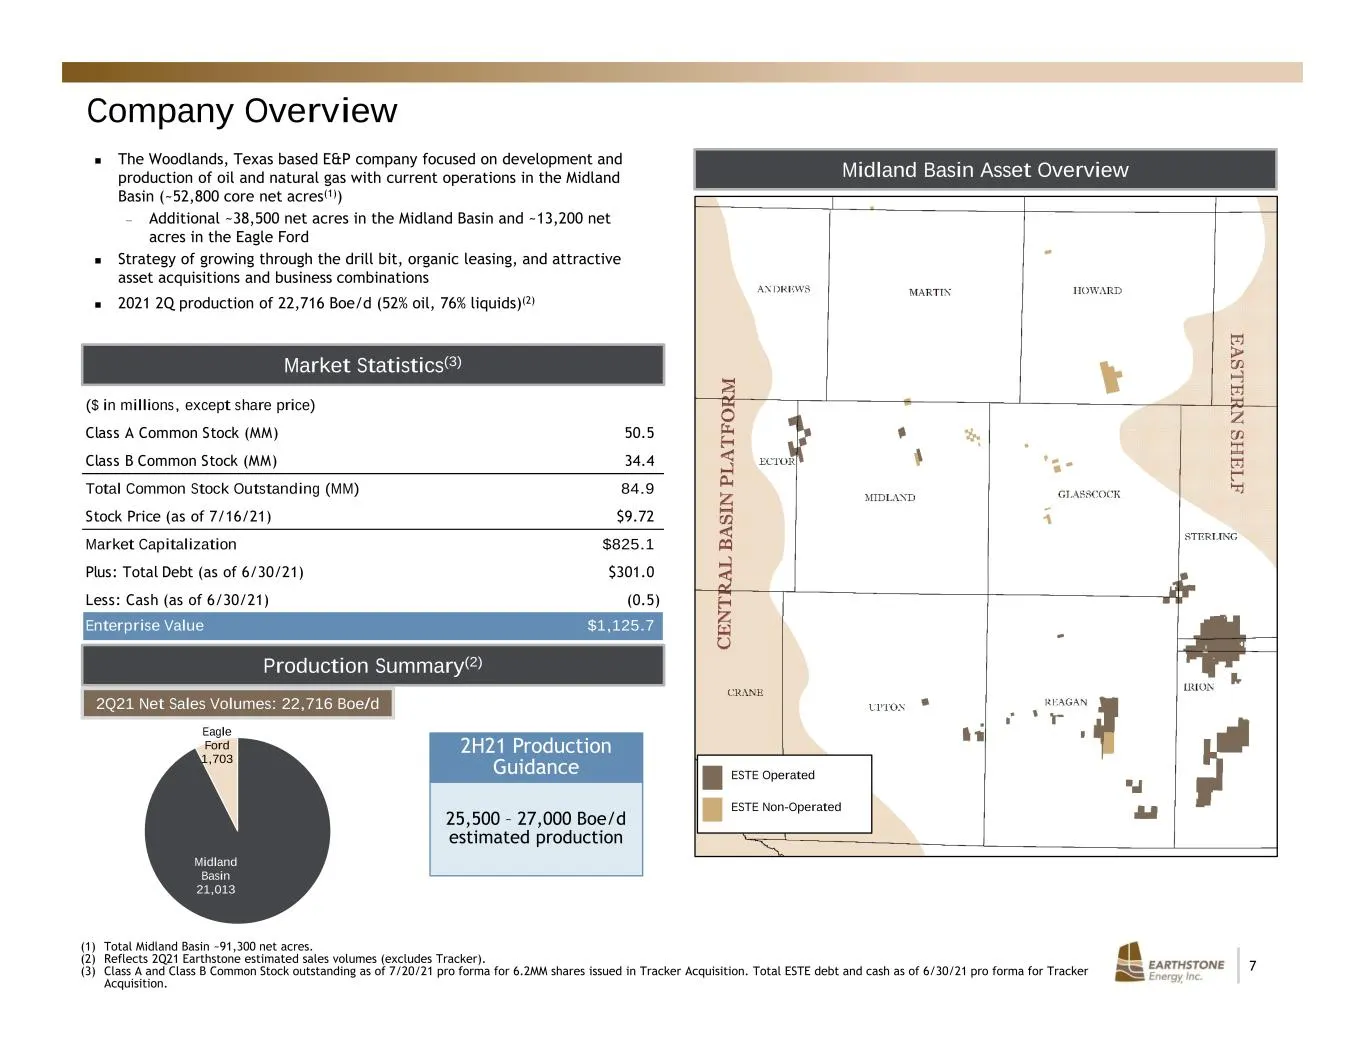
Slide 7: Company Overview and Midland Basin Asset Overview
7 Midland Basin 21,013 Eagle Ford 1,703 Company Overview Midland Basin Asset Overview The Woodlands, Texas based E&P company focused on development and production of oil and natural gas with current operations in the Midland Basin (~52,800 core net acres(1)) — Additional ~38,500 net acres in the Mi
Slide 8: Earthstone Overview
Earthstone Overview EARTHSTONE | 8 Energy Inc.
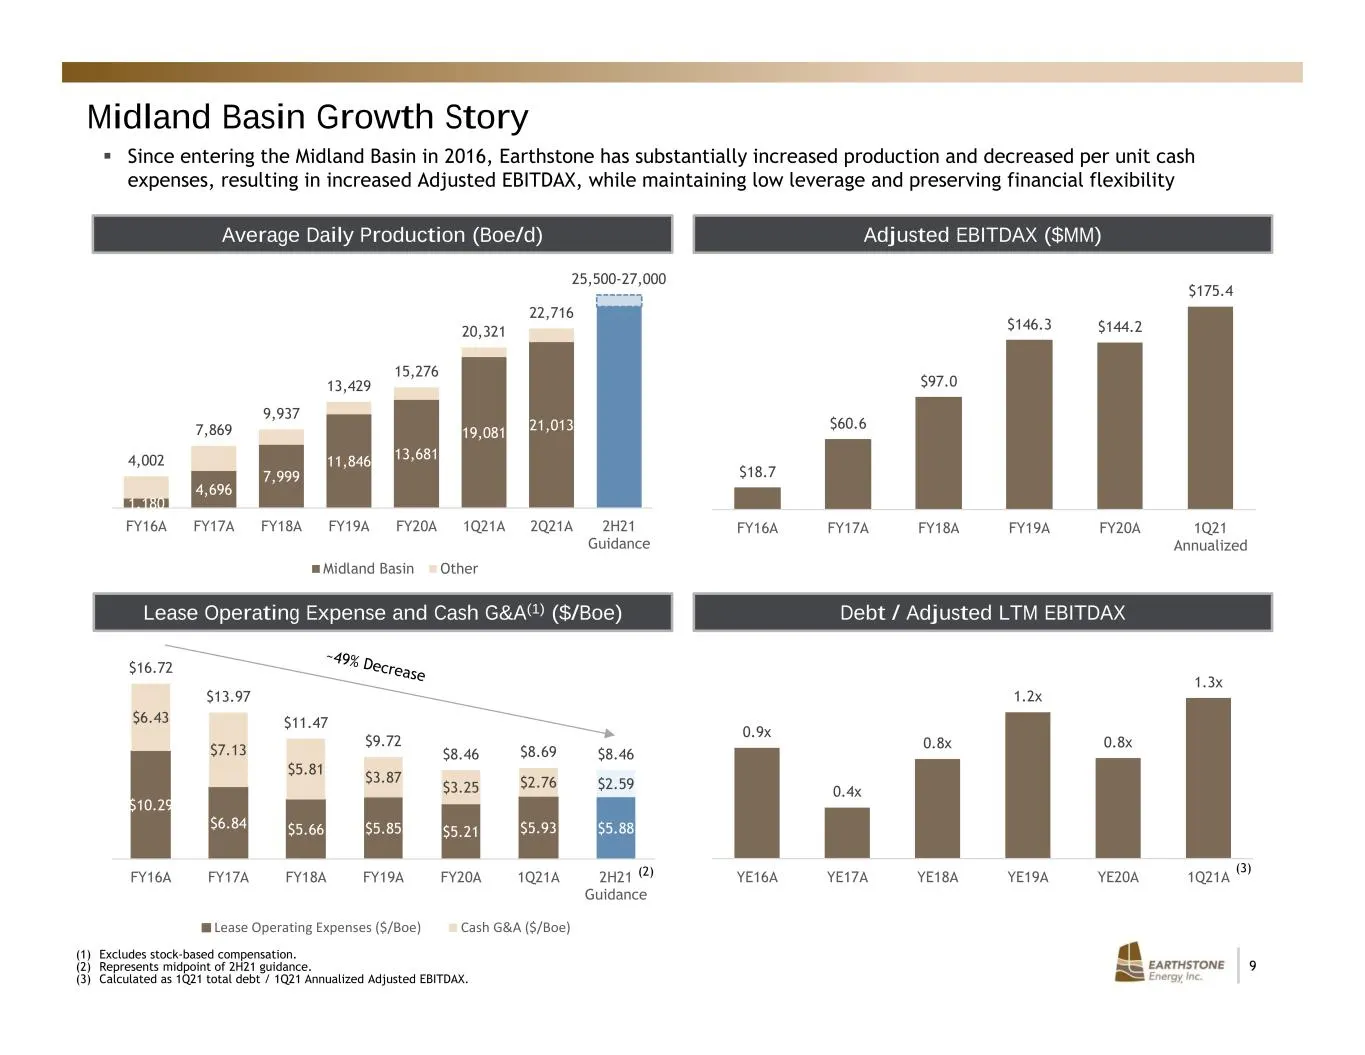
Slide 9: Midland Basin Growth Story
9 (1) Excludes stock-based compensation. (2) Represents midpoint of 2H21 guidance. (3) Calculated as 1Q21 total debt / 1Q21 Annualized Adjusted EBITDAX. Average Daily Production (Boe/d) Adjusted EBITDAX ($MM) Lease Operating Expense and Cash G&A(1) ($/Boe) Debt / Adjusted LTM EBITDAX Since enterin
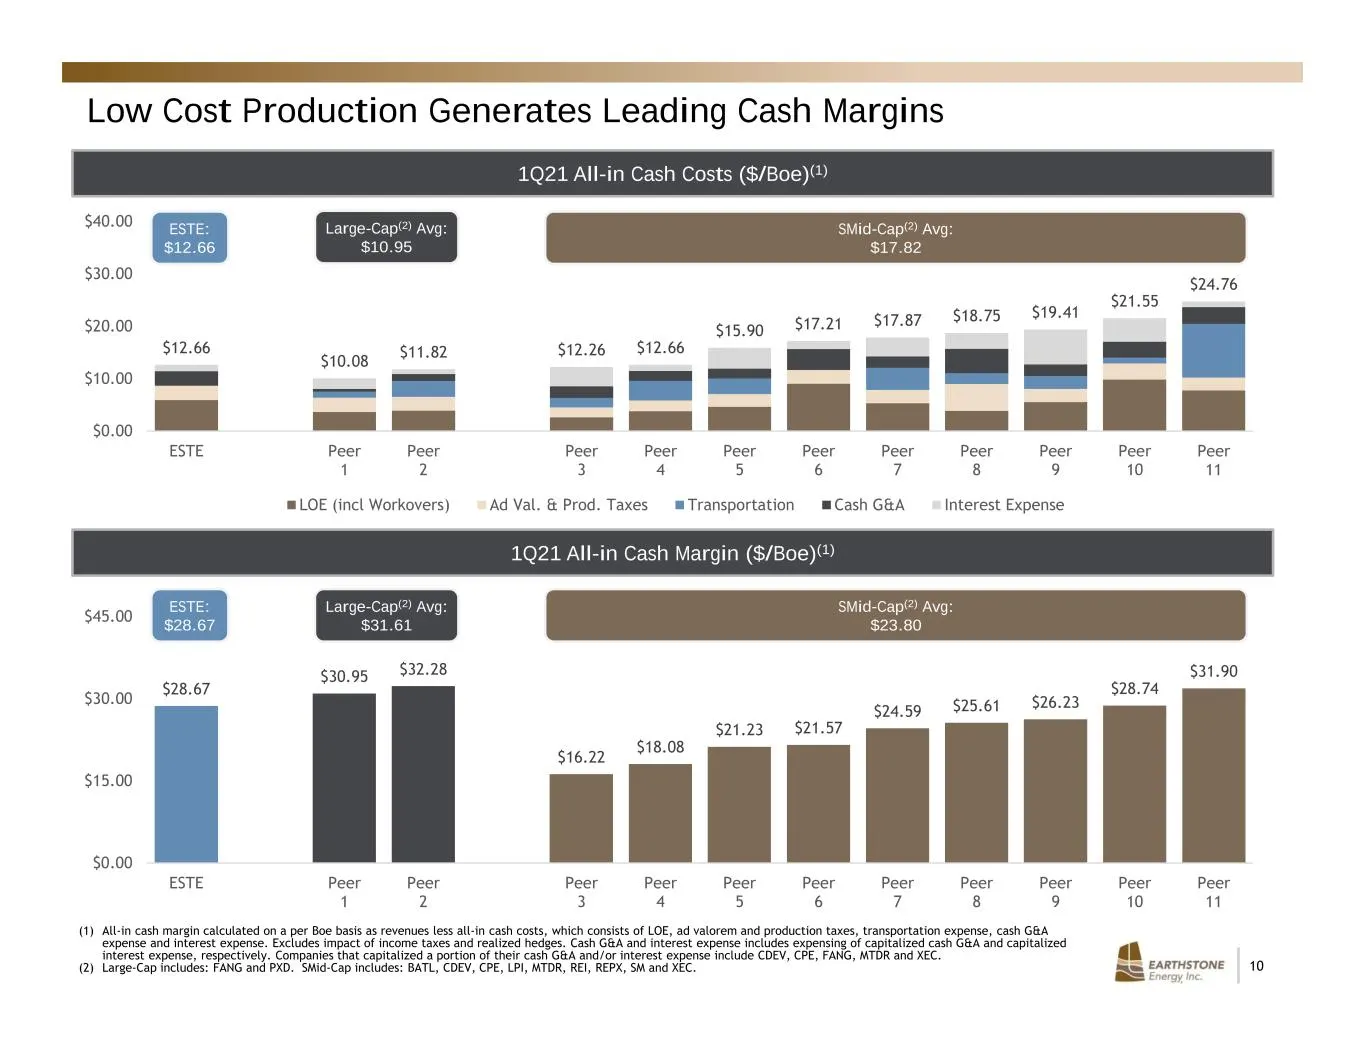
Slide 10: Low Cost Production Generates Leading Cash Margins
10 1Q21 All-in Cash Margin ($/Boe)(1) (1) All-in cash margin calculated on a per Boe basis as revenues less all-in cash costs, which consists of LOE, ad valorem and production taxes, transportation expense, cash G&A expense and interest expense. Excludes impact of income taxes and realized hedges. C
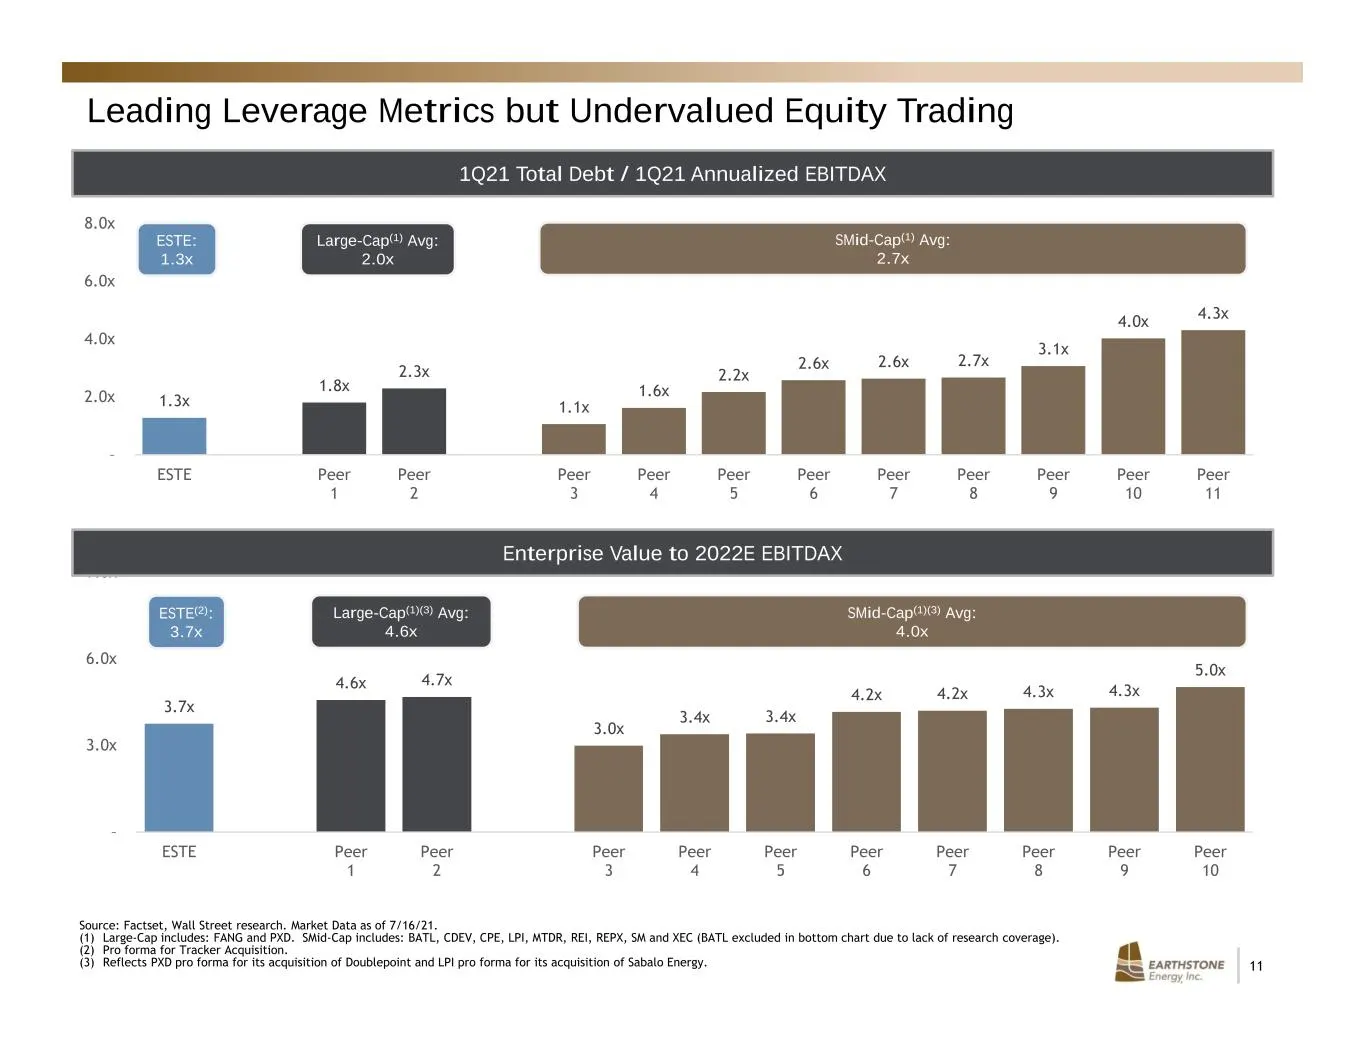
Slide 11: Leading Leverage Metrics but Undervalued Equity Trading
11 3.7x 4.6x 4.7x 3.0x 3.4x 3.4x 4.2x 4.2x 4.3x 4.3x 5.0x – 3.0x 6.0x 9.0x ESTE Peer 1 Peer 2 Peer 3 Peer 4 Peer 5 Peer 6 Peer 7 Peer 8 Peer 9 Peer 10 1.3x 1.8x 2.3x 1.1x 1.6x 2.2x 2.6x 2.6x 2.7x 3.1x 4.0x 4.3x – 2.0x 4.0x 6.0x 8.0x ESTE Peer 1 Peer 2 Peer 3 Peer 4 Peer 5 Peer 6 Peer 7 Peer 8 Peer 9
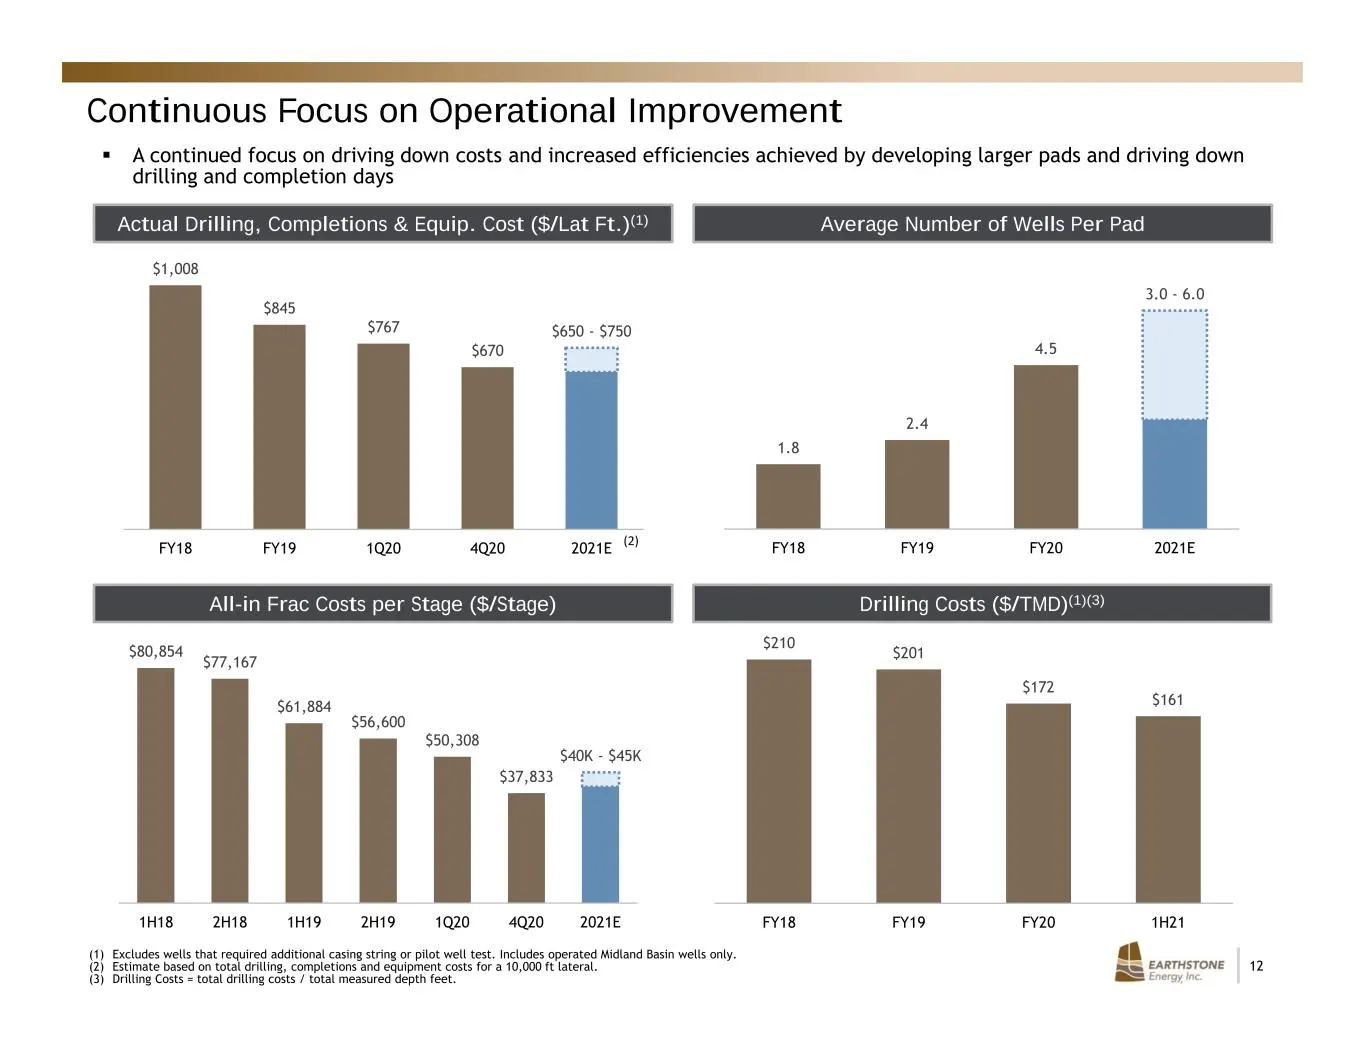
Slide 12: Continuous Focus on Operational Improvement
12 $80,854 $77,167 $61,884 $56,600 $50,308 $37,833 $40K - $45K 1H18 2H18 1H19 2H19 1Q20 4Q20 2021E Drilling Costs ($/TMD)(1)(3) Average Number of Wells Per Pad A continued focus on driving down costs and increased efficiencies achieved by developing larger pads and driving down drilling and comple
Slide 13: Highly Focused Environmental Stewardship
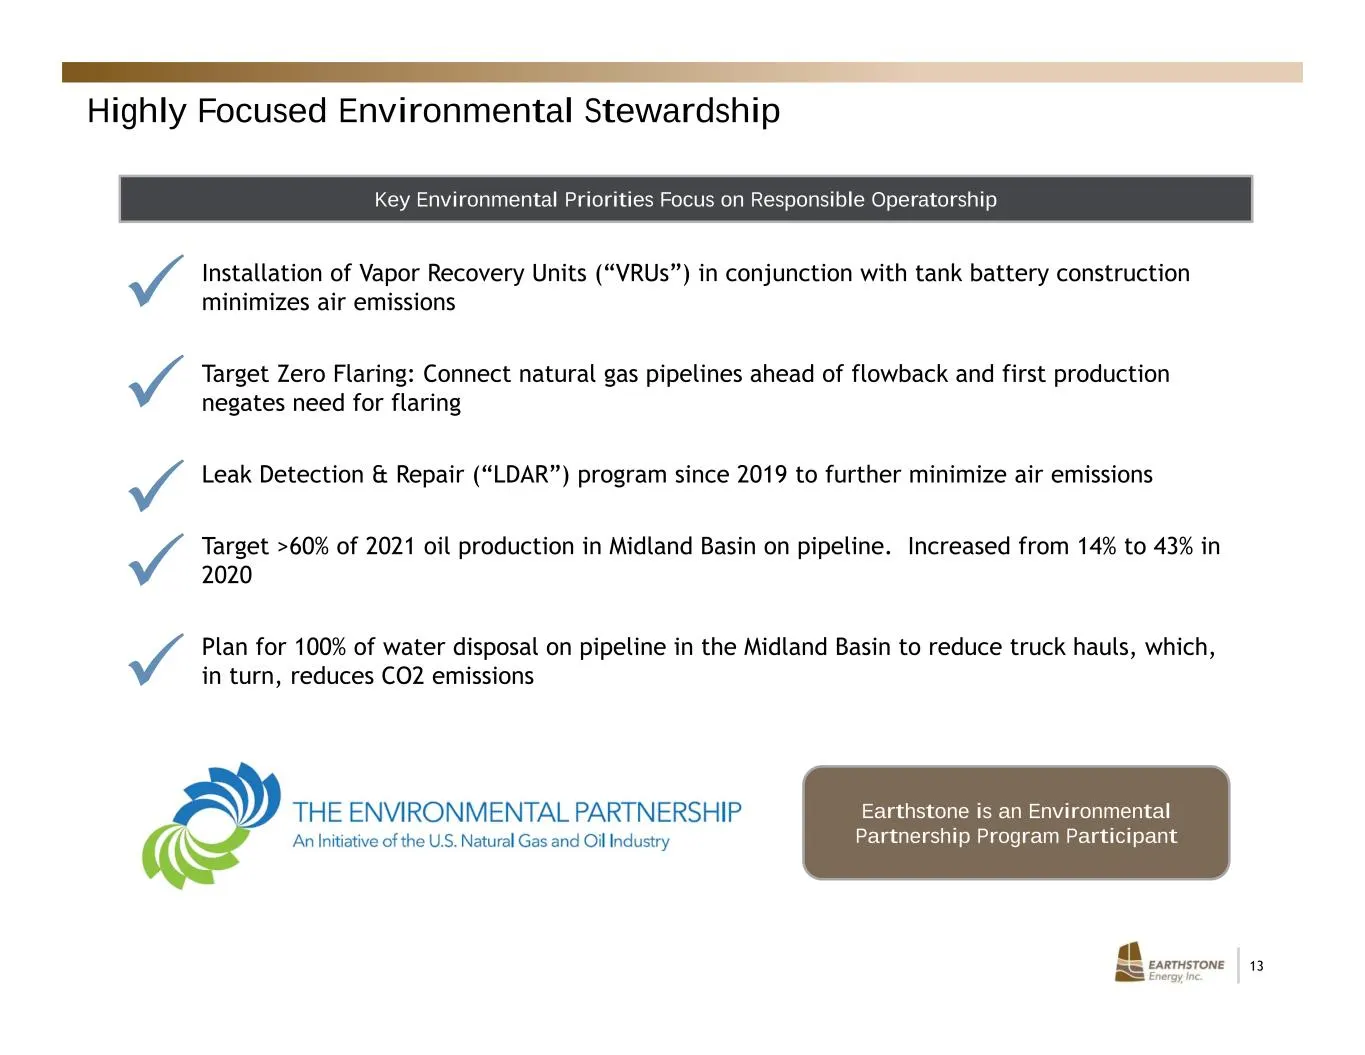
13 Installation of Vapor Recovery Units (“VRUs”) in conjunction with tank battery construction minimizes air emissions Target Zero Flaring: Connect natural gas pipelines ahead of flowback and first production negates need for flaring Leak Detection & Repair (“LDAR”) program since 2019 to further min
Slide 14: Responsible Management of Air Emissions and Flaring
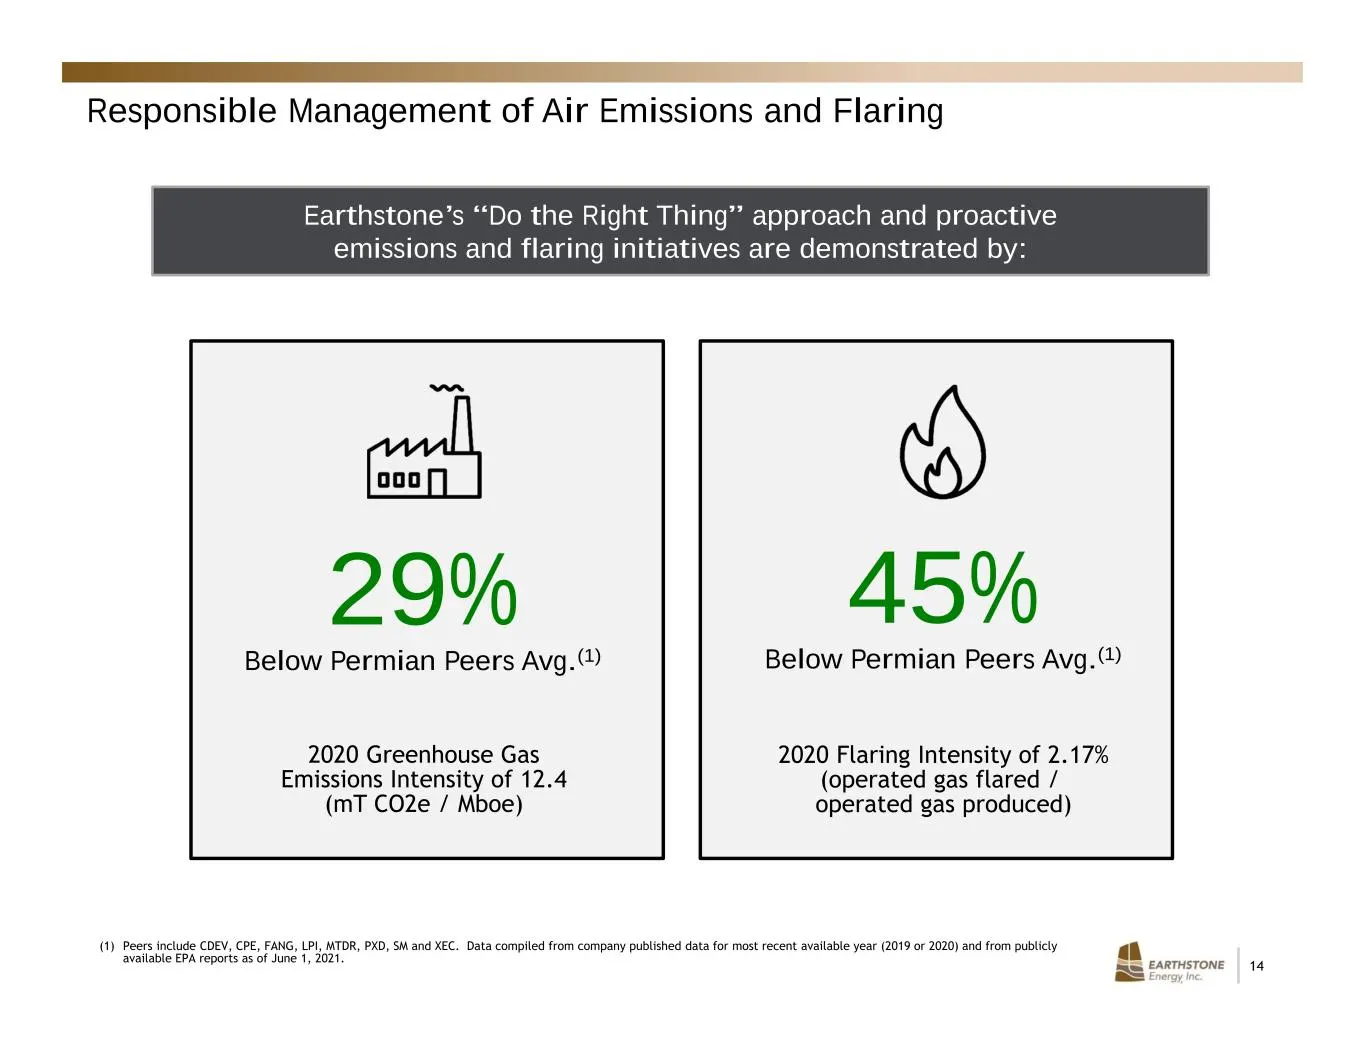
14 Responsible Management of Air Emissions and Flaring (1) Peers include CDEV, CPE, FANG, LPI, MTDR, PXD, SM and XEC. Data compiled from company published data for most recent available year (2019 or 2020) and from publicly available EPA reports as of June 1, 2021. 2020 Greenhouse Gas Emissions Inte
Slide 15: Executive Compensation Fully Aligned with Shareholders
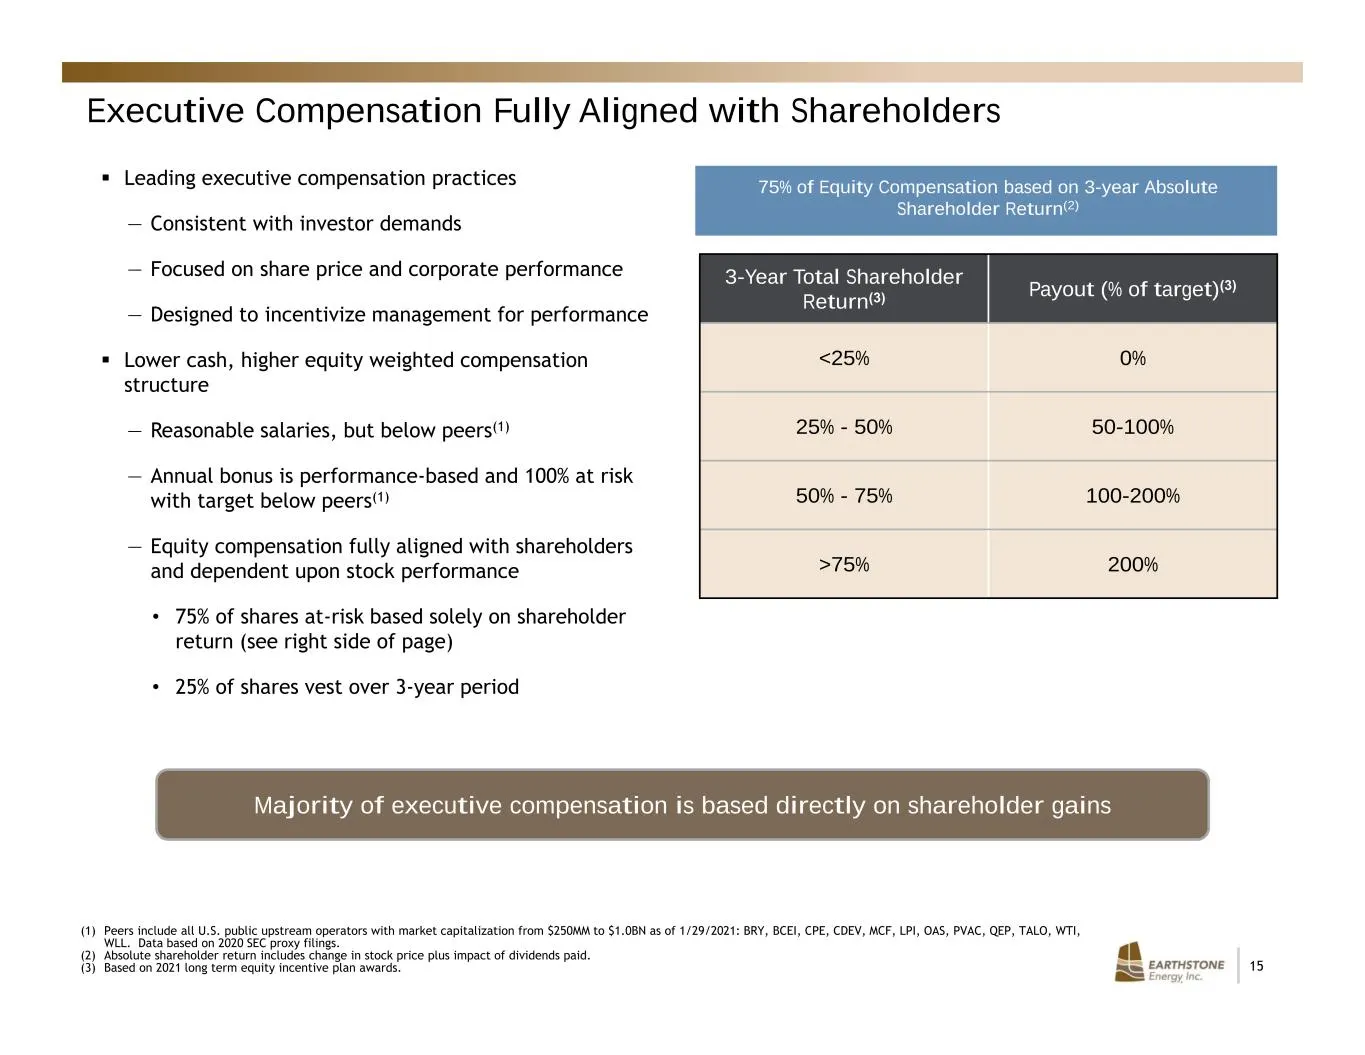
15 Executive Compensation Fully Aligned with Shareholders (1) Peers include all U.S. public upstream operators with market capitalization from $250MM to $1.0BN as of 1/29/2021: BRY, BCEI, CPE, CDEV, MCF, LPI, OAS, PVAC, QEP, TALO, WTI, WLL. Data based on 2020 SEC proxy filings. (2) Absolute sharehol
Slide 16: Areas of Operations
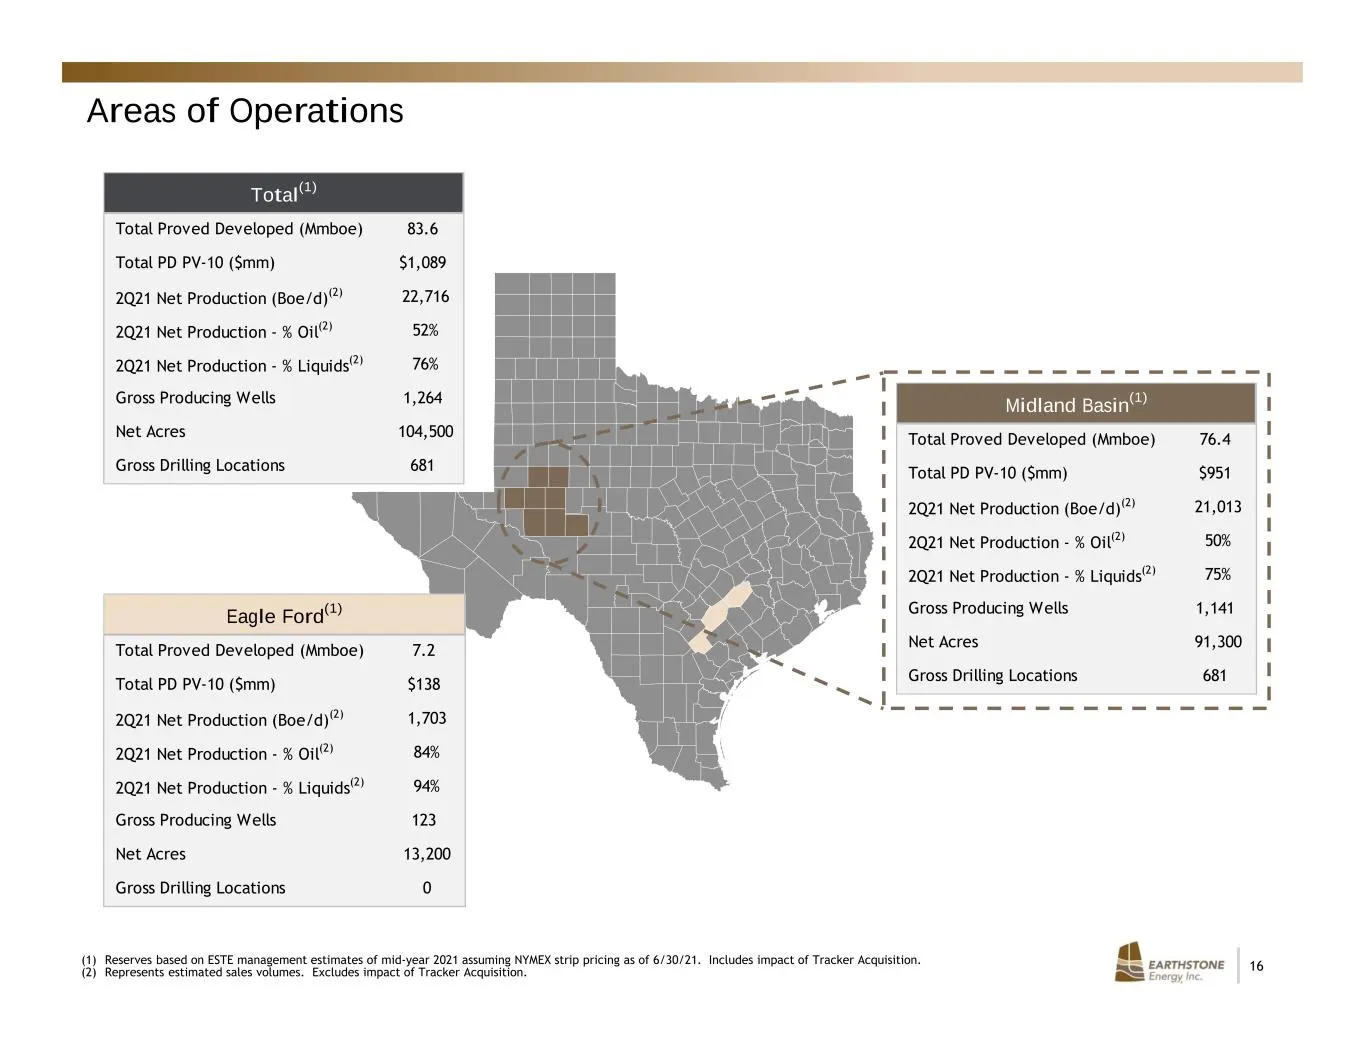
16 Areas of Operations (1) Reserves based on ESTE management estimates of mid-year 2021 assuming NYMEX strip pricing as of 6/30/21. Includes impact of Tracker Acquisition. (2) Represents estimated sales volumes. Excludes impact of Tracker Acquisition. Total(1) Total Proved Developed (Mmboe) 83.6 Tot
Slide 17: Substantial Economic Inventory in the Midland Basin
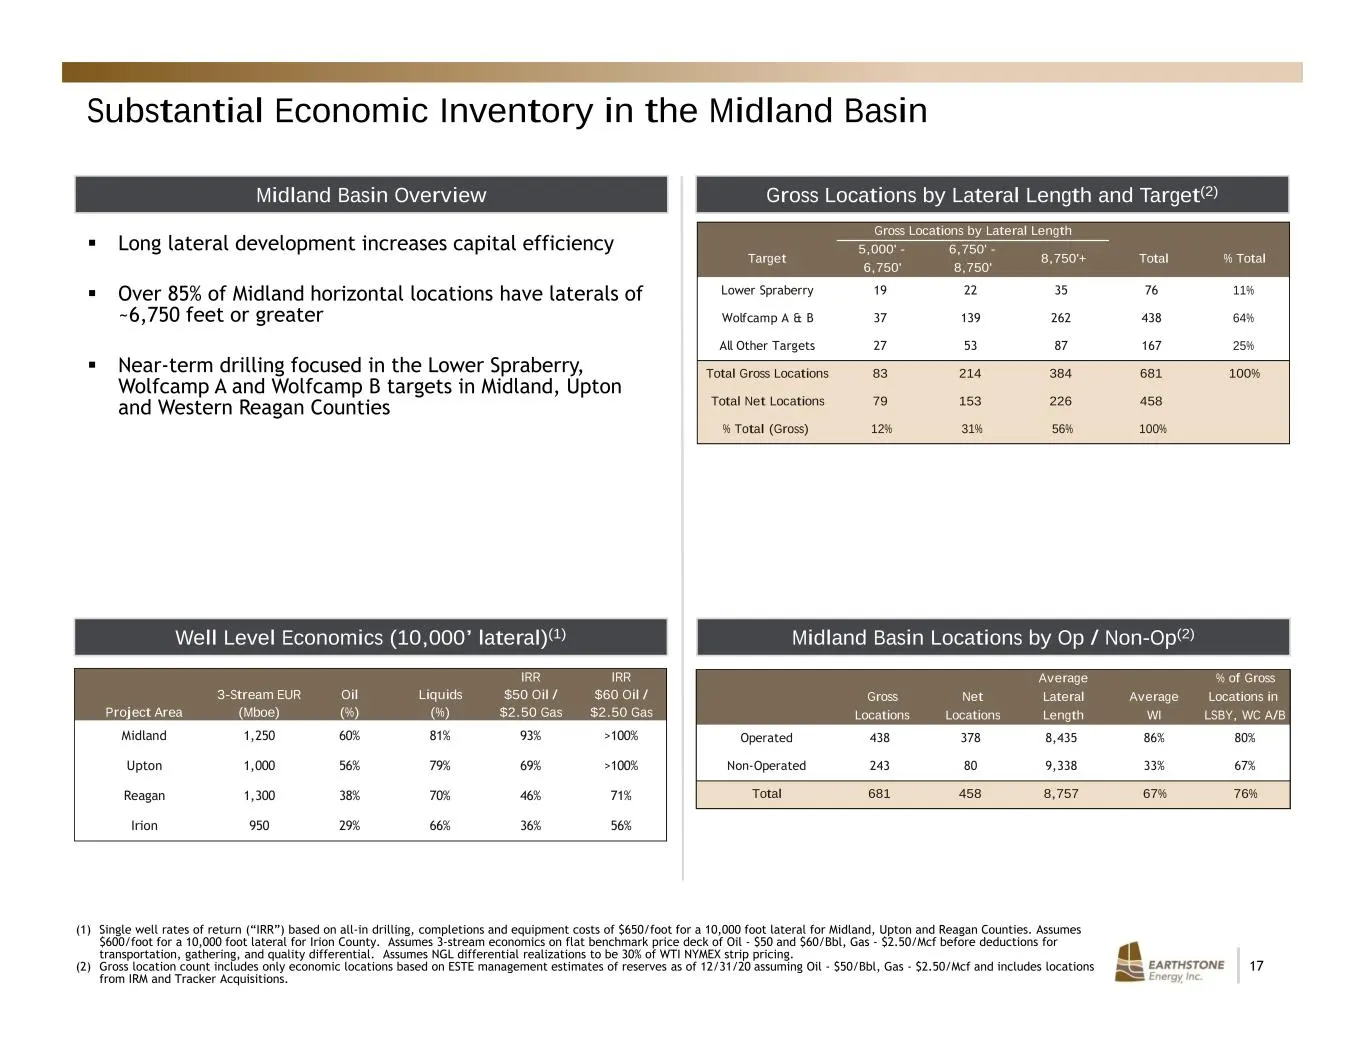
17 Gross Locations by Lateral Length and Target(2) Long lateral development increases capital efficiency Over 85% of Midland horizontal locations have laterals of ~6,750 feet or greater Near-term drilling focused in the Lower Spraberry, Wolfcamp A and Wolfcamp B targets in Midland, Upton and W

Slide 18: Financial Overview
Financial Overview EARTHSTONE | 18 Energy Inc.
Slide 19: Capital Budget, Guidance and Liquidity
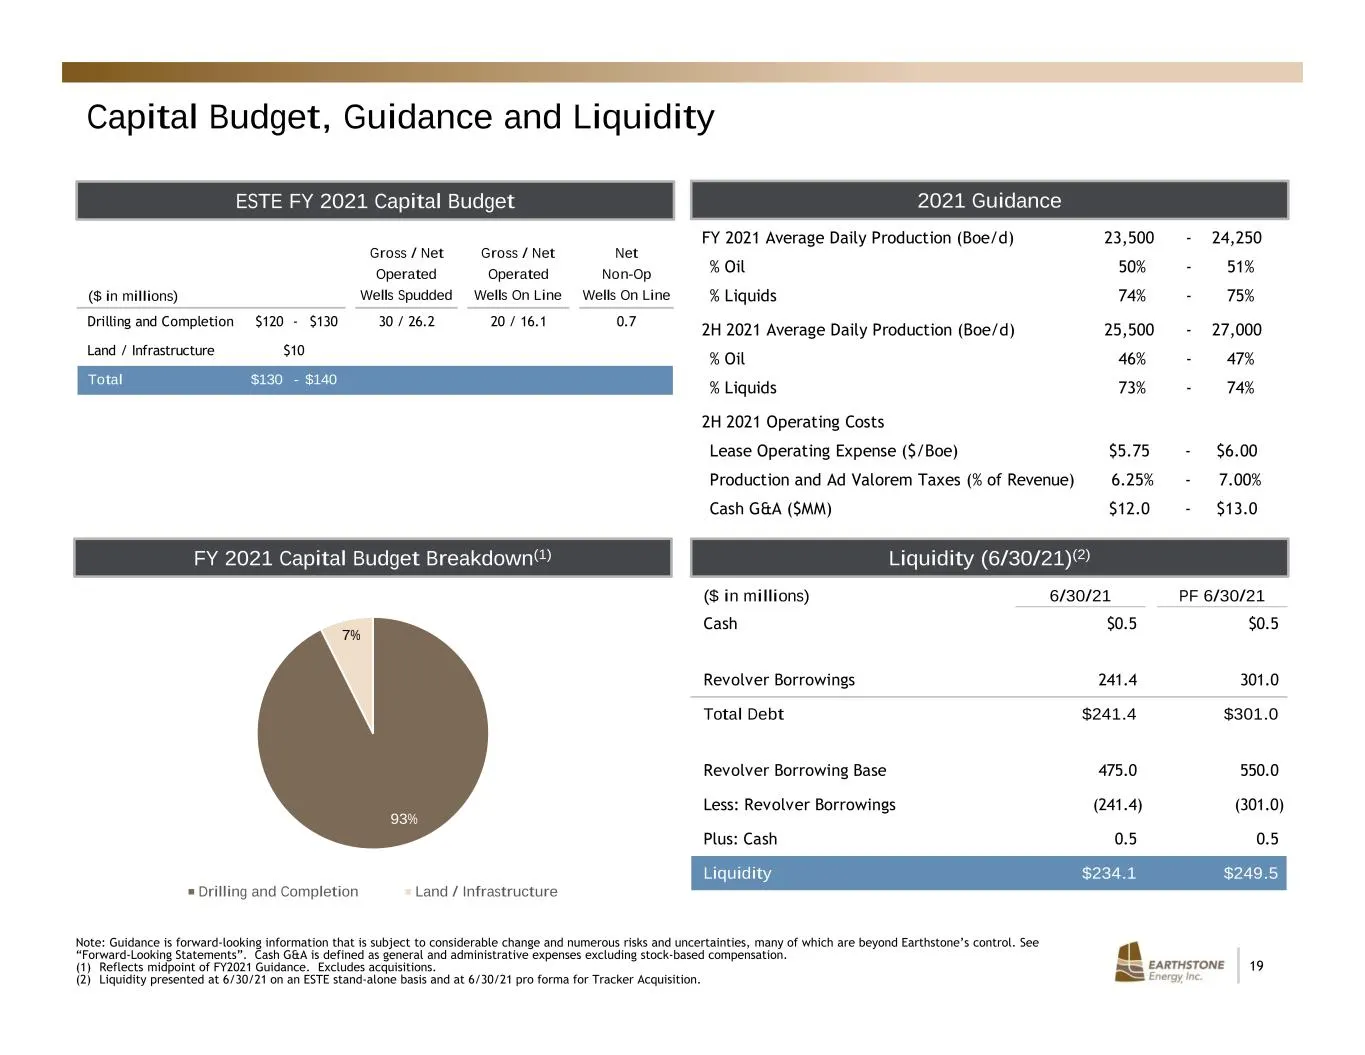
19 Capital Budget, Guidance and Liquidity ESTE FY 2021 Capital Budget Liquidity (6/30/21)(2) 2021 Guidance FY 2021 Capital Budget Breakdown(1) Note: Guidance is forward-looking information that is subject to considerable change and numerous risks and uncertainties, many of which are beyond Earthston
Slide 20: Oil and Gas Hedging Summary
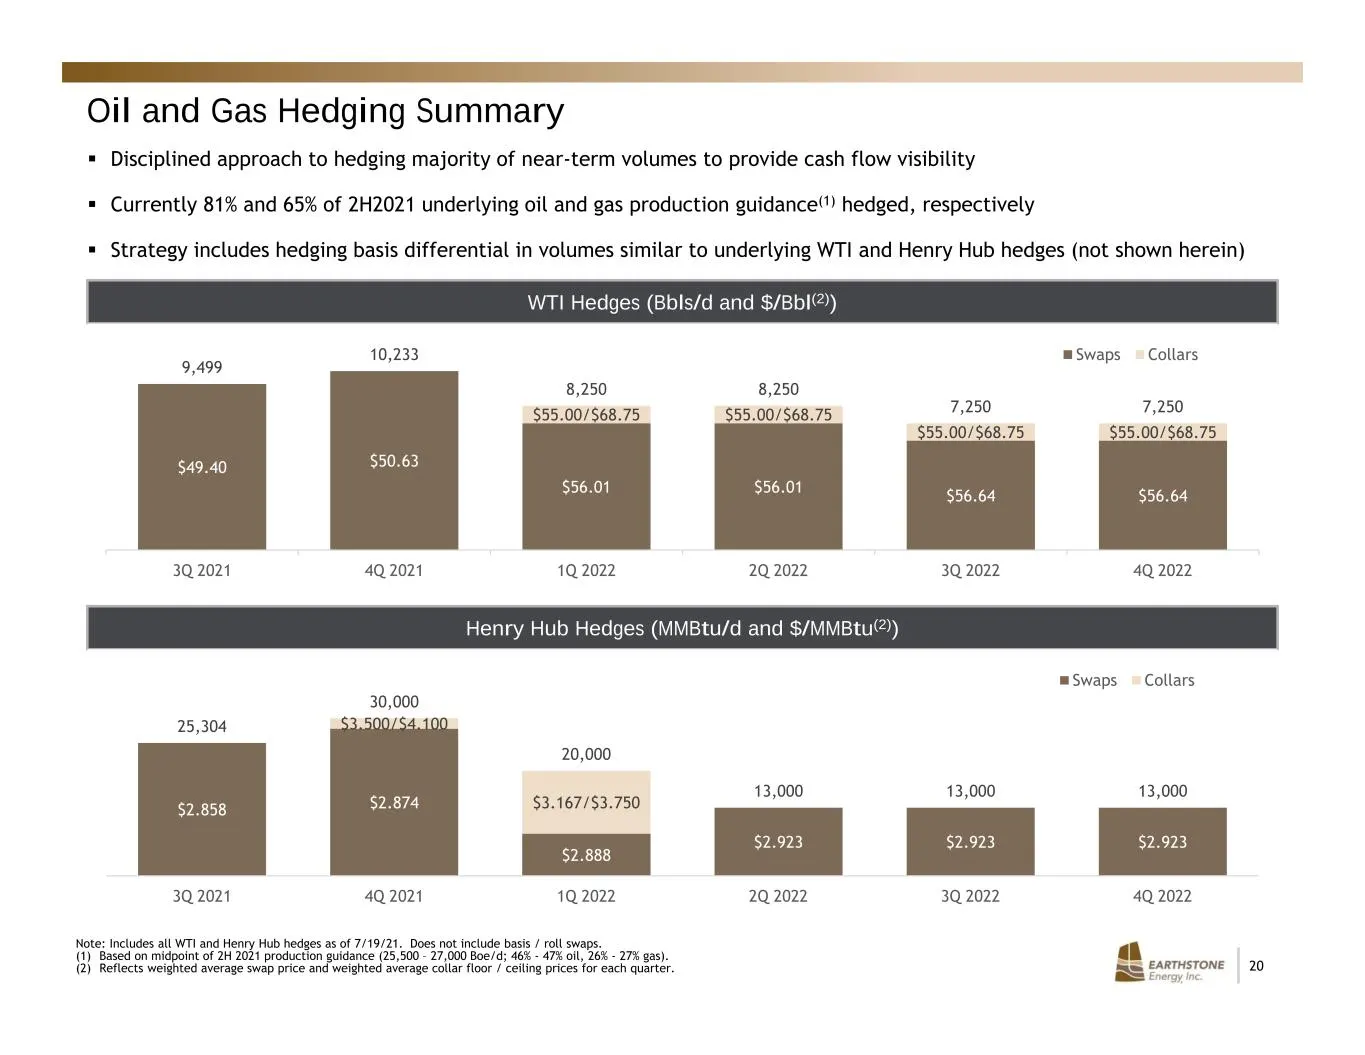
20 Oil and Gas Hedging Summary WTI Hedges (Bbls/d and $/Bbl(2)) Henry Hub Hedges (MMBtu/d and $/MMBtu(2)) Note: Includes all WTI and Henry Hub hedges as of 7/19/21. Does not include basis / roll swaps. (1) Based on midpoint of 2H 2021 production guidance (25,500 – 27,000 Boe/d; 46% - 47% oil, 26% -
Slide 21: Analyst Coverage
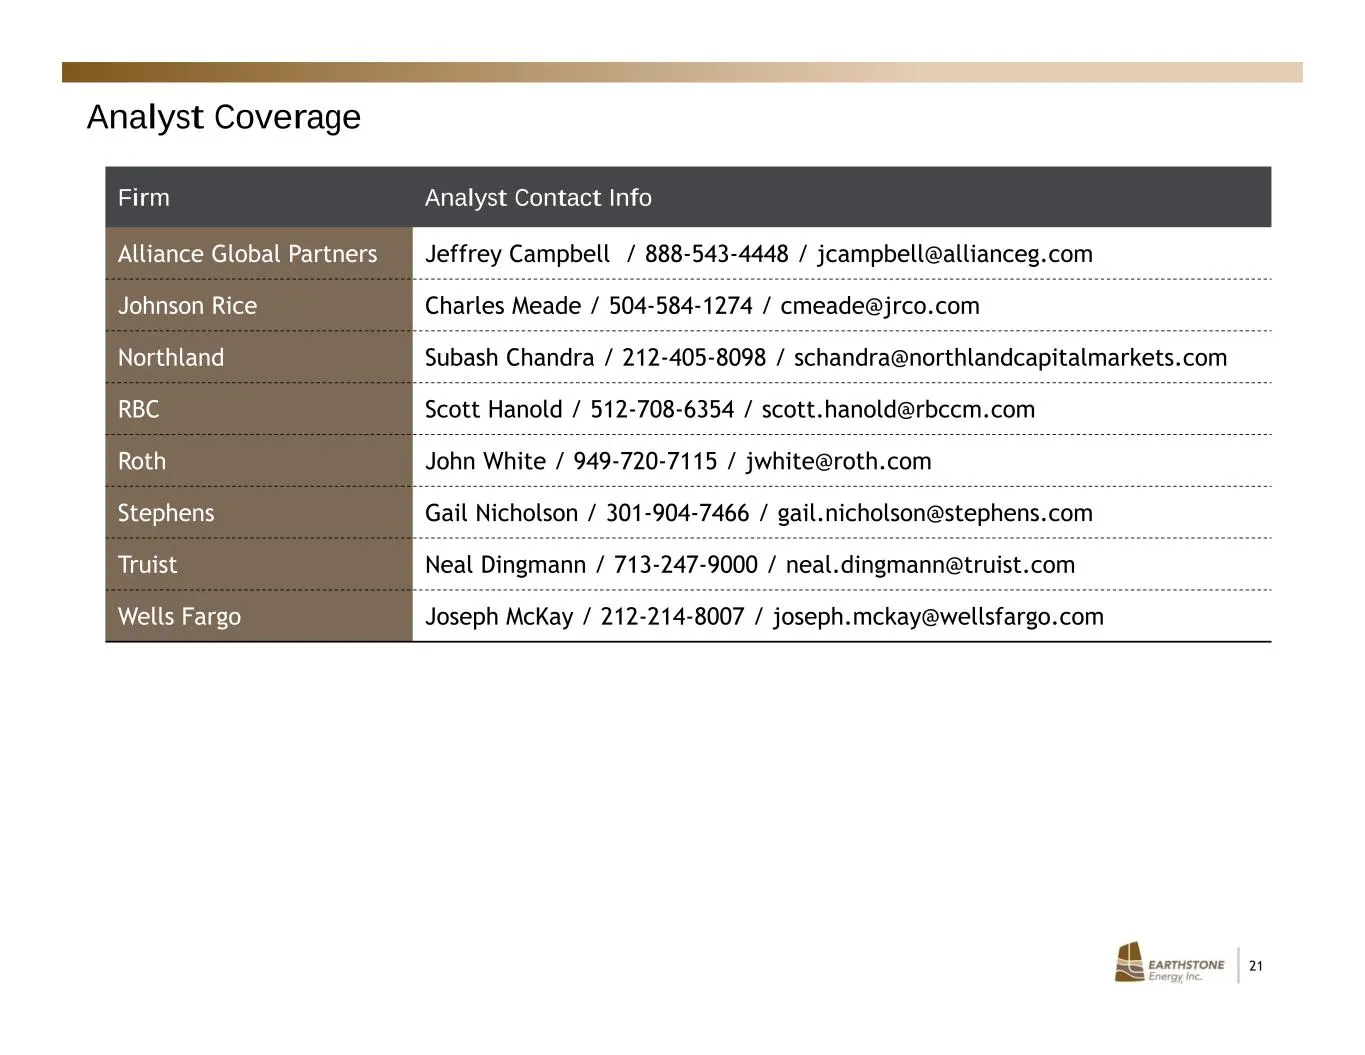
21 Analyst Coverage Firm Analyst Contact Info Alliance Global Partners Jeffrey Campbell / 888-543-4448 / [email protected] Johnson Rice Charles Meade / 504-584-1274 / [email protected] Northland Subash Chandra / 212-405-8098 / [email protected] RBC Scott Hanold / 512-708-6354
Slide 22: Contact Information
22 Mark Lumpkin, Jr. EVP, Chief Financial Officer Scott Thelander Vice President of Finance Corporate Offices Houston 1400 Woodloch Forest Drive | Suite 300 | The Woodlands, TX 77380 | (281) 298-4246 Midland 600 N. Marienfeld | Suite 1000 | Midland, TX 79701 | (432) 686-1100 Website www.earthstoneen

Slide 23: Appendix
Appendix EARTHSTONE | 23 Energy Inc.
Slide 24: Oil and Gas Hedges Summary
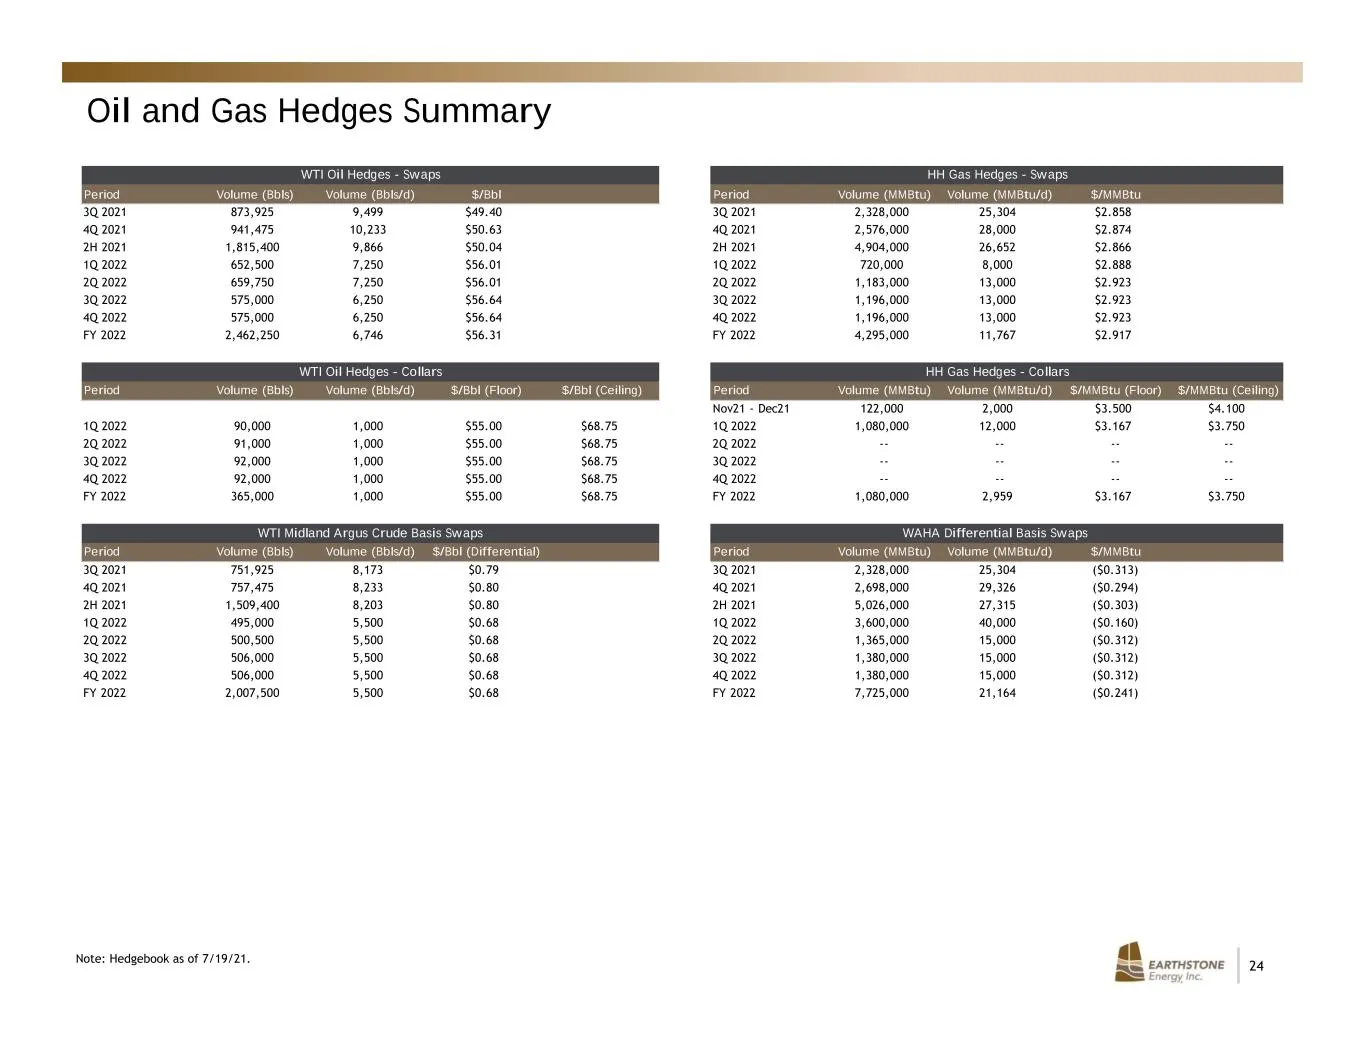
24 Oil and Gas Hedges Summary Note: Hedgebook as of 7/19/21. WTI Oil Hedges - Swaps HH Gas Hedges - Swaps Period Volume (Bbls) Volume (Bbls/d) $/Bbl Period Volume (MMBtu) Volume (MMBtu/d) $/MMBtu 3Q 2021 873,925 9,499 $49.40 3Q 2021 2,328,000 25,304 $2.858 4Q 2021 941,475 10,233 $50.63 4Q 2021 2,576
Slide 25: SEC Stand-Alone Reserves Summary & PV-10 – Mid-Year 2021
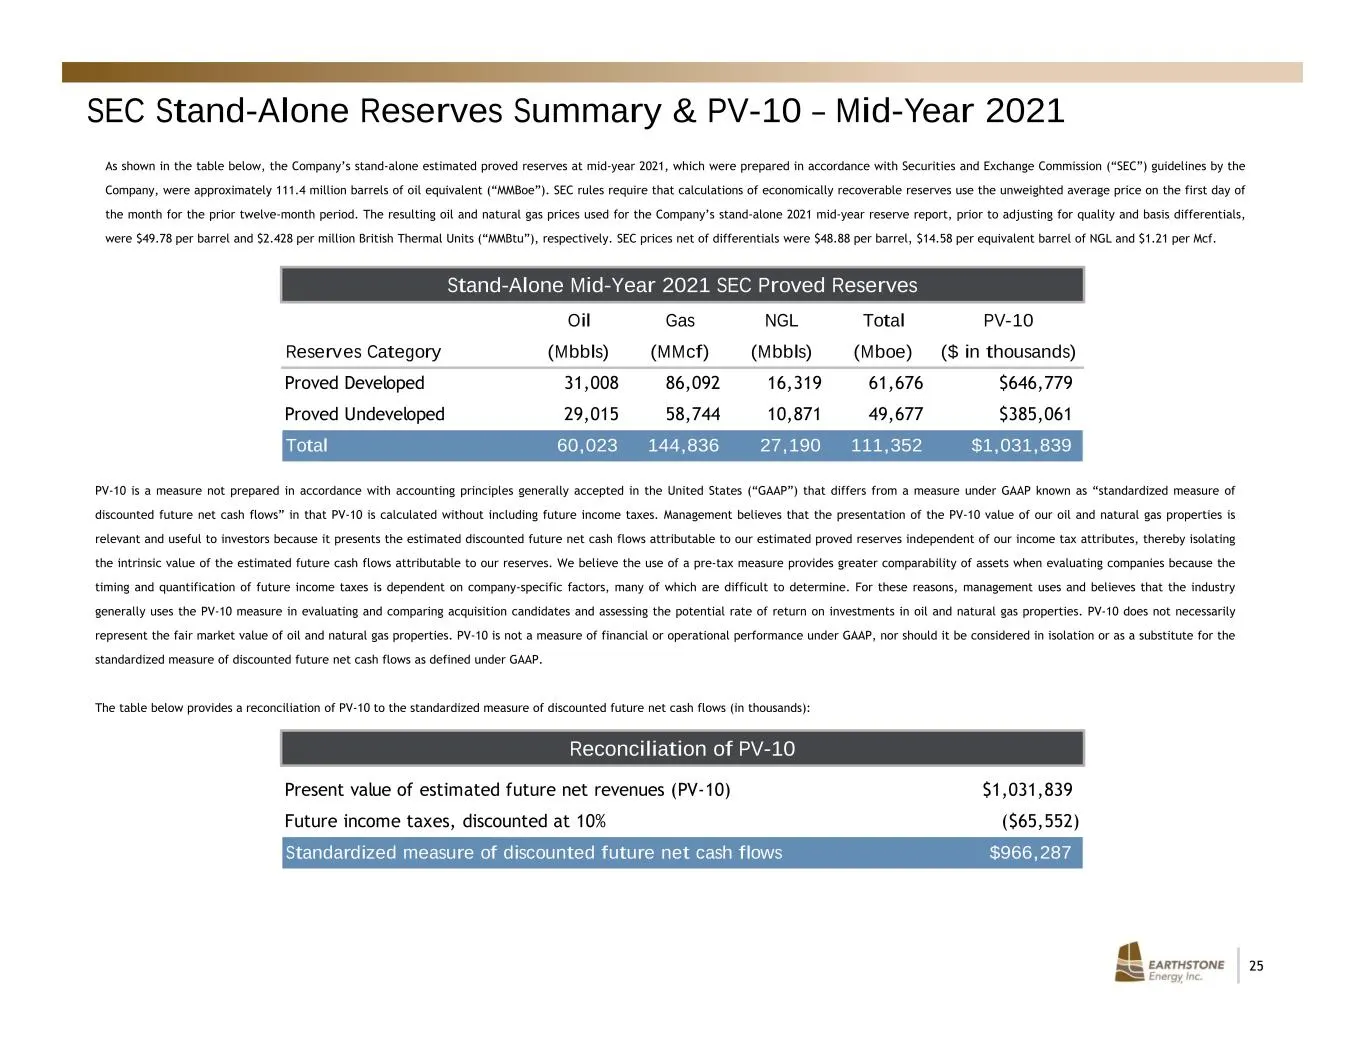
25 SEC Stand-Alone Reserves Summary & PV-10 – Mid-Year 2021 As shown in the table below, the Company’s stand-alone estimated proved reserves at mid-year 2021, which were prepared in accordance with Securities and Exchange Commission (“SEC”) guidelines by the Company, were approximately 111.4 million
Slide 26: Alternative Reserves Summary – Mid-Year 2021
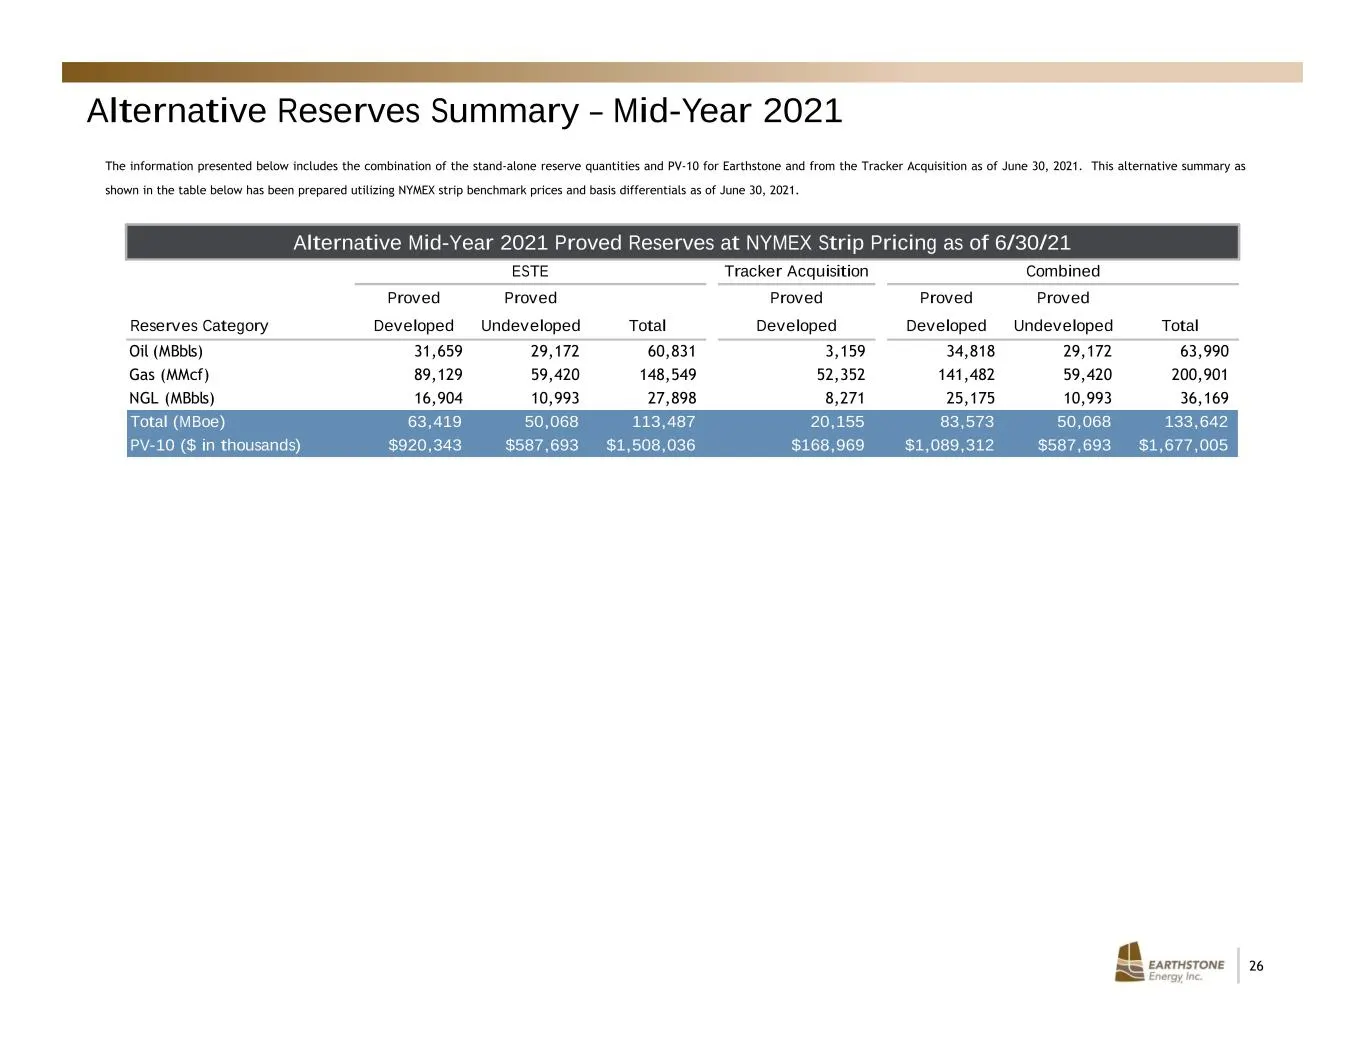
26 Alternative Reserves Summary – Mid-Year 2021 The information presented below includes the combination of the stand-alone reserve quantities and PV-10 for Earthstone and from the Tracker Acquisition as of June 30, 2021. This alternative summary as shown in the table below has been prepared utilizi
Slide 27: Reconciliation of Non-GAAP Financial Measure – Adjusted EBITDAX
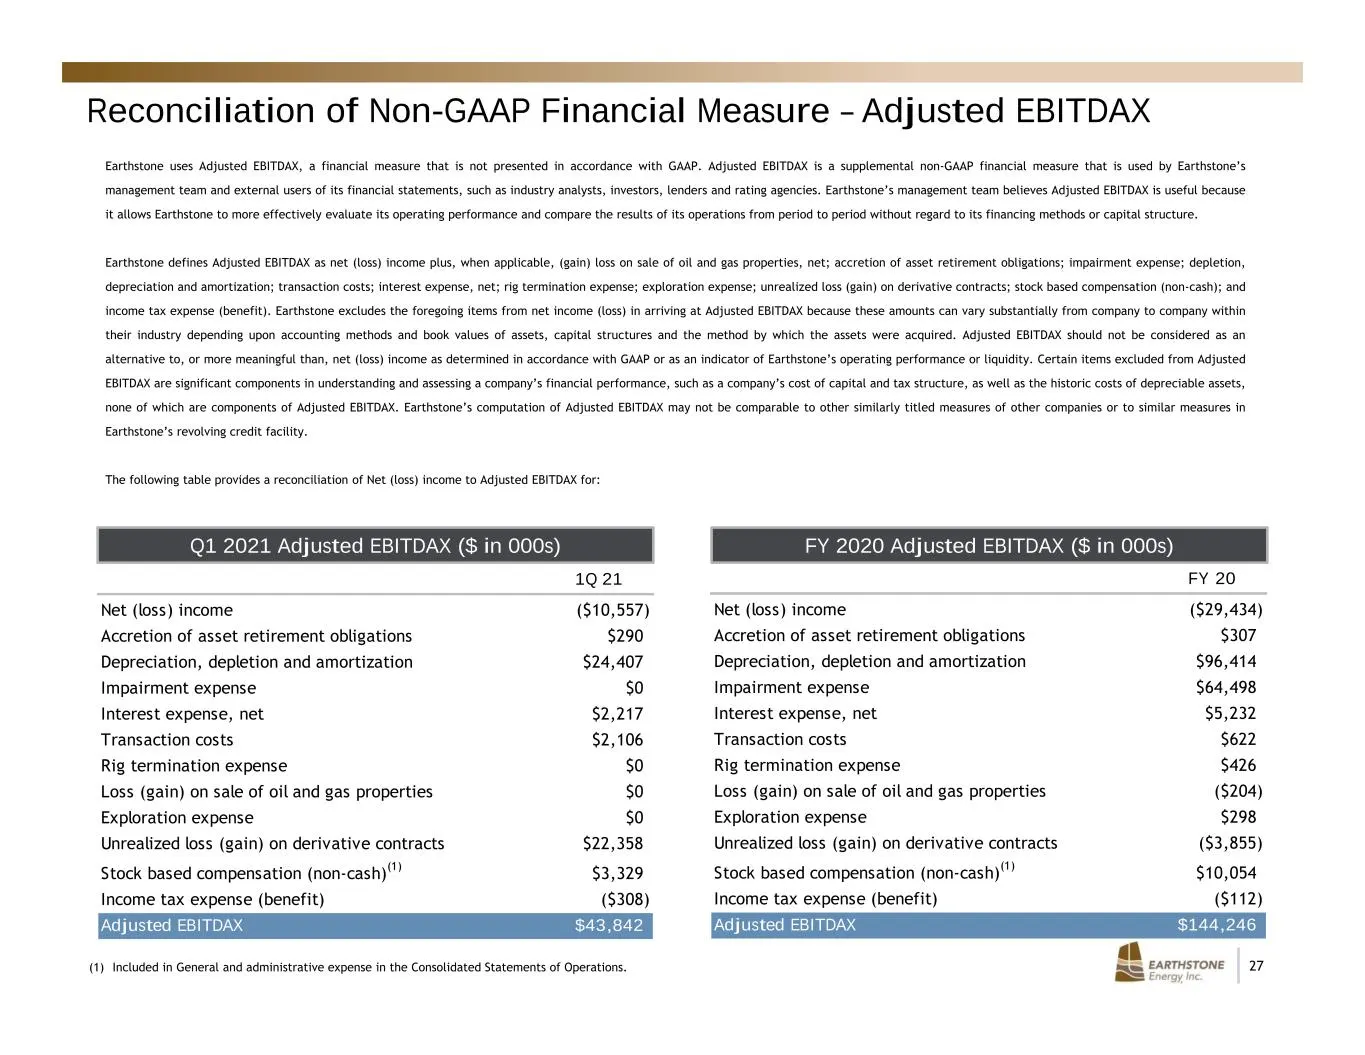
27 Reconciliation of Non-GAAP Financial Measure – Adjusted EBITDAX Earthstone uses Adjusted EBITDAX, a financial measure that is not presented in accordance with GAAP. Adjusted EBITDAX is a supplemental non-GAAP financial measure that is used by Earthstone’s management team and external users of its
Slide 28: Reconciliation of Non-GAAP Financial Measure – Adjusted EBITDAX
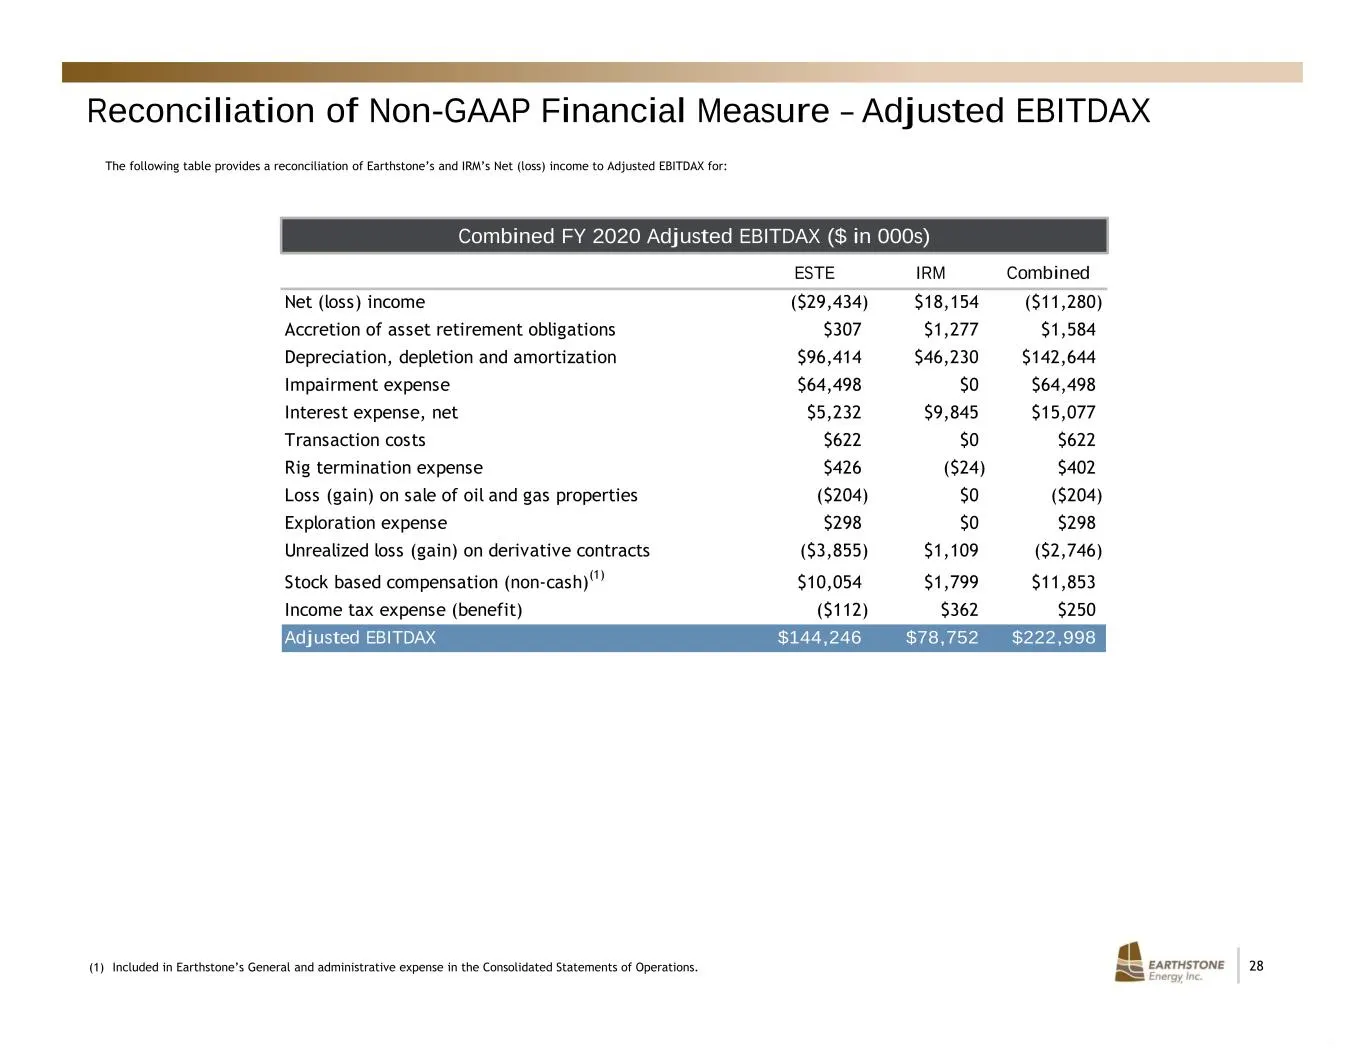
28 Reconciliation of Non-GAAP Financial Measure – Adjusted EBITDAX (1) Included in Earthstone’s General and administrative expense in the Consolidated Statements of Operations. Combined FY 2020 Adjusted EBITDAX ($ in 000s) ESTE IRM Combined Net (loss) income ($29,434) $18,154 ($11,280) Accretion of
Source: SEC EDGAR · 8-K filed Jul 23, 2021
More decks from Earthstone Energy Inc
 Merger or Acquisition (August 2023)20 slides · Aug 23, 2023
 EnerCom Denver 202332 slides · Aug 14, 2023
 Q2 2023 Earnings Presentation25 slides · Aug 2, 2023
 Investor Presentation (June 2023)29 slides · Jun 20, 2023
 Merger or Acquisition (June 2023)16 slides · Jun 16, 2023
 Q1 2023 Earnings Presentation33 slides · May 3, 2023