Fleetwood Enterprises — Non-Deal Roadshow (April 2004)
36 slides from Fleetwood Enterprises's roadshow presentation, Apr 19, 2004
Slide 1: Investment Community Meetings April 2004
‘WS FLEETWOOD. Investment Community Meetings April 2004
Slide 2: Safe Harbor Statement
Safe Harbor Statement This presentation contains certain forward-looking statements and information based on the beliefs of Fleetwood's management as well as assumptions made by, and information currently available fo, Fleetwood's management. Such statements reflect the current views of Fleetwood wi
Slide 3: Fleetwood Enterprises, Inc.
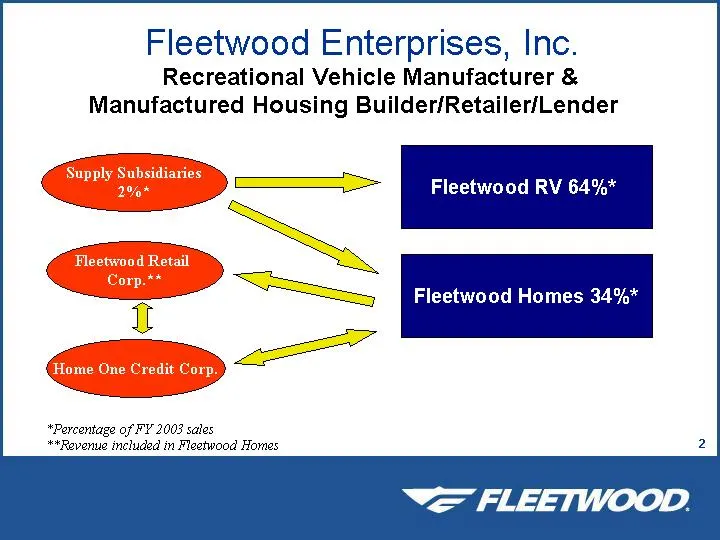
Fleetwood Enterprises, Inc. Recreational Vehicle Manufacturer & Manufactured Housing Builder/Retailer/Lender Fleetwood RV 64%* Fleetwood Homes 34%* “Percentage of FY 2003 sales “Revenue included in Fleetwood Homes
Slide 4: Leadership Position
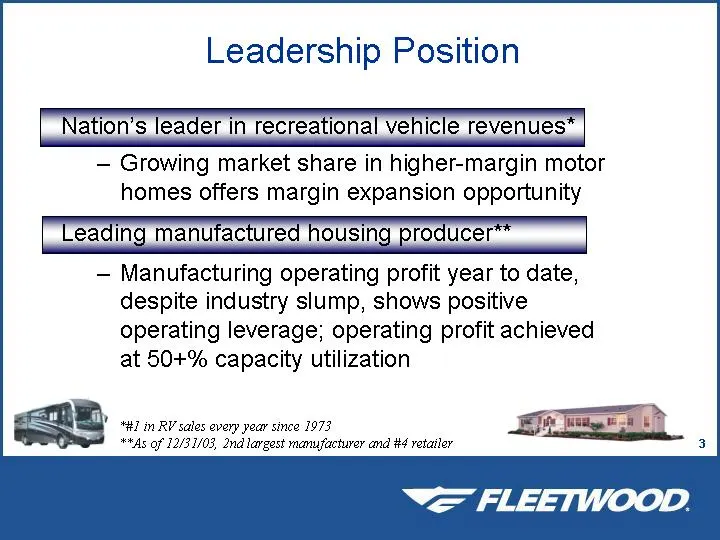
Leadership Position Nation’s leader in recreational vehicle revenues* — Growing market share in higher-margin motor homes offers margin expansion opportunity Leading manufactured housing producer** — Manufacturing operating profit year to date, Pa despite industry slump, shows positive operating lev
Slide 5: Key Elements of Our Strategy
Key Elements of Our Strategy Increase profitable market share in targeted higher- margin product segments Accelerate vertical integration in housing business Leverage and expand recognition of the Fleetwood brand Provide best product and value proposition to customers Increase operating margins and
Slide 6: Industry Growth — RVs
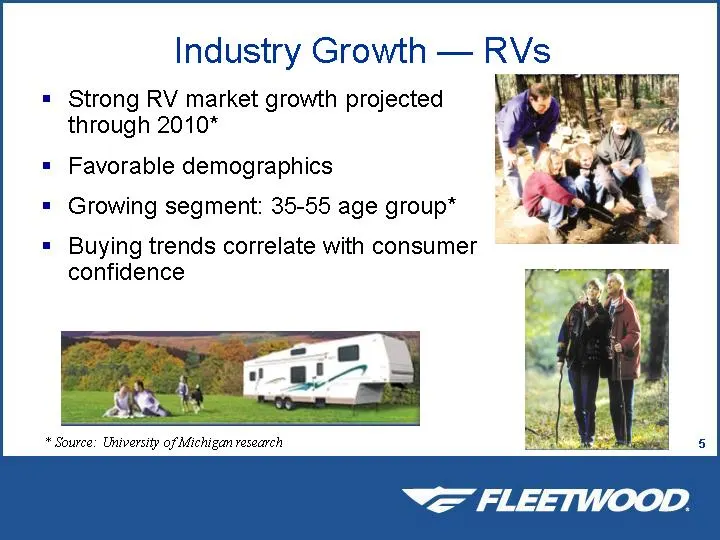
Industry Growth — RVs Strong RV market growth projected i through 2010* Favorable demographics Growing segment: 35-55 age group* Buying trends correlate with consumer confidence
Slide 7: RV Group — Market Share
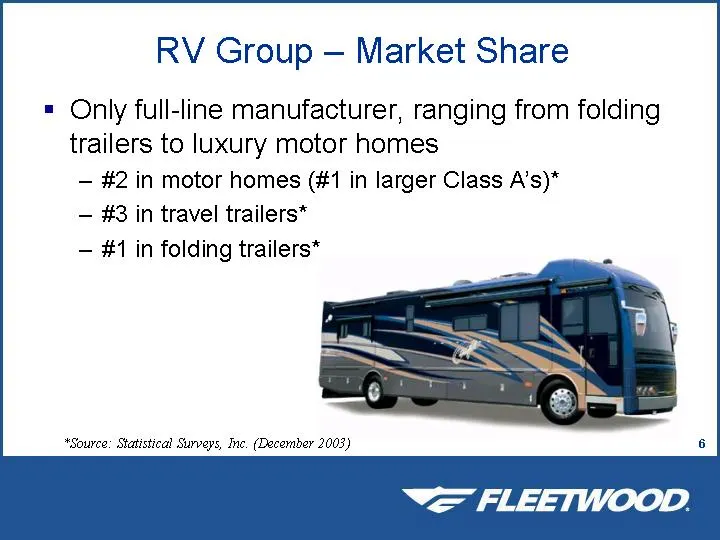
RV Group — Market Share = Only full-line manufacturer, ranging from folding trailers to luxury motor homes — #2 in motor homes (#1 in larger Class A’s)* — #8 in travel trailers* — #1 in folding trailers* "Source: Statistical Surveys, Tne. (December 2003)
Slide 8: RV Brand Strength
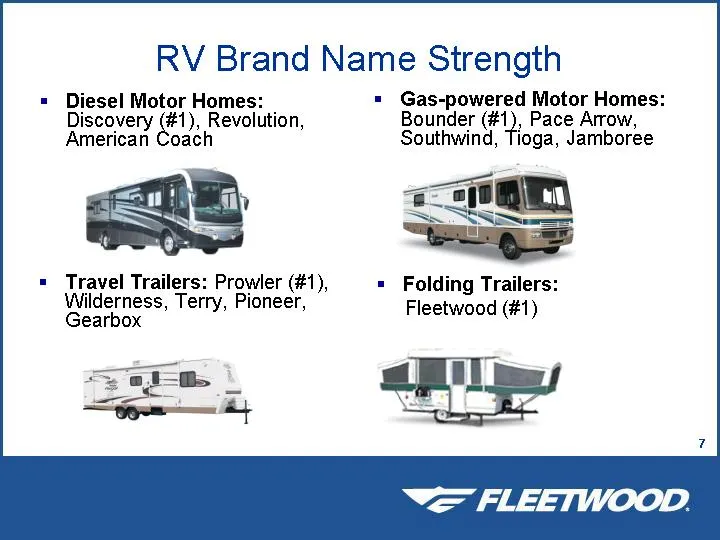
RV Brand nate Strength Diesel Motor Homes: Gas-powered Motor Homes: Discovery (Fl). Revolution, Bounder (#1), Pace Arrow, American Coach Southwind, ioga, Jamboree Havel Trailers: Prowler (#1), Folding Trailers: ilderness, Terry, Pioneer, Gearbox Fleetwood (#1)
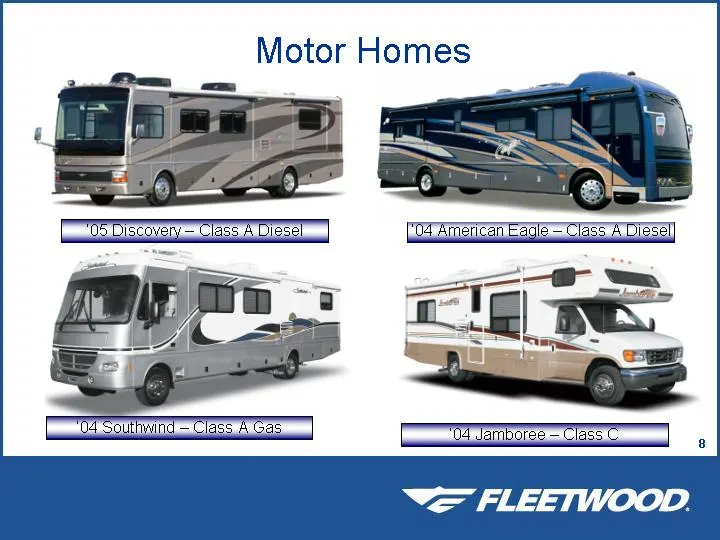
Slide 9: Motor Homes
Motor Homes OF Atelican Eagle — Class A Diesel]
Slide 10: Fleetwood Widening Class A Motor Home Lead
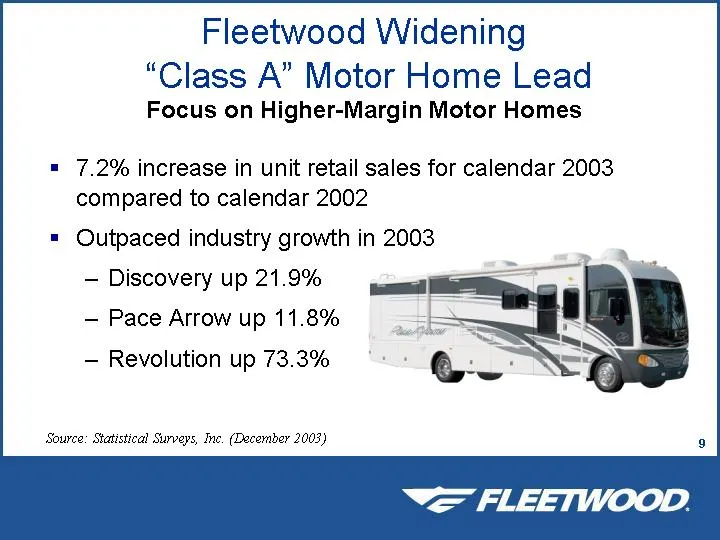
Fleetwood Widening “Class A” Motor Home Lead Focus on Higher-Margin Motor Homes = 7.2% increase in unit retail sales for calendar 2003 compared to calendar 2002 = Outpaced industry growth in 2003 — Discovery up 21.9% ae — Pace Arrow up 11.8% i — Revolution up 73.3% Source: Statistical Surveys, Tne.
Slide 11: Class A Leaders
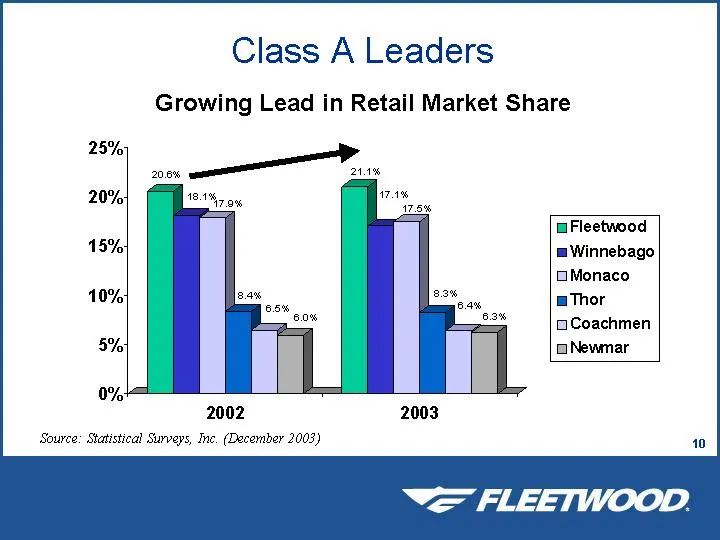
Class A Leaders Growing Lead in Retail Market Share 25% 20.8% —_———... 20% Fleetwood 15%: mWinnebago Monaco 10% uThor Coachmen 5%: Newmar 0%: 2002 Source: Statistical Surveys, Tne. (December 2003) “= FLEETWOOD.
Slide 12: Travel Trailers
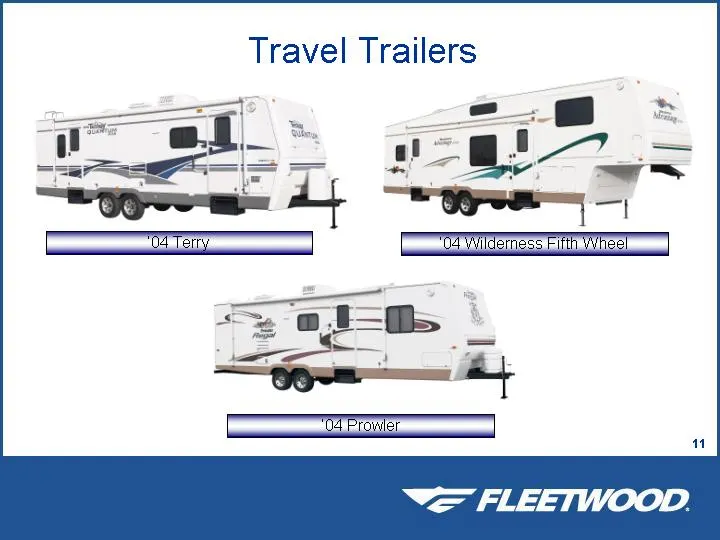
Travel Trailers
Slide 13: Travel Trailers
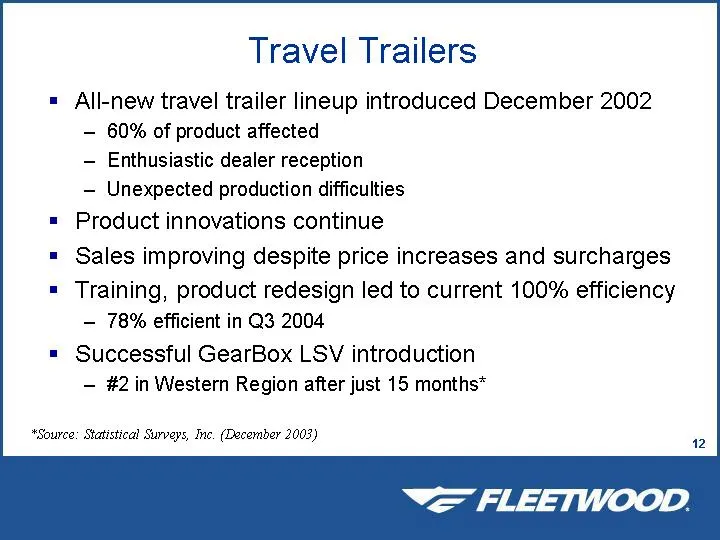
Travel Trailers All-new travel trailer lineup introduced December 2002 — 60% of product affected — Enthusiastic dealer reception — Unexpected production difficulties Product innovations continue Sales improving despite price increases and surcharges Training, product redesign led to current 100% eff
Slide 14: Fifth-Wheel Market Share
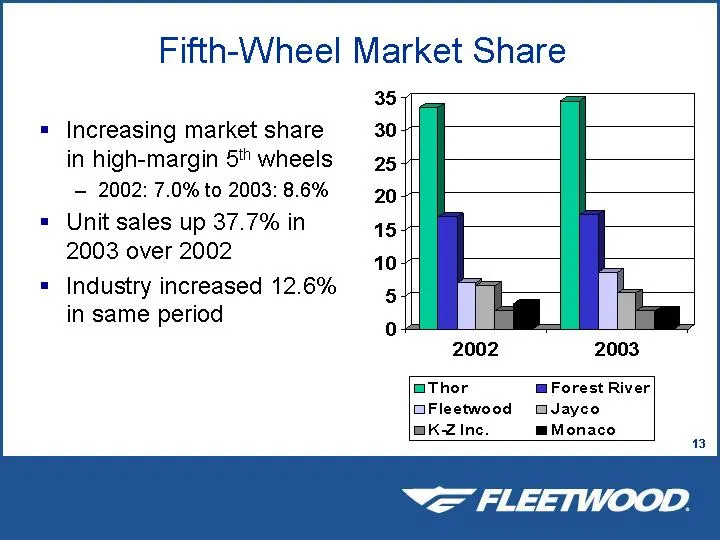
Fifth-Wheel Market Share = Increasing market share in high-margin 5" wheels — 2002: 7.0% to 2003: 8.6% = Unit sales up 37.7% in 2003 over 2002 = Industry increased 12.6% in same period 2002 2003 mThor m Forest River OFleetwood Jayco wkKZine. m Monaco “= FLEETWOOD.
Slide 15
Slide 16: Manufactured Housing
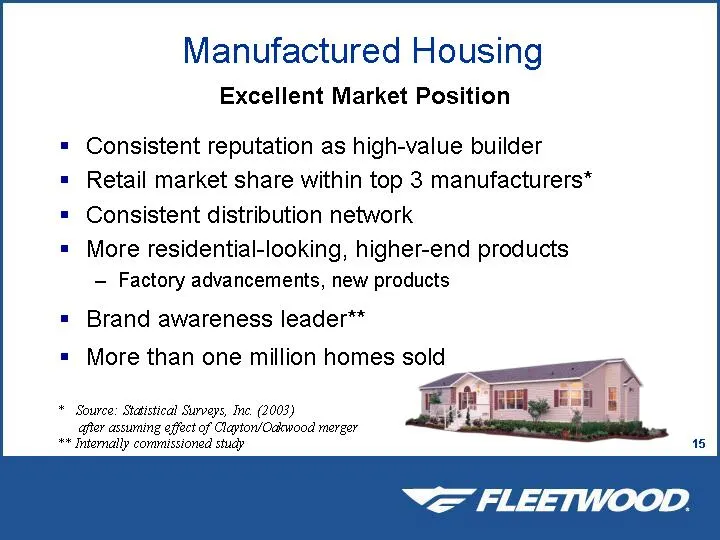
Manufactured Housing Excellent Market Position Consistent reputation as high-value builder Retail market share within top 3 manufacturers* Consistent distribution network More residential-looking, higher-end products — Factory advancements, new products Brand awareness leader** More than one million
Slide 17: Historical Overview
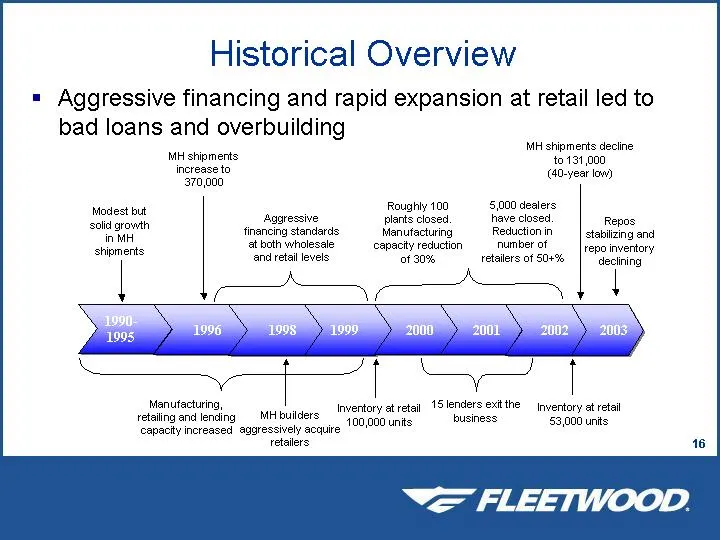
Historical Overview = Aggressive financing and rapid expansion at retail led to bad loans and overbuilding MH shipments dectne MH shipments to 131,000 inresceto A0-yea 370,000 wey m Roughly 100, 5,000 dealers Modest but Saeewi Aggressive plants closed. have closed. os eo financing standards Manufact
Slide 18: MH Industry Shipments
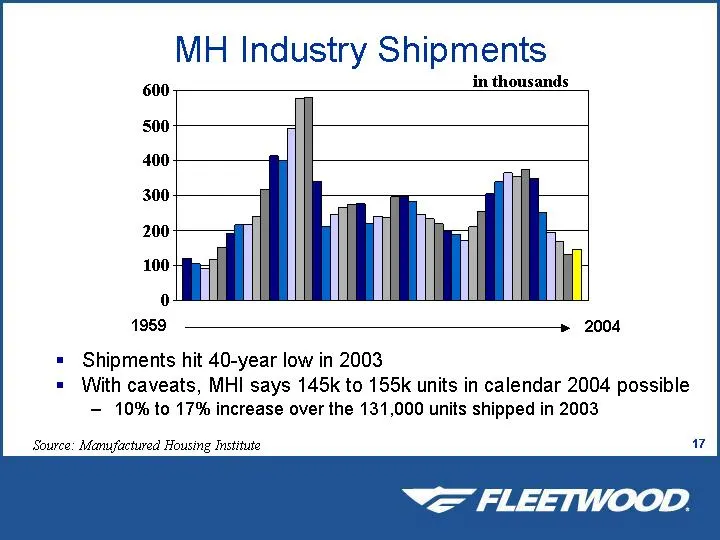
MH Industry Shipments in thousands 1959 » 2004 = Shipments hit 40-year low in 2003 = With caveats, MHI says 145k to 155k units in calendar 2004 possible - 10% to 17% increase over the 131,000 units shipped in 2003 Source: Manufactured Housing Institute
Slide 19: Strong Underlying Demand for Manufactured Housing
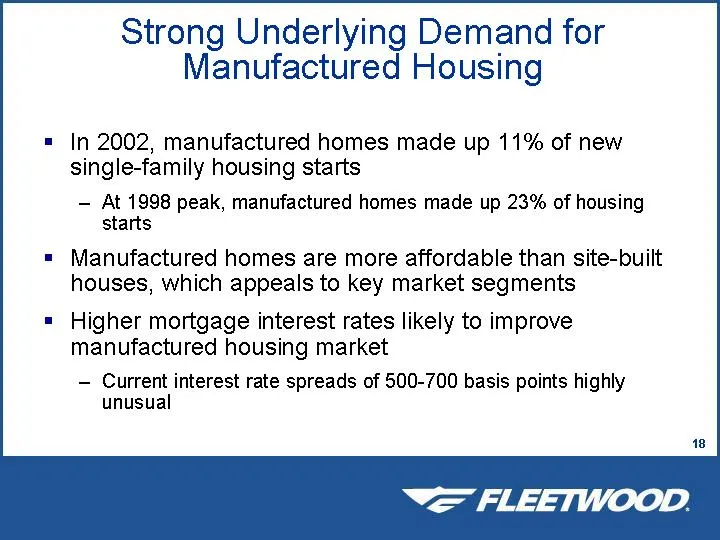
Strong Underlying Demand for Manufactured Housing = In 2002, manufactured homes made up 11% of new single-family housing starts — At 1998 peak, manufactured homes made up 23% of housing starts = Manufactured homes are more affordable than site-built houses, which appeals to key market segments = Hig
Slide 20: Strong Underlying Demand for Manufactured Housing
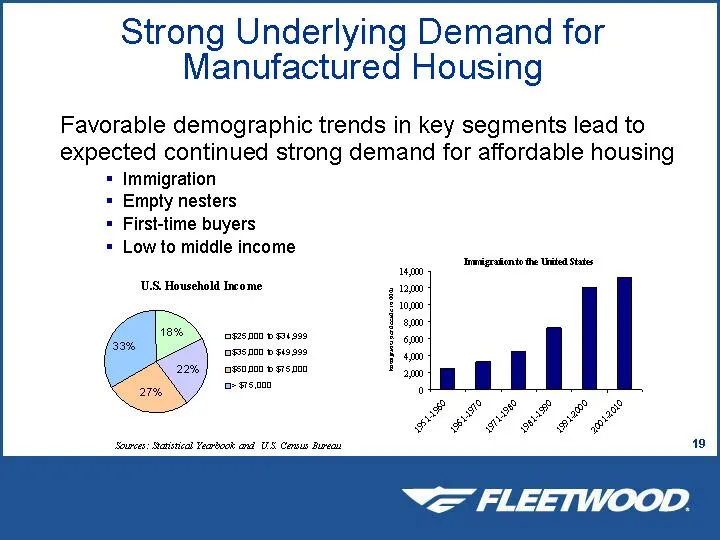
Strong Underlying Demand for Manufactured Housing Favorable demographic trends in key segments lead to expected continued strong demand for affordable housing = Immigration = Empty nesters = First-time buyers = Low to middle income US. Household Income ages. © $94.99 535.0 w $49 999 casson00 w s75.0
Slide 21: Advantages of Manufactured Homes versus Site-Built Homes
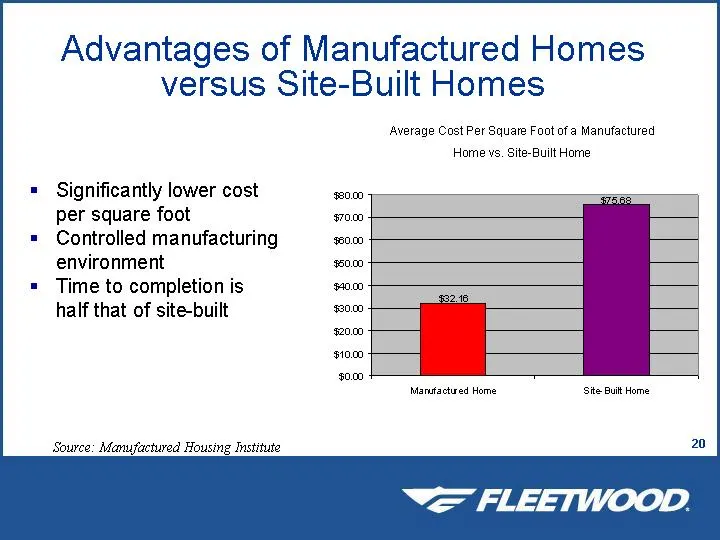
Advantages of Manufactured Homes versus Site-Built Homes Significantly lower cost per square foot Controlled manufacturing environment Time to completion is half that of site-built Source: Manufactured Housing Institute Average Cost Per Square Foot of a Manufactured Home vs, Site-Built Home Manutact
Slide 22: Major Players — 2003
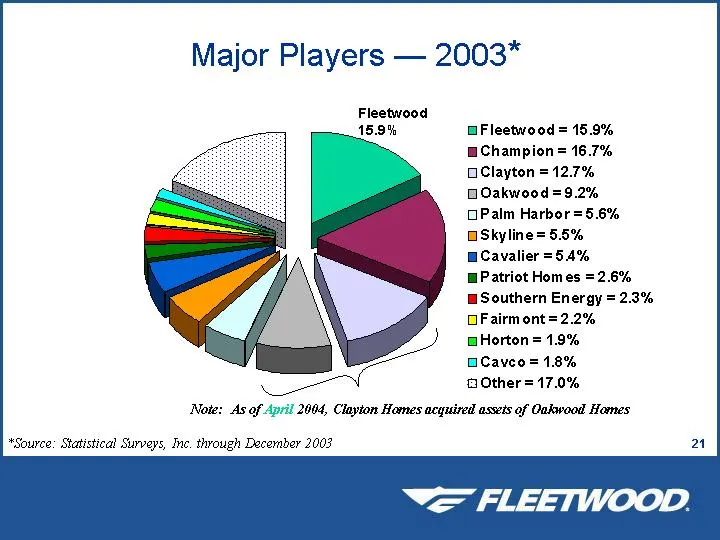
Major Players — 2003* Fleetwood 15.9% UFleetwood = 15.9% u Champion = 16.7% Clayton = 12.7% Oakwood =9.2% Palm Harbor =5.6% DSkyline=5.5% Cavalier =5.4% Patriot Homes = 2.6% Southern Energy = 2.3% Fairmont =2.2% Horton = 19% BCaveo = 18% Other = 17.0% Note: As of April 2004, Clayton Homes acquired a
Slide 23: Industry Poised for Recovery
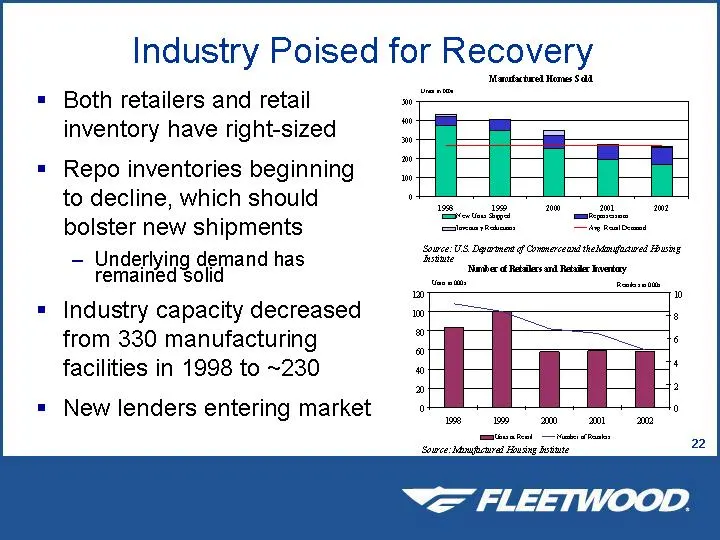
Industry Poised for Recovery Both retailers and retail inventory have right-sized Repo inventories beginning to decline, which should bolster new shipments — Underlying demand has remained solid Industry capacity decreased from 330 manufacturing facilities in 1998 to ~230 New lenders entering market
Slide 24: Manufactured Housing: Fleetwood Ready for Growth
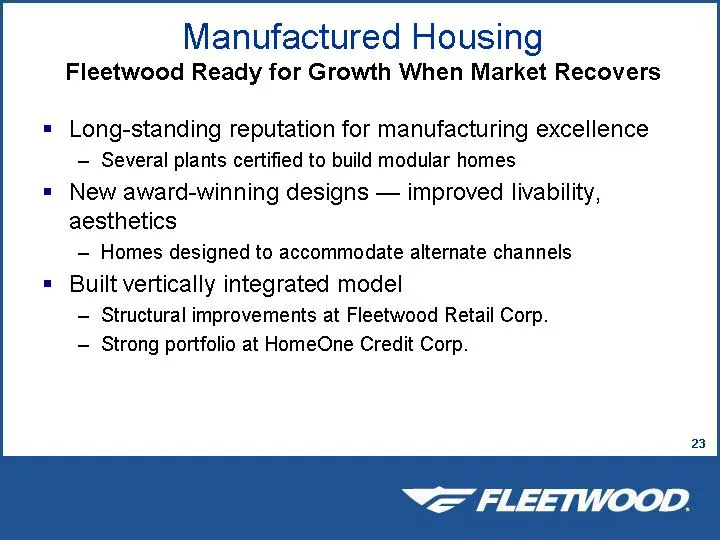
Manufactured Housing Fleetwood Ready for Growth When Market Recovers = Long-standing reputation for manufacturing excellence — Several plants certified to build modular homes = New award-winning designs — improved livability, aesthetics — Homes designed to accommodate alternate channels = Built vert
Slide 25: Manufacturing Excellence
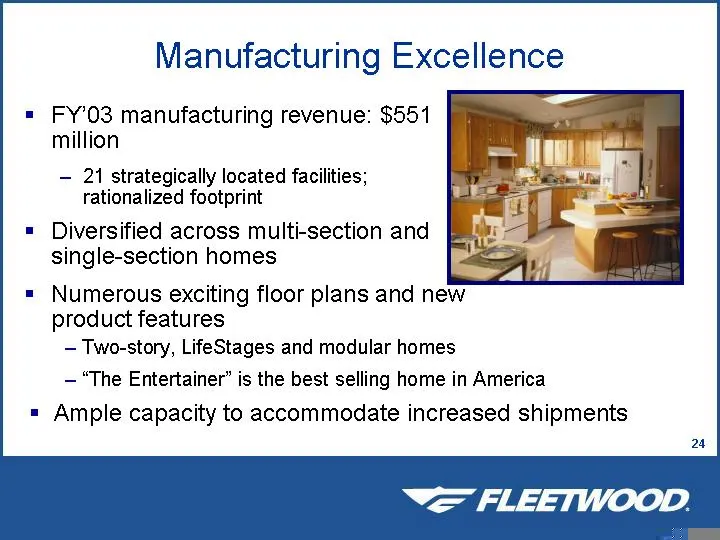
Manufacturing Excellence FY’03 manufacturing revenue: $551 million — 21 strategically located facilities; rationalized footprint Diversified across multi-section and single-section homes Numerous exciting floor plans and new product features - Two-story, LifeStages and modular homes — “The Entertain
Slide 26: Fleetwood Homes — Retail Network
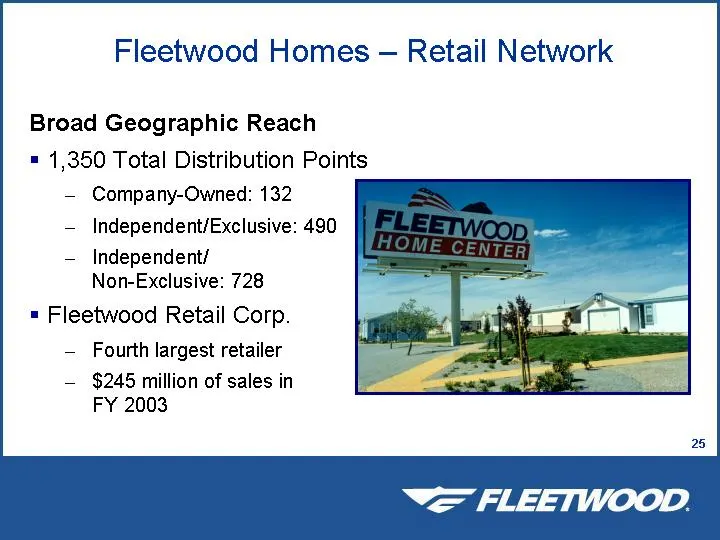
Fleetwood Homes — Retail Network Broad Geographic Reach = 1,350 Total Distribution Points — Company-Owned: 132 — Independent/Exclusive: 490 — Independent/ Non-Exclusive: 728 = Fleetwood Retail Corp. — Fourth largest retailer — $245 million of sales in FY 2003 “= FLEETWOOD.
Slide 27: HomeOne Credit Corp. — Lending Opportunities
$y HOMEONE '- Lending Opportunities CREDIT CORP Business launched May 2002 Funding loans for FRC customers; beginning to fund exclusive retailers High portfolio quality Originated ~$50 million in loans through March 2004; portfolio growing by $2 — $4 million per month $75 million warehouse line in D
Slide 28: Financial Overview
Financial Overview “= FLEETWOOD.
Slide 29: Restructuring Steps
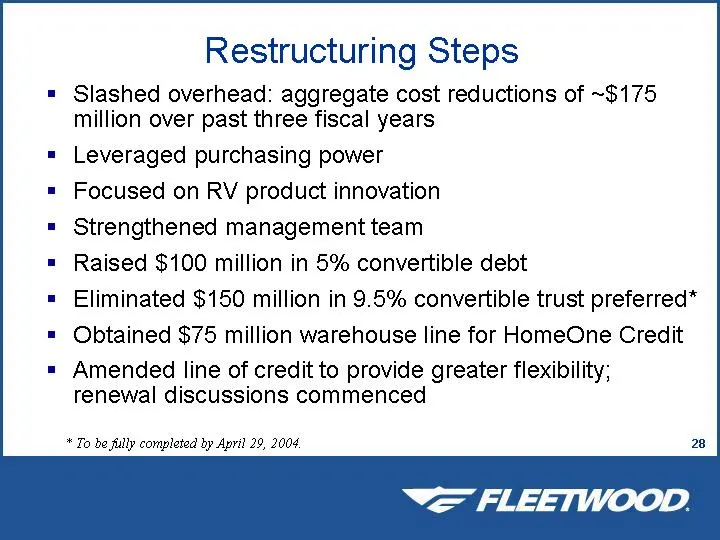
Restructuring Steps Slashed overhead: aggregate cost reductions of ~$175 million over past three fiscal years Leveraged purchasing power Focused on RV product innovation Strengthened management team Raised $100 million in 5% convertible debt Eliminated $150 million in 9.5% convertible trust preferre
Slide 30: Restructuring Success
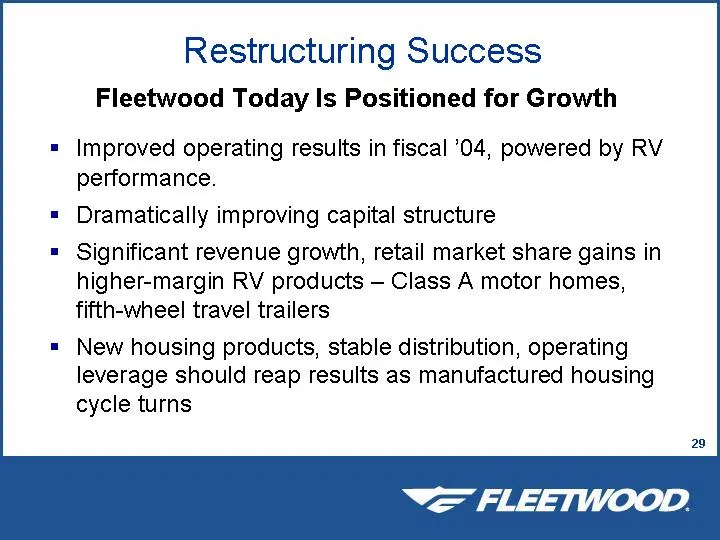
Restructuring Success Fleetwood Today Is Positioned for Growth Improved operating results in fiscal 04, powered by RV performance. Dramatically improving capital structure Significant revenue growth, retail market share gains in higher-margin RV products —- Class A motor homes, fifth-wheel travel tr
Slide 31: Continuing Challenges/Opportunities
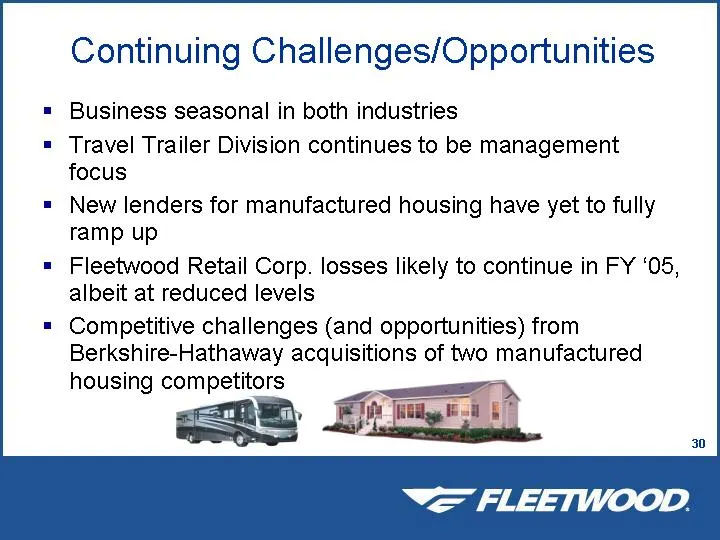
Continuing Challenges/Opportunities Business seasonal in both industries Travel Trailer Division continues to be management focus New lenders for manufactured housing have yet to fully ramp up Fleetwood Retail Corp. losses likely to continue in FY ‘05, albeit at reduced levels Competitive challenges
Slide 32: Summary Financial Results
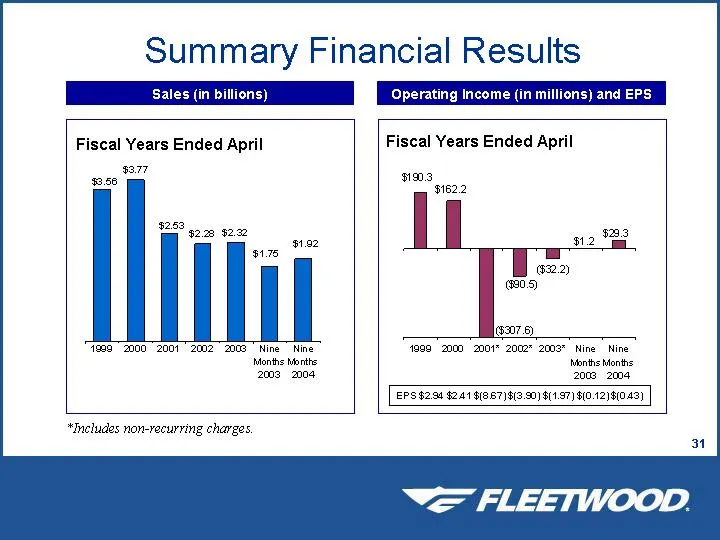
Summary Financial Results Fiscal Years Ended April Fiscal Years Ended April 3377 $3.58 31903 31622 "a0" an00 Zoo!” 2002” 200E Nine Nine 9992000 "200" 20m" 2003" Hine” Nine Months Months Months Months 2003 2004 2008 2004 EPS 4258 #241 $8B7}NS 50) 197) 30.12)91043) “Includes non-recurring charges. “=
Slide 33: FY 2004 Financial Results
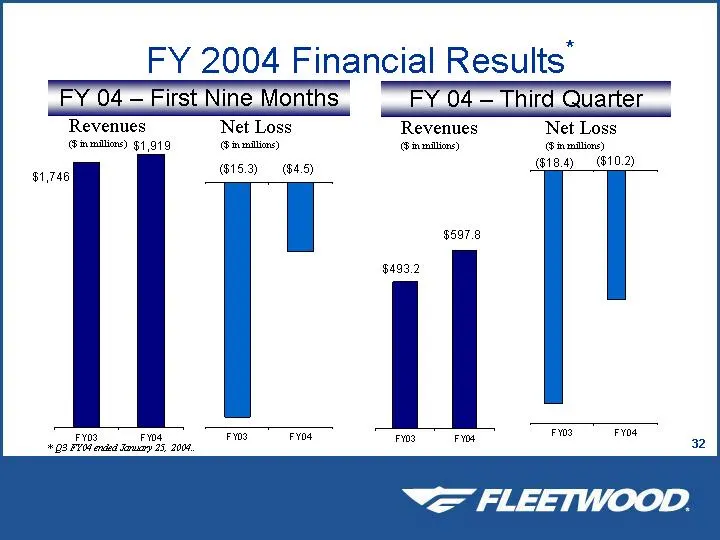
FY 2004 Financial Results’ Revenues Net Loss Revenues Net Loss Ginmillims) $1,919 (@inmlins) Gimli) Ginnie) | | 153) 649 grag G10. Fo Fyn 19 FY Ot ended Zawy 25, 2004 “= FLEETWOOD.
Slide 34: Balance Sheet and Liquidity
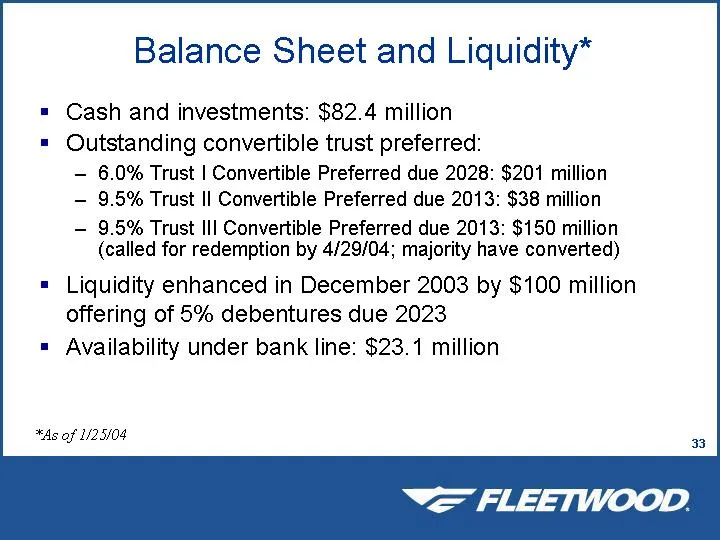
Balance Sheet and Liquidity* Cash and investments: $82.4 million Outstanding convertible trust preferred: — 6.0% Trust | Convertible Preferred due 2028: $201 million — 9.5% Trust Il Convertible Preferred due 2013: $38 million — 9.5% Trust III Convertible Preferred due 2013: $150 million (called for
Slide 35: Summary
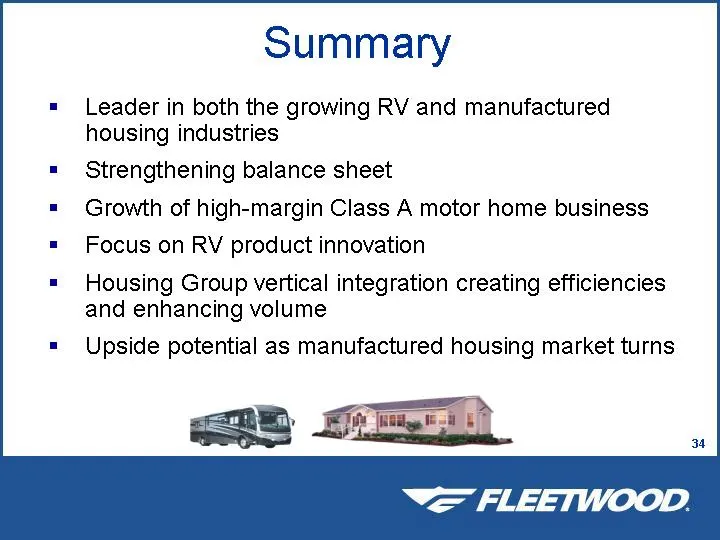
Summary Leader in both the growing RV and manufactured housing industries Strengthening balance sheet Growth of high-margin Class A motor home business Focus on RV product innovation Housing Group vertical integration creating efficiencies and enhancing volume Upside potential as manufactured housin
Slide 36: Searchable text section of graphics shown above
Searchable text section of graphics shown above Exh ibit 99.1 [LOGO] Investment Community Meetings April 2004 Saf e Harbor Statement This presentation contains certain forward-looking statements and information based on the beliefs of Fleetwood’s management as well as assumptions made by, and inform
Source: SEC EDGAR · 8-K filed Apr 19, 2004
More decks from Fleetwood Enterprises Inc
 IPO Roadshow (June 2008)43 slides · Jun 19, 2008
 Investor Presentation (May 2008)44 slides · May 19, 2008
 Investor Presentation (September 2007)48 slides · Sep 20, 2007
 Investor Presentation (November 2006)41 slides · Nov 13, 2006
 Investor Presentation (October 2006)46 slides · Oct 19, 2006
 Investor Presentation (November 2005)43 slides · Nov 3, 2005