Altra Industrial Motion — Q4 2016 Earnings Presentation
15 slides from Altra Industrial Motion's earnings presentation, Feb 27, 2017
Slide 1: Fourth Quarter 2016 Results
Fourth Quarter 2016 Results February 27, 2017 10:00 AM ET Dial In Number 877-407-8293 Domestic 201-689-8349 International Webcast at www.altramotion.com Replay Through March 13, 2017 877-660-6853 Domestic 201-612-7415 International Conference ID: # 13654961 Webcast Replay at www.altramotion.com Exhi
Slide 2: Safe Harbor Statement
Safe Harbor Statement Cautionary Statement Regarding Forward Looking Statements All statements, other than statements of historical fact included in this presentation are forward-looking statements, as that term is defined in the Private Securities Litigation Reform Act of 1995. These statements inc
Slide 3: Fourth Quarter 2016 Highlights
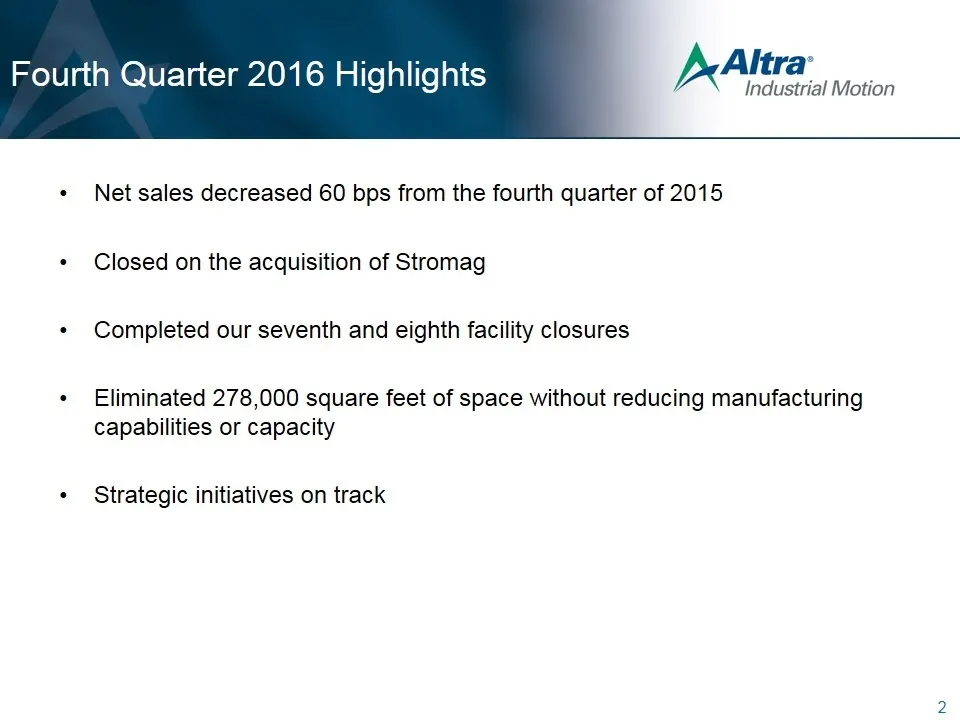
Fourth Quarter 2016 Highlights Net sales decreased 60 bps from the fourth quarter of 2015 Closed on the acquisition of Stromag Completed our seventh and eighth facility closures Eliminated 278,000 square feet of space without reducing manufacturing capabilities or capacity Strategic initiatives on t
Slide 4: Stromag Acquisition Transaction Overview
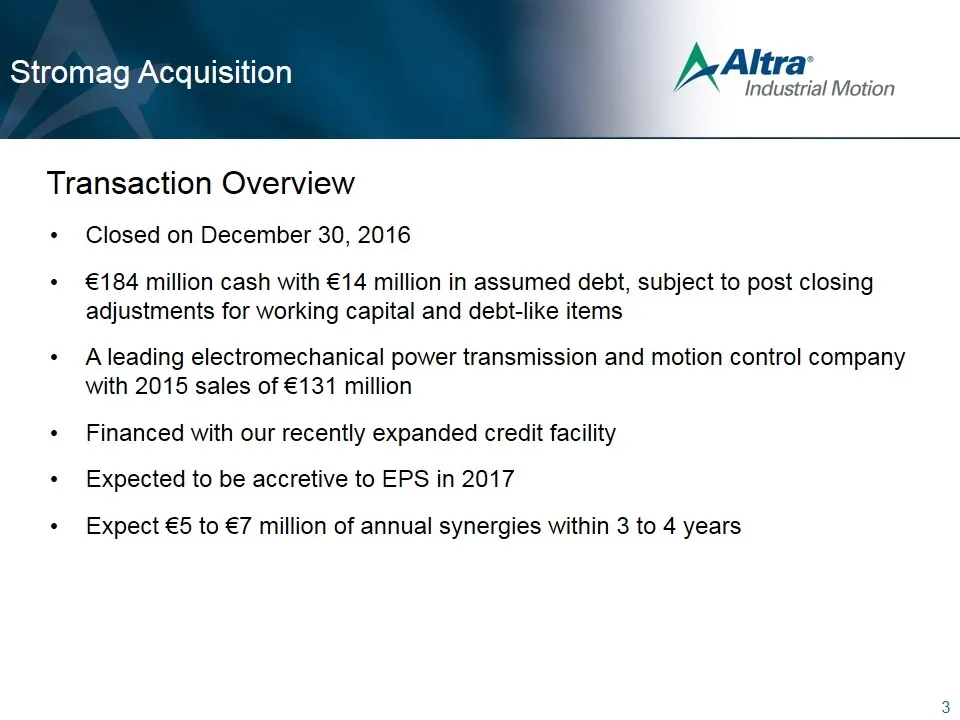
3 Stromag Acquisition Closed on December 30, 2016 €184 million cash with €14 million in assumed debt, subject to post closing adjustments for working capital and debt-like items A leading electromechanical power transmission and motion control company with 2015 sales of €131 million Financed with ou
Slide 5: Stromag Acquisition – The Company
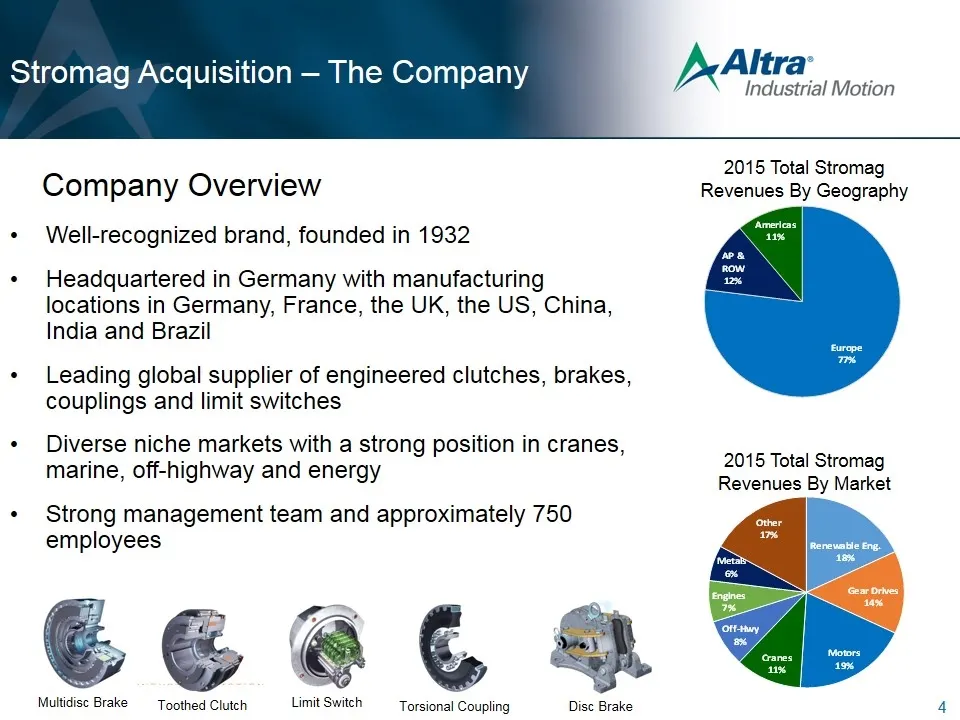
Well-recognized brand, founded in 1932 Headquartered in Germany with manufacturing locations in Germany, France, the UK, the US, China, India and Brazil Leading global supplier of engineered clutches, brakes, couplings and limit switches Diverse niche markets with a strong position in cranes, marine
Slide 6: Business Simplification On Track
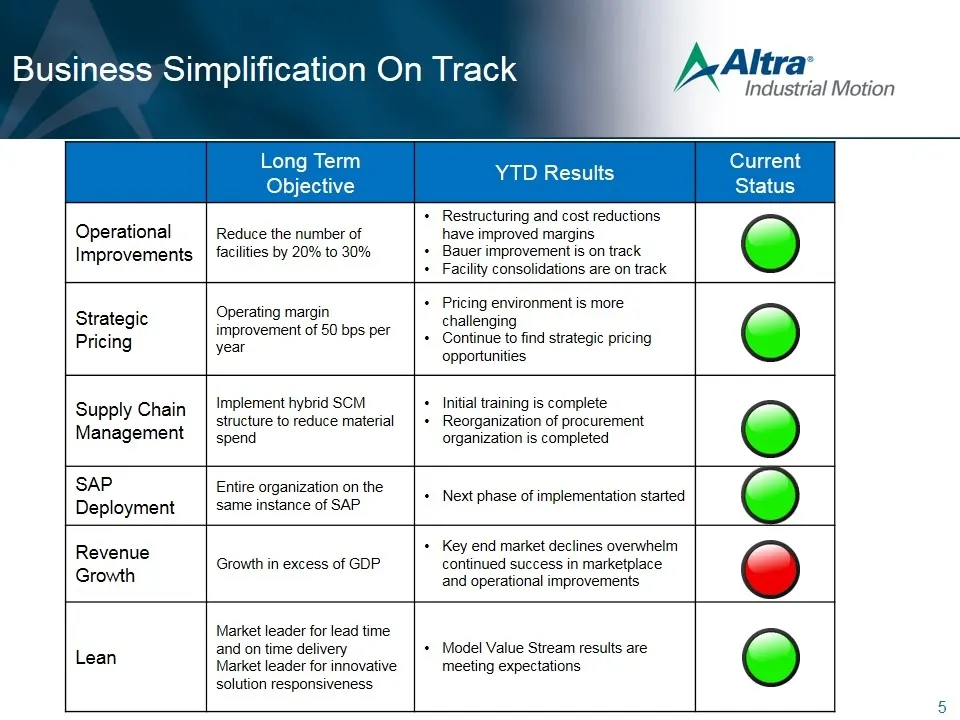
Business Simplification On Track 5 Long Term Objective YTD Results Current Status Operational Improvements Reduce the number of facilities by 20% to 30% Restructuring and cost reductions have improved margins Bauer improvement is on track Facility consolidations are on track Strategic Pricing Operat
Slide 7: End Market Review
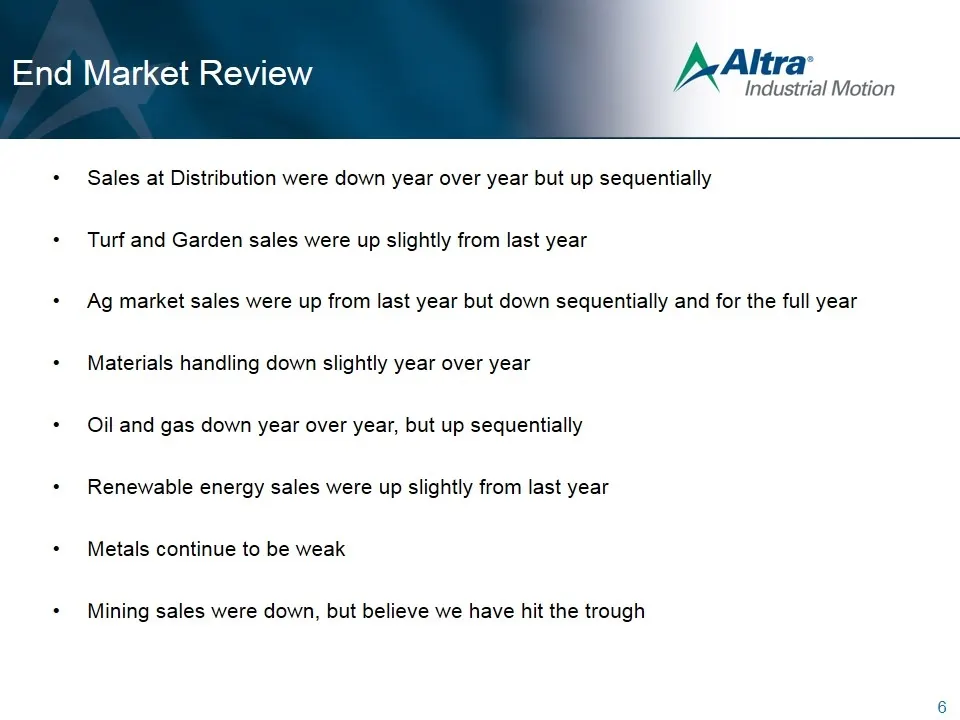
End Market Review Sales at Distribution were down year over year but up sequentially Turf and Garden sales were up slightly from last year Ag market sales were up from last year but down sequentially and for the full year Materials handling down slightly year over year Oil and gas down year over yea
Slide 8: Q4 2016 Financial Highlights
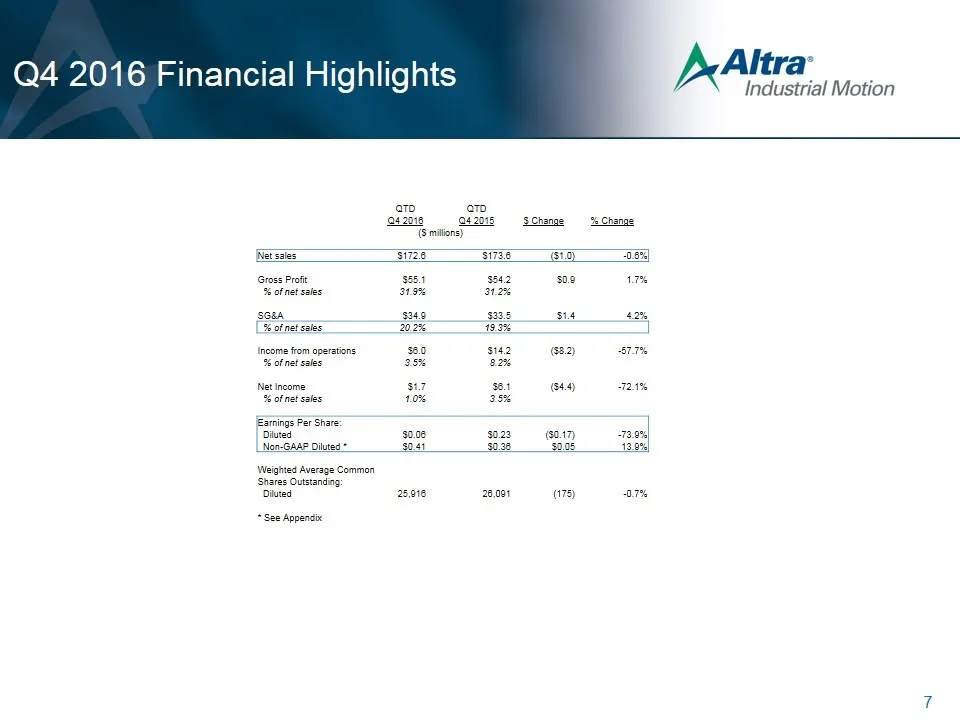
Q4 2016 Financial Highlights 7 QTD QTD Q4 2016 Q4 2015 $ Change % Change ($ millions) Net sales $172.6 $173.6 ($1.0) -0.6% Gross Profit $55.1 $54.2 $0.9 1.7% % of net sales 31.9% 31.2% SG&A $34.9 $33.5 $1.4 4.2% % of net sales 20.2% 19.3% Income from operations $6.0 $14.2 ($8.2) -57.7% % of net sale
Slide 9: Selected Segment Data
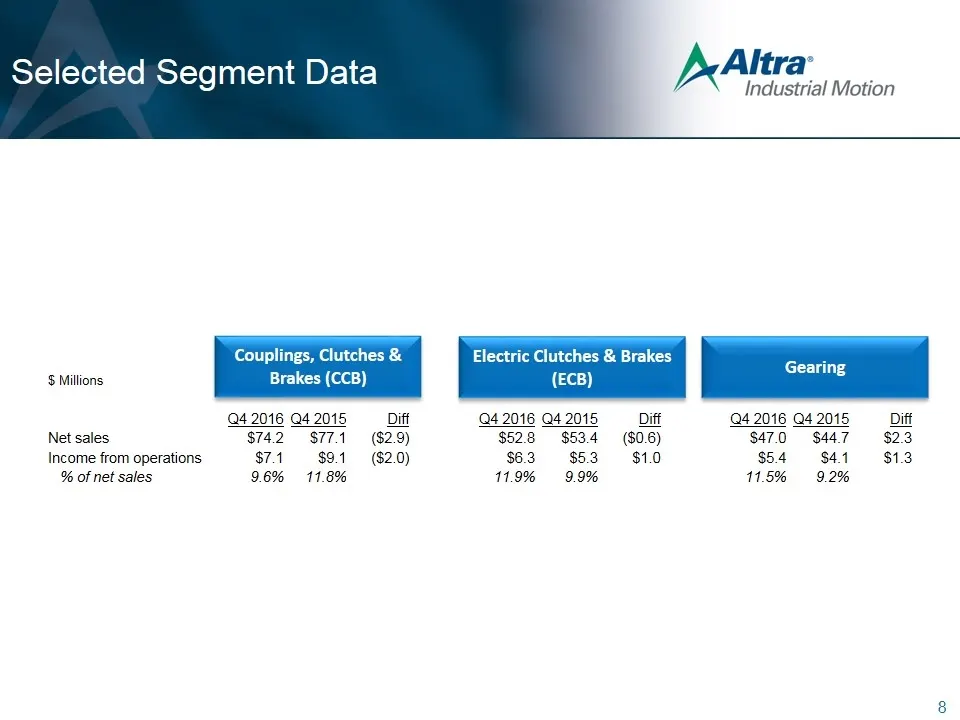
Selected Segment Data 8 $ Millions Q4 2016 Q4 2015 Diff Q4 2016 Q4 2015 Diff Q4 2016 Q4 2015 Diff Net sales $74.2 $77.1 ($2.9) $52.8 $53.4 ($0.6) $47.0 $44.7 $2.3 Income from operations $7.1 $9.1 ($2.0) $6.3 $5.3 $1.0 $5.4 $4.1 $1.3 % of net sales 9.6% 11.8% 11.9% 9.9% 11.5% 9.2% Couplings, Clutches
Slide 10: Balance Sheet Highlights
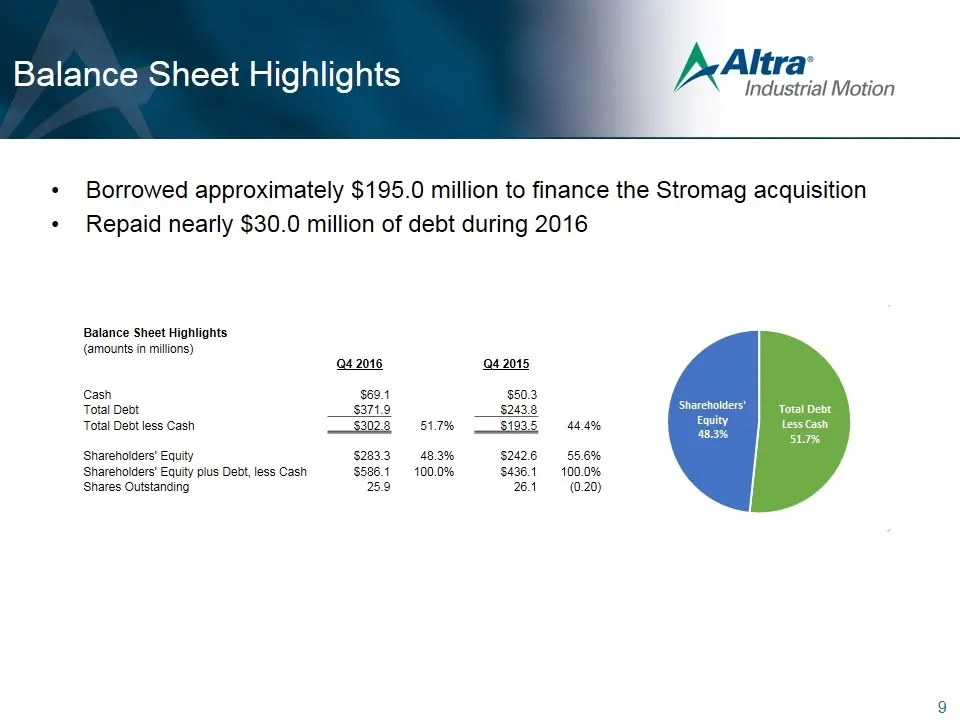
Balance Sheet Highlights Borrowed approximately $195.0 million to finance the Stromag acquisition Repaid nearly $30.0 million of debt during 2016 9 Balance Sheet Highlights (amounts in millions) Q4 2016 Q4 2015 Cash $69.1 $50.3 Total Debt $371.9 $243.8 Total Debt less Cash $302.8 51.7% $193.5 44.4%
Slide 11: Convertible Notes and Swap Update
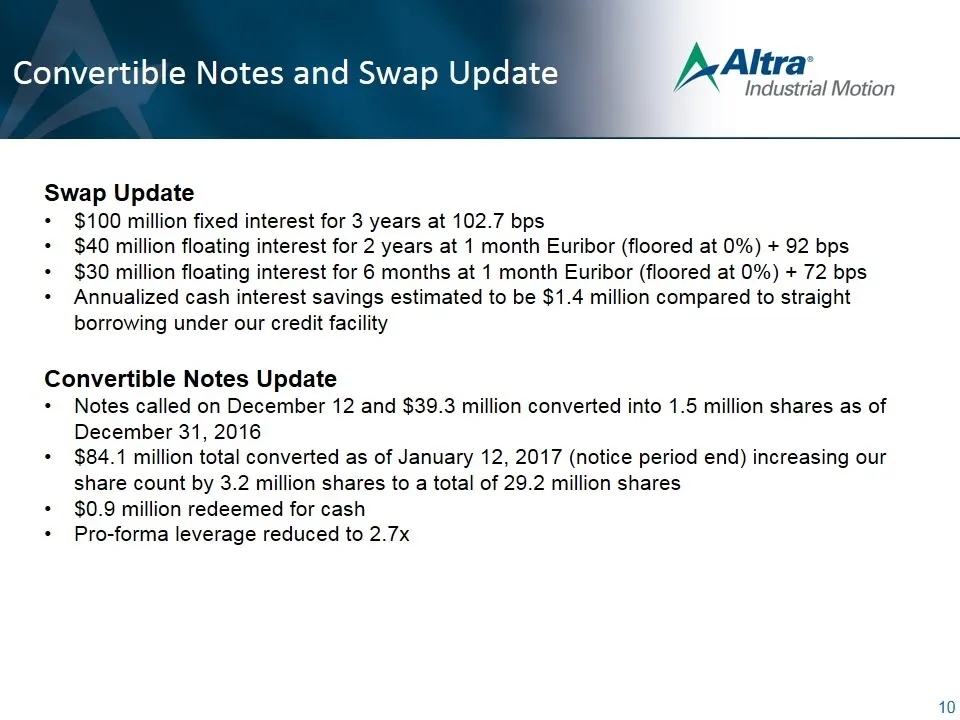
Convertible Notes and Swap Update Swap Update $100 million fixed interest for 3 years at 102.7 bps $40 million floating interest for 2 years at 1 month Euribor (floored at 0%) + 92 bps $30 million floating interest for 6 months at 1 month Euribor (floored at 0%) + 72 bps Annualized cash interest sav
Slide 12: 2017 Guidance
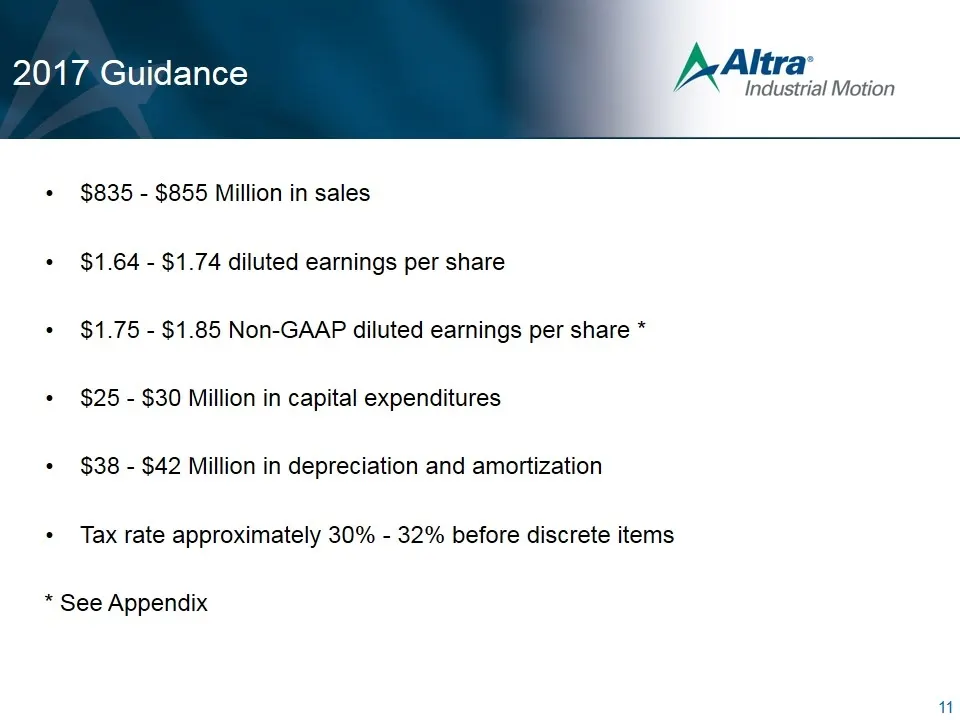
2017 Guidance $835 - $855 Million in sales $1.64 - $1.74 diluted earnings per share $1.75 - $1.85 Non-GAAP diluted earnings per share * $25 - $30 Million in capital expenditures $38 - $42 Million in depreciation and amortization Tax rate approximately 30% - 32% before discrete items * See Appendix 1
Slide 13: Discussion of Non-GAAP Measures
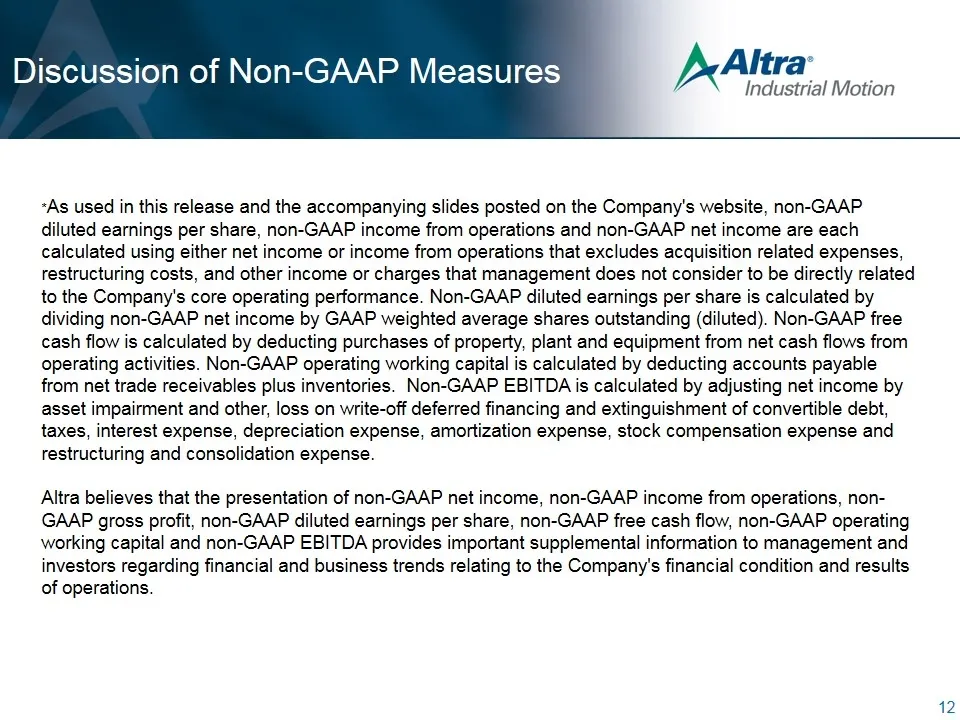
Discussion of Non-GAAP Measures *As used in this release and the accompanying slides posted on the Company's website, non-GAAP diluted earnings per share, non-GAAP income from operations and non-GAAP net income are each calculated using either net income or income from operations that excludes acqui
Slide 14: Appendix Non-GAAP Measures
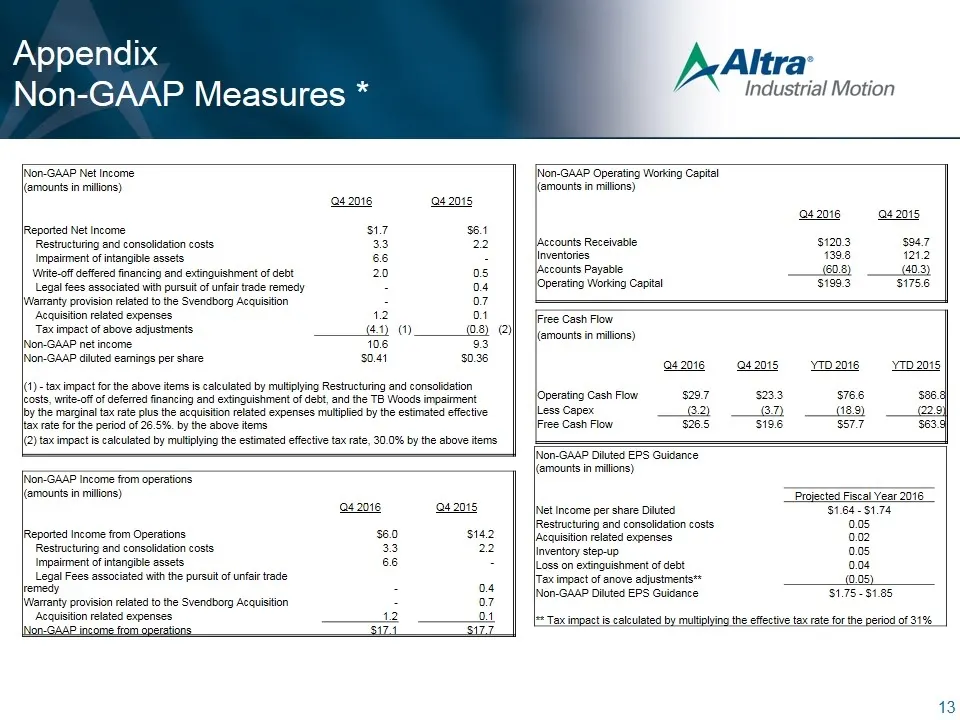
Appendix Non-GAAP Measures * 13 Non-GAAP Net Income (amounts in millions) Q4 2016 Q4 2015 Reported Net Income $1.7 $6.1 Restructuring and consolidation costs 3.3 2.2 Impairment of intangible assets 6.6 - Write-off deffered financing and extinguishment of debt 2.0 0.5 Legal fees associated with pursu
Slide 15: Appendix Non-GAAP EBITDA Reconciliation
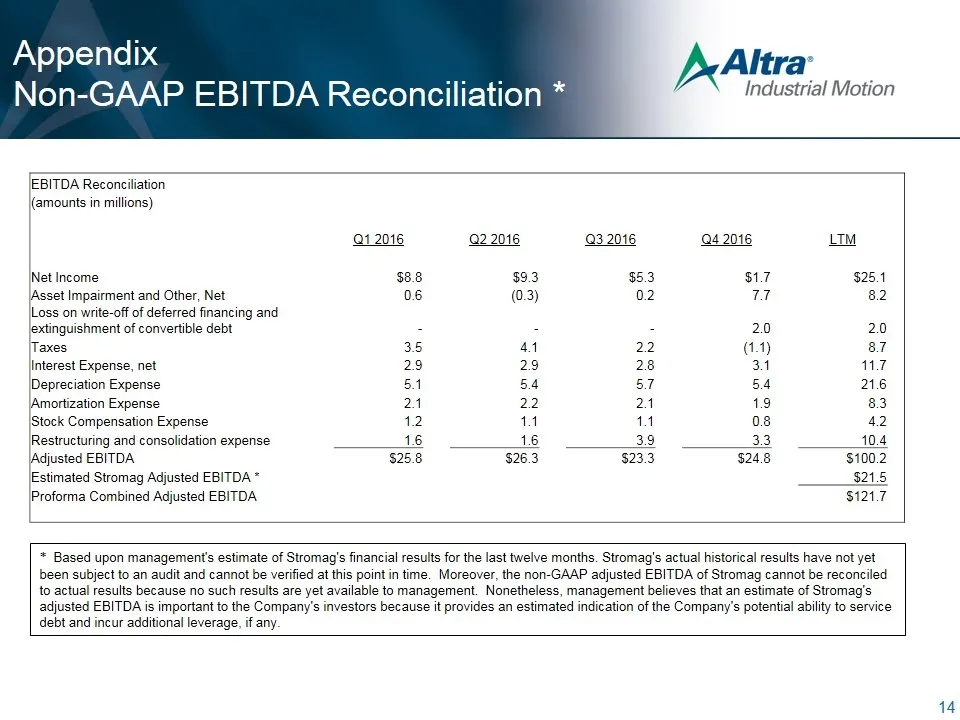
Appendix Non-GAAP EBITDA Reconciliation * 14 * Based upon management's estimate of Stromag's financial results for the last twelve months. Stromag's actual historical results have not yet been subject to an audit and cannot be verified at this point in time. Moreover, the non-GAAP adjusted EBITDA of
Source: SEC EDGAR · 8-K filed Feb 27, 2017
More decks from Altra Industrial Motion Corp
 Q2 2022 Earnings Presentation25 slides · Jul 28, 2022
 Q1 2022 Earnings Presentation25 slides · Apr 28, 2022
 Investor Day (March 2022)135 slides · Mar 11, 2022
 Q4 2021 Earnings Presentation17 slides · Feb 16, 2022
 Q3 2021 Earnings Presentation16 slides · Oct 22, 2021
 Q2 2021 Earnings Presentation16 slides · Jul 23, 2021