Meadowbrook Insurance Group Inc
Meadowbrook Insurance — Sidoti & Company Emerging Growth Institutional Investor Forum (March 2009)
26 slides from Meadowbrook Insurance's conference presentation, Mar 24, 2009
Slide 1: Sidoti & Company Emerging Growth Institutional Investor Forum
Sidoti & Company Emerging Growth Institutional Investor Forum March 24, 2009 Robert S. Cubbin, CEO
Slide 2: Forward-Looking Statements
2 Forward-Looking Statements Certain statements made by Meadowbrook Insurance Group, Inc. in this presentation may constitute forward-looking statements including, but not limited to, those statements that include the words "believes," "expects," "anticipates," "estimates," or similar expressions. P
Slide 3: Outline
3 Outline The Meadowbrook Approach Diverse Business Model Strategy Driving Enterprise Value and ROE
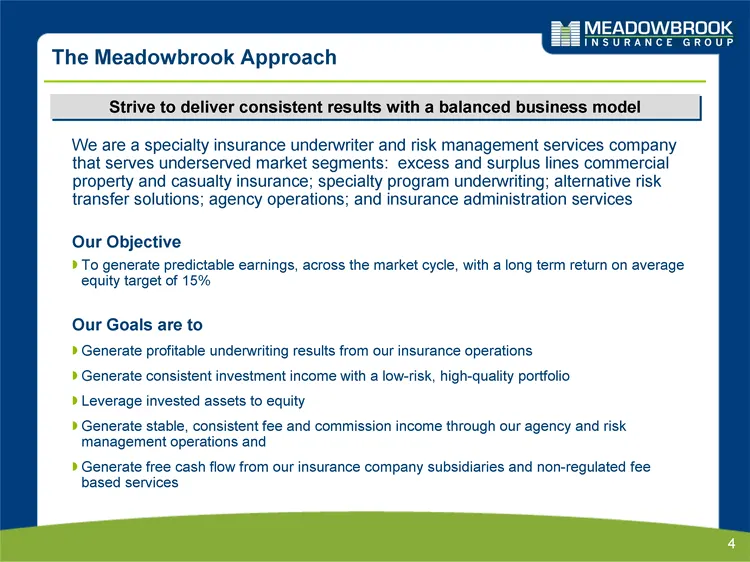
Slide 4: The Meadowbrook Approach
4 The Meadowbrook Approach Our Objective To generate predictable earnings, across the market cycle, with a long term return on average equity target of 15% Our Goals are to Generate profitable underwriting results from our insurance operations Generate consistent investment income with a low-risk, h
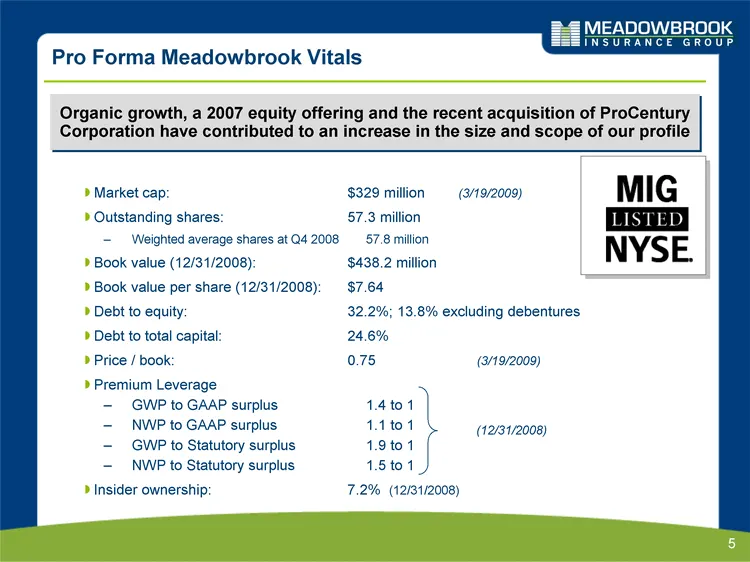
Slide 5: Pro Forma Meadowbrook Vitals
Market cap: $329 million (3/19/2009) Outstanding shares: 57.3 million Weighted average shares at Q4 2008 57.8 million Book value (12/31/2008): $438.2 million Book value per share (12/31/2008): $7.64 Debt to equity: 32.2%; 13.8% excluding debentures Debt to total capital: 24.6% Price / book: 0.75 (3/
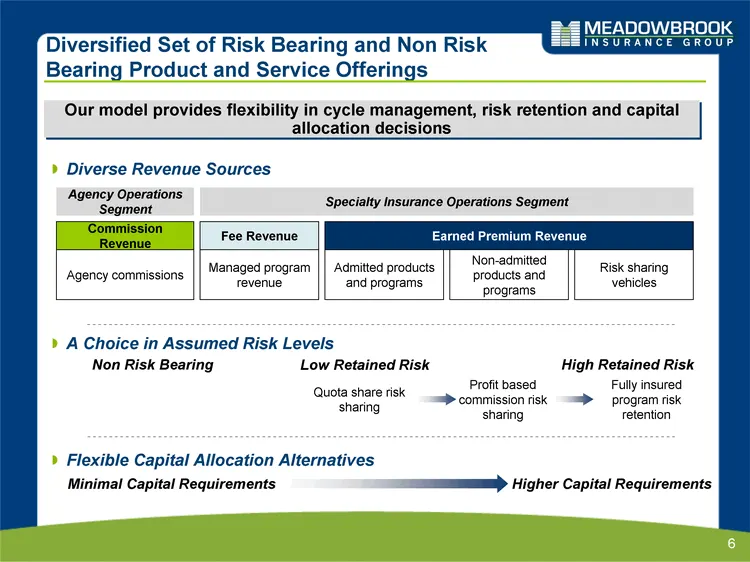
Slide 6: Diversified Set of Risk Bearing and Non Risk Bearing Product and Service Offerings
6 Diversified Set of Risk Bearing and Non Risk Bearing Product and Service Offerings Agency commissions Minimal Capital Requirements Higher Capital Requirements Low Retained Risk High Retained Risk Non Risk Bearing Diverse Revenue Sources A Choice in Assumed Risk Levels Flexible Capital Allocation A
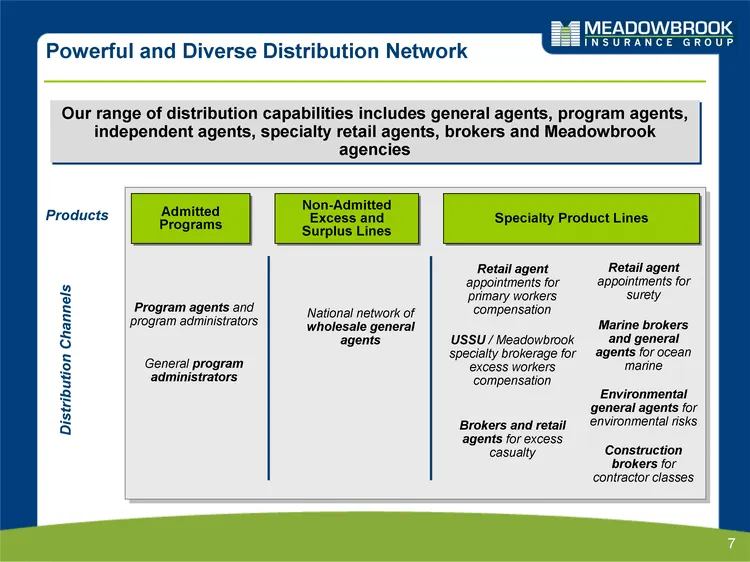
Slide 7: Powerful and Diverse Distribution Network
7 Powerful and Diverse Distribution Network National network of wholesale general agents Program agents and program administrators Non-Admitted Excess and Surplus Lines Admitted Programs Products Distribution Channels Specialty Product Lines Retail agent appointments for primary workers compensation
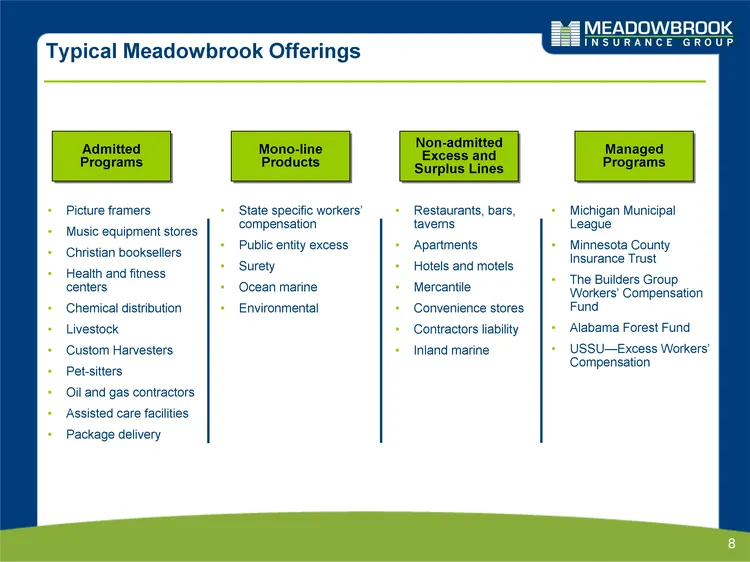
Slide 8: Typical Meadowbrook Offerings
8 Typical Meadowbrook Offerings Mono-line Products Admitted Programs Non-admitted Excess and Surplus Lines Picture framers Music equipment stores Christian booksellers Health and fitness centers Chemical distribution Livestock Custom Harvesters Pet-sitters Oil and gas contractors Assisted care facil
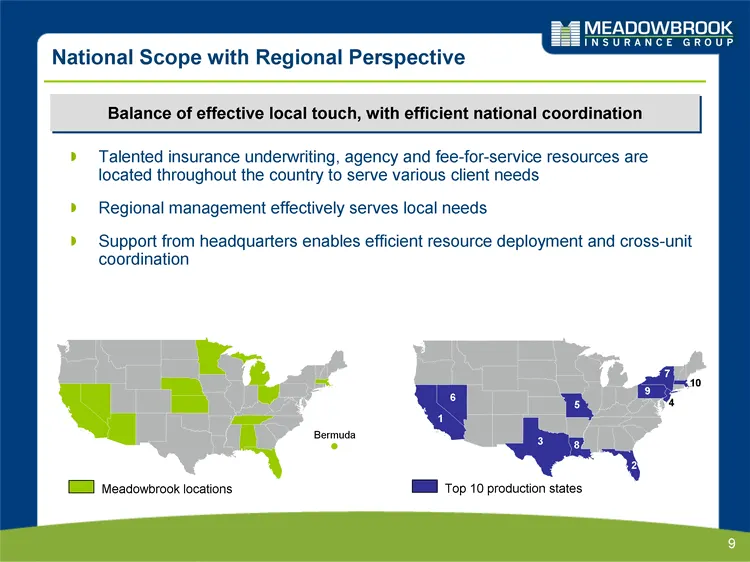
Slide 9: National Scope with Regional Perspective
9 National Scope with Regional Perspective Bermuda Talented insurance underwriting, agency and fee-for-service resources are located throughout the country to serve various client needs Regional management effectively serves local needs Support from headquarters enables efficient resource deployment
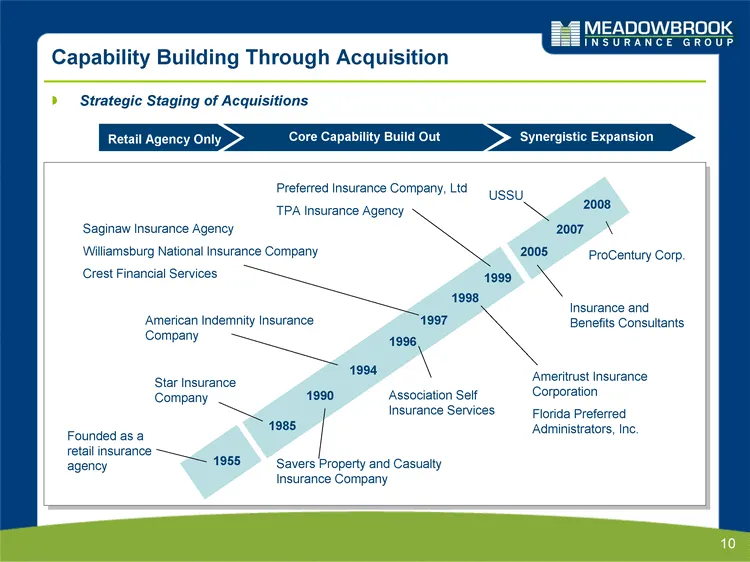
Slide 10: Capability Building Through Acquisition
10 Capability Building Through Acquisition 1955 Founded as a retail insurance agency 2007 USSU 1985 1990 1996 1997 1998 1994 1999 2005 Star Insurance Company Savers Property and Casualty Insurance Company American Indemnity Insurance Company Association Self Insurance Services Saginaw Insurance Agen
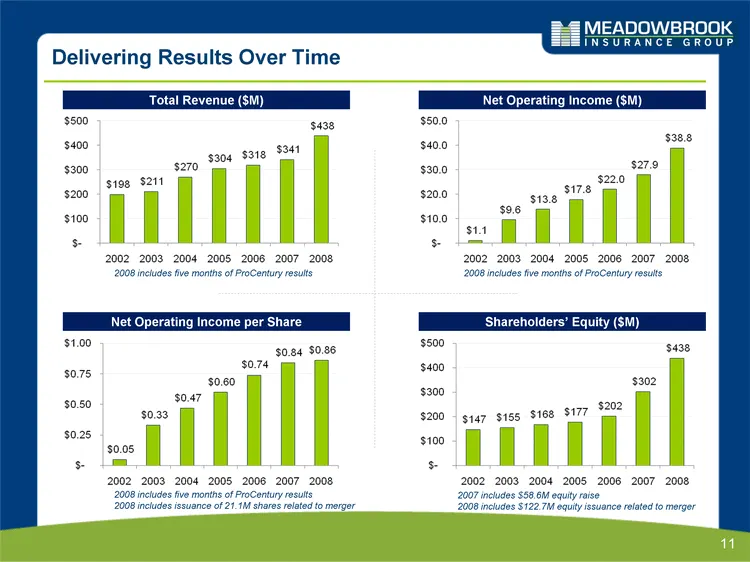
Slide 11: Delivering Results Over Time
Delivering Results Over Time $304 $318 $341 $438 $400 $500 Total Revenue ($M) $2 9 $38.8 $40.0 $50.0 Net Operating Income ($M) $198 $211 $270 $ $100 $200 $300 $1.1 $9.6 $13.8 $17.8 $22.0 27.9 $ $10.0 $20.0 $30.0 $- 2002 2003 2004 2005 2006 2007 2008 $- 2002 2003 2004 2005 2006 2007 2008 Shareholders
Slide 12: Making the Model Work: A Growth Platform on a Stable Foundation
12 Making the Model Work A Growth Platform on a Stable Foundation
Slide 13: 2008 Fourth Quarter and Year End Highlights
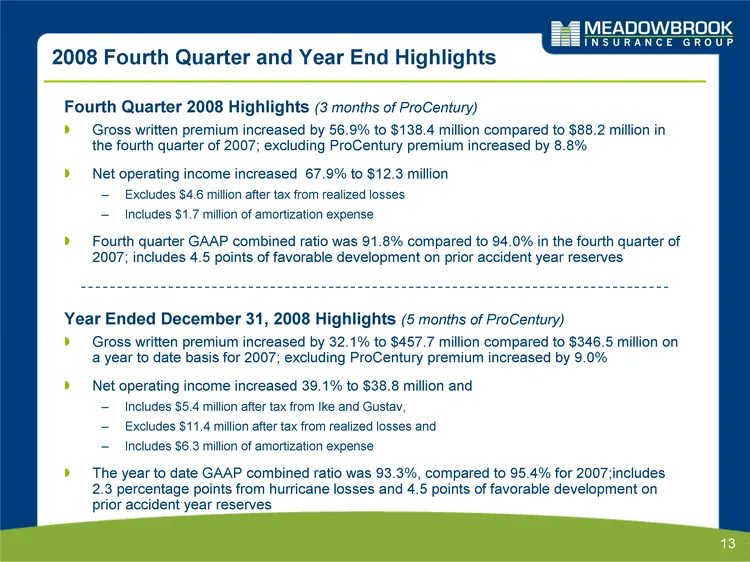
13 2008 Fourth Quarter and Year End Highlights Year Ended December 31, 2008 Highlights (5 months of ProCentury) Gross written premium increased by 32.1% to $457.7 million compared to $346.5 million on a year to date basis for 2007; excluding ProCentury premium increased by 9.0% Net operating income
Slide 14: 2009 Guidance and ROE Estimates
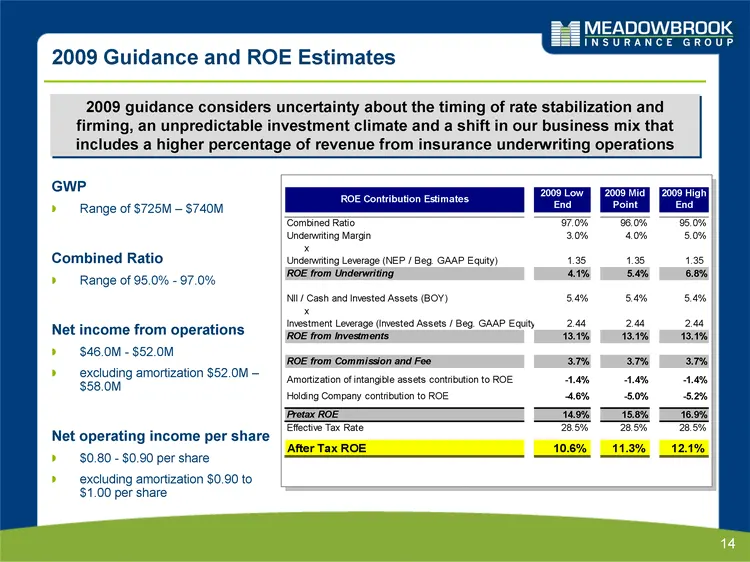
14 2009 Guidance and ROE Estimates GWP Range of $725M - $740M Combined Ratio Range of 95.0% - 97.0% Net income from operations $46.0M - $52.0M excluding amortization $52.0M - $58.0M Net operating income per share $0.80 - $0.90 per share excluding amortization $0.90 to $1.00 per share 2009 guidance c
Slide 15: Insurance Underwriting Operations Premium Distribution
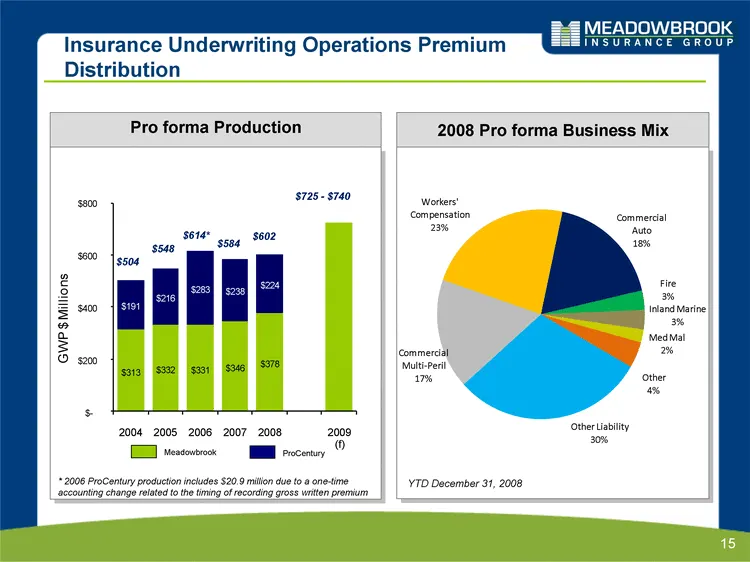
15 Insurance Underwriting Operations Premium Distribution 2008 Pro forma Business Mix Pro forma Production YTD December 31, 2008 $725 - $740 $504 $548 $614* $584 $602 ProCentury Meadowbrook * 2006 ProCentury production includes $20.9 million due to a one-time accounting change related to the timing
Slide 16: Insurance Underwriting Operations Loss and Expense Ratios
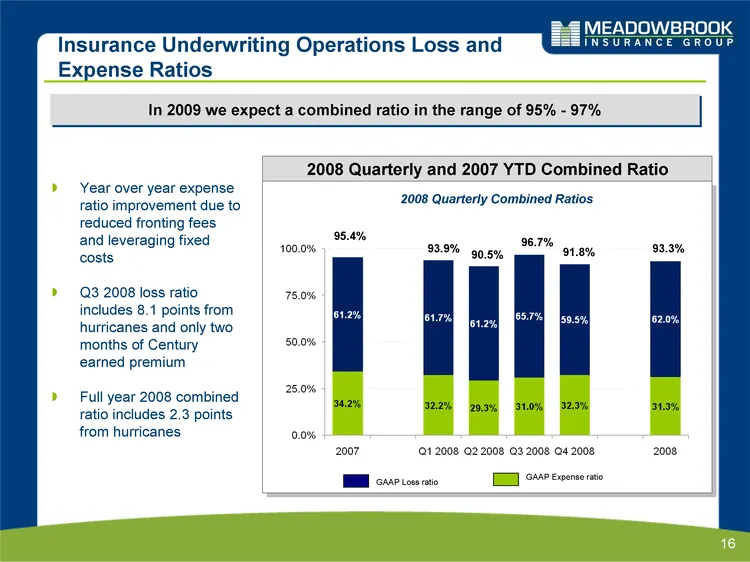
Insurance Underwriting Operations Loss and Expense Ratios p In 2009 we expect a combined ratio in the range of 95% - 97% 2008 Quarterly and 2007 YTD Combined Ratio Year over year expense ratio improvement due to reduced fronting fees leveraging 2008 Quarterly Combined Ratios 96 7% 95.4% and fixed co
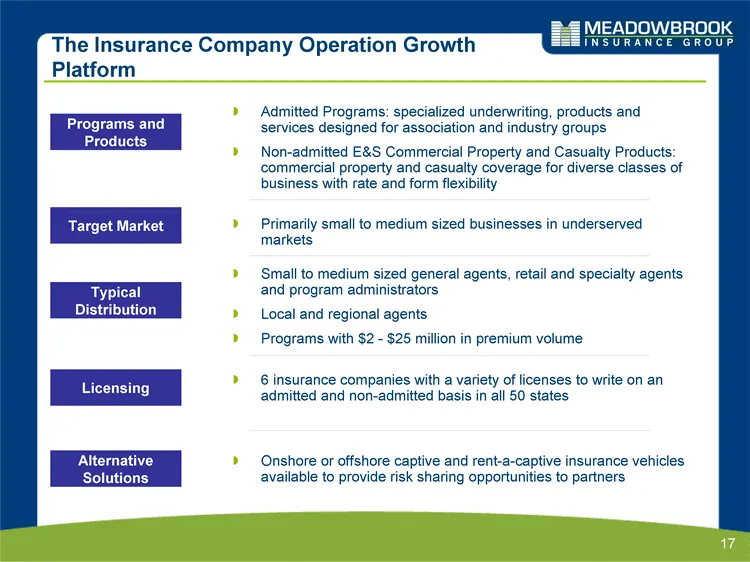
Slide 17: The Insurance Company Operation Growth Platform
17 The Insurance Company Operation Growth Platform Small to medium sized general agents, retail and specialty agents and program administrators Local and regional agents Programs with $2 - $25 million in premium volume Programs and Products Target Market Typical Distribution Licensing Alternative So
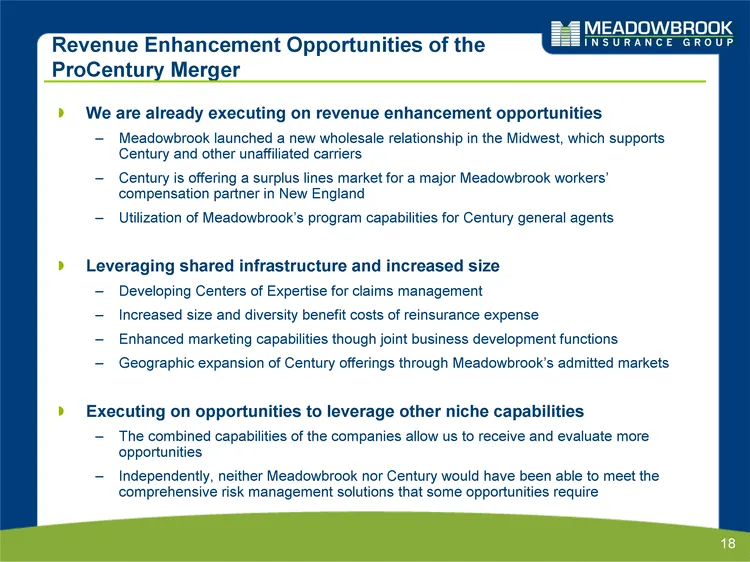
Slide 18: Revenue Enhancement Opportunities of the ProCentury Merger
18 Revenue Enhancement Opportunities of the ProCentury Merger We are already executing on revenue enhancement opportunities Meadowbrook launched a new wholesale relationship in the Midwest, which supports Century and other unaffiliated carriers Century is offering a surplus lines market for a major
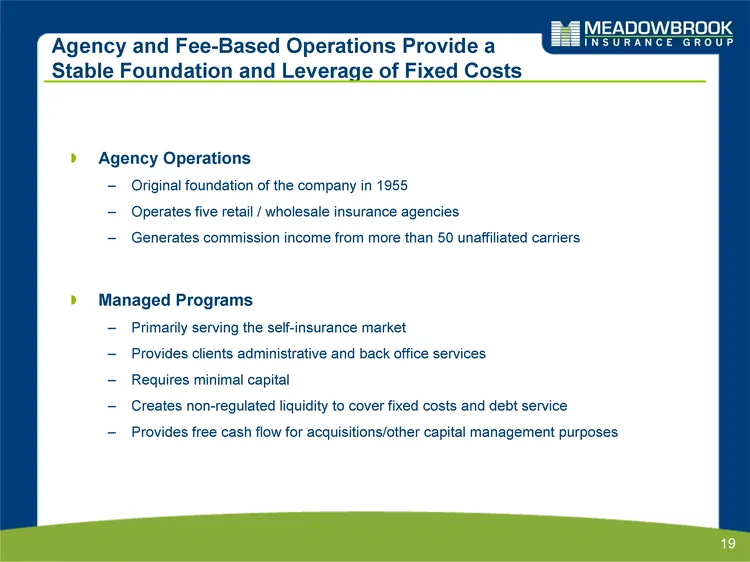
Slide 19: Agency and Fee-Based Operations Provide a Stable Foundation
19 Agency and Fee-Based Operations Provide a Stable Foundation and Leverage of Fixed Costs Agency Operations Original foundation of the company in 1955 Operates five retail / wholesale insurance agencies Generates commission income from more than 50 unaffiliated carriers Managed Programs Primarily s
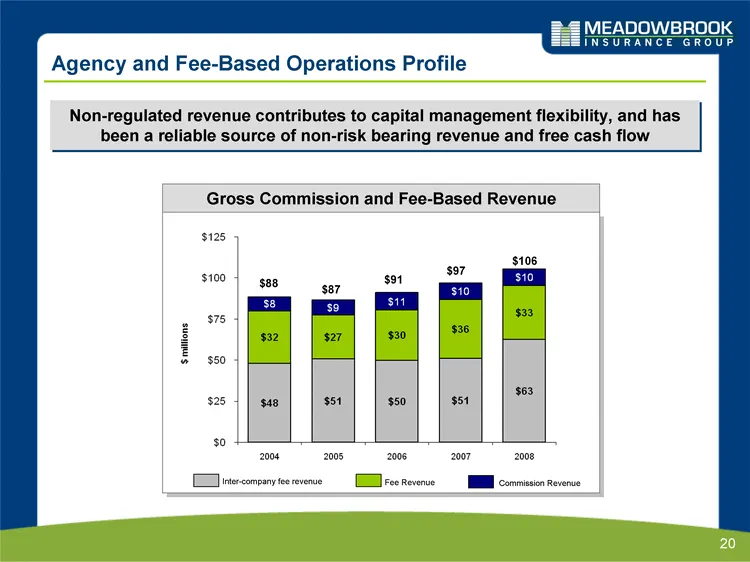
Slide 20: Agency and Fee-Based Operations Profile
20 Agency and Fee-Based Operations Profile Fee Revenue Commission Revenue Gross Commission and Fee-Based Revenue Non-regulated revenue contributes to capital management flexibility, and has been a reliable source of non-risk bearing revenue and free cash flow $125 $100 $75 $50 $25 $0 2004 2005 2006
Slide 21: We Execute our Approach with a Focus on Underwriting Discipline
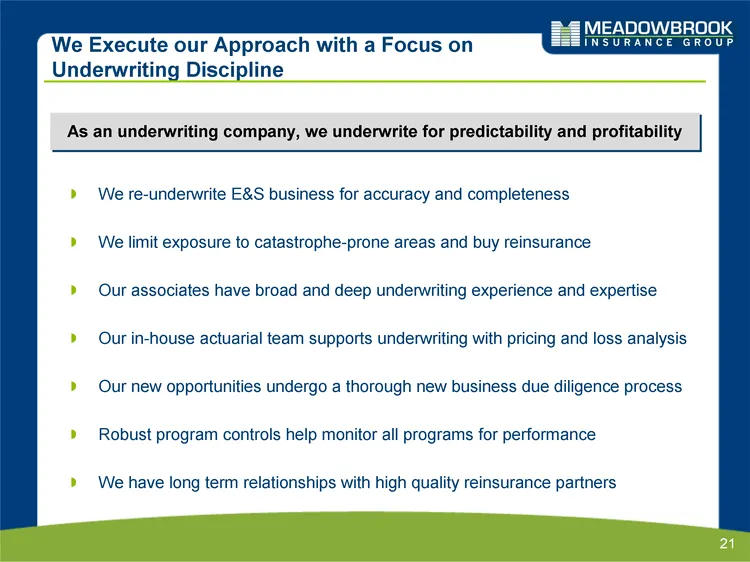
21 We Execute our Approach with a Focus on Underwriting Discipline We re-underwrite E&S business for accuracy and completeness We limit exposure to catastrophe-prone areas and buy reinsurance Our associates have broad and deep underwriting experience and expertise Our in-house actuarial team support
Slide 22: Our Success Depends on Delivering Superior Service to Our Agents
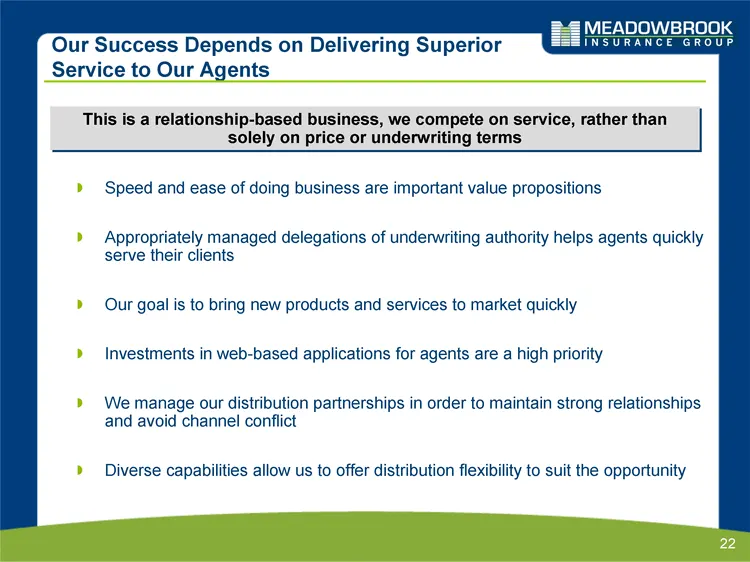
22 Our Success Depends on Delivering Superior Service to Our Agents This is a relationship-based business, we compete on service, rather than solely on price or underwriting terms Speed and ease of doing business are important value propositions Appropriately managed delegations of underwriting auth
Slide 23: We Maintain a High Quality, Low Risk Investment Portfolio
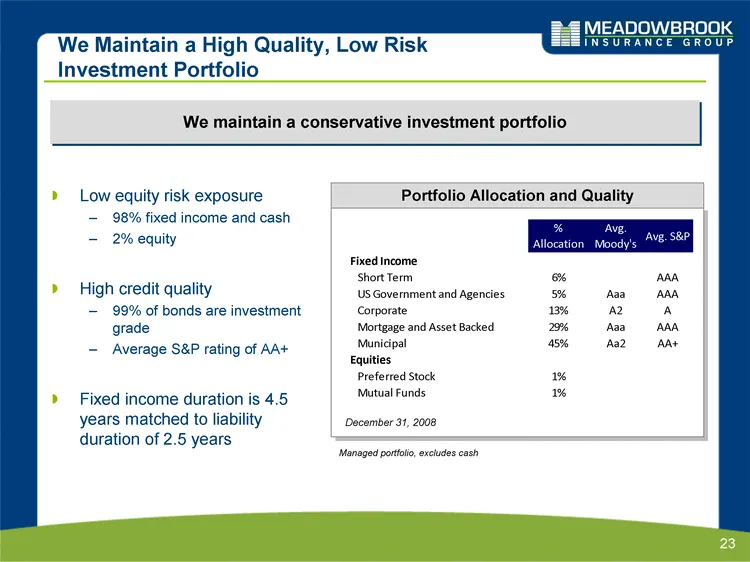
23 We Maintain a High Quality, Low Risk Investment Portfolio We maintain a conservative investment portfolio Portfolio Allocation and Quality Low equity risk exposure 98% fixed income and cash 2% equity High credit quality 99% of bonds are investment grade Average S&P rating of AA+ Fixed income dura
Slide 24: Focus on Generating Consistent Investment Income
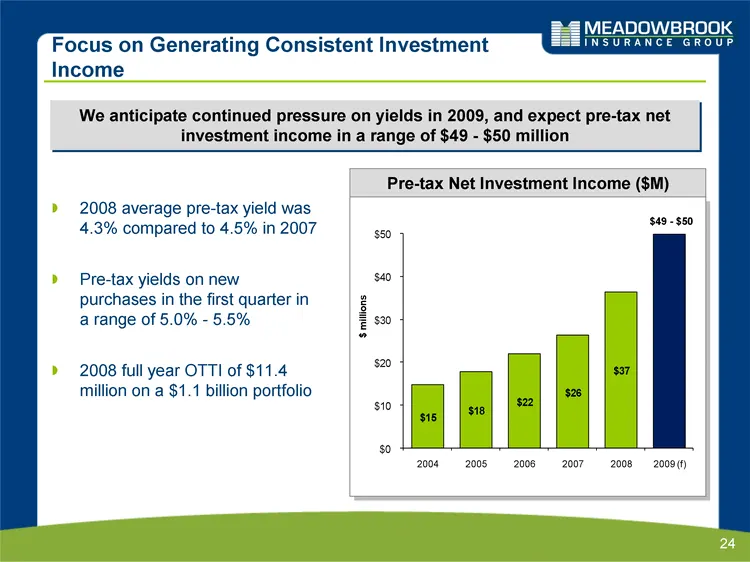
24 Focus on Generating Consistent Investment Income Pre-tax Net Investment Income ($M) We anticipate continued pressure on yields in 2009, and expect pre-tax net investment income in a range of $49 - $50 million 2008 average pre-tax yield was 4.3% compared to 4.5% in 2007 Pre-tax yields on new purch
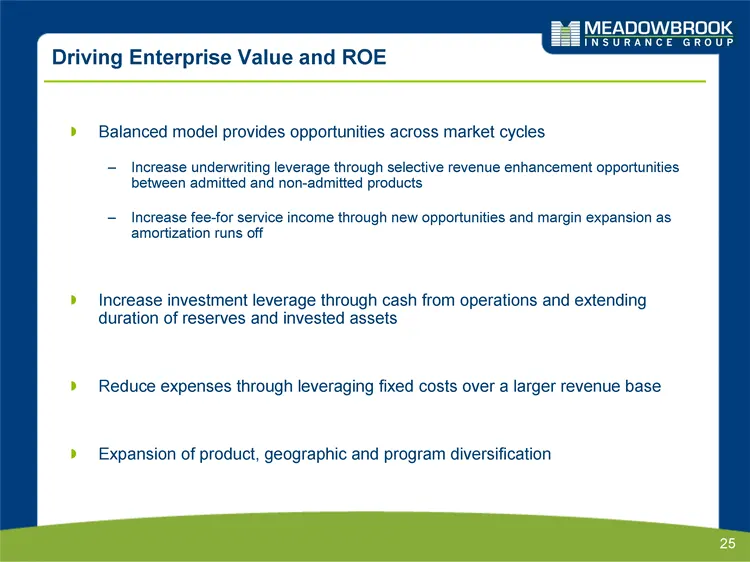
Slide 25: Driving Enterprise Value and ROE
25 Driving Enterprise Value and ROE Balanced model provides opportunities across market cycles Increase underwriting leverage through selective revenue enhancement opportunities between admitted and non-admitted products Increase fee-for service income through new opportunities and margin expansion
Slide 26: Questions
Questions
Source: SEC EDGAR · 8-K filed Mar 24, 2009
More decks from Meadowbrook Insurance Group Inc
 Q3 2014 Earnings Presentation26 slides · Nov 18, 2014
 Q3 2014 Earnings Presentation19 slides · Nov 18, 2014
 Q2 2014 Earnings Presentation21 slides · Aug 28, 2014
 Q2 2014 Earnings Presentation27 slides · Aug 28, 2014
 Investor Presentation (June 2014)31 slides · Jun 3, 2014
 Q1 2014 Earnings Presentation21 slides · Jun 3, 2014