Kendle International — Jefferies 3rd Annual Healthcare Conference (June 2009)
23 slides from Kendle International's conference presentation, Jun 18, 2009

Slide 1: Jefferies 3rd Annual Healthcare Conference
June 18, 2009 Jefferies 3rd Annual Healthcare Conference Mandarin Oriental Hotel, New York City Presented by Simon Higginbotham, President Exhibit 99.1

Slide 2: Safe harbor
Safe harbor Information herein contains forward-looking statements pursuant to the safe harbor provision of the Private Securities Litigation Reform Act of 1995. All such forward-looking statements are based largely on management’s expectations and are subject to risks and uncertainties that could c

Slide 3: Today's agenda
Today’s agenda • Corporate position to win • Pharmaceutical development environment today • Historical performance and 2009 action plan • Summary

Slide 4: Kendle: Real people. Real results
Kendle Real people. Real results

Slide 5: Kendle overview
Kendle overview • Among world’s leading global clinical research organizations • Focused on Phase I-IV (fastest growing area of market opportunity) • Experience spanning more than 100 countries • Partners include 41 of top 50 largest biopharmaceutical companies • Consistently recognized for quality

Slide 6: Consistently recognized for excellence
Consistently recognized for excellence Independent validation through quantitative research • 2009 – Ranked second overall among the “Top CROs to Work With” in the CenterWatch Survey of U.S. Investigative Sites; ranked highest of the top five global CROs • 2009/2008/2007 – Only CRO to be ranked cons

Slide 7: Strengthening our position as a global partner
Strengthening our position as a global partner • Geographic expansion to deliver patient access – 2009: Ahmedabad, India; Kuala Lumpur, Malaysia; Bangkok, Thailand; and Manila, Philippines • Strengthened Early Stage leadership to drive growth – Thirty-year veteran in Early Stage clinical development

Slide 8: Pharmaceutical development environment today
Pharmaceutical development environment today
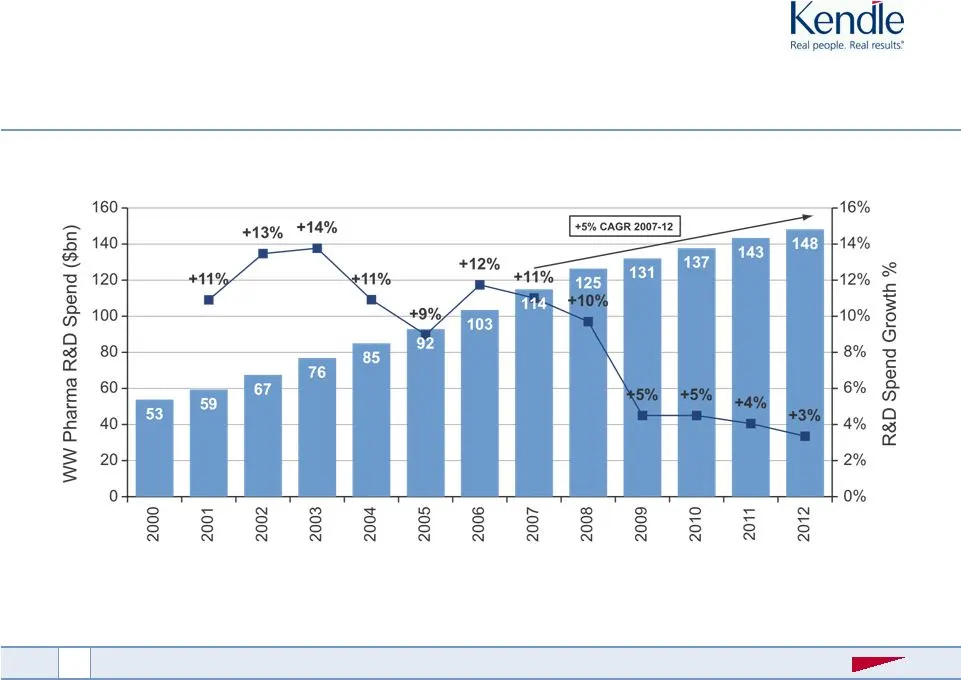
Slide 9: The innovation deficit
The innovation deficit Source: EvaluatePharma, June 2008

Slide 10: The outlook for pharma
The outlook for pharma Source: “Pharma 2020: Virtual R&D,” June and “Pharma 2020: Challenging Business Models,” April • Traditional strategy – “innovation deficit” • Strategic implications on core competency and business model – Seismic shift – Strategic, organizational and behavioral change – Combi

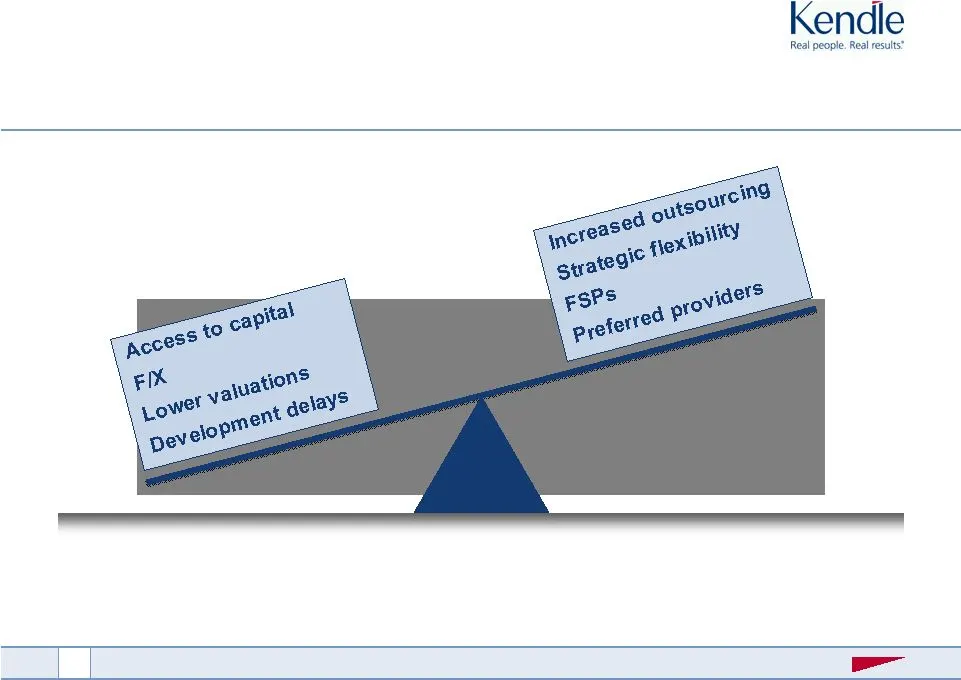
Slide 11: Implications for strategic partnerships
Productivity cost control Delivery Quality Efficiency Implications for strategic partnerships • Better utilization of resources • Conversion of fixed to variable costs • Expansion into new service areas and markets • CRO standards, local understanding and access to new markets Pharma CRO +
Slide 12: Kendle: Real people. Real results
Kendle Real people. Real results

Slide 13: Short-term visibility, long-term opportunity
Short-term visibility, long-term opportunity Short-term Visibility Long-term Opportunity

Slide 14: Historical performance and 2009 action plan
Historical performance and 2009 action plan
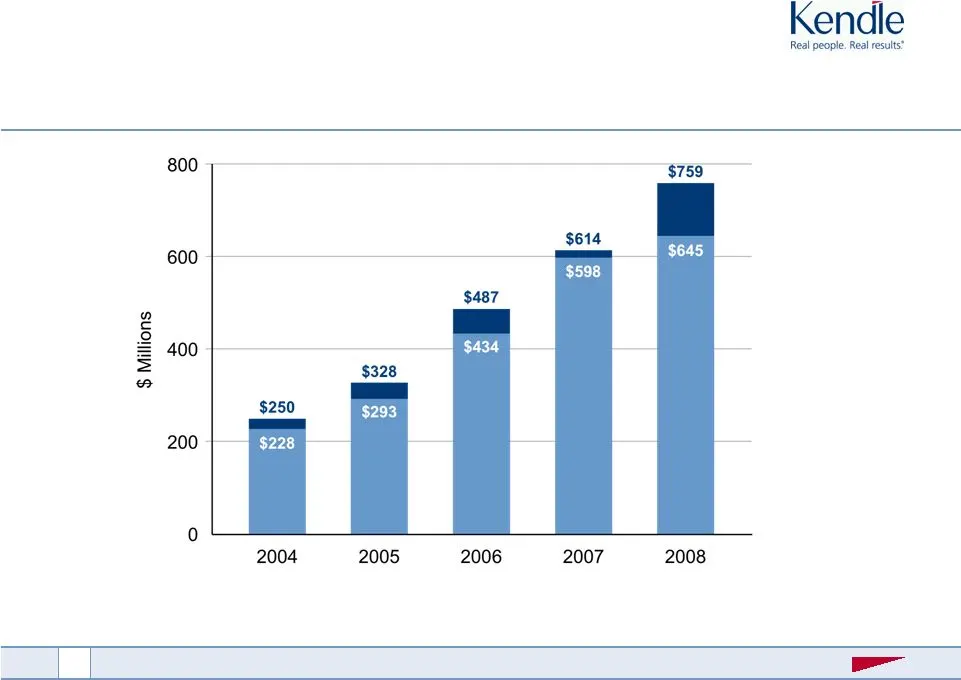
Slide 15: Five-year review: Sales performance
Five-year review: Sales performance
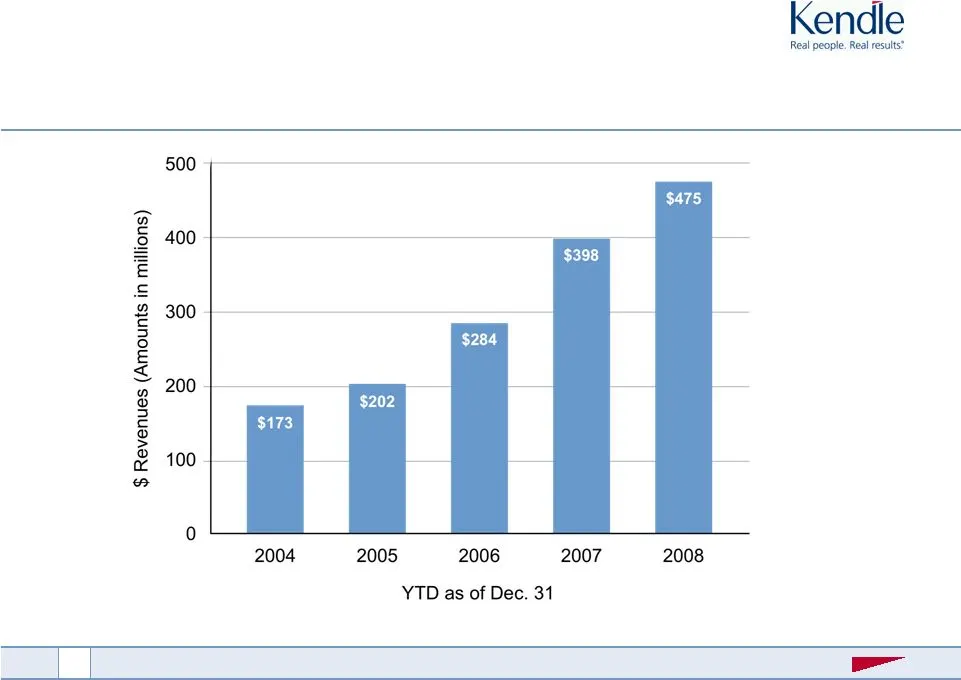
Slide 16: Five-year review: Net service revenues
Five-year review: Net service revenues
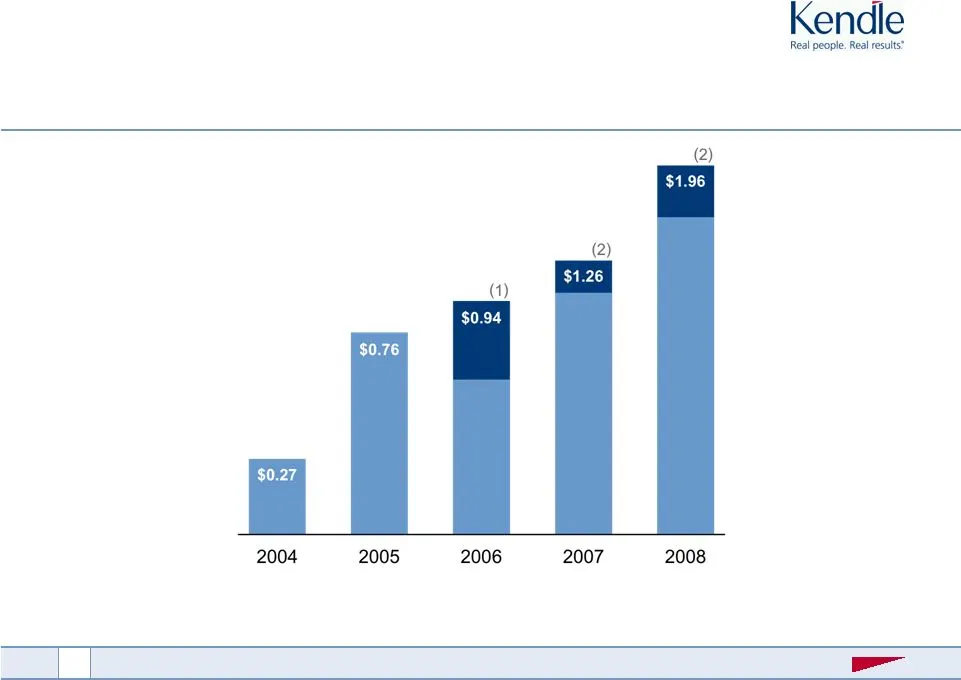
Slide 17: Five-year review: Earnings per share
Five-year review: Earnings per share (1) Proforma EPS before impairment charge on an intangible asset. (2) Proforma EPS before adjustment for APB 14-1.
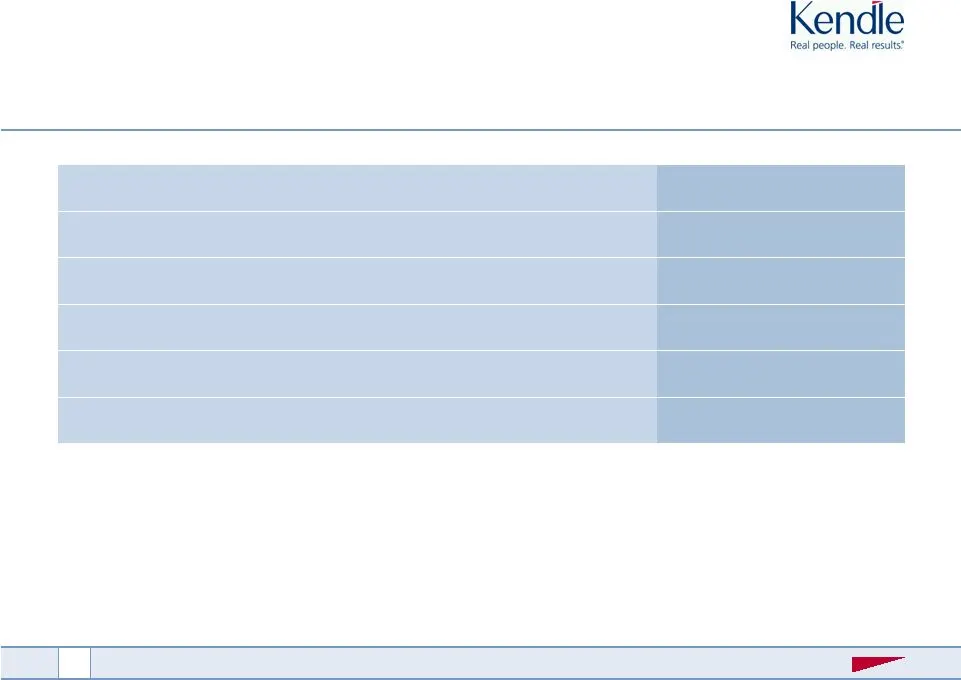
Slide 18: Balance sheet and cash flow review
Balance sheet and cash flow review As of 3/31/09 Cash and marketable securities $56.0 million Cash flow from operations $8.3 million Capital expenditures $5.4 million Convertible notes maturing in 2012, net of discount $173.6 million Accounts receivable, net of advance billings $61.2 million Days sa
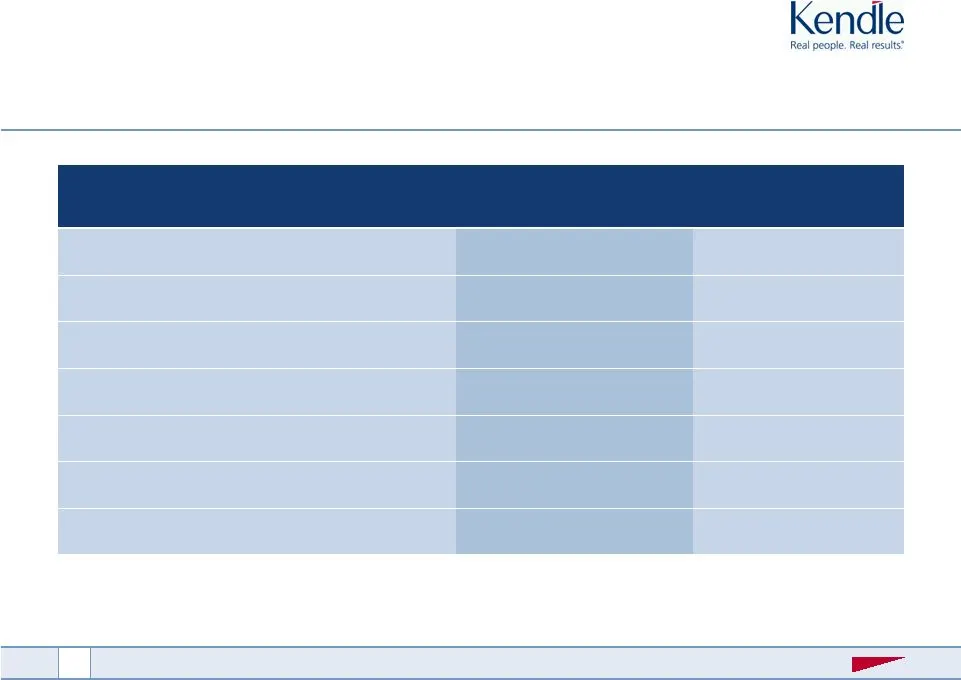
Slide 19: Financial results: Q1 2009 vs. Q1 2008
Q1 2009 Q1 2008 Financial results: Q1 2009 vs. Q12008 Net service revenues $108,103 $114,124 Operating income $8,138 $13,975 Operating margin 7.5% 12.2% Pretax income $7,655 $7,182 Net income $886 $4,104 Diluted EPS (GAAP) $0.06 $0.27 Diluted EPS (Proforma) $0.47 $0.38 $ in thousands, except per sha

Slide 20: Moving forward: Kendle action plan
Moving forward: Kendle action plan • Streamlining sales & marketing – Will yield improved sales, better proposal delivery and cost savings • Backlog review – Backlog “scrub” completed, more conservative profile for project cancellations, delays and contract signings • Adopting a functional organizat

Slide 21: Actions already taken
Actions already taken • Support Unit budgets re-aligned with revenue forecast – By eliminating planned headcount and service additions – Additionally, consolidation, outsourcing and contract renegotiations have reduced SG&A expenses – Expected to net $3.5-5.5M savings compared to 2008 SG&A actuals •

Slide 22: Summary: Kendle committed to active change
Summary: Kendle committed to active change • Near-term cost reductions – Achieved through improvements in sales effort, operations and financial discipline – Q1 results seen as unique, near-term and manageable • Streamlining leadership, process and systems – For operations and finance – planned cost
Slide 23: Kendle: Real people. Real results
Kendle Real people. Real results”
Source: SEC EDGAR · 8-K filed Jun 18, 2009
More decks from Kendle International Inc
 Conference Presentation (March 2009)23 slides · Mar 10, 2009
 27th Annual J.P. Morgan Healthcare Conference (January 2009)19 slides · Jan 12, 2009
 UBS Global Life Sciences Conference 200835 slides · Sep 24, 2008
 First Analysis Analyst Luncheon, San Francisco (June 2008)31 slides · Jun 3, 2008
 Raymond James Institutional Investors Conference 200826 slides · Mar 5, 2008
 Wachovia 2008 Healthcare Conference29 slides · Jan 30, 2008