Expressjet — Raymond James & Associates Institutional Investors Conference 2003
9 slides from Expressjet's conference presentation, Mar 3, 2003
Slide 1: Raymond James Institutional Investors Conference
EXHIBIT 99.2 Raymond James & Associates Institutional Investors Conference March 4, 2003 = Expressjet. ExpressJet Holdings, Inc.
Slide 2: Forward-looking statements and ExpressJet Airlines overview
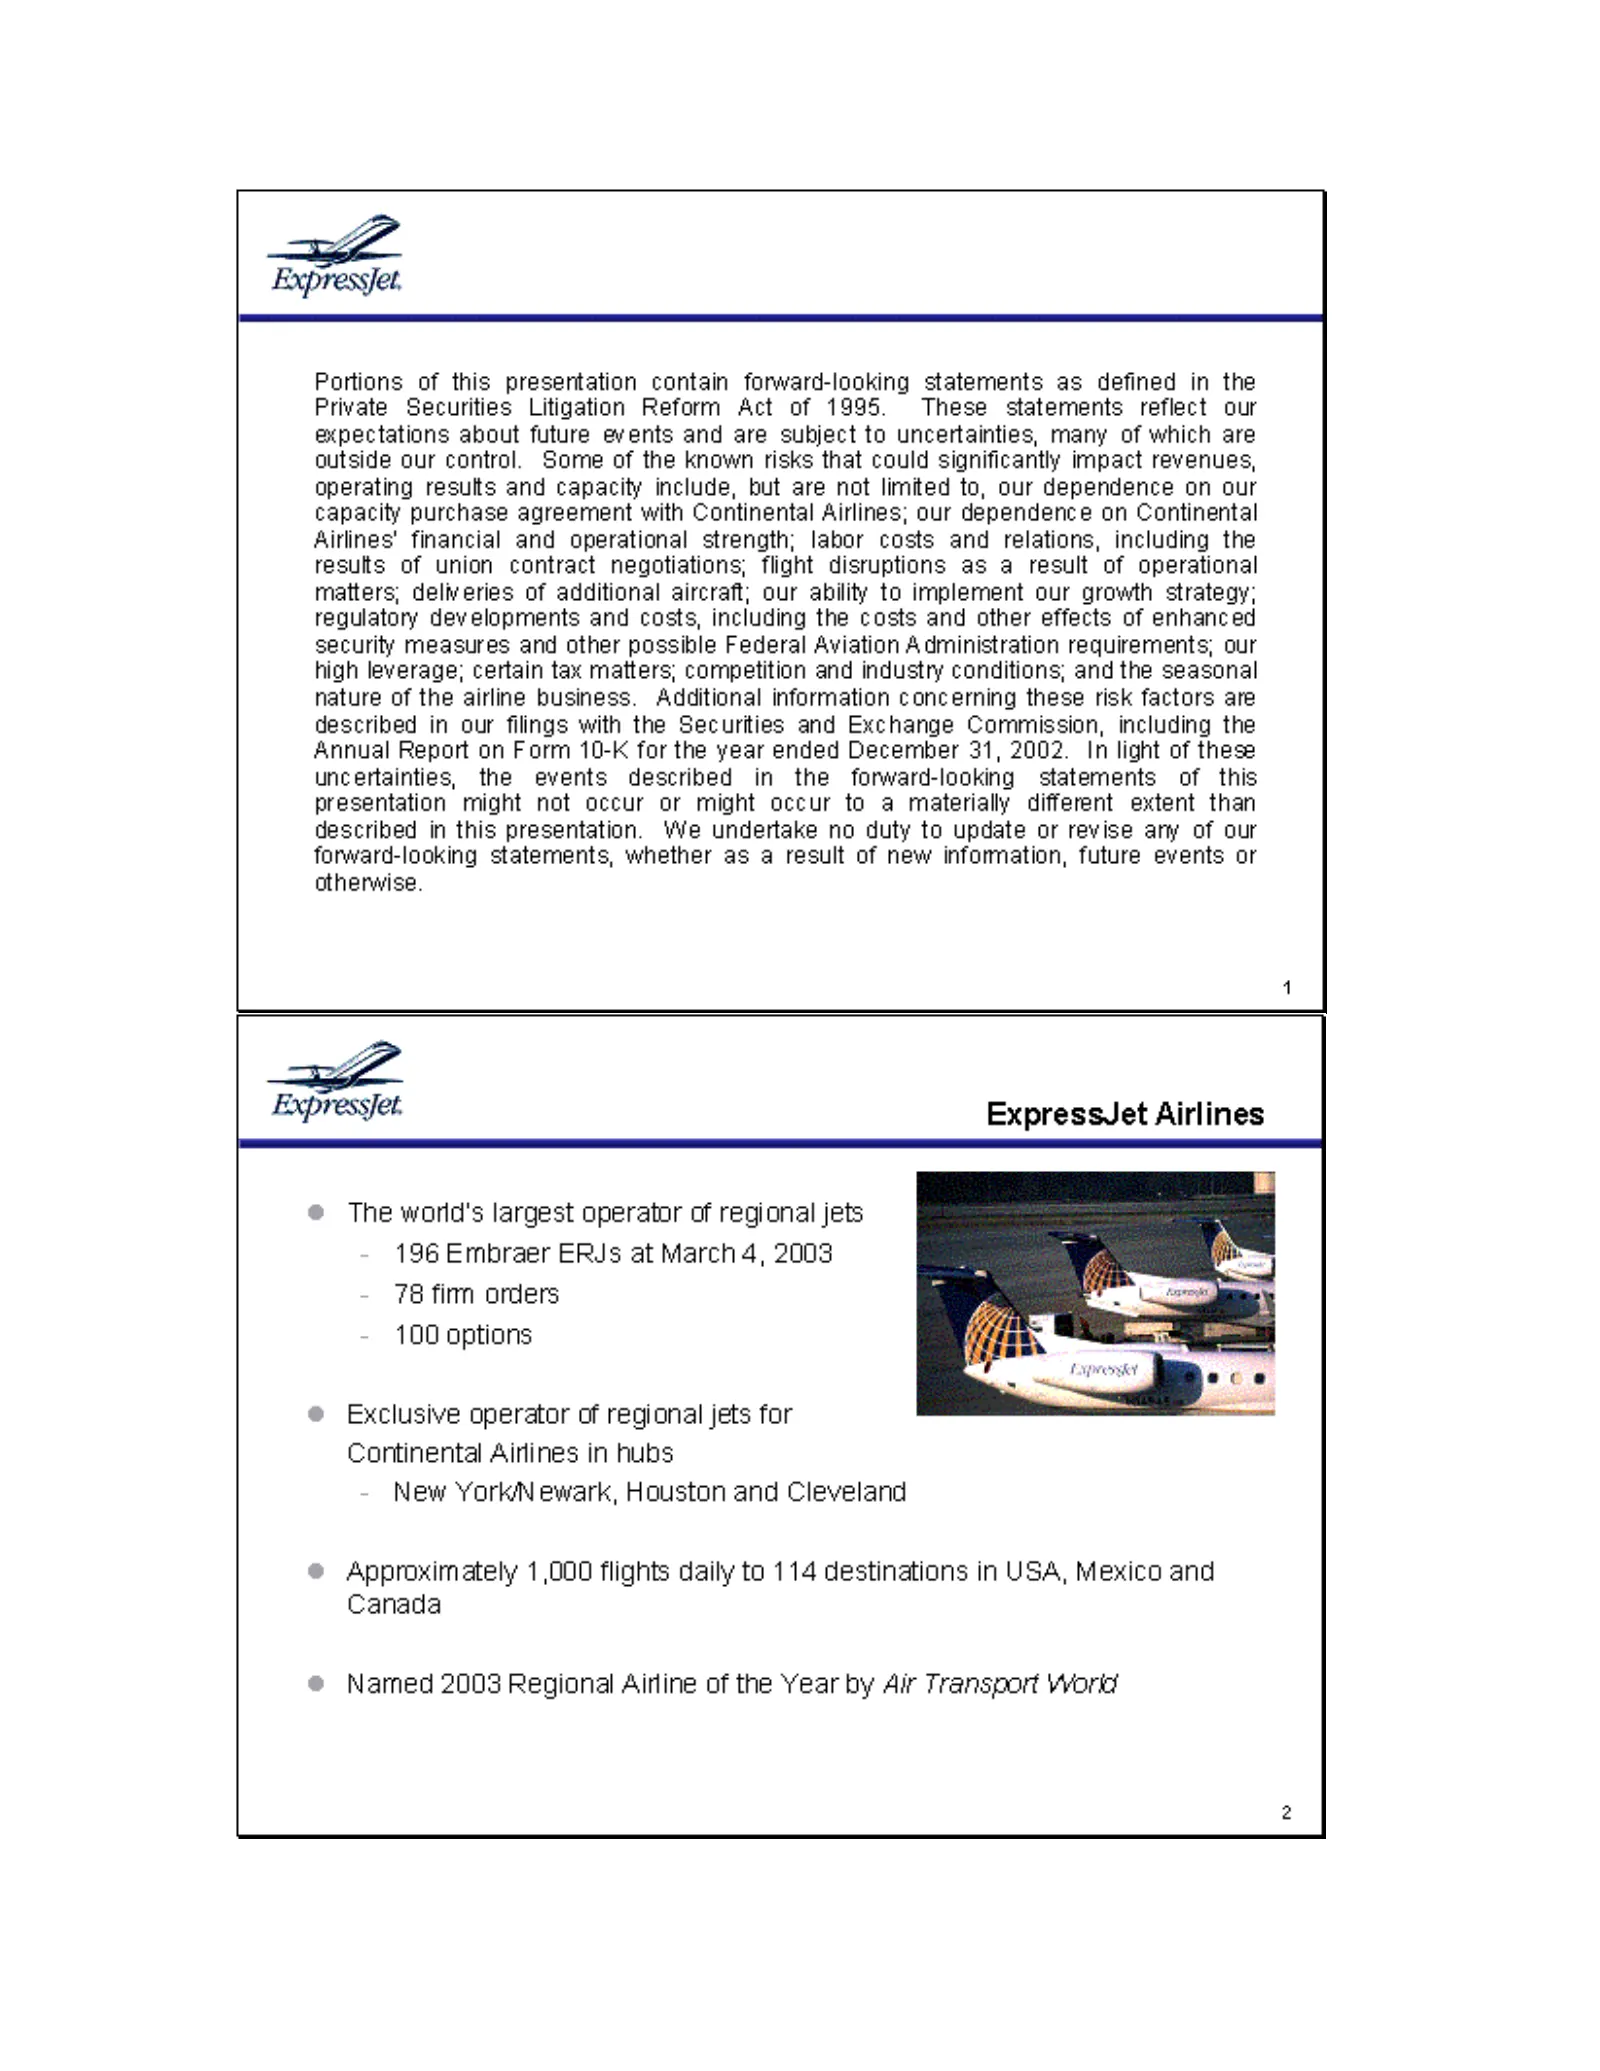
Expressfet. Portions of this presentation contain forward-looking staternents as defined in the Private Securities Litigation Reform Act of 1995. These statements reflect our expectations about future events and are subject to uncertainties, many of which are outside our control. Some of the known r
Slide 3: 2002 Financial and Operational Accomplishments
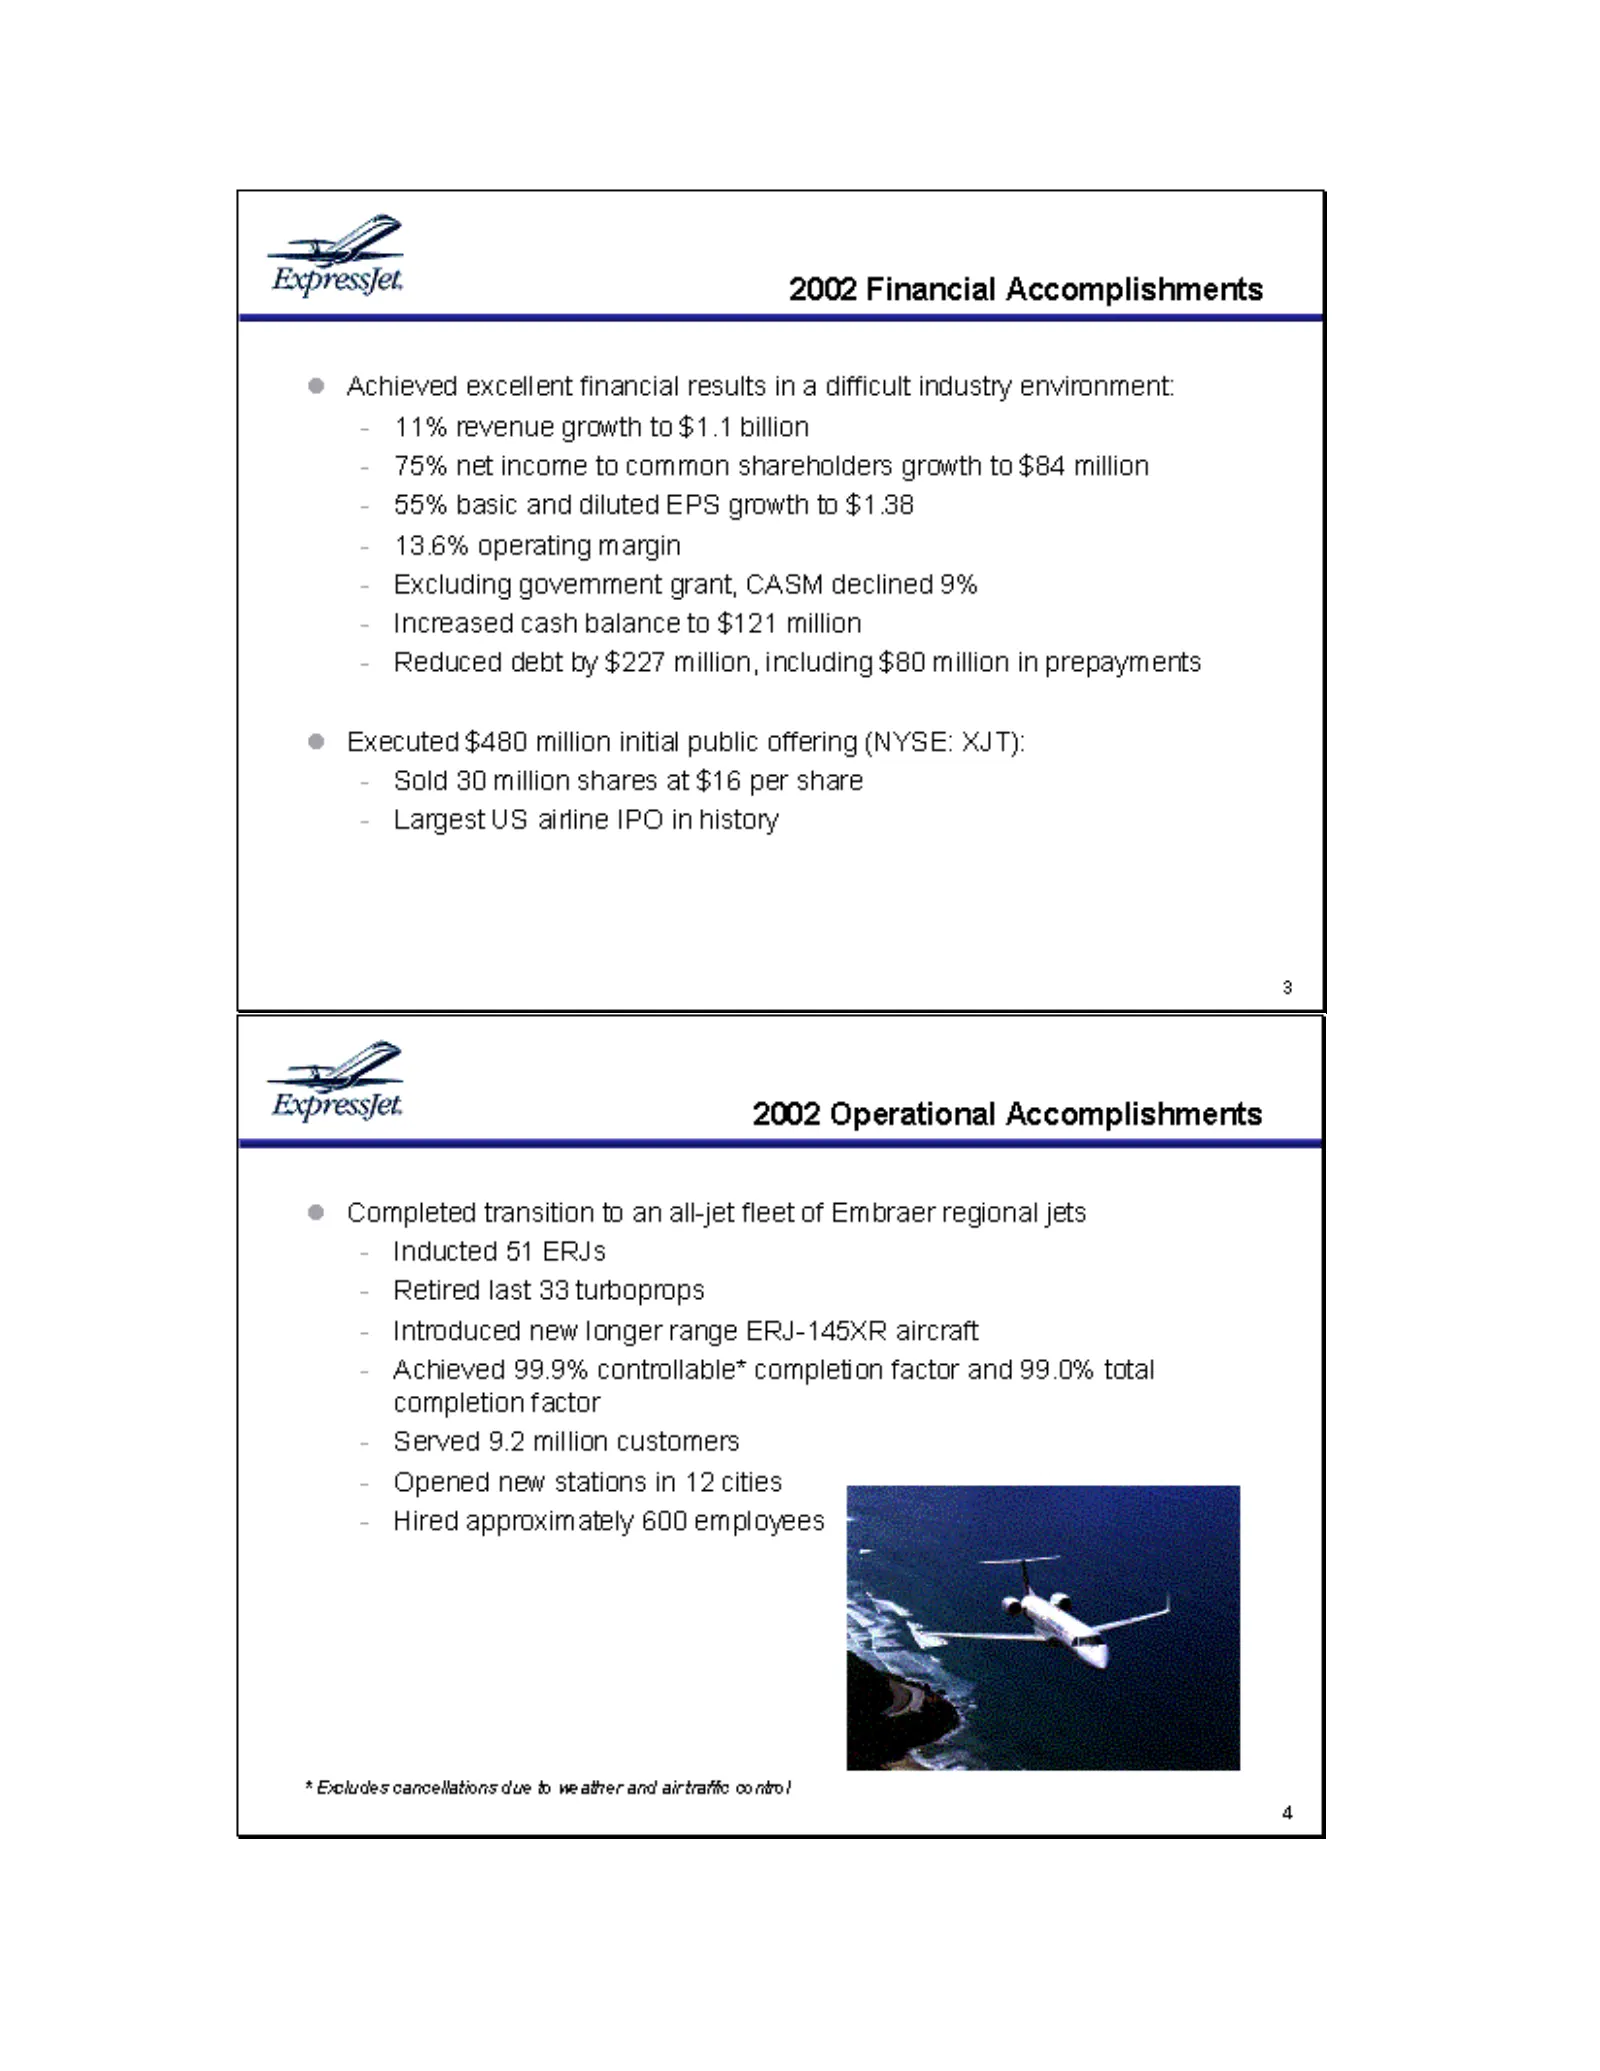
ExpressJet, 2002 Financial Accomplishments Achieved excellent financial results in a difficult industry environment: 11% revenue growth to $1.1 billion 75% net income to common shareholders growth to $84 million 55% basic and diluted EPS growth to $1.38 13.6% operating margin Excluding govemment gra
Slide 4: Current ExpressJet Cities and 2002 Operating Results
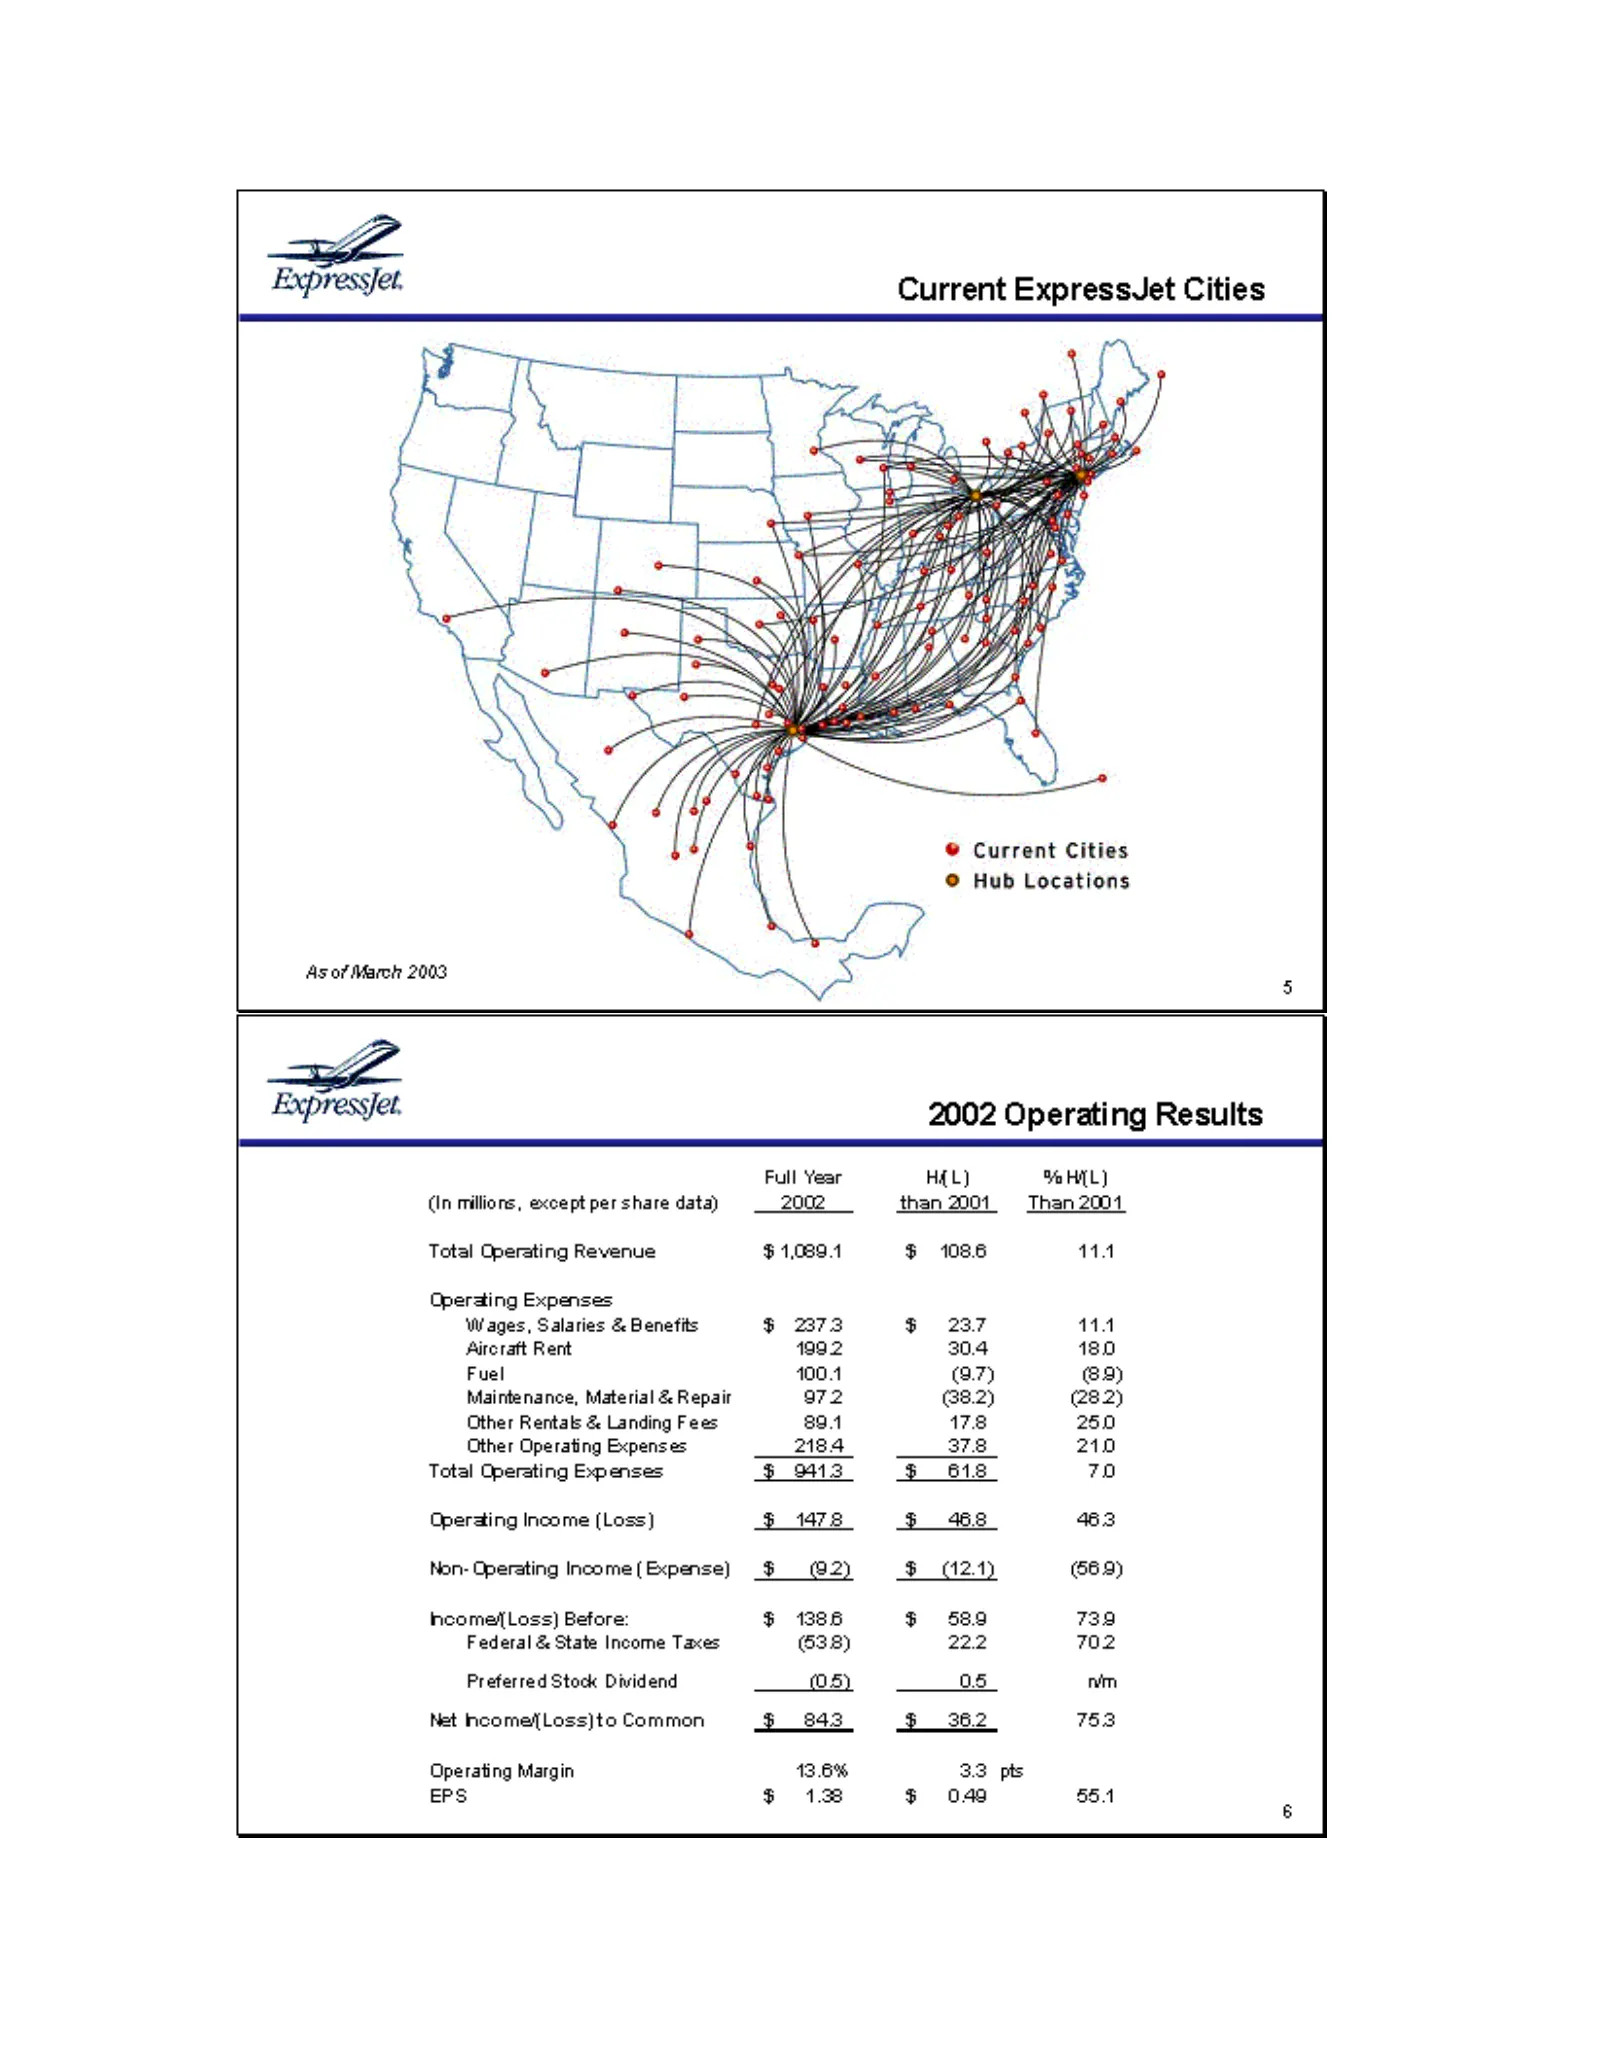
Expressjet, Current ExpressJet Cities Sih > ©® Current Cities © Hub Locations As of March 2003 Expressfet. 2002 Operating Results Full Year HAL) % HL) (In millions, except per share data) 2002 than 2001 Than 2001 Total Operating Revenue $ 1,089.1 $ 108.6 114 Qperating Expenses: Wages, Salaries & Ben
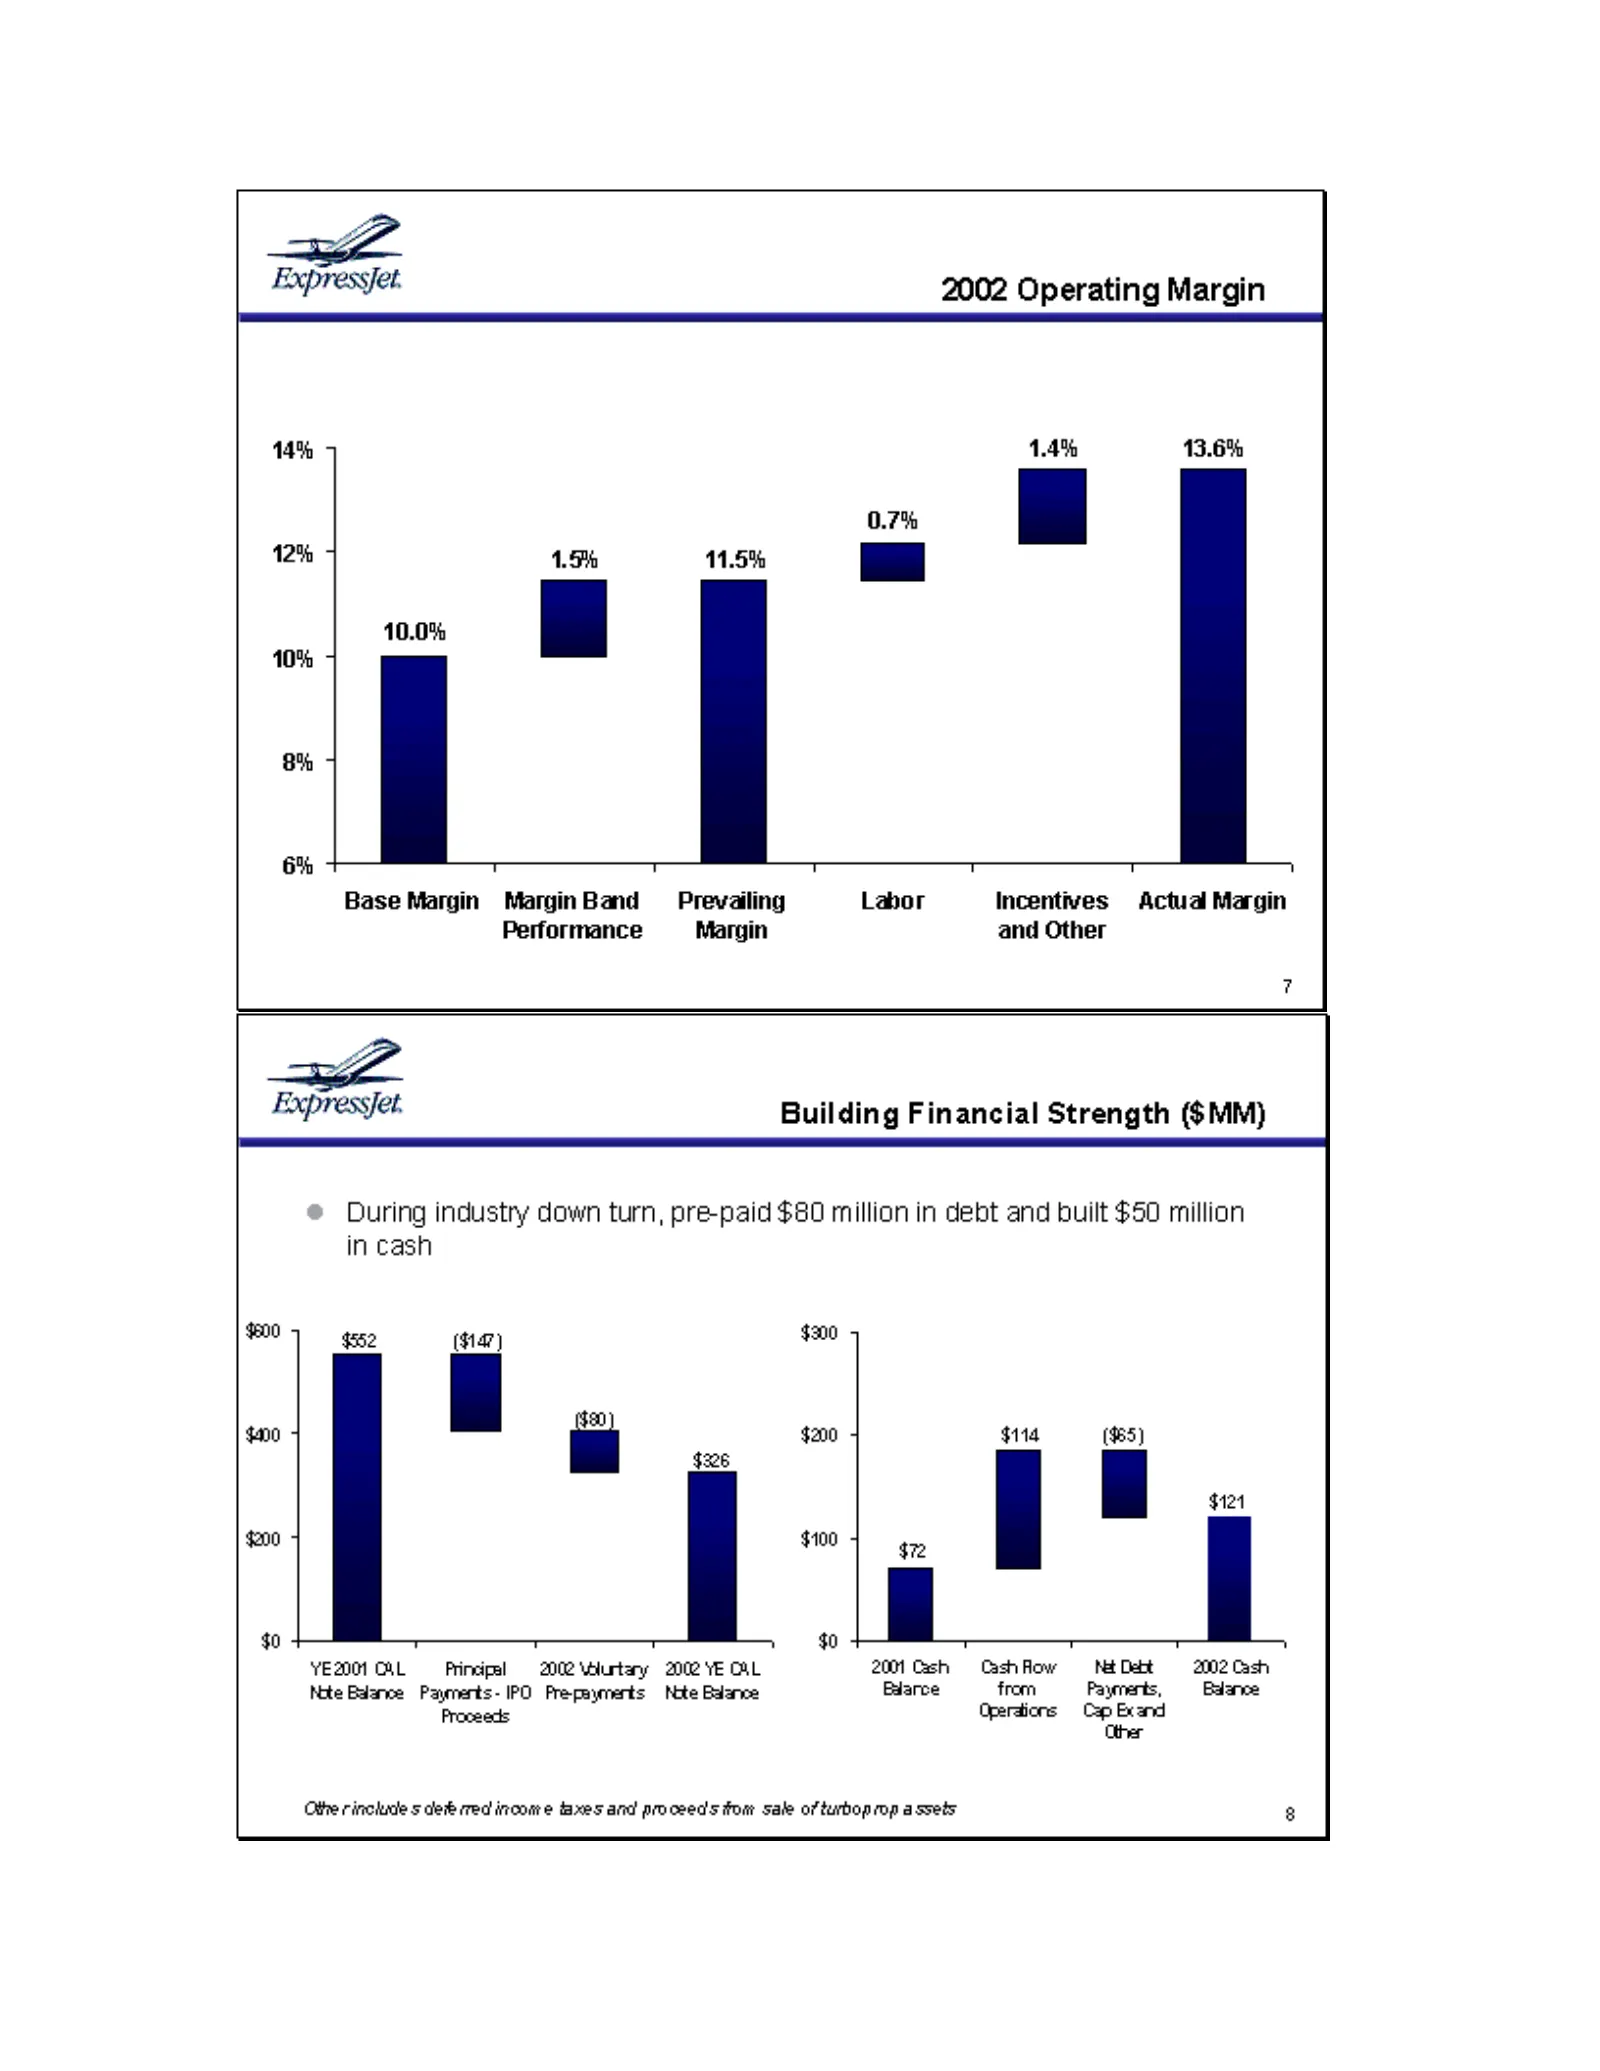
Slide 5: 2002 Operating Margin and Building Financial Strength
Expressjet. 2002 Operating Margin 14% 5 1.4% 13.6% - # 1. 10.0% baa 11.5% (al 10% 4 8% 4 5 6% : 12% 5 Base Margin MarginBand = Prevailing Labor Incentives Actua Margin Performance Margin and Other 7 Expressfet. Building Financial Strength ($MM) During industry down turn, pre-paid $80 million in debt
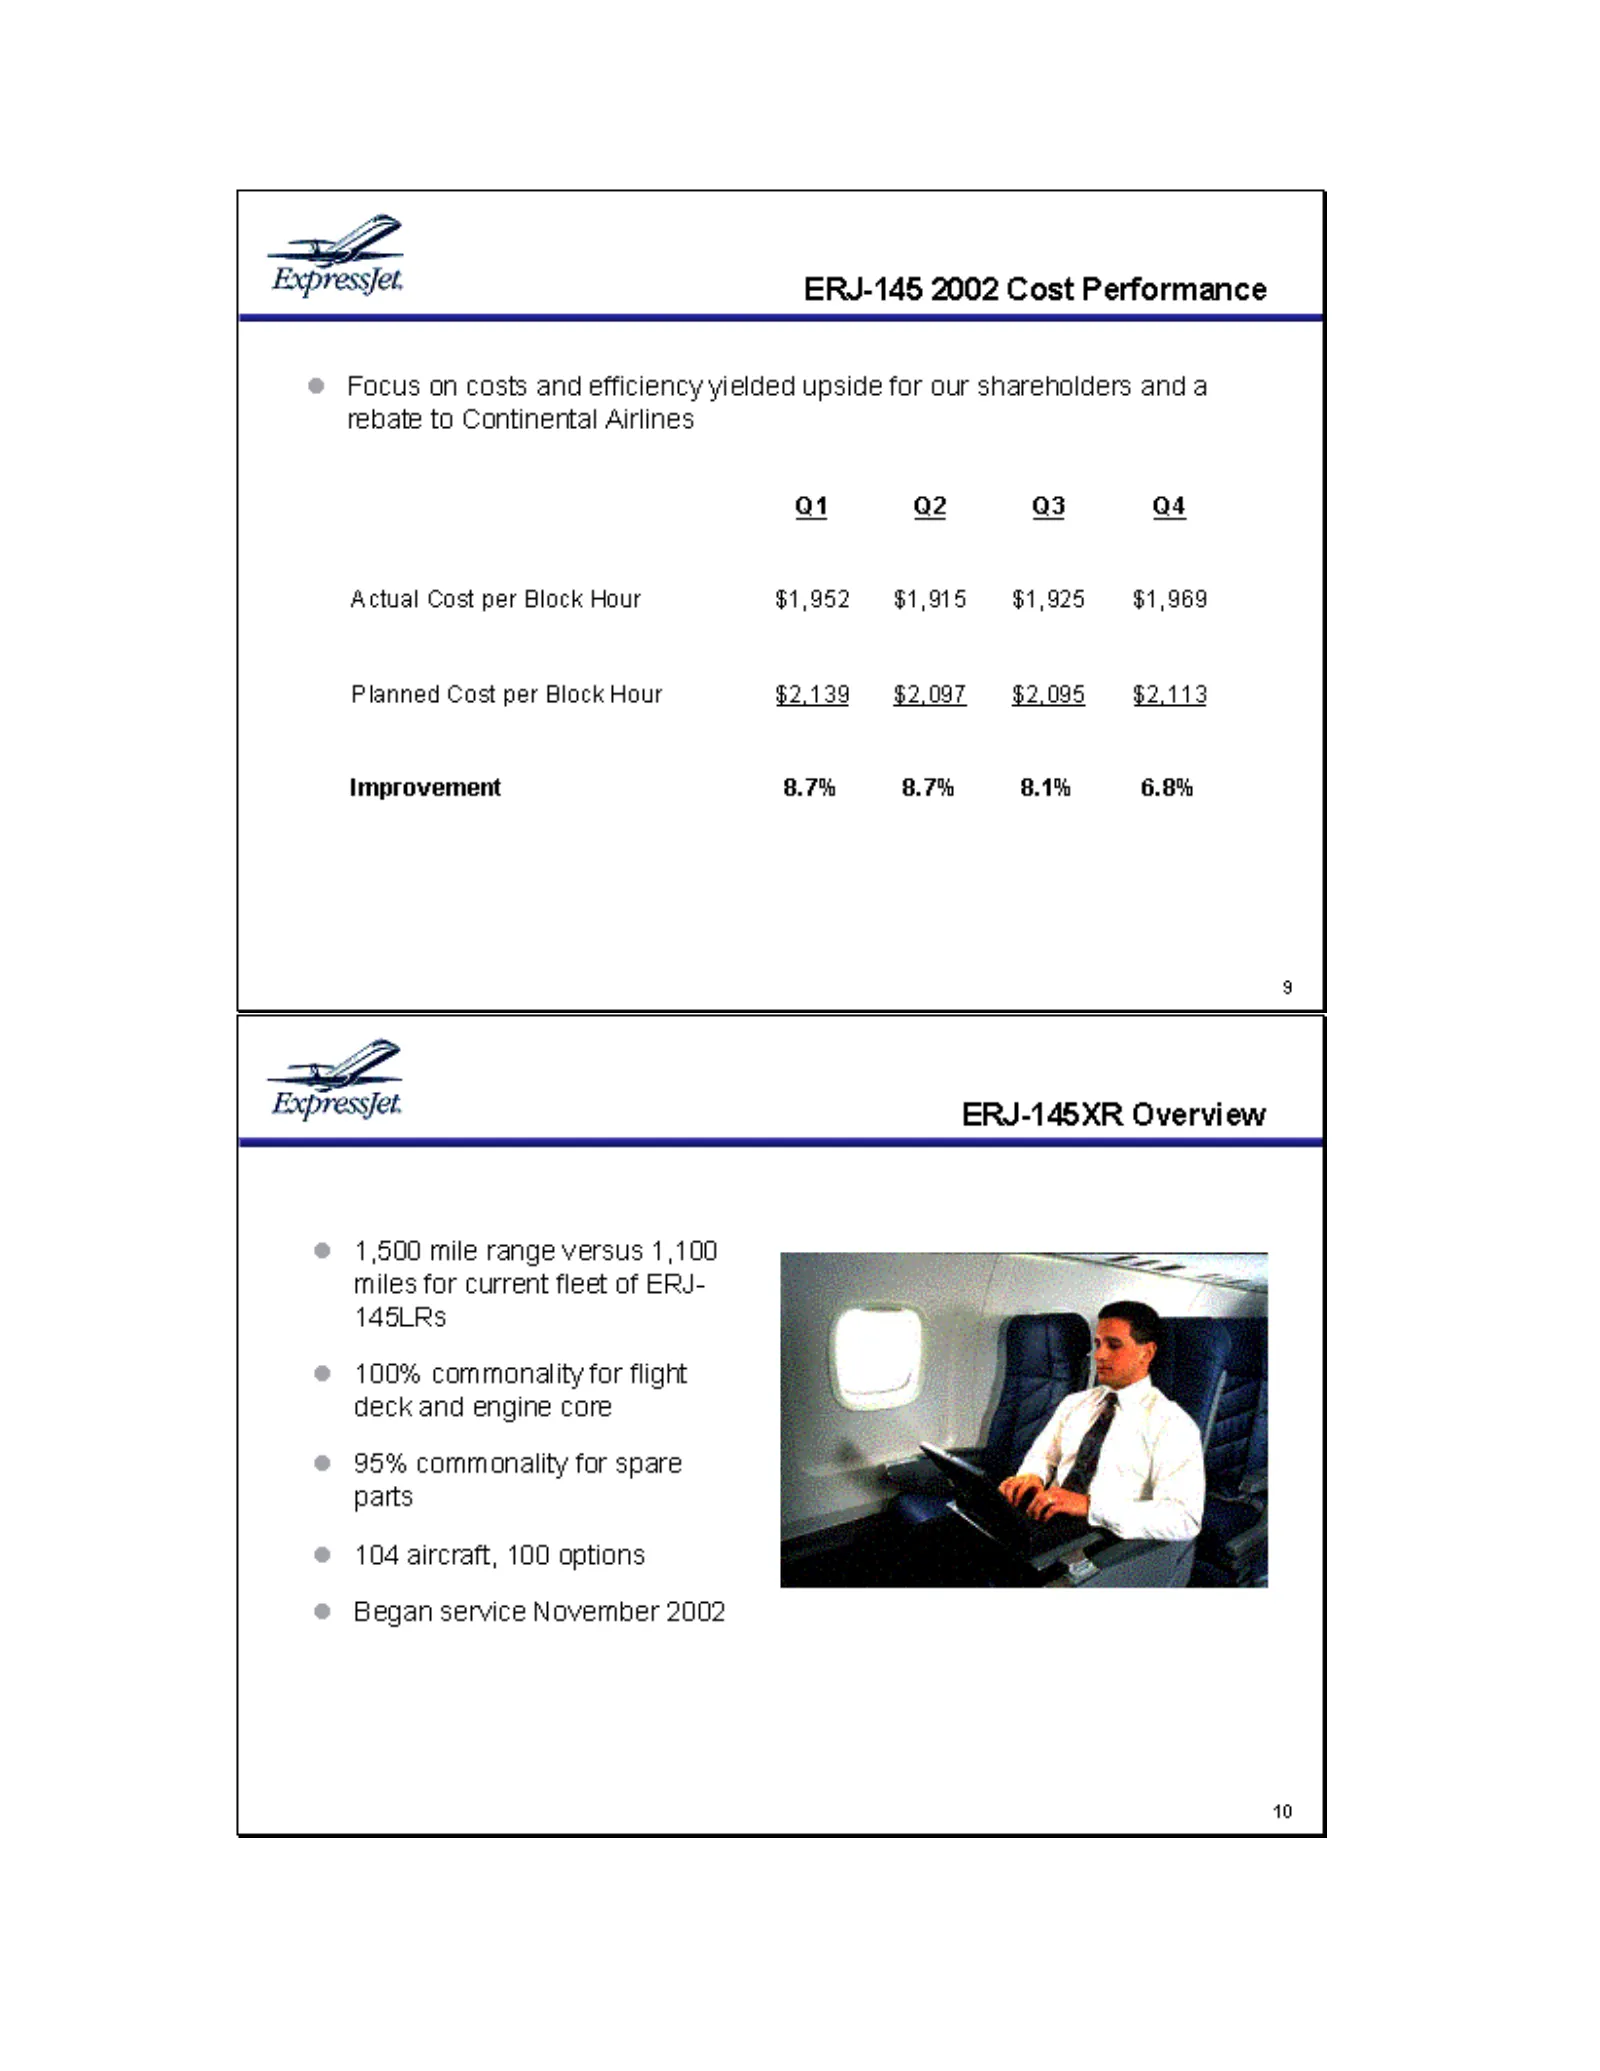
Slide 6: ERJ-145 2002 Cost Performance and ERJ-145XR Overview
Expressfet. ERJ-145 2002 Cost Performance Focus on costs and efficiency yielded upside for our shareholders and a rebate to Continental Airlines a1 a2 Q3 as Actual Cost per Block Hour $1,952 $1,915 $1,925 $1,969 Planned Cost per Block Hour $2,139 $2,097 $2,095 $2,113 Improvement 8.7% 8.7% 8.1% 6.8%
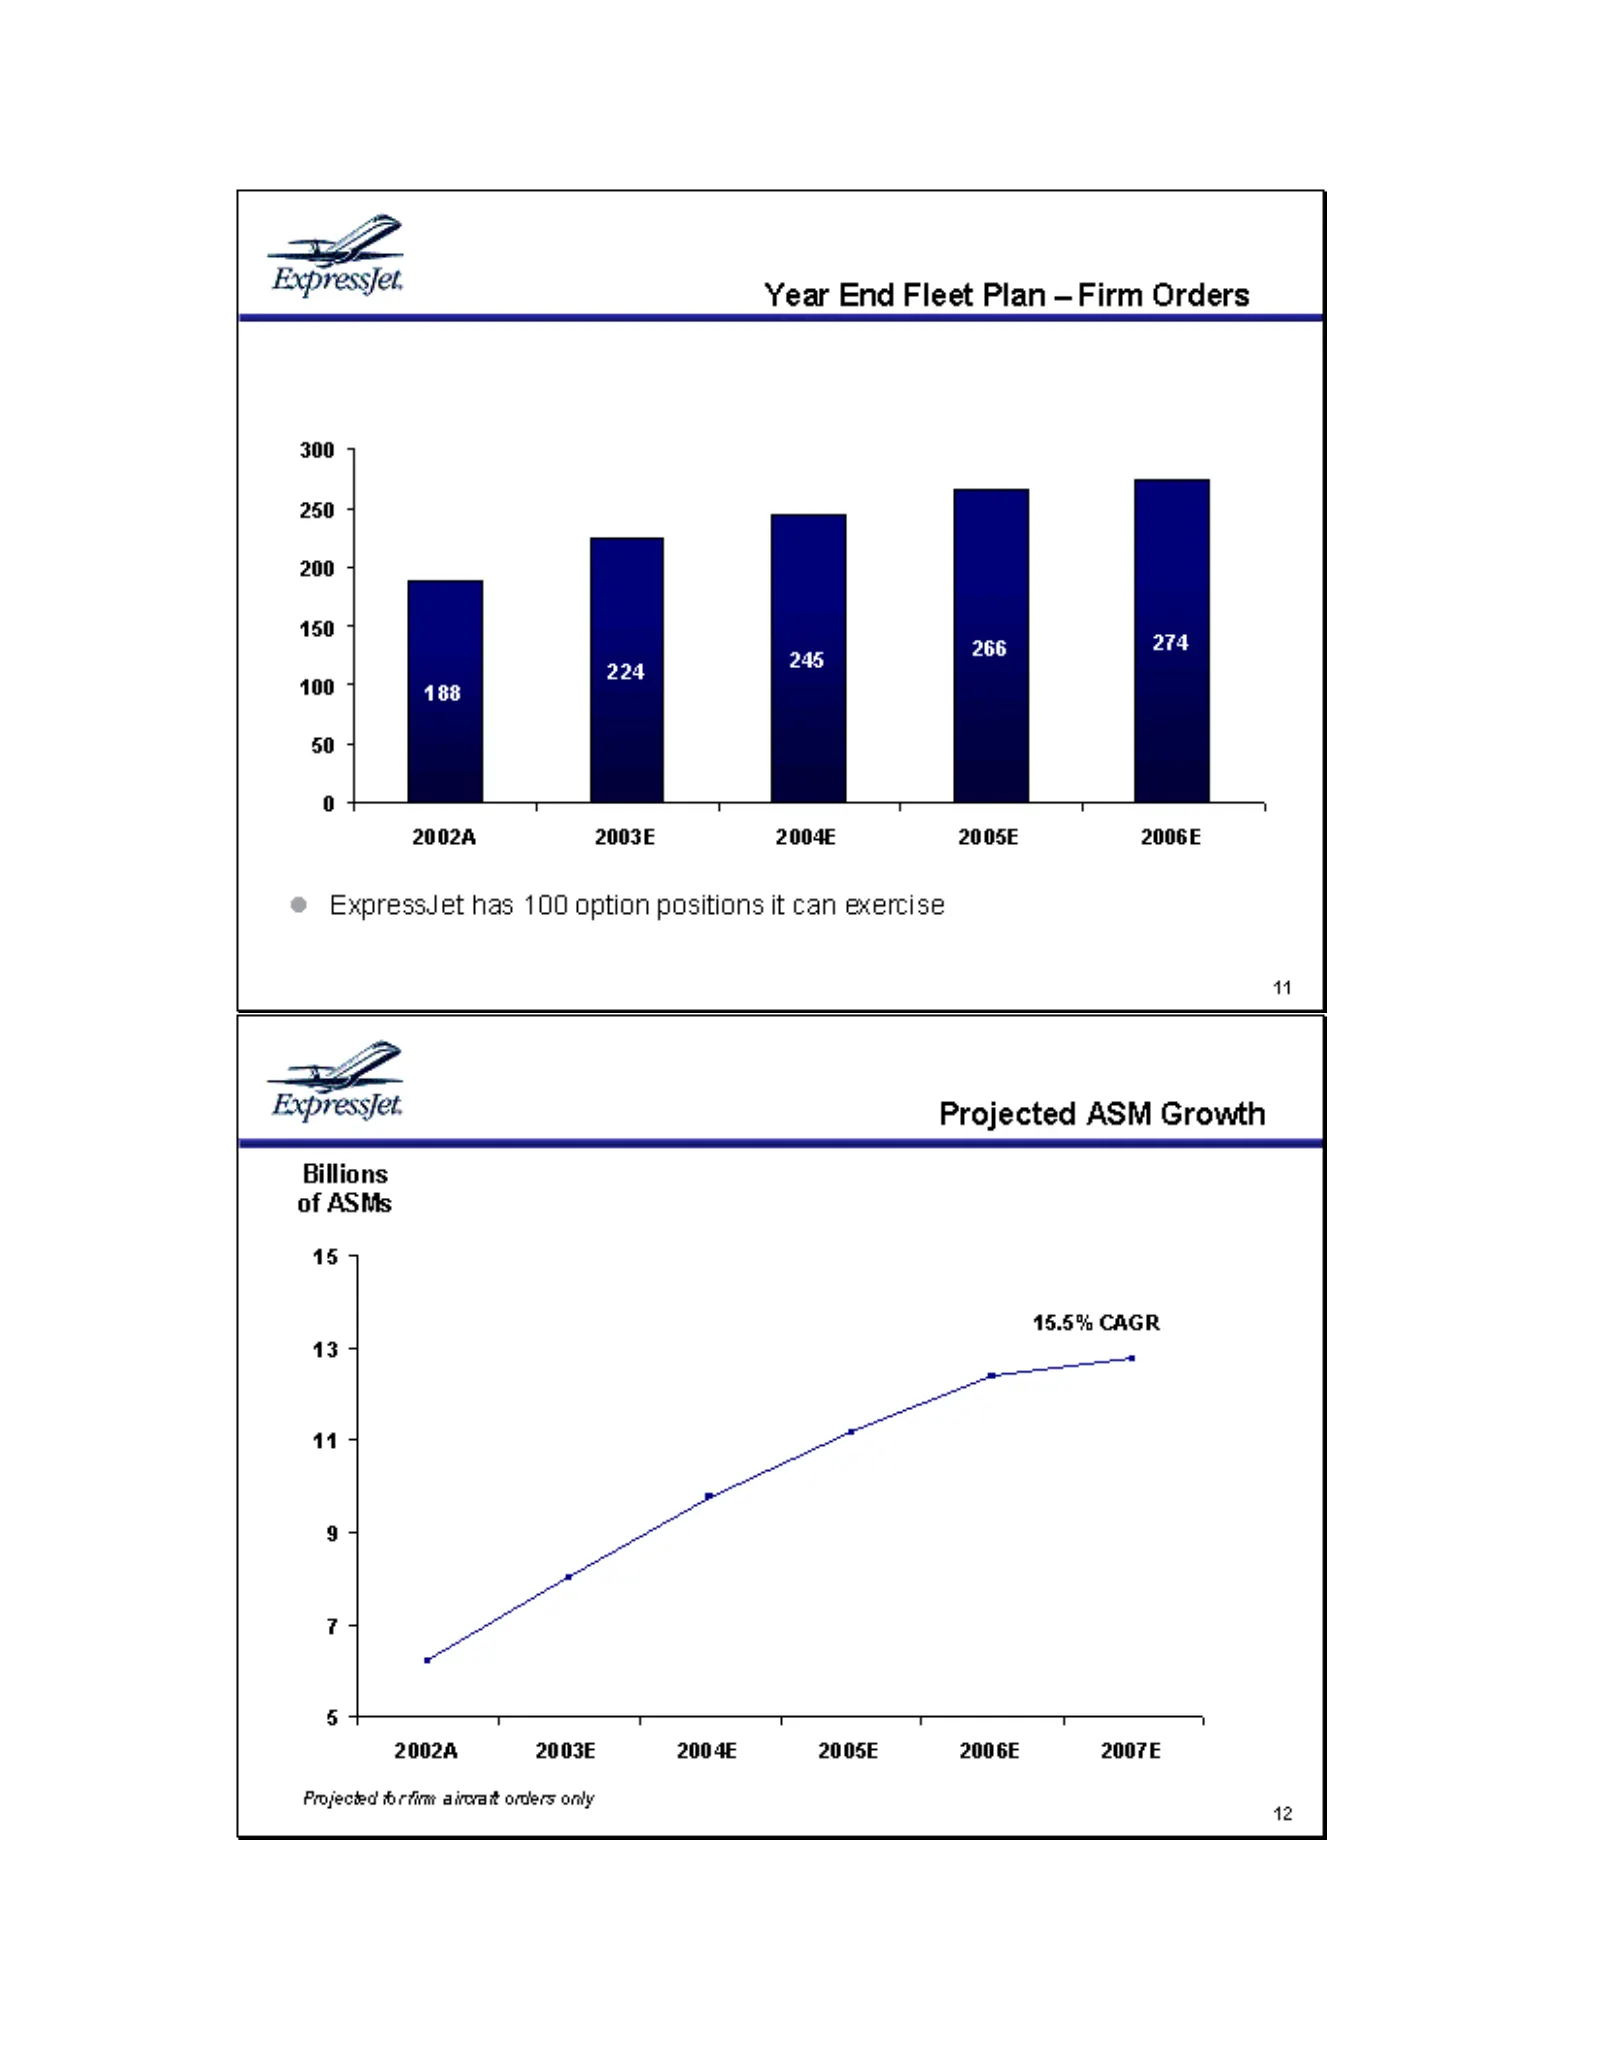
Slide 7: Year End Fleet Plan and Projected ASM Growth
Expressjet. Year End Fleet Plan —Firm Orders 300 4 250 | 200 | 180 | 274 soo | 7 204 245 50 4 0 1 1 : 1 7 20024 2003E 2004E 2005E 2006E ® ExpressJet has 100 option positions it can exercise ExpressJet. Projected ASM Growth Billions of ASMs 155 15.5% CAGR 20024 2003E 2004€ 2005E 2006E 2007E Projected
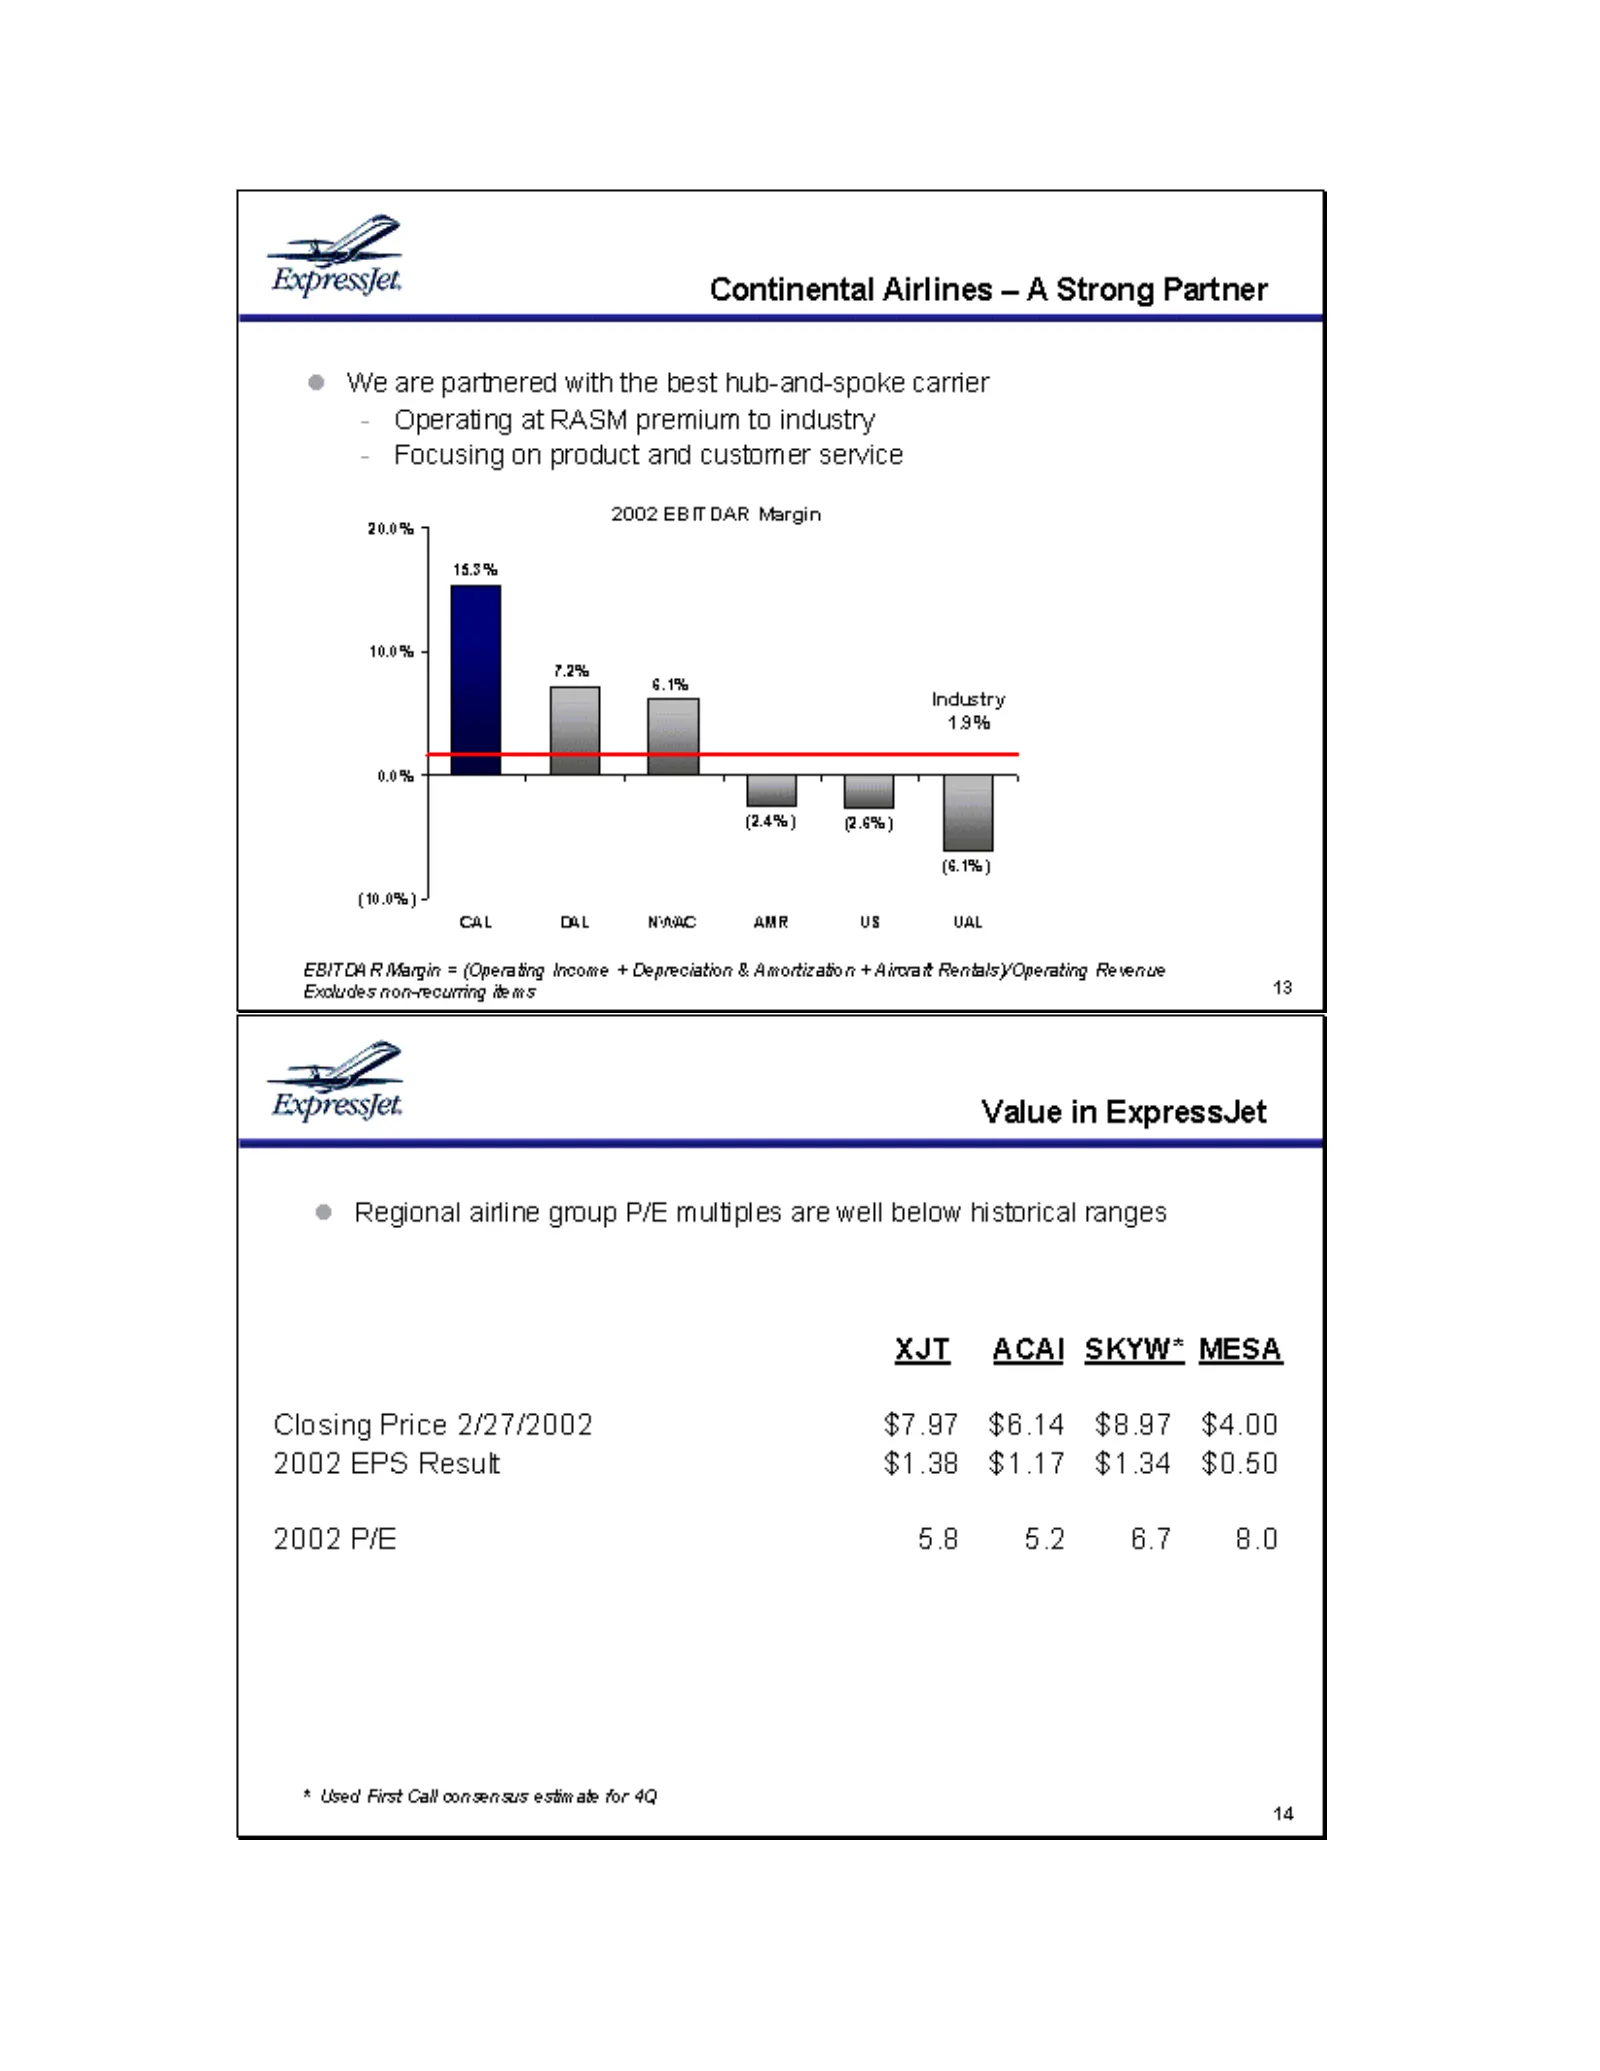
Slide 8: Continental Airlines — A Strong Partner; Value in ExpressJet
Expressfet. Continental Airlines — A Strong Partner e We are partnered with the best hub-and-spoke carrier Operating at RASM premium to industry Focusing on product and custorner service 2002 EBITDAR Margin 20.0% 9 15.3% 10.0% 4 7.2% 6.1% Industry 13% 0.0% 7 r T : T (2.4%) 2.6%) (6.1%) (10.0%) 4 CAL
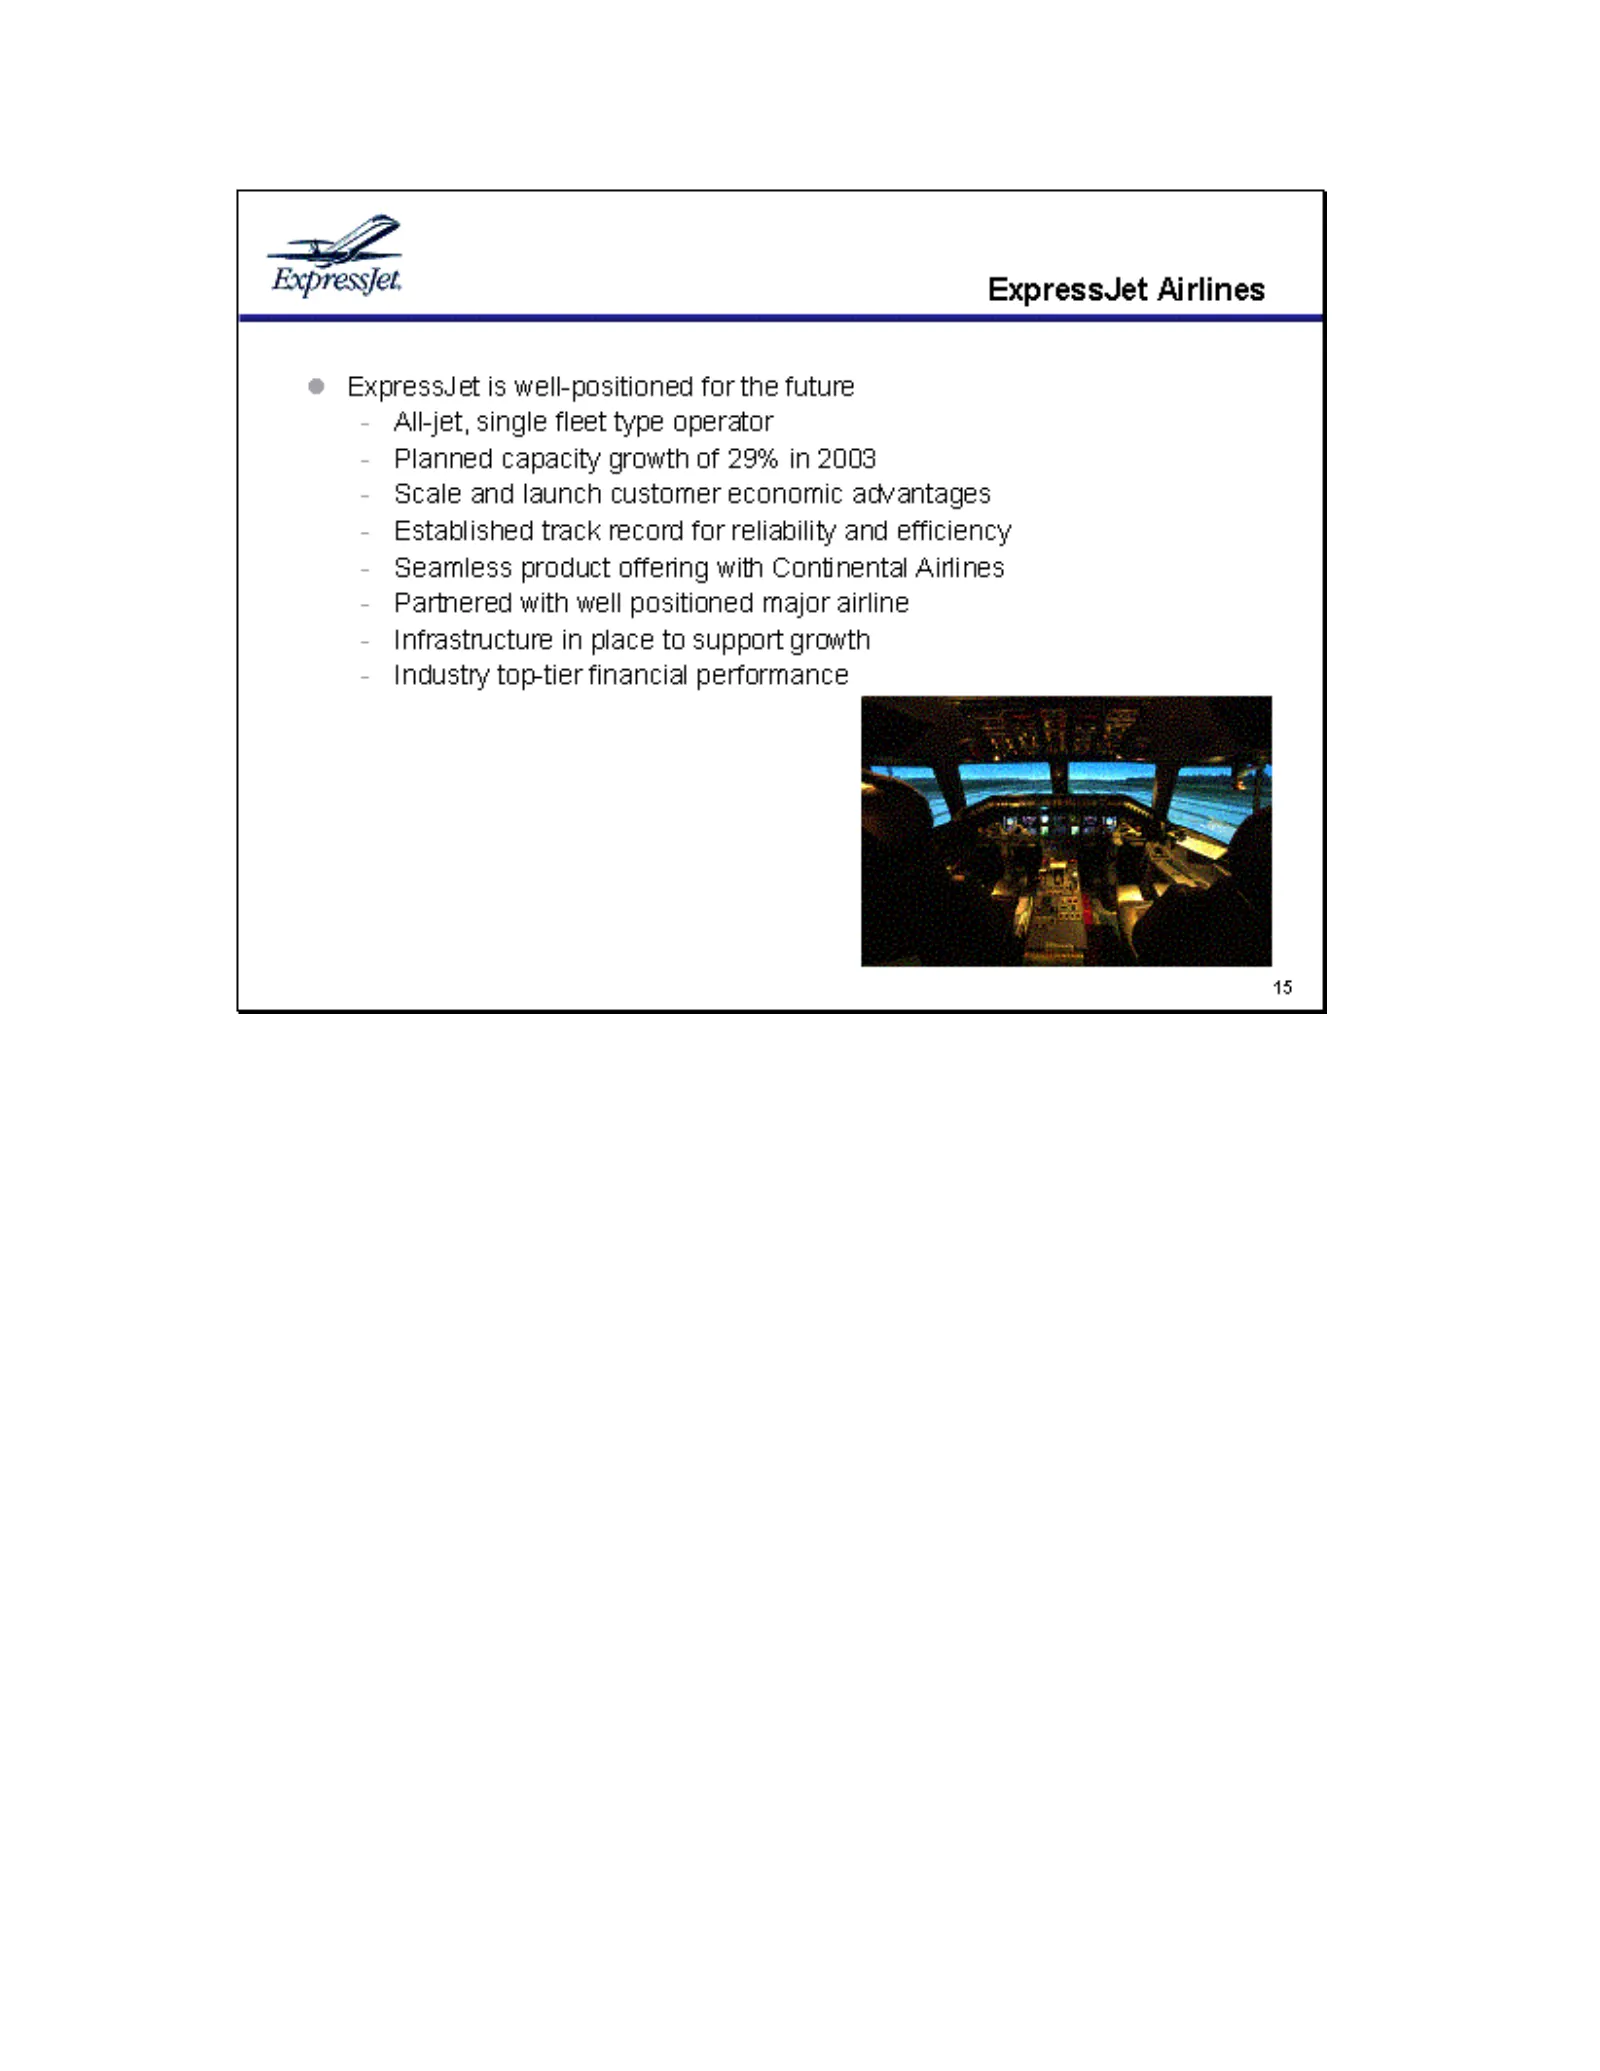
Slide 9: ExpressJet is well-positioned for the future
Expressjet. ExpressJet Airlines ExpressJet is well-positioned for the future All-jet, single fleet type operator Planned capacity growth of 29% in 2003 Scale and launch customer economic advantages Established track record for reliability and efficiency Seamless product offering with Continental Ain
Source: SEC EDGAR · 8-K filed Mar 3, 2003
More decks from Expressjet Holdings Inc
 Investor Presentation (June 2010)13 slides · Jun 8, 2010
 Credit Suisse 2008 Global Airlines Conference12 slides · Dec 3, 2008
 Credit Suisse Conference February 200813 slides · Feb 27, 2008
 Raymond James Growth Airline Conference (February 2007)13 slides · Feb 1, 2007
 Smith Barney Citigroup 2004 Transportation Conference12 slides · Nov 9, 2004
 Merrill Lynch Global Transportation Conference 200412 slides · Jun 16, 2004