Middlefield Banc — Shareholder Meeting (May 2016)
26 slides from Middlefield Banc's shareholder meeting presentation, May 11, 2016
Slide 1: Middlefield Banc Corp. Annual Shareholder Meeting
Middlefield Banc Corp. Annual Shareholder Meeting May 11, 2016 Exhibit 99.1
Slide 2: Forward Looking Statements
Forward Looking Statements This presentation contains forward-looking statements within the meaning of the Securities Exchange Act of 1934 and the Private Securities Litigation Reform Act of 1995 concerning Middlefield Banc Corp.’s plans, strategies, objectives, expectations, intentions, financial c
Slide 3: Board of Directors
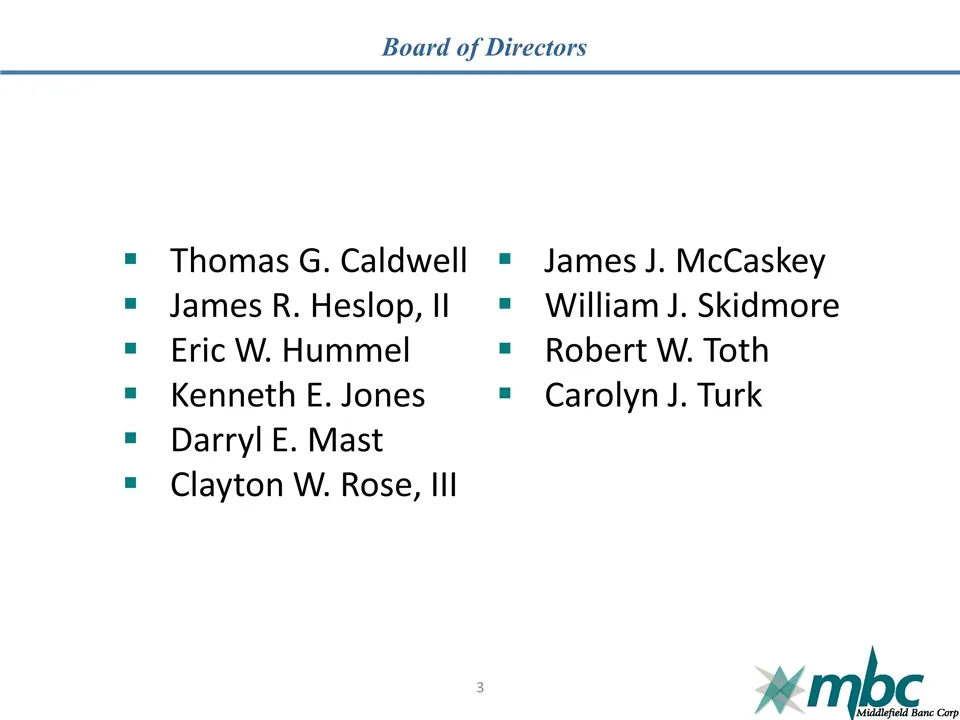
Board of Directors Thomas G. Caldwell James R. Heslop, II Eric W. Hummel Kenneth E. Jones Darryl E. Mast Clayton W. Rose, III James J. McCaskey William J. Skidmore Robert W. Toth Carolyn J. Turk 3
Slide 4: Experienced Management Team
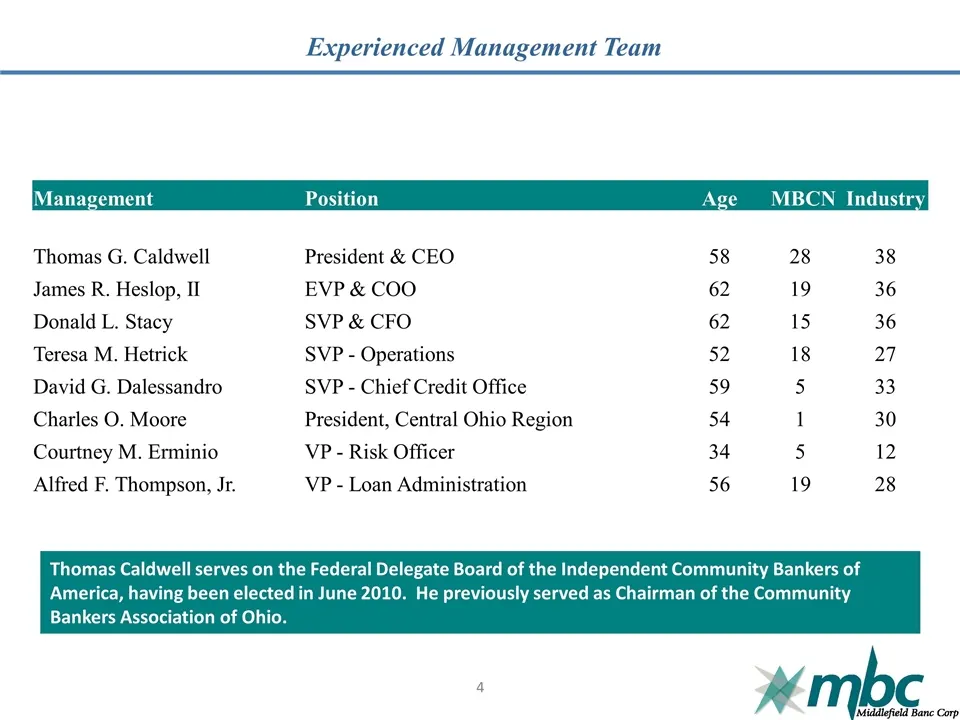
Experienced Management Team Management Position Age MBCN Industry Thomas G. Caldwell President & CEO 58 28 38 James R. Heslop, II EVP & COO 62 19 36 Donald L. Stacy SVP & CFO 62 15 36 Teresa M. Hetrick SVP - Operations 52 18 27 David G. Dalessandro SVP - Chief Credit Office 59 5 33 Charles O. Moore
Slide 5: Meeting Overview: Company Snapshot
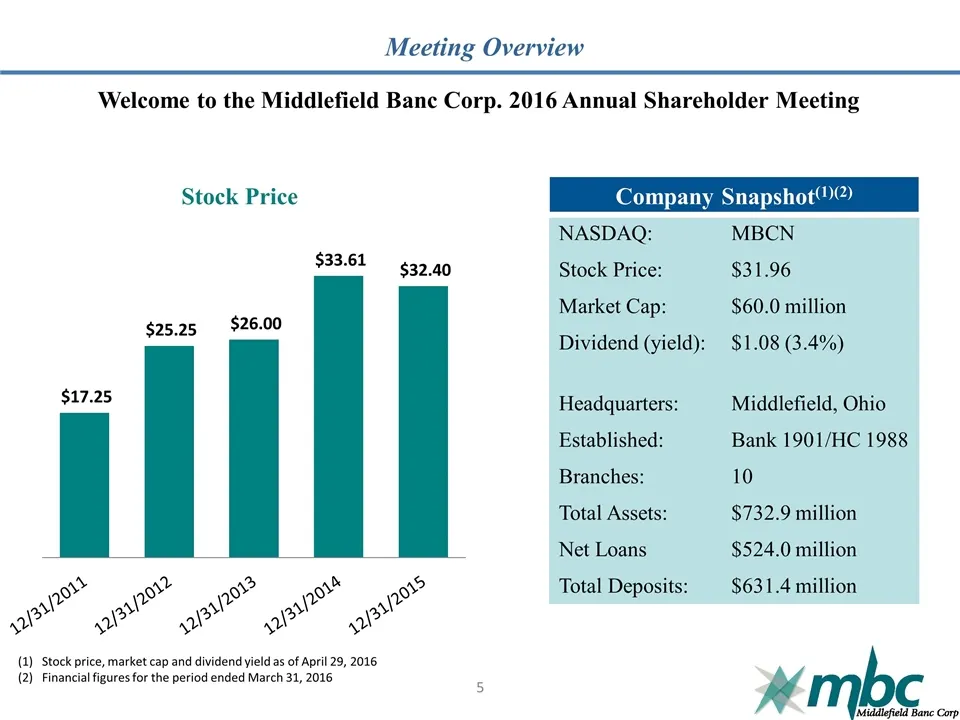
Meeting Overview Welcome to the Middlefield Banc Corp. 2016 Annual Shareholder Meeting Company Snapshot(1)(2) NASDAQ: MBCN Stock Price: $31.96 Market Cap: $60.0 million Dividend (yield): $1.08 (3.4%) Headquarters: Middlefield, Ohio Established: Bank 1901/HC 1988 Branches: 10 Total Assets: $732.9 mil
Slide 6: CEO Report
6 CEO Report
Slide 7: Business Overview
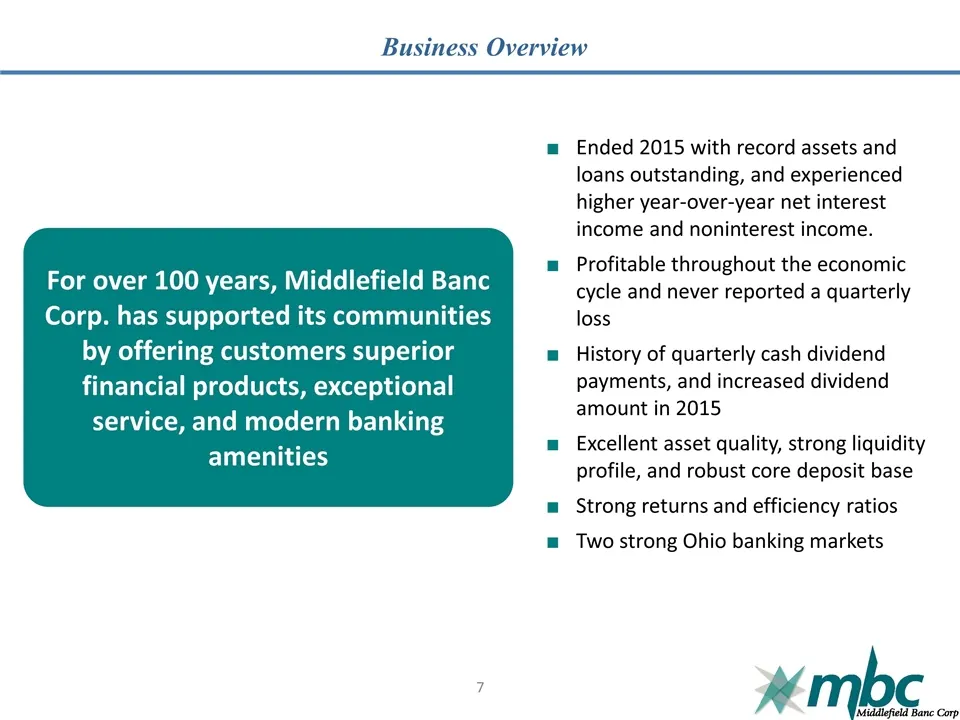
Business Overview Ended 2015 with record assets and loans outstanding, and experienced higher year-over-year net interest income and noninterest income. Profitable throughout the economic cycle and never reported a quarterly loss History of quarterly cash dividend payments, and increased dividend am
Slide 8: Branch Locations
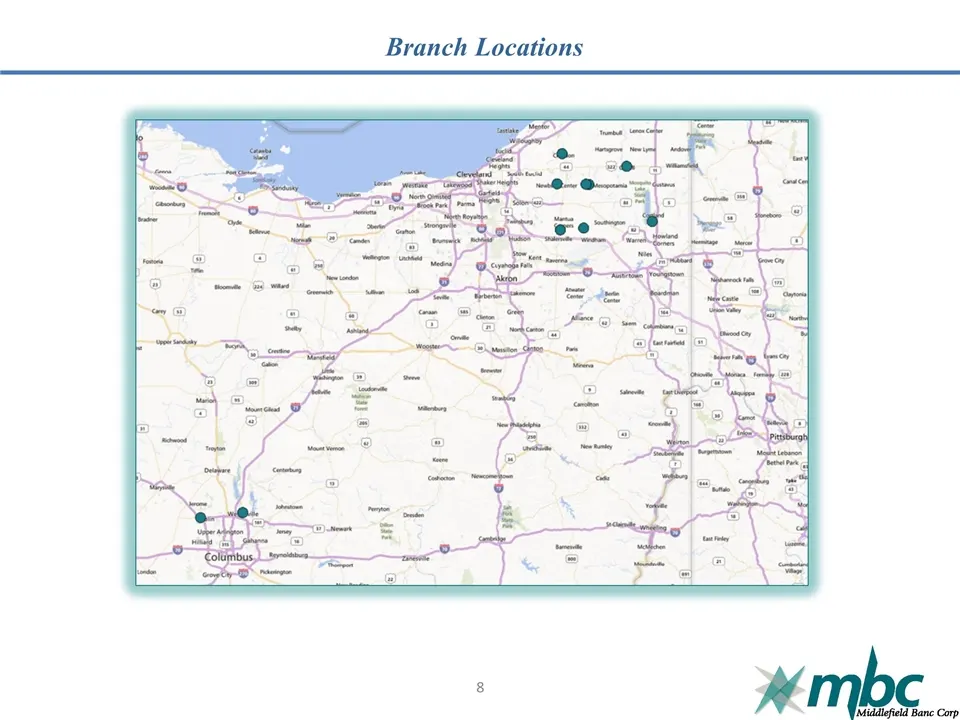
Branch Locations 8
Slide 9: 2016 Ranking
2016 Ranking Source: (1)American Banker April 25, 2016 http://www.americanbanker.com/ American Banker(1) Middlefield Banc Corp. was ranked 42nd out of the top 200 community banks and thrifts by 3-year Avg. ROE according to an April 25, 2016 American Banker article. Of the top 200, 11 Ohio financial
Slide 10: Financial Summary
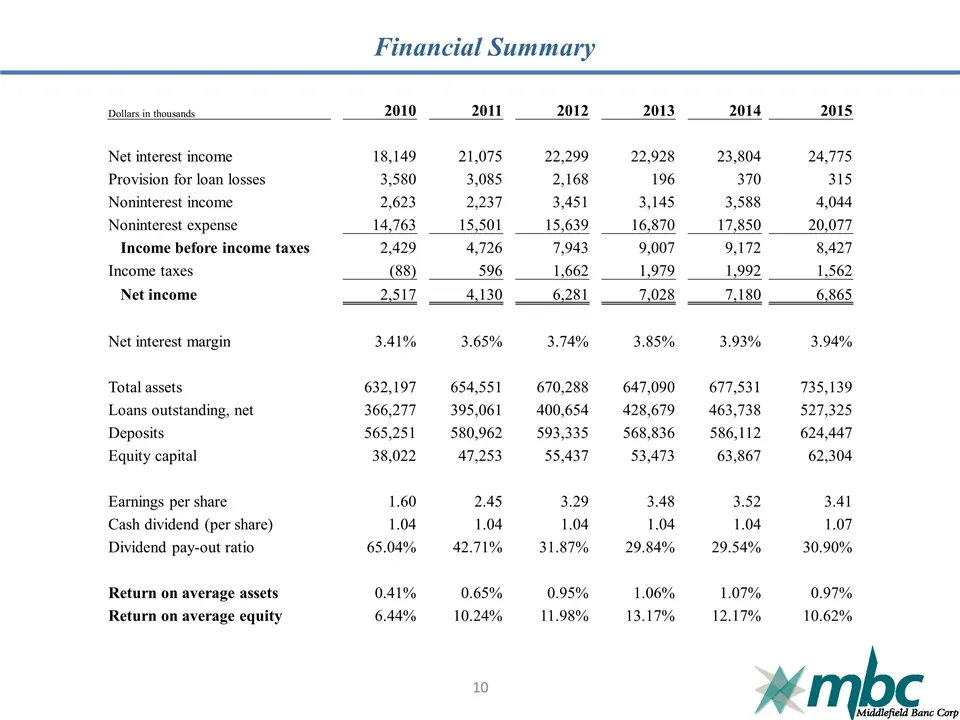
Financial Summary Dollars in thousands 2010 2011 2012 2013 2014 2015 Net interest income 18,149 21,075 22,299 22,928 23,804 24,775 Provision for loan losses 3,580 3,085 2,168 196 370 315 Noninterest income 2,623 2,237 3,451 3,145 3,588 4,044 Noninterest expense 14,763 15,501 15,639 16,870 17,850 20,
Slide 11: Annual Profitability
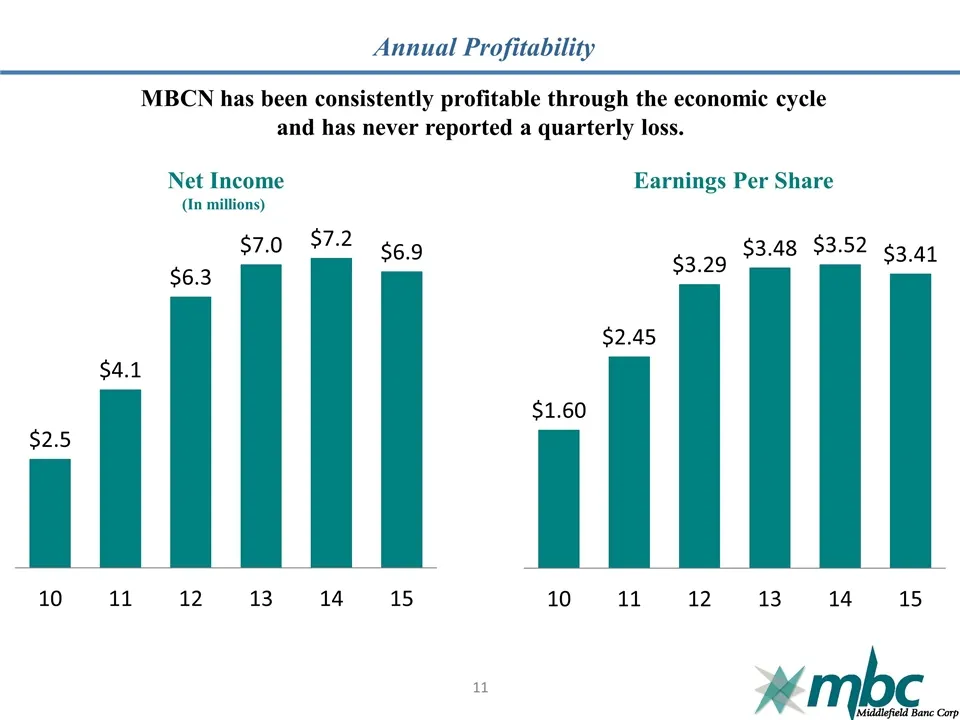
Annual Profitability Net Income (In millions) Earnings Per Share MBCN has been consistently profitable through the economic cycle and has never reported a quarterly loss. 11
Slide 12: Annual Returns
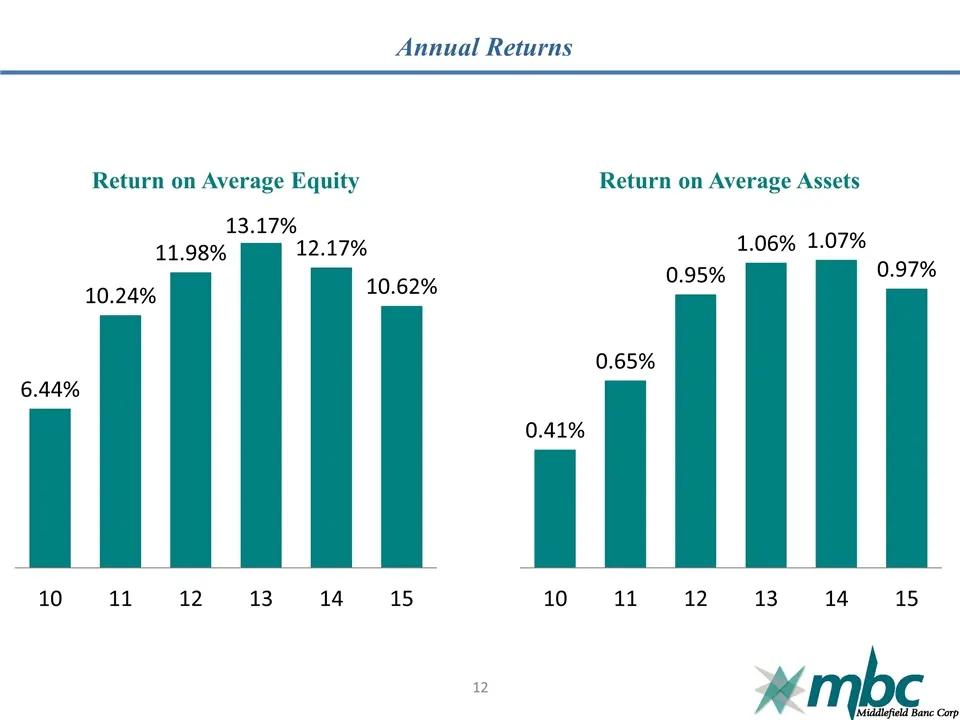
Annual Returns Return on Average Equity Return on Average Assets 12
Slide 13: Strong Market Demographics
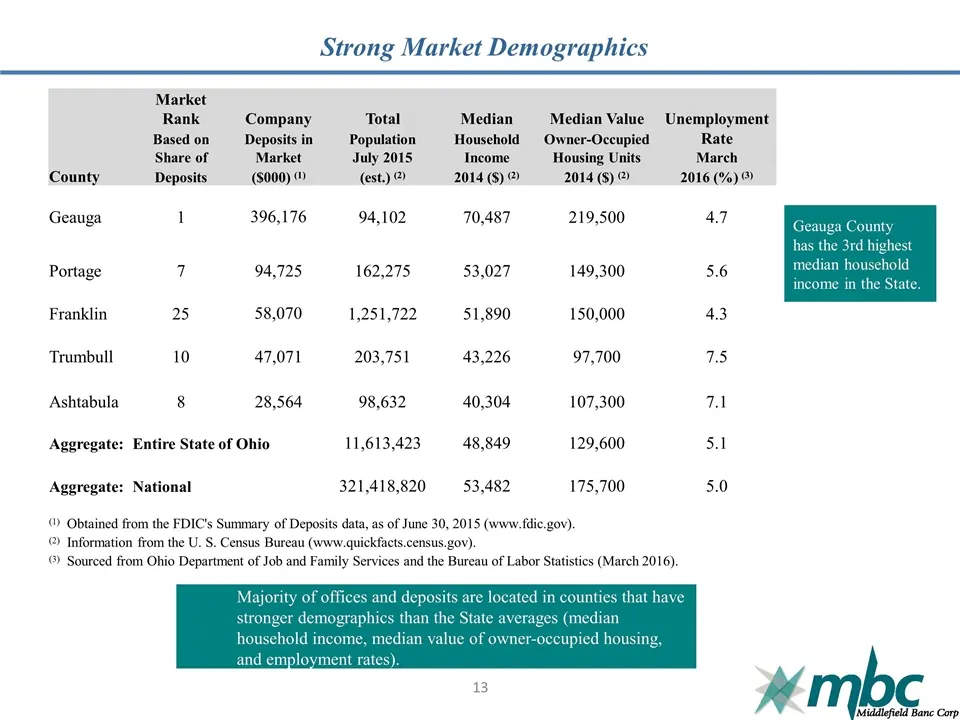
Strong Market Demographics Market Rank Company Total Median Median Value Unemployment Based on Deposits in Population Household Owner-Occupied Rate Share of Market July 2015 Income Housing Units March County Deposits ($000) (1) (est.) (2) 2014 ($) (2) 2014 ($) (2) 2016 (%) (3) Geauga 1 396,176 94,10
Slide 14: Deposit Market Share
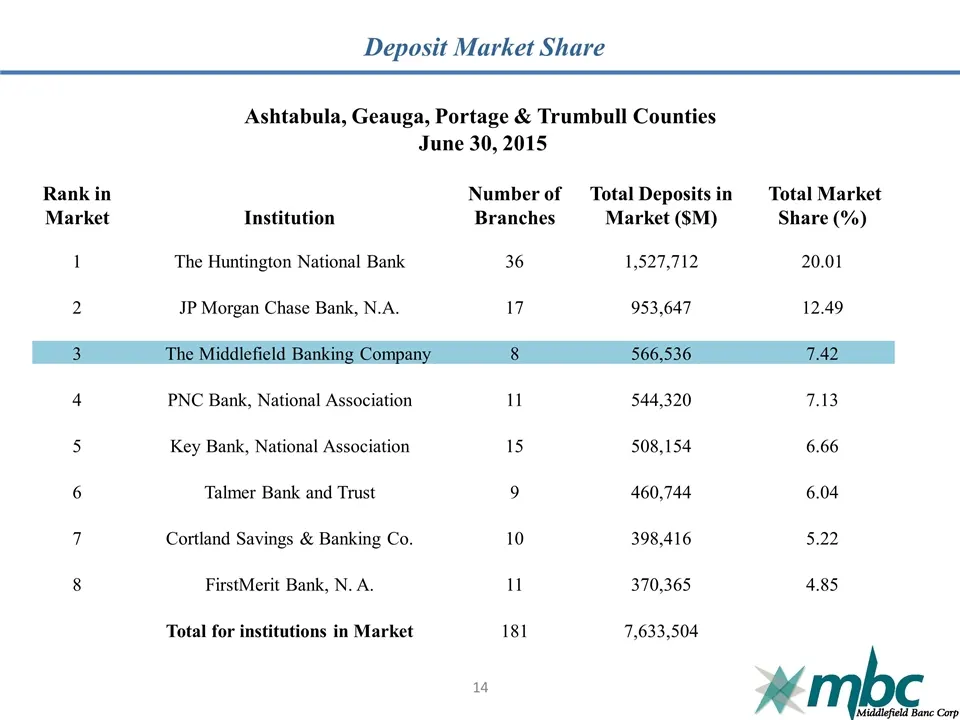
Deposit Market Share Ashtabula, Geauga, Portage & Trumbull Counties June 30, 2015 Rank in Market Institution Number of Branches Total Deposits in Market ($M) Total Market Share (%) 1 The Huntington National Bank 36 1,527,712 20.01 2 JP Morgan Chase Bank, N.A. 17 953,647 12.49 3 The Middlefield Banki
Slide 15: Annual Loan Growth
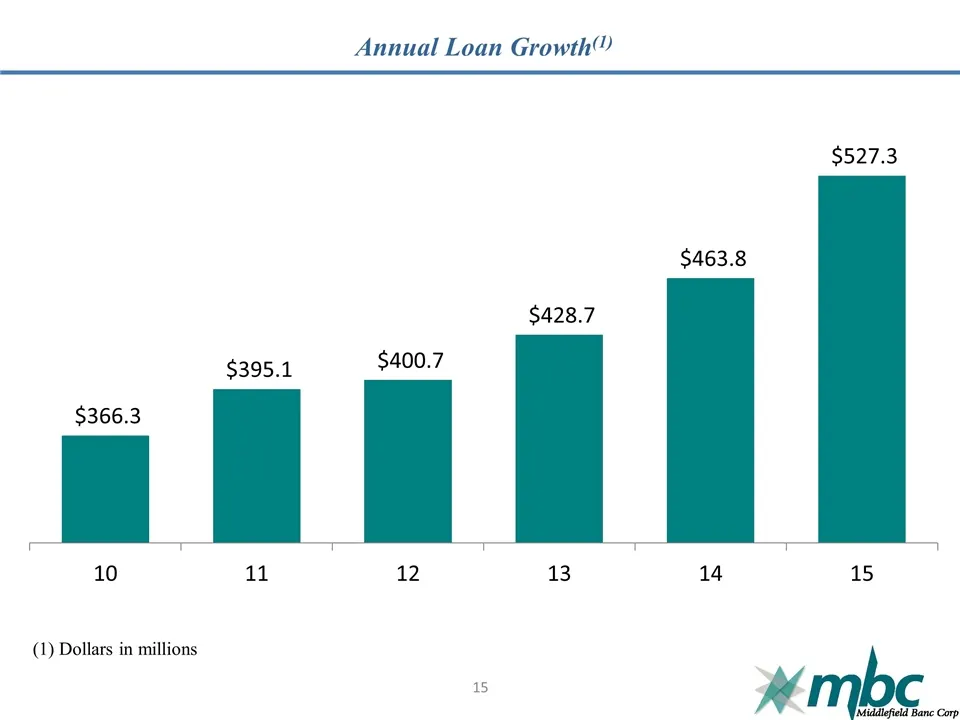
Annual Loan Growth(1) (1) Dollars in millions 15
Slide 16: Loan Portfolio
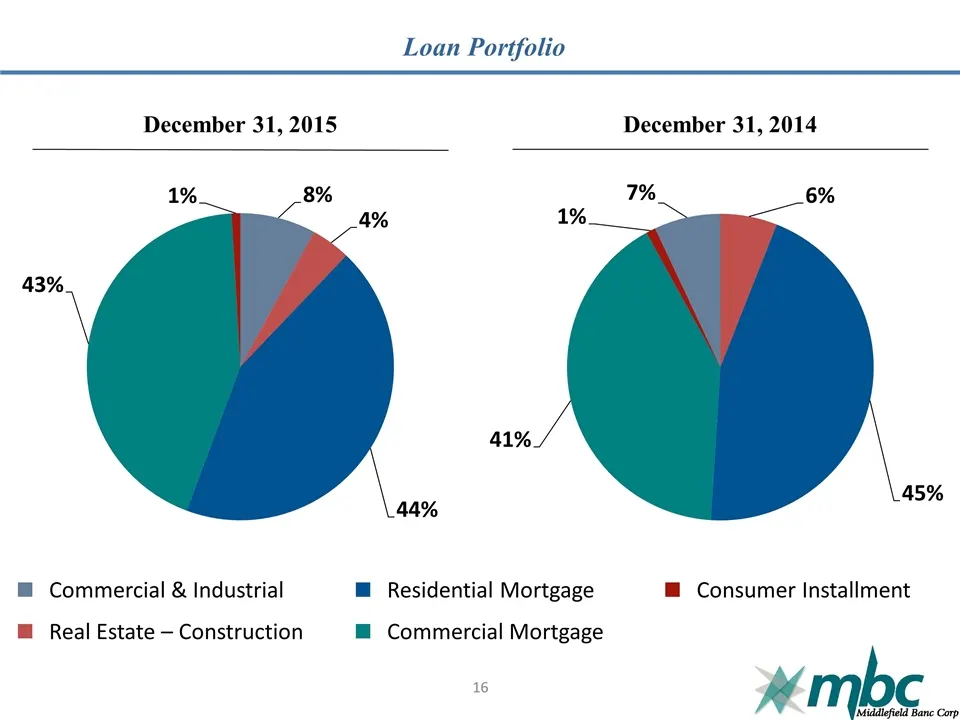
Loan Portfolio 16 December 31, 2015 December 31, 2014 Commercial & Industrial Real Estate – Construction Residential Mortgage Commercial Mortgage Consumer Installment
Slide 17: Asset Quality
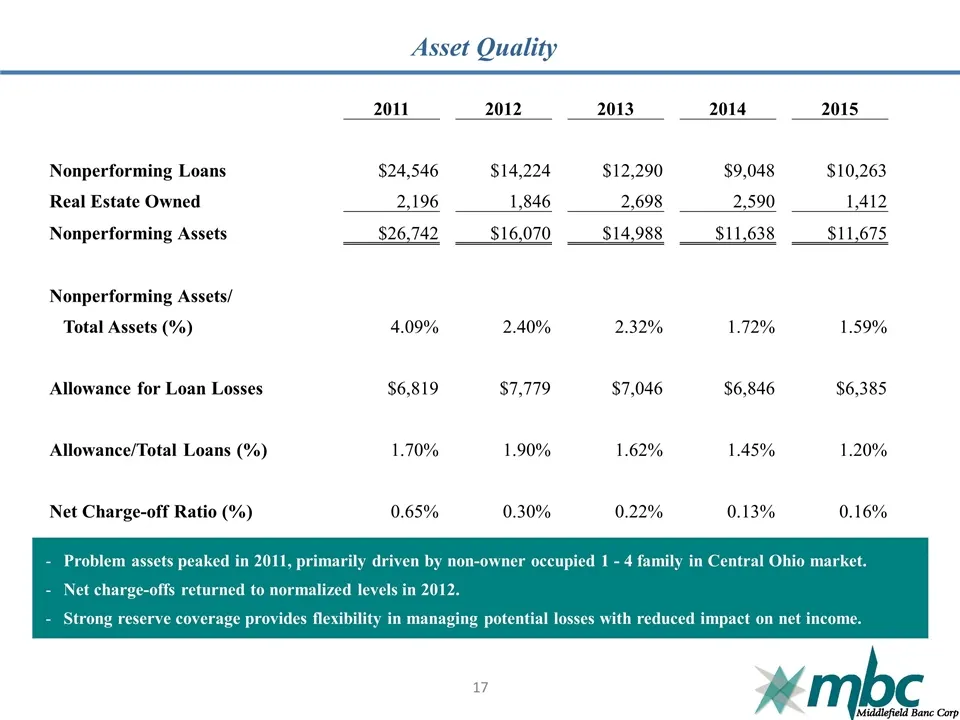
Asset Quality 2011 2012 2013 2014 2015 Nonperforming Loans $24,546 $14,224 $12,290 $9,048 $10,263 Real Estate Owned 2,196 1,846 2,698 2,590 1,412 Nonperforming Assets $26,742 $16,070 $14,988 $11,638 $11,675 Nonperforming Assets/ Total Assets (%) 4.09% 2.40% 2.32% 1.72% 1.59% Allowance for Loan Losse
Slide 18: Managed Deposit Growth
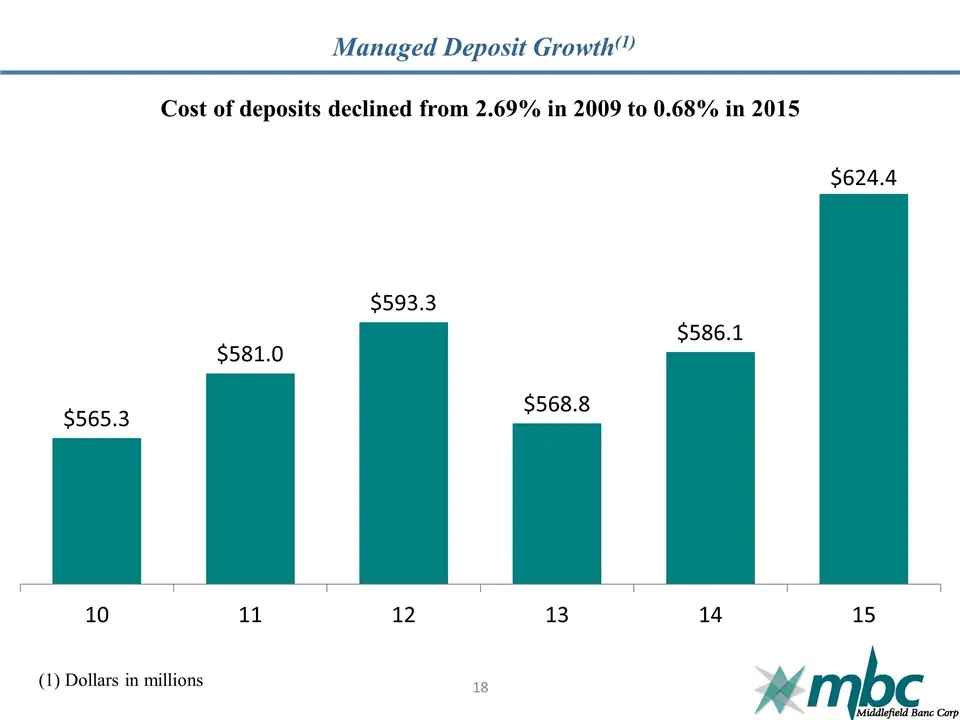
Managed Deposit Growth(1) Cost of deposits declined from 2.69% in 2009 to 0.68% in 2015 (1) Dollars in millions 18
Slide 19: Strong Core Deposit Base
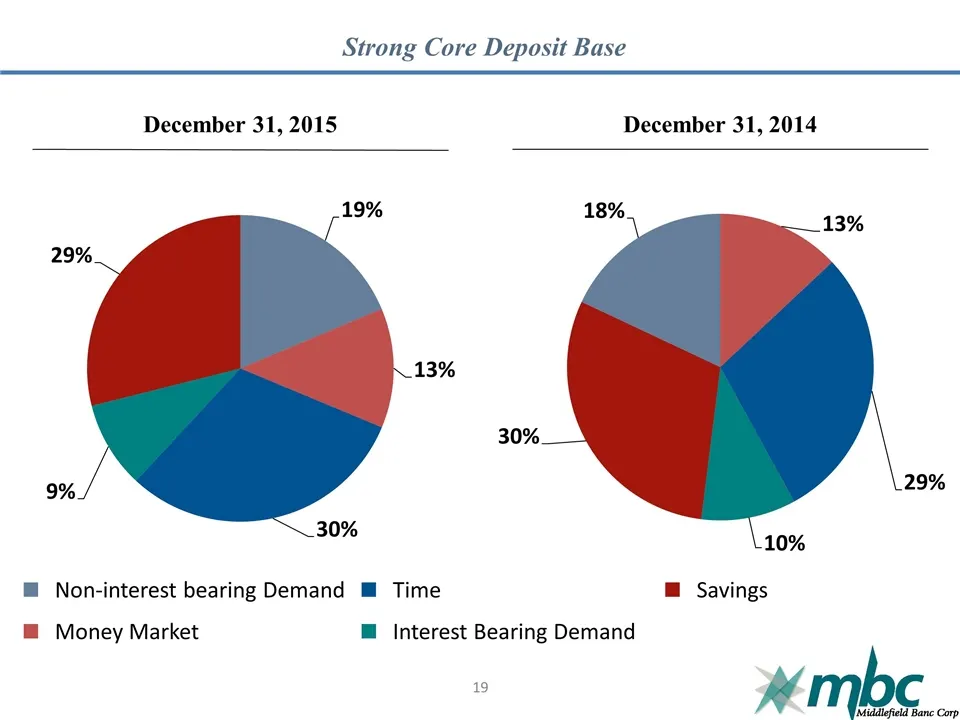
Strong Core Deposit Base 19 December 31, 2015 December 31, 2014 Non-interest bearing Demand Money Market Time Interest Bearing Demand Savings
Slide 20: Capital Ratios at December 31, 2015
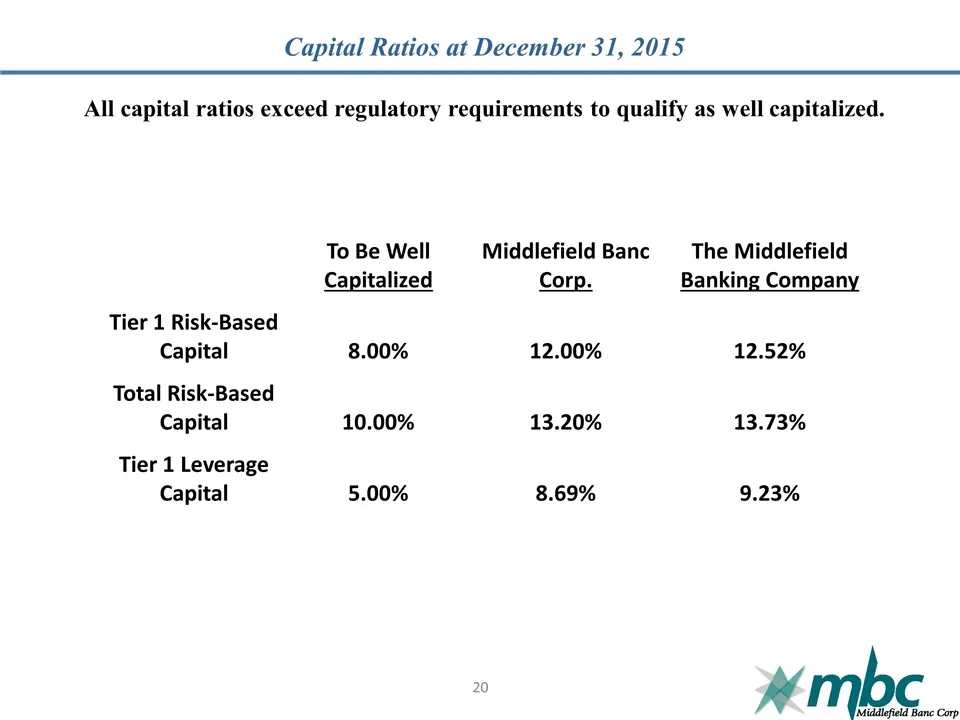
Capital Ratios at December 31, 2015 To Be Well Capitalized Middlefield Banc Corp. The Middlefield Banking Company Tier 1 Risk-Based Capital 8.00% 12.00% 12.52% Total Risk-Based Capital 10.00% 13.20% 13.73% Tier 1 Leverage Capital 5.00% 8.69% 9.23% All capital ratios exceed regulatory requirements to
Slide 21: Operating Initiatives
Operating Initiatives Personnel/Talent Strong management to drive performance growth Sales-orientation and cultural fit Operations/Risk Management Expanded technology Scaled to support growth initiatives Diligent risk management incorporating regulatory environment Expand Share of Market/Share of Cu
Slide 22: Today's Banking Landscape
Today’s Banking Landscape High level of competition for share of wallet Increasing regulatory concerns with added costs for smaller banks Industry continues to consolidate Economic challenges with a continued low rate environment and slow growth 22
Slide 23: 2016 and Forward
2016 and Forward Grow Secondary Mortgage Offering Execute against Strategic Plan: Market position Product and service offerings Growth initiatives Continue to Expand Share of Market/Share of Customer Identify target markets and customer segments Commercial relationship opportunities De novo expansio
Slide 24: Questions, Comments, and Discussion
Questions, Comments, and Discussion 24
Slide 25: Voting Results
Voting Results Election of four Directors to serve until the 2019 annual meeting Election of one Director to serve until the 2018 annual meeting Non-binding proposal on compensation Ratification of appointment of S.R. Snodgrass, P.C. 25
Slide 26: Thank you for your support!
Thank you for your support! May 11, 2016 26
Source: SEC EDGAR · 8-K filed May 11, 2016
More decks from Middlefield Banc
 Merger or Acquisition (October 2025)27 slides · Oct 22, 2025
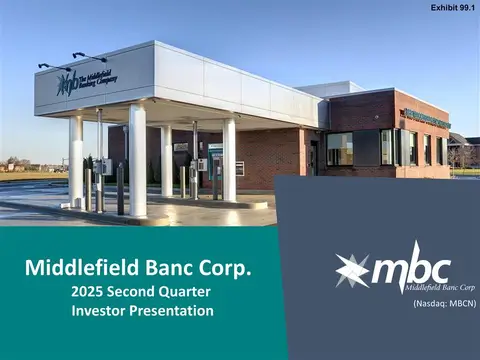 Q2 2025 Earnings Presentation24 slides · Jul 28, 2025
 Investor Presentation (June 2025)23 slides · Jun 2, 2025
 Q4 2024 Earnings Presentation24 slides · Jan 27, 2025
 Investor Presentation (November 2024)25 slides · Nov 22, 2024
 Investor Presentation (July 2024)25 slides · Jul 29, 2024