CALGON CARBON — Robert W. Baird & Co. investor presentation (February 2013)
37 slides from CALGON CARBON's conference presentation, Feb 27, 2013
Slide 1: Investor Presentation
Investor Presentation Robert W. Baird & Co. February 27, 2013 1 Calgon Carbon Corporation
Slide 2: Forward-Looking Information Safe Harbor
2 Forward-Looking Information Safe Harbor This news release contains historical information and forward-looking statements. Forward-looking statements typically contain words such as “expect,” “believe,” “estimate,” “anticipate,” or similar words indicating that future outcomes are uncertain. Statem
Slide 3: Agenda
Agenda Overview of Calgon Carbon Corporation Major Growth Opportunities Corporate Initiatives 3
Slide 4: Calgon Carbon Corporation description
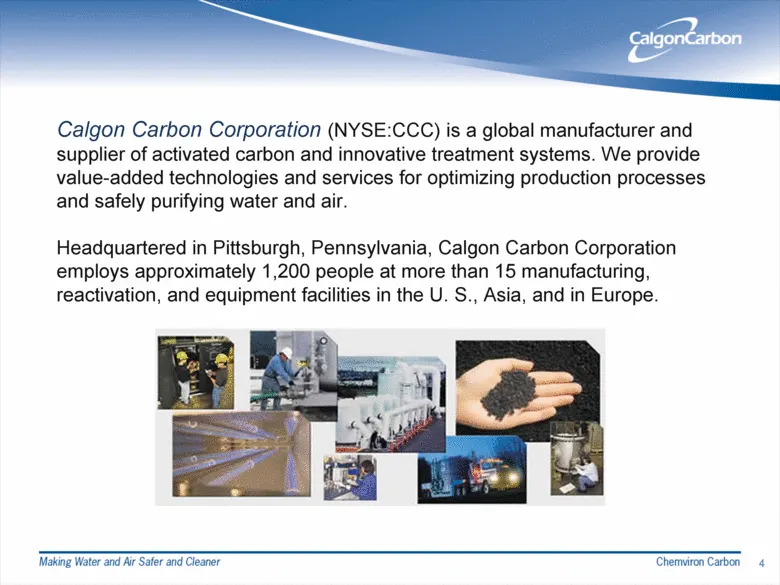
4 Calgon Carbon Corporation (NYSE:CCC) is a global manufacturer and supplier of activated carbon and innovative treatment systems. We provide value-added technologies and services for optimizing production processes and safely purifying water and air. Headquartered in Pittsburgh, Pennsylvania, Calgo
Slide 5: Corporate Overview
Corporate Overview Headquarters in Pittsburgh, Pennsylvania Business regions Americas Asia EMEA (Europe, Middle East, Africa) Facilities 7 production sites 9 Reactivation sites (+ two under construction) 5 R&D or technical support centers Sales: $562MM (2012) Employees: ~ 1,200 5
Slide 6: Global Locations
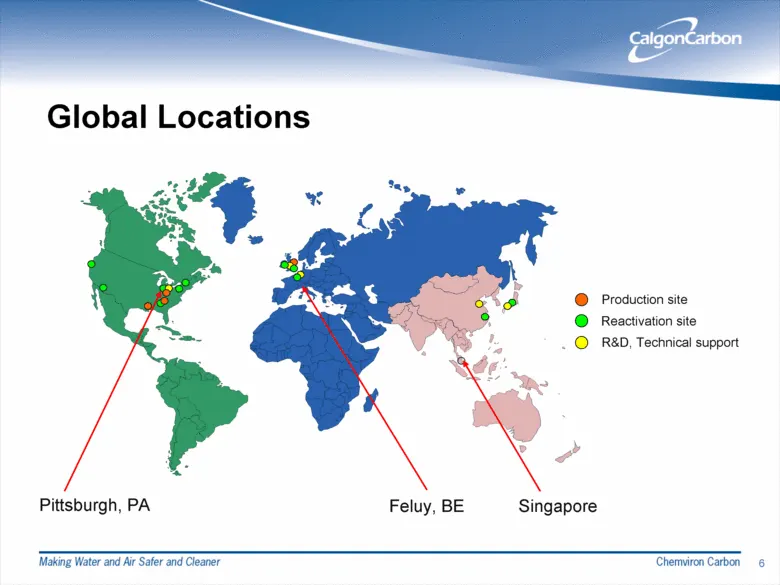
Global Locations Feluy, BE Pittsburgh, PA Production site Reactivation site R&D, Technical support Singapore 6
Slide 7: Calgon Carbon Corporation History
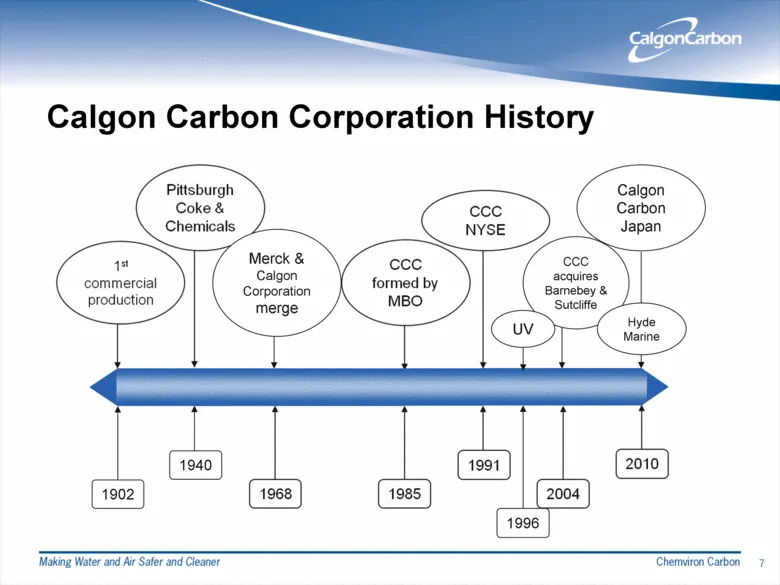
Calgon Carbon Corporation History 1902 1940 Merck & Calgon Corporation merge CCC acquires Barnebey & Sutcliffe Calgon Carbon Japan 1996 UV Hyde Marine 7
Slide 8: CCC Products and Services (2012)
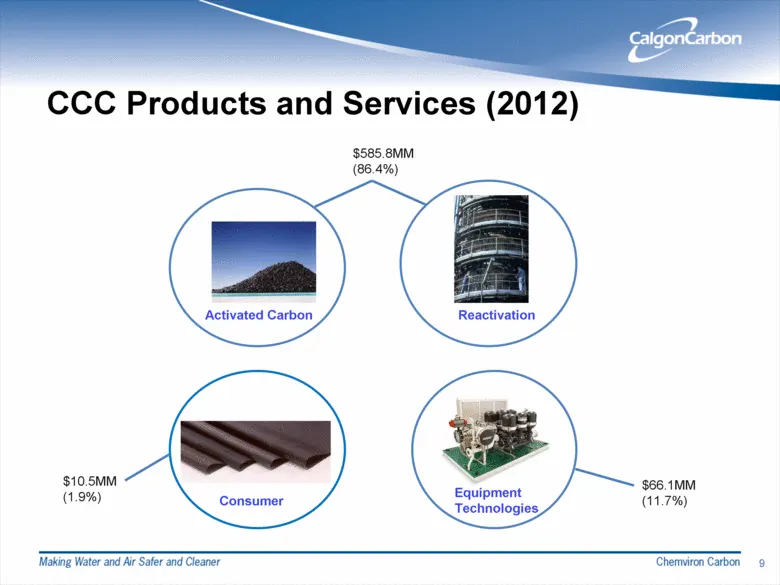
CCC Products and Services (2012) 9 Activated Carbon Reactivation Equipment Technologies Consumer $585.8MM (86.4%) $66.1MM (11.7%) $10.5MM (1.9%)
Slide 9: We sell into more than 100 applications
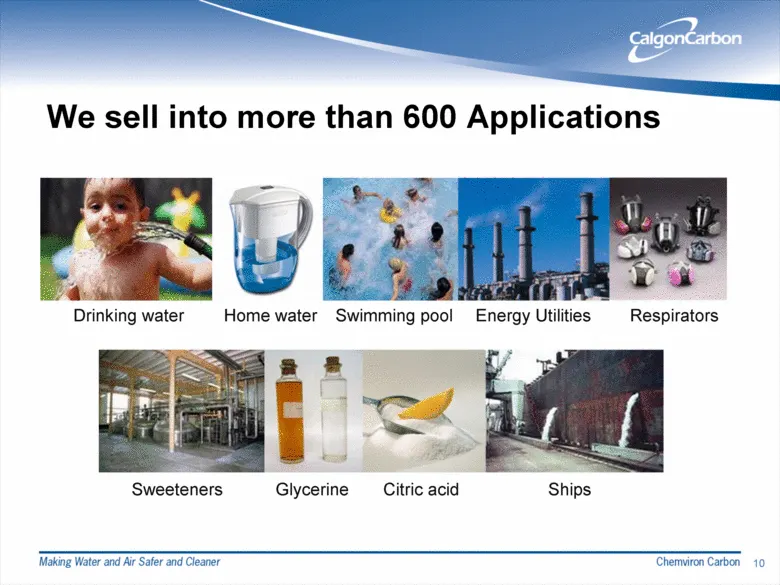
We sell into more than 600 Applications Home water Drinking water Sweeteners Ships Glycerine Citric acid Swimming pool Energy Utilities Respirators 10
Slide 10: Applications (continued)
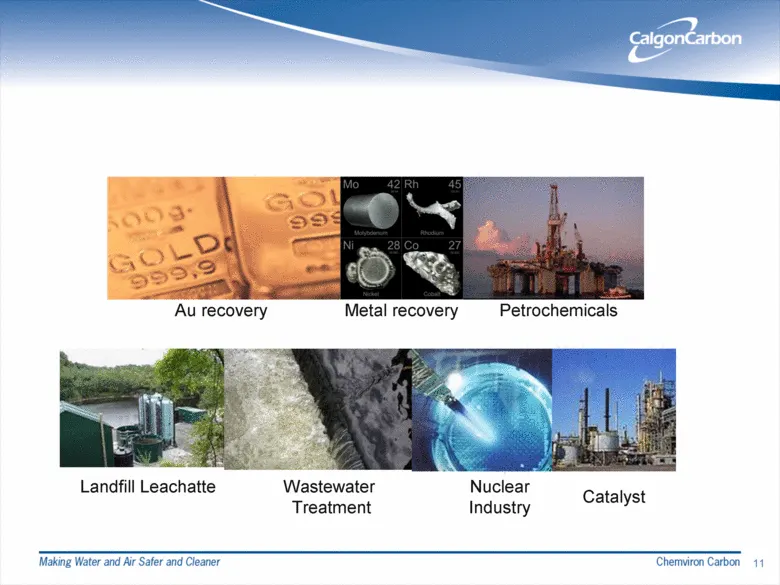
Au recovery Metal recovery Petrochemicals Landfill Leachatte Wastewater Treatment Catalyst Nuclear Industry 11
Slide 11: Breakdown of the Many Diverse Markets Using our Products in 2012
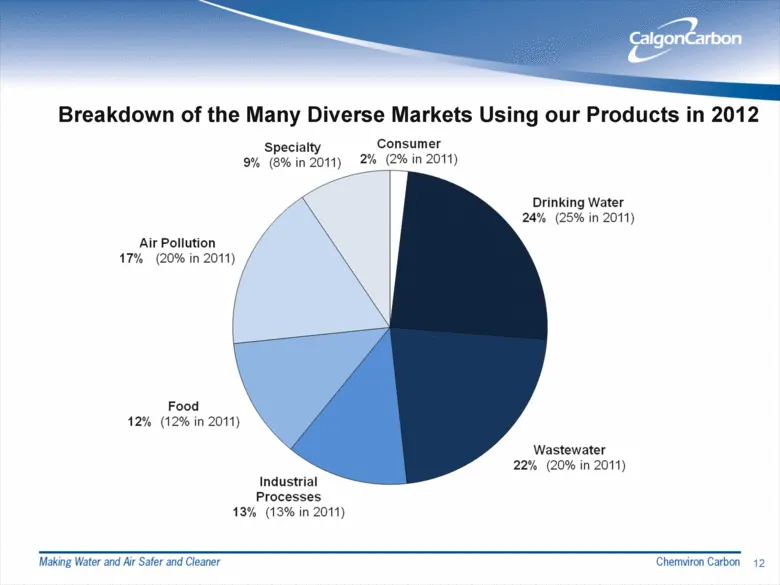
12 Breakdown of the Many Diverse Markets Using our Products in 2012 12
Slide 12: Growing traditional businesses while capitalizing on emerging regulation-driven markets
The focus at Calgon Carbon is growing our traditional businesses while capitalizing on emerging regulation-driven growth markets 13 Emerging Markets include: - Disinfection Byproduct Control- Municipal Drinking Water - Mercury Removal from Coal-Fired Power Plants - Ballast Water Treatment
Slide 13: Growth Opportunities with Emerging Markets 2012 - 2020
Growth Opportunities with Emerging Markets 2012 - 2020 14
Slide 14: Control of Disinfection Byproducts (DBP) in Municipal Drinking Water
Control of Disinfection Byproducts (DBP) in Municipal Drinking Water Market Size: $100 M+/Yr. Market Driver: U.S. EPA regulation DBPs formed when chlorine reacts with naturally occurring matter in drinking water DBPs increase health risks: cancer/reproductive and developmental effects Stage 2 Disinf
Slide 15: GAC for DBP Removal
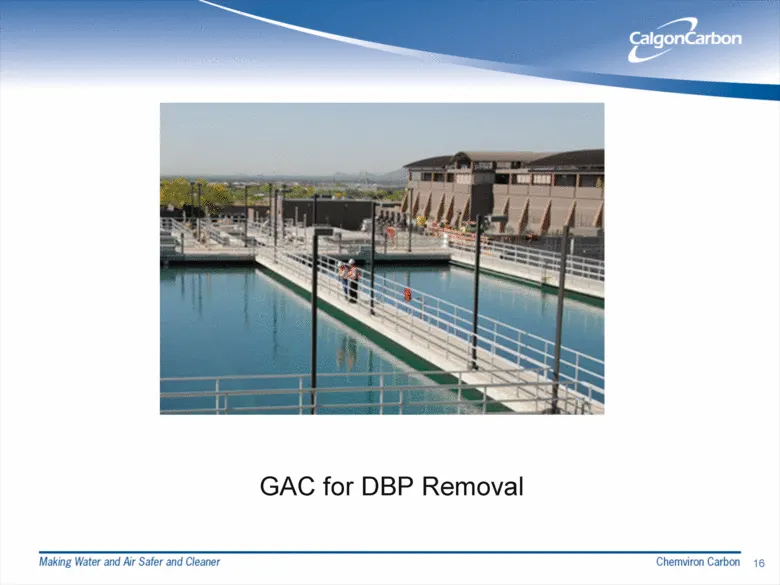
16 GAC for DBP Removal
Slide 16: Control of Disinfection Byproducts (cont'd)
Control of Disinfection Byproducts (DBP) in Municipal Drinking Water (Cont’d) Competing Technology – Chloramine (chlorine and ammonia) Lower cost than chlorine/carbon Produces unregulated DBPs Citizens groups protesting chloramine use due to health risks Recent Activity: Contract with Phoenix, Arizo
Slide 17: Mercury Removal from Power Plant Flue Gas
Mercury Removal from Power Plant Flue Gas Market Size: 380-765 MM lbs. per year Powdered Activated Carbon (PAC) Market Driver: Regulations in U.S. and Canada 17 states and certain Canadian provinces currently regulate mercury removal Current market > 160 MM lbs. PAC CCC supplying PAC to more than 45
Slide 18: PAC Injection for Mercury Removal
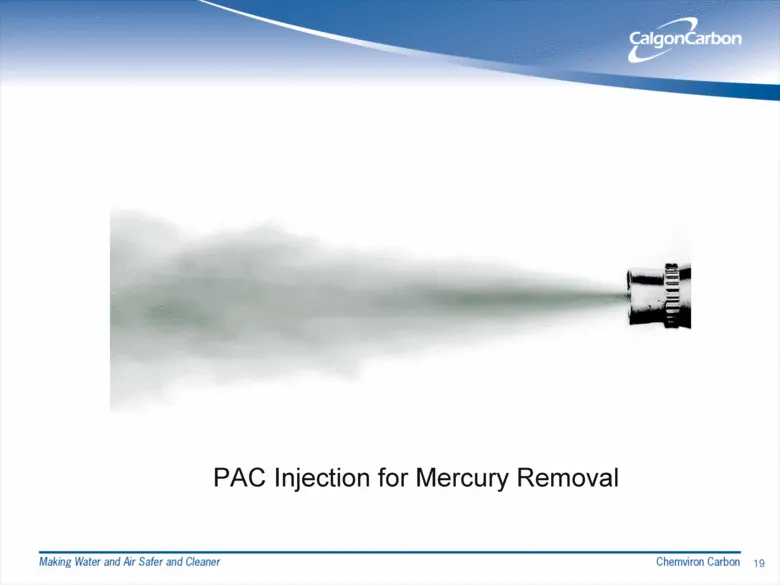
19 PAC Injection for Mercury Removal
Slide 19: Mercury Removal from Power Plant Flue Gas (Cont'd)
Mercury Removal from Power Plant Flue Gas (Cont’d) Calgon Carbon Product: FLUEPAC® Advanced PAC products Reduce carbon consumption by 50% or more Patents pending > 20 successful full-scale trials First contract 2011 20
Slide 20: Why Ballast Water Treatment?
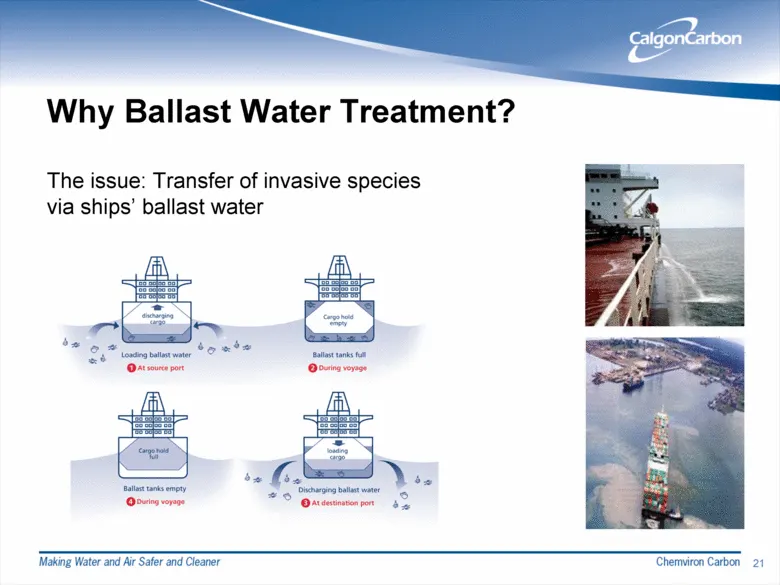
21 Why Ballast Water Treatment? The issue: Transfer of invasive species via ships’ ballast water
Slide 21: Ballast Water Disinfection – Largest Growth Opportunity
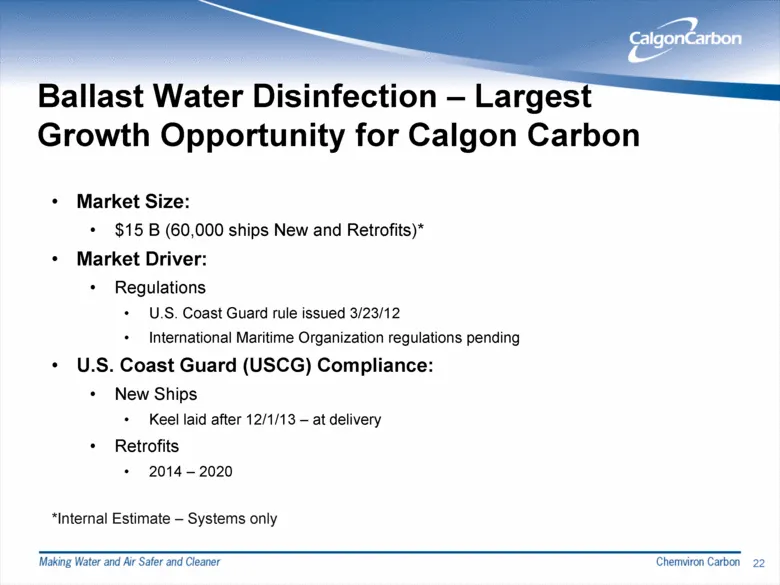
Ballast Water Disinfection – Largest Growth Opportunity for Calgon Carbon Market Size: $15 B (60,000 ships New and Retrofits)* Market Driver: Regulations U.S. Coast Guard rule issued 3/23/12 International Maritime Organization regulations pending U.S. Coast Guard (USCG) Compliance: New Ships Keel la
Slide 22: Ballast Water Disinfection (cont.)
Ballast Water Disinfection – Largest Growth Opportunity for Calgon Carbon (cont.) U.S. Coast Guard (USCG) Compliance (cont): System with IMO Type Approval may be designated Alternative Management System (AMS) by USCG Ships with AMS can discharge ballast water in U.S. ports for 5 years without USCG T
Slide 23: Ballast Water Disinfection: Hyde Guardian
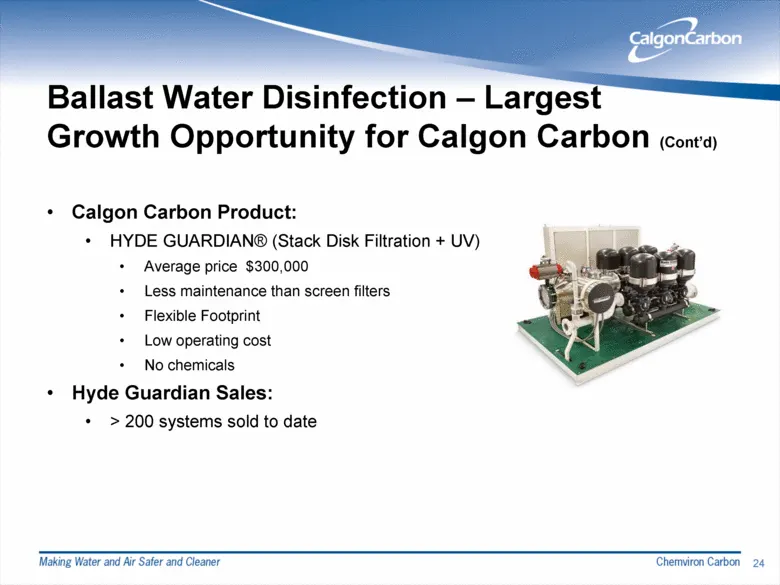
Ballast Water Disinfection – Largest Growth Opportunity for Calgon Carbon (Cont’d) Calgon Carbon Product: HYDE GUARDIAN® (Stack Disk Filtration + UV) Average price $300,000 Less maintenance than screen filters Flexible Footprint Low operating cost No chemicals Hyde Guardian Sales: > 200 systems sold
Slide 24: Compliance Timing for Regulated Markets
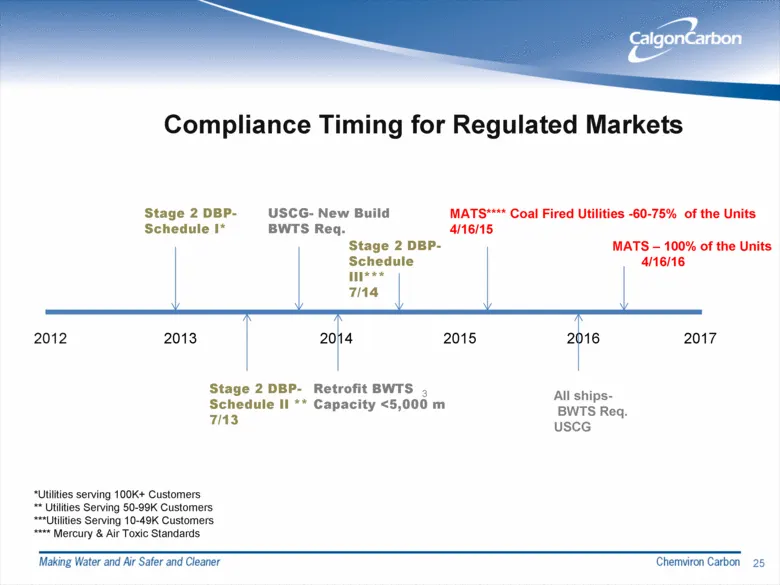
2012 2015 2013 2014 2016 2017 Compliance Timing for Regulated Markets Stage 2 DBP- Schedule I* Stage 2 DBP- Schedule II ** 7/13 USCG- New Build BWTS Req. Retrofit BWTS Capacity <5,000 m 3 MATS**** Coal Fired Utilities -60-75% of the Units 4/16/15 All ships- BWTS Req. USCG MATS – 100% of the Units 4/
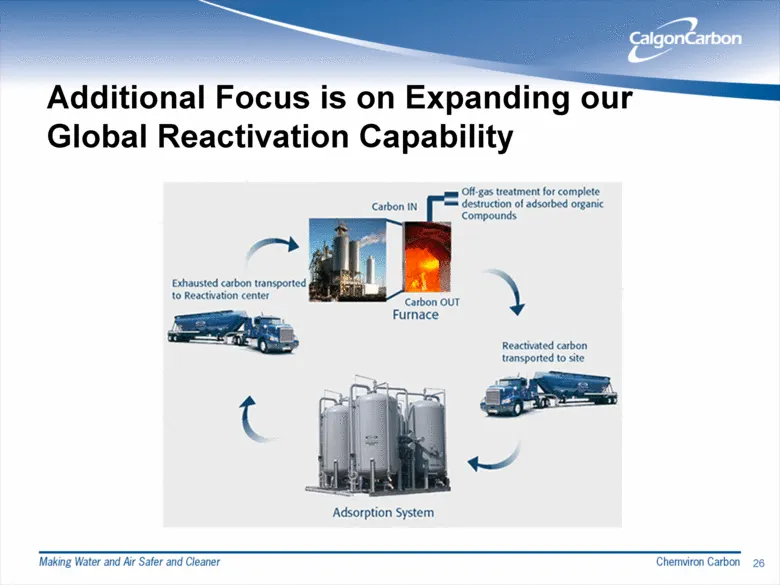
Slide 25: Additional Focus is on Expanding our Global Reactivation Capability
Additional Focus is on Expanding our Global Reactivation Capability 26
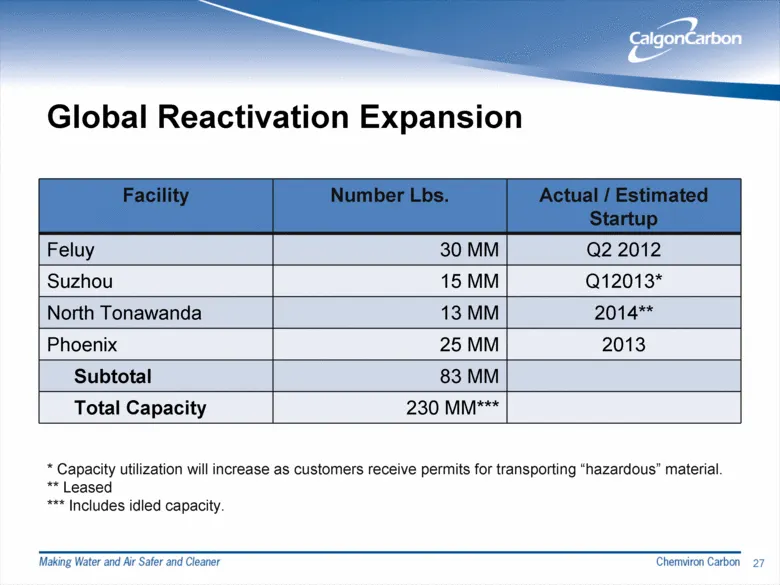
Slide 26: Global Reactivation Expansion
Global Reactivation Expansion Facility Number Lbs. Actual / Estimated Startup Feluy 30 MM Q2 2012 Suzhou 15 MM Q12013* North Tonawanda 13 MM 2014** Phoenix 25 MM 2013 Subtotal 83 MM Total Capacity 230 MM*** 27 * Capacity utilization will increase as customers receive permits for transporting “hazard
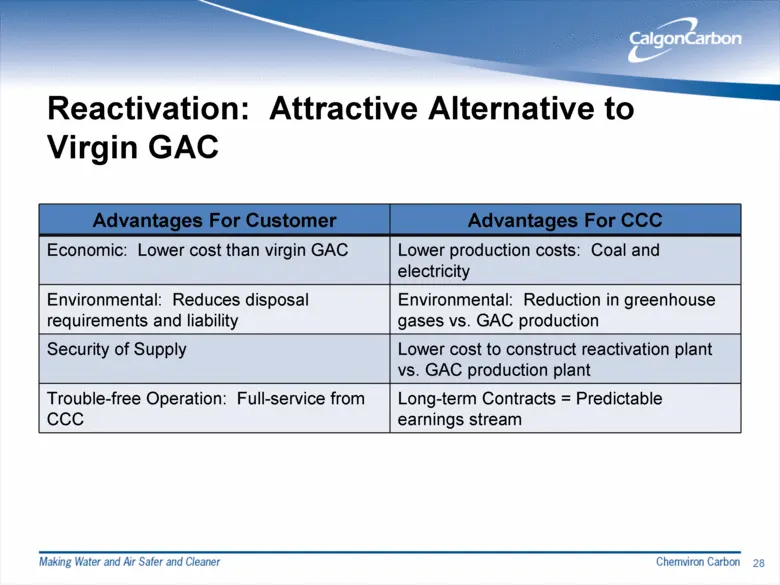
Slide 27: Reactivation: Attractive Alternative to Virgin GAC
Reactivation: Attractive Alternative to Virgin GAC Advantages For Customer Advantages For CCC Economic: Lower cost than virgin GAC Lower production costs: Coal and electricity Environmental: Reduces disposal requirements and liability Environmental: Reduction in greenhouse gases vs. GAC production S
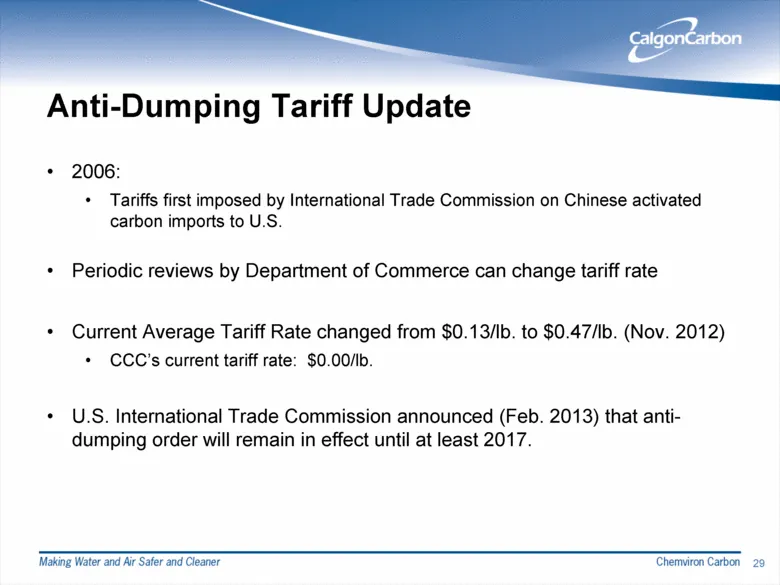
Slide 28: Anti-Dumping Tariff Update
Anti-Dumping Tariff Update 2006: Tariffs first imposed by International Trade Commission on Chinese activated carbon imports to U.S. Periodic reviews by Department of Commerce can change tariff rate Current Average Tariff Rate changed from $0.13/lb. to $0.47/lb. (Nov. 2012) CCC’s current tariff rate
Slide 29: Corporate Initiatives
Corporate Initiatives ‘Making Water and Air Safer and Cleaner Chemviron Carbon 30
Slide 30: Profitability Improvement is 2012 Top Priority
Profitability Improvement is 2012 Top Priority Improve balance in top- and bottom-line growth 2009 – 2011 Revenue CAGR = 14.7% 2009 – 2011 Net Income CAGR = 0.1% Organizational realignment for company unification Q2 12 initiated Cost Improvement Program Phase I – $10MM in annual savings ($9.0MM in 2
Slide 31: Comprehensive Approach to Shareholder Value Creation
Comprehensive Approach to Shareholder Value Creation Executing worldwide cost and profit improvement program Transforming company into a leaner, higher-performance enterprise and improving profitability through three-part, $30MM cost cutting effort Reengineering organizational structure Centralizing
Slide 32: Comprehensive Approach to Shareholder Value Creation (cont.)
Comprehensive Approach to Shareholder Value Creation (cont.) Aggressively managing balance sheet Commitment to return capital to shareholders through $100MM share repurchase program, of which $50MM is via an ASR plan 33 Several key initiatives have launched within the past few months (cont.) Goal: I
Slide 33: Phase I Cost Improvements
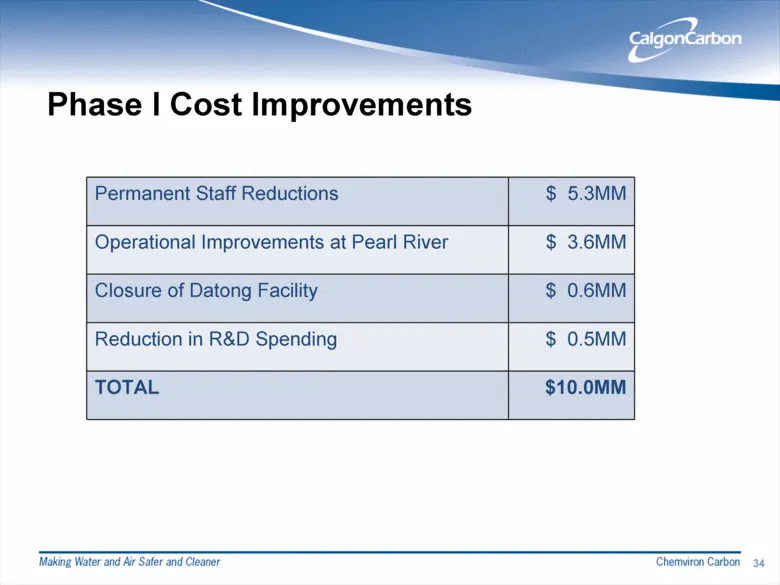
Phase I Cost Improvements Permanent Staff Reductions $ 5.3MM Operational Improvements at Pearl River $ 3.6MM Closure of Datong Facility $ 0.6MM Reduction in R&D Spending $ 0.5MM TOTAL $10.0MM 34
Slide 34: Phase II Cost Improvements
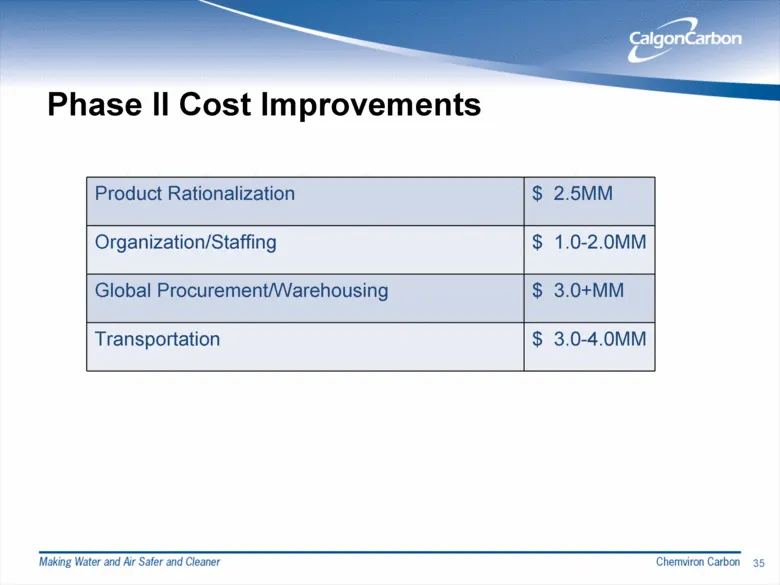
Phase II Cost Improvements Product Rationalization $ 2.5MM Organization/Staffing $ 1.0-2.0MM Global Procurement/Warehousing $ 3.0+MM Transportation $ 3.0-4.0MM 35
Slide 35: Phase III Cost Improvements
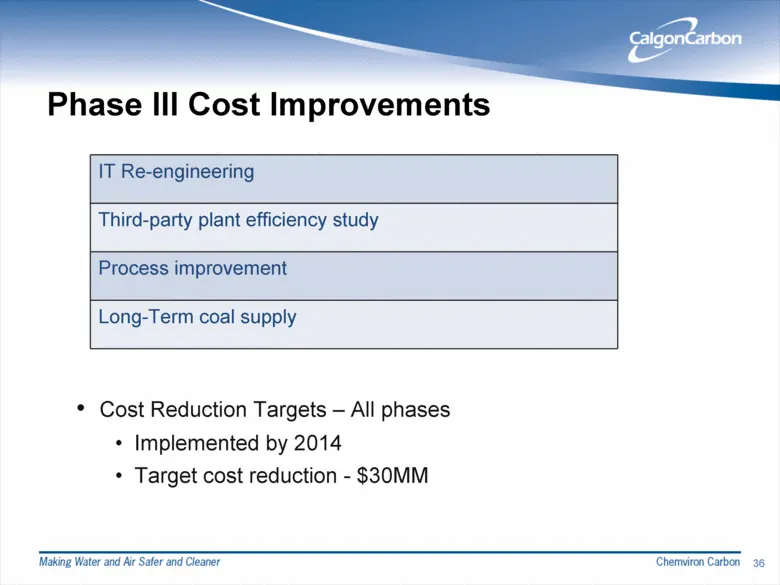
Phase III Cost Improvements IT Re-engineering Third-party plant efficiency study Process improvement Long-Term coal supply 36 Cost Reduction Targets – All phases Implemented by 2014 Target cost reduction - $30MM
Slide 36: Step-by-Step Approach to Creating Value
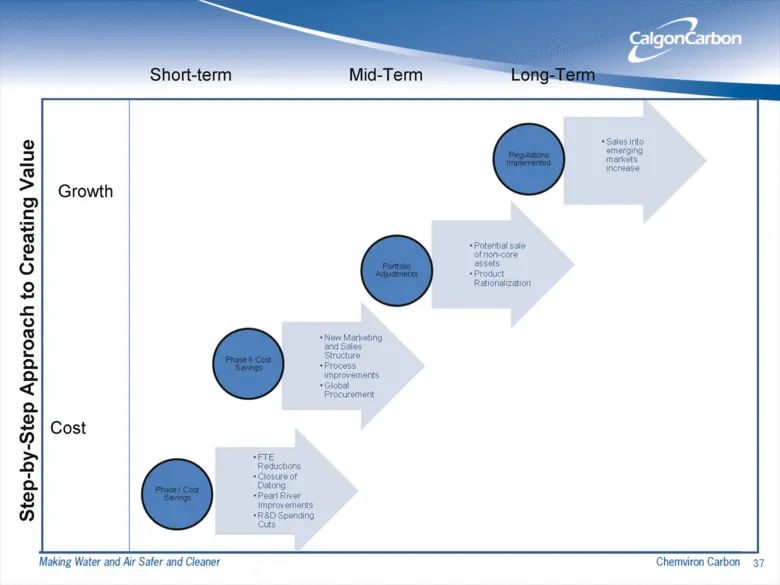
37 Cost Short-term Mid-Term Long-Term Growth Step-by-Step Approach to Creating Value
Slide 37: Thank You!
Thank You! ‘Making Water and Ar Safer and Cleaner Chemviron Carbon 38
Source: SEC EDGAR · 8-K filed Feb 27, 2013
More decks from CALGON CARBON Corp
 Merger or Acquisition (September 2017)15 slides · Sep 21, 2017
 Q2 2017 Earnings Presentation10 slides · Aug 4, 2017
 Q1 2017 Earnings Presentation11 slides · May 9, 2017
 Investor Presentation (March 2017)25 slides · Mar 13, 2017
 Q4 2016 Earnings Presentation11 slides · Feb 24, 2017
 Q3 2016 Earnings Presentation11 slides · Nov 3, 2016