National Technical Systems Inc
National Technical Systems — Sidoti & Company Semi-Annual New York Micro-Cap Conference (January 2012)
22 slides from National Technical Systems's conference presentation, Jan 9, 2012
Slide 1: National Technical Systems, Inc.
National Technical Systems, Inc. (NASDAQ: NTSC) Meeting the Growing Demand From Industry and Government for Skilled Engineering Solutions and Services January 2012 Sidoti & Company LLC Semi -Annual New York Micro-Cap Conference January 9, 2012
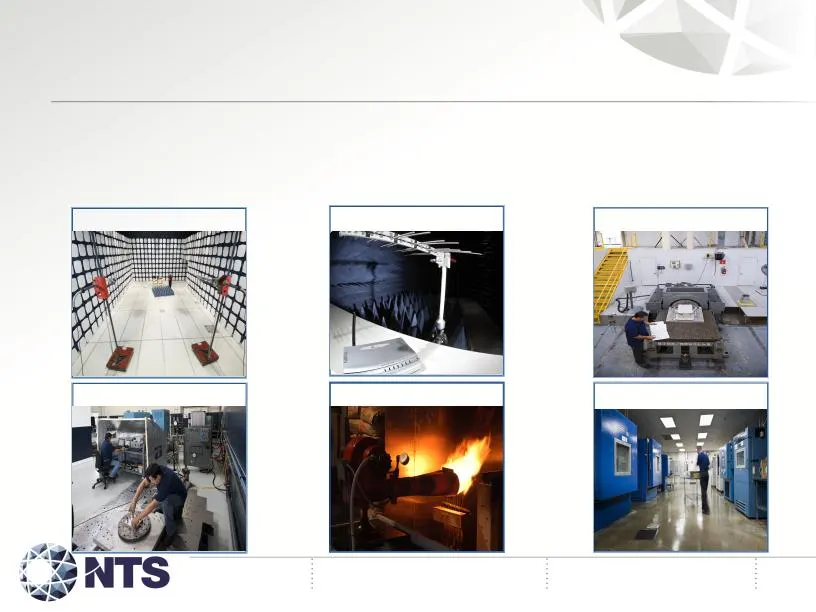
Slide 2: Largest independent provider in U.S. of advanced compliance testing and engineering services
Largest independent provider in U.S. of advanced compliance testing and engineering services to the aerospace, defense, telecommunications, automotive and high technology markets Company Overview EMC/EMI Testing Fire Testing Mechanical Testing Environmental Testing Shock Vibration Testing RF/Wireles
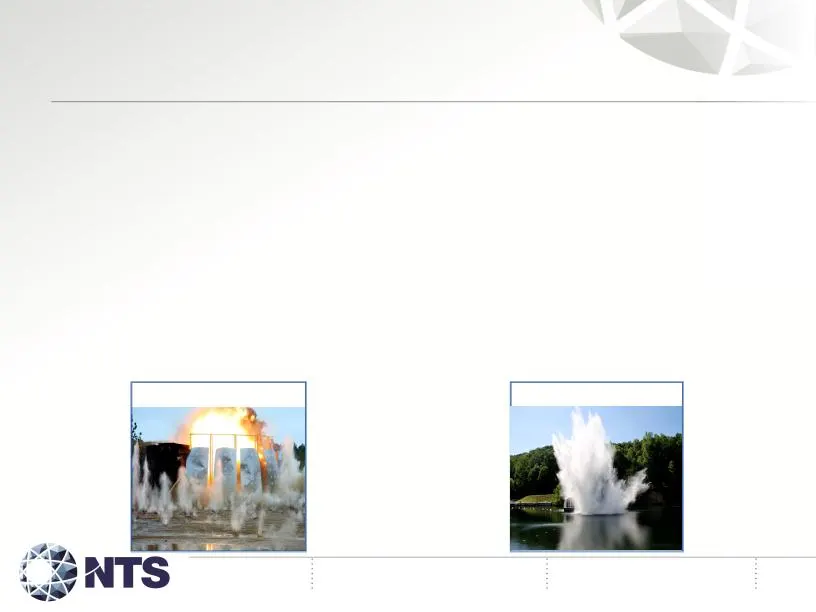
Slide 3: One-stop resource for broad range of services
Ø One-stop resource for broad range of services ü Advanced technical product testing and certification ü Certifications and data accepted in 21 countries ü Engineering services for Engineering Services Outsourcing (ESO) market ü Quality systems registration and supply chain management services ü Spe
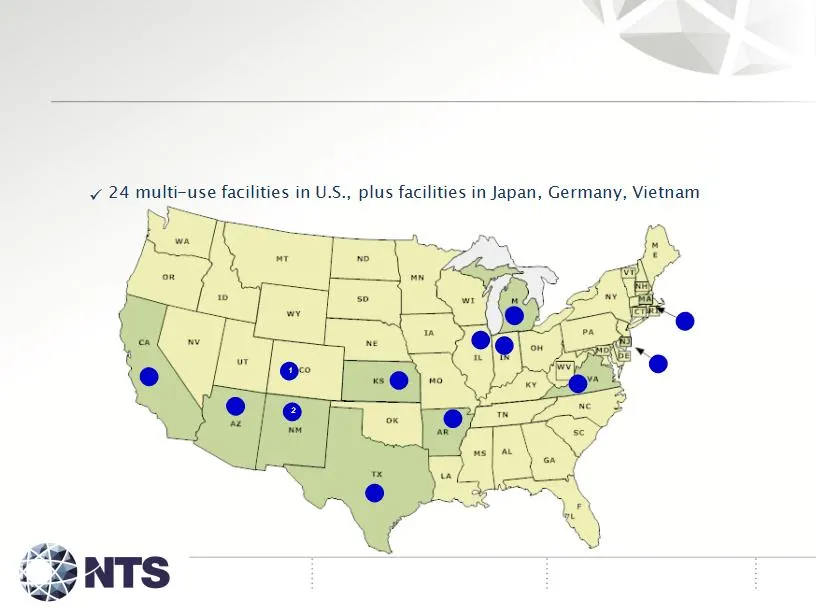
Slide 4: Headquartered in Calabasas, CA; 1,100 employees
8 1 1 1 1 1 2 1 3 1 1 Ø Headquartered in Calabasas, CA; 1,100 employees Ø Strategic locations Company Overview

Slide 5: Strong competitive position
Ø Strong competitive position ü A few large European companies ü Mostly small, private local or regional labs in U.S. ü In-house labs Ø Increasing market share Ø National sales force Ø Diversified base of 4,000+ customers ü Incudes many of the world’s largest/strongest ü Long-term relationships = co
Slide 6: Principal Customers Include
Principal Customers Include
Slide 7: Principal Industries Served
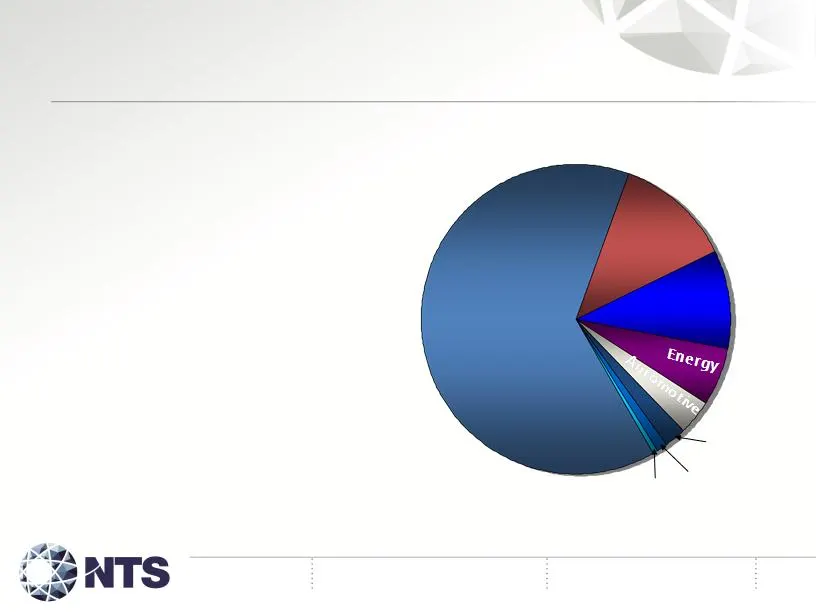
Aerospace & Defense Telecom Consumer Principal Industries Served n Aerospace and Defense n Telecommunications n Consumer n Energy n Automotive n Industrial n Medical n Other Telecom Consumer Other Other Medical Medical Industrial Industrial
Slide 8: FY 2007 - FY 2011 Financial Highlights
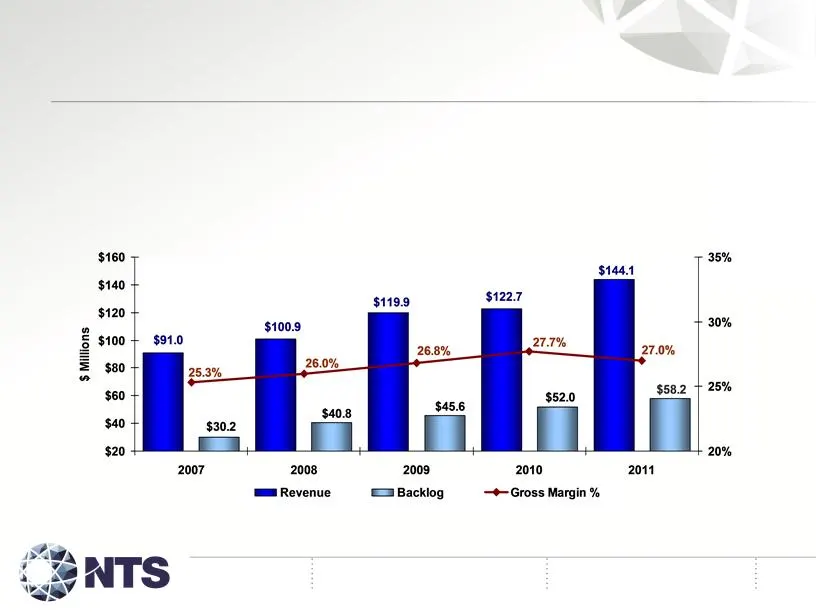
FY 2007 - FY 2011 Financial Highlights Ø FY’ 11 revenues up 58% to $144.1 million from $91.0 million in FY’ 07 Ø Backlog grew from 33% of sales in FY’ 07 to 40% in FY’11 Ø Gross margins improved from 25.3% in FY’ 07 to 27.0% in FY’ 11
Slide 9: FY 2007 - FY 2011 Financial Highlights
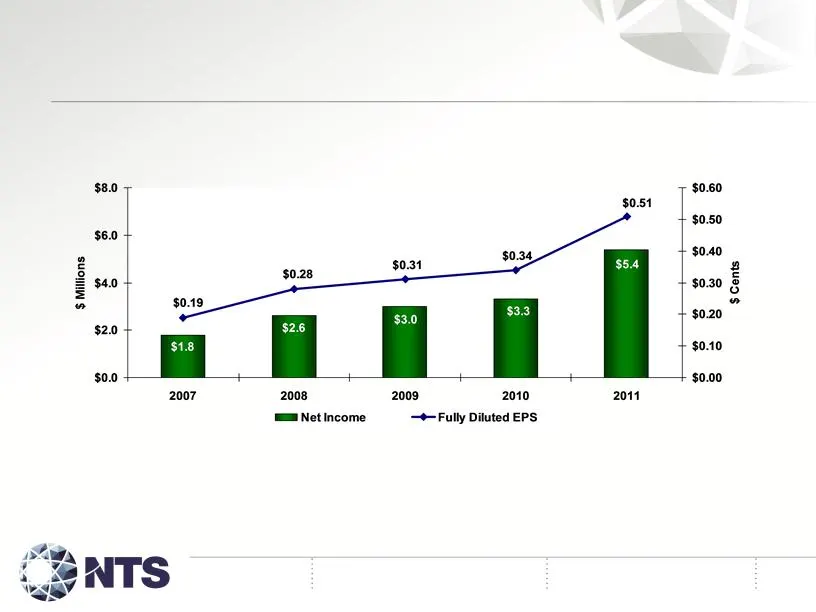
2 FY 2007 - FY 2011 Financial Highlights 1 Includes one-time $1.7 million, or $0.16 per diluted share, net of tax gain from sale of property 1 Includes one-time $1.7 million, or $0.16 per diluted share, net of tax gain from sale of property
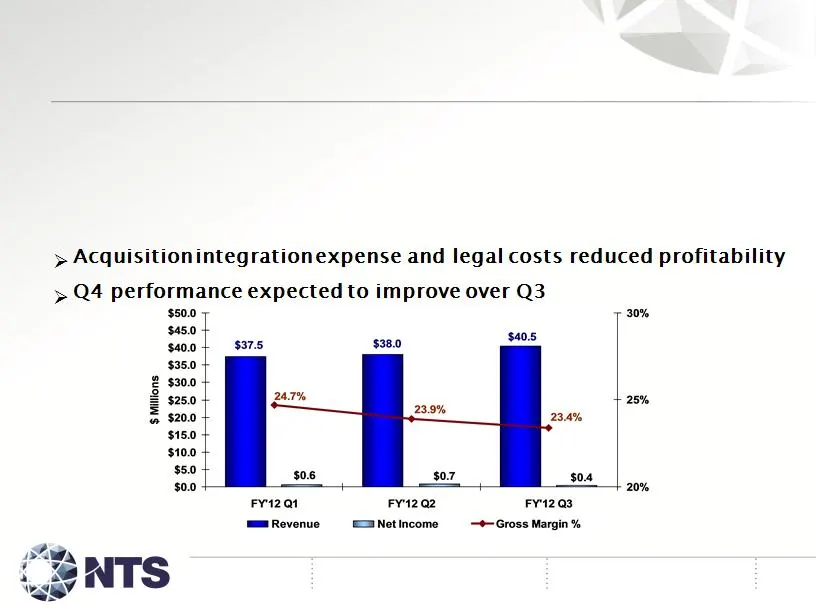
Slide 10: FY 2012 Quarterly Financial Highlights
FY 2012 Quarterly Financial Highlights Ø Revenue up due to diversification and geographic expansion initiatives, offsetting declines due to lower government spending/funding delays Ø Margin declines due in part to underutilization at some facilities and excess completion costs on a large contract 1

Slide 11: Balance Sheet Highlights - 10/31/11
Cash, cash equivalents, investments $ 11.3 million Working capital $ 32.5 million Total assets $ 151.4 million Total debt $ 50.0 million Total equity $ 65.0 million Balance Sheet Highlights - 10/31/11
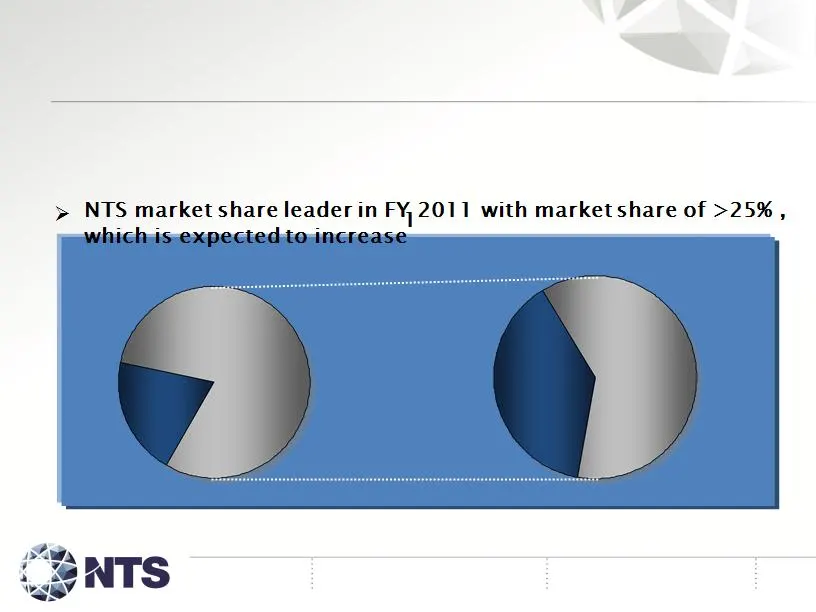
Slide 12: Laboratory Testing Market Trends in U.S.
NTS >25% NTS ~40% NTS Market Share Growth Estimate FY 2011 - FY 2015 FY 2011 FY 2015 Laboratory Testing Market Trends in U.S. Ø NTS estimates FY 2011 annual revenues in its targeted U.S. testing market segment at ~$500 to $600 million with stable growth 1 NTS >25% All Others All Others <75% <75% NTS

Slide 13: Why NTS is Approaching an Inflection Point
Ø Key market drivers - regulatory, cost-effectiveness, time-to- market ü Scarcity of qualified engineers, trend towards greater outsourcing l Engineering projects, new product development, supply chain management ü Increasing government product safety regulations ü Third party certification guidelin

Slide 14: Strategy for Growth
Ø Organic growth ü Increase market share through superior service, new offerings ü Invest in human resources and physical assets to strengthen NTS ü Expand sales and marketing program Ø Strategic acquisitions ü Acquire companies that add significant value to NTS ü Add new, innovative service offerin
Slide 15: NTS Engineering Services (ESO) Initiative
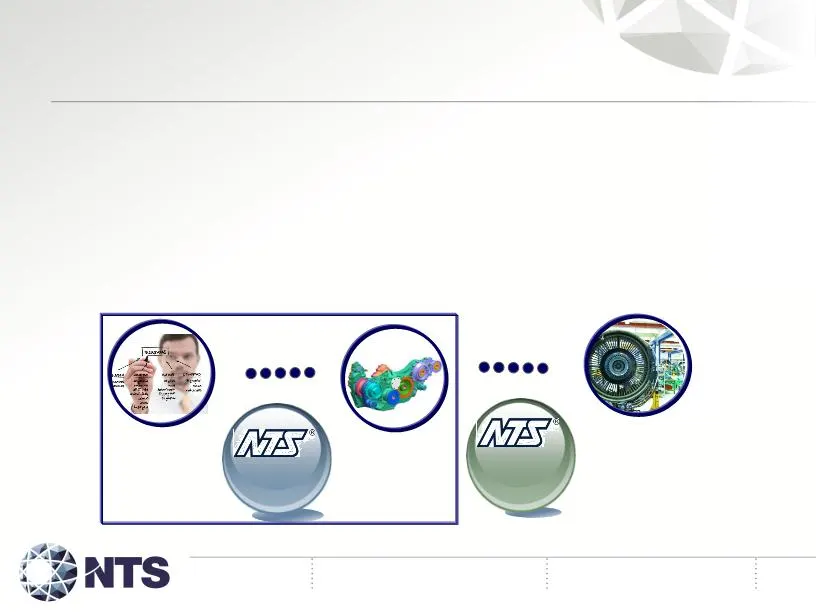
Ø ESO market is fast growing, multi-billion dollar market expected to grow at ~26% CAGR Ø NTS launched initiative in March 2009; currently doing selected design/development ESO projects; drives added testing revenue Ø Offering more Engineering Services is move up value chain ü Positions NTS to provi

Slide 16: Why Engineering Services Outsourcing?
Ø Growing source of additional revenue Ø Leverages Company’s large customer base Ø Moves NTS up the services value chain Ø Margins can increase - not a commodity business Ø Develops closer working relationships with customers Ø Drives additional NTS testing business Why Engineering Services Outsourc

Slide 17: Recent Strategic Acquisitions
Ø Chicago-based Ingenium Testing in July 2011 ü $ 12.5 million in cash, plus performance earn out ü 12 fully-automated test chambers in one of the most modern EMC/EMI testing facilities in North America ü Customer base, capabilities and services in aerospace, heavy industry, automotive markets, all

Slide 18: Recent Strategic Acquisitions
Ø Pittsfield, MA-based Lightning Technologies in Sept ü $6.0 million in cash, plus performance earn out ü Engineering services and testing laboratory specializing in lightning protection ü Customer base, capabilities and services in aerospace, construction, wind power generation markets, complements

Slide 19: Outlook
Ø Q4 FY 2012 ü Performance expected to improve from Q3 FY 2012 l Gross margins expected to increase l SG&A expected to increase due to expanded sales program Ø FY 2013 ü Revenues expected to increase to $164 million to $169 million l Expected revenues do not include any FY 2013 acquisitions ü SG&A a

Slide 20: Summary
Ø Largest independent, advanced technical testing services company in U.S. with experienced/effective management team Ø Strong competitive position with increasing market share Ø Diversified base of 4,000+ customers; international presence Ø Increasing trends towards outsourcing testing, registratio

Slide 21: Forward Looking Statements
Forward Looking Statements The content of this presentation and statements made and/or answers given to questions during this presentation that relate to future plans, events or performance are forward-looking statements that involve risks and uncertainties, including risks associated with uncertain
Slide 22: National Technical Systems, Inc.
National Technical Systems, Inc. (NASDAQ: NTSC) Meeting the Growing Demand From Industry and Government for Skilled Engineering Talent and Services January 2012 Sidoti & Company LLC Semi -Annual New York Micro-Cap Conference January 9, 2012
Source: SEC EDGAR · 8-K filed Jan 9, 2012