William Lyon Homes — Q4 2017 Earnings Presentation
26 slides from William Lyon Homes's earnings presentation, Feb 20, 2018

Slide 1: 2017 Q4 and Year-End Earnings Call
Board of Directors Meeting Q3 2017 2017 Q4 and Year-End Earnings Call February 20, 2018, 9:00 am PT Exhibit 99.3
Slide 2: Forward Looking Statements and Non-GAAP Information
Forward Looking Statements and Non-GAAP Information Certain statements contained in the Company’s press release for the three months and year ended December 31, 2017 and the accompanying comments during our conference call that are not historical information may constitute “forward-looking statement
Slide 3: Management Presenters
Management Presenters William H. Lyon Chairman of the Board and Executive Chairman Matthew R. Zaist President and Chief Executive Officer Colin T. Severn Senior Vice President and Chief Financial Officer
Slide 4: 2017 Sales Volume – Actual vs. Prior Year
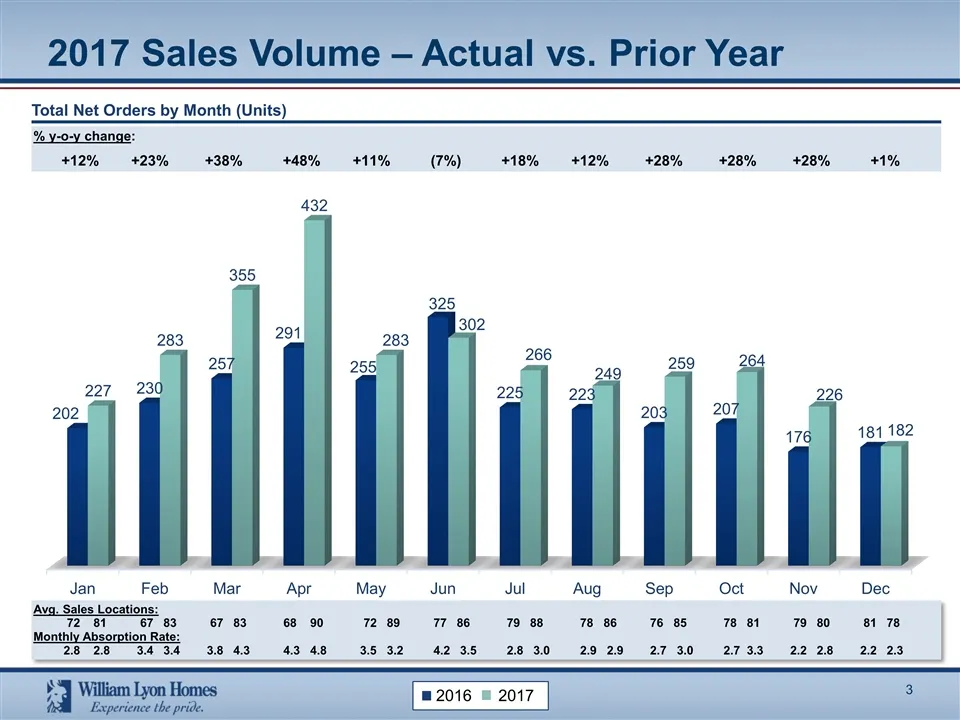
2017 Sales Volume – Actual vs. Prior Year Total Net Orders by Month (Units) % y-o-y change: +12% +23% +38% +48% +11% (7%) +18% +12% +28% +28% +28% +1% Avg. Sales Locations: 72 81 67 83 67 83 68 90 72 89 77 86 79 88 78 86 76 85 78 81 79 80 81 78 Monthly Absorption Rate: 2.8 2.8 3.4 3.4 3.8 4.3 4.3 4.
Slide 5: Consistent Significant Annual Growth
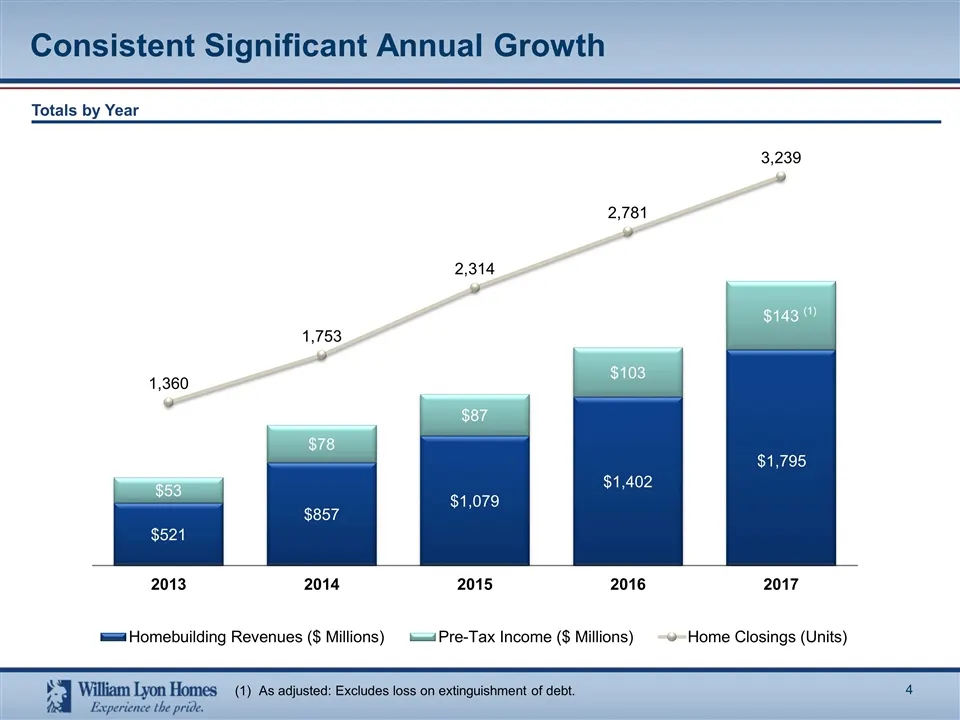
Consistent Significant Annual Growth Totals by Year (1) As adjusted: Excludes loss on extinguishment of debt.
Slide 6: Year over Year Comparisons
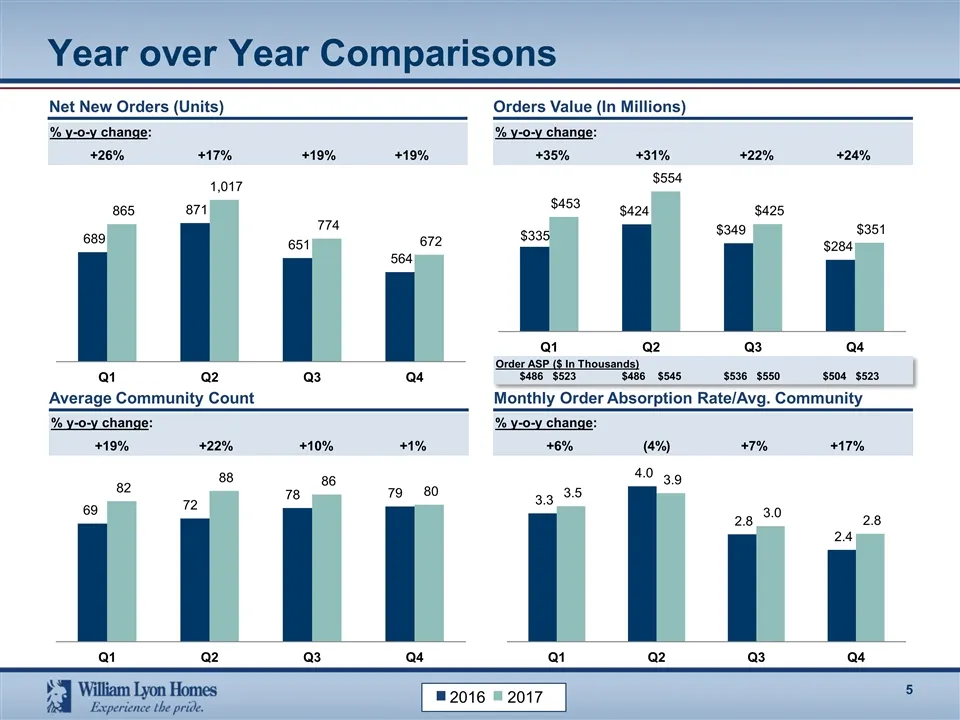
Year over Year Comparisons % y-o-y change: +26% +17% +19% +19% % y-o-y change: +19% +22% +10% +1% % y-o-y change: +6% (4%) +7% +17% Net New Orders (Units) Orders Value (In Millions) Average Community Count Monthly Order Absorption Rate/Avg. Community % y-o-y change: +35% +31% +22% +24% Order ASP ($
Slide 7: Year over Year Comparisons (continued)
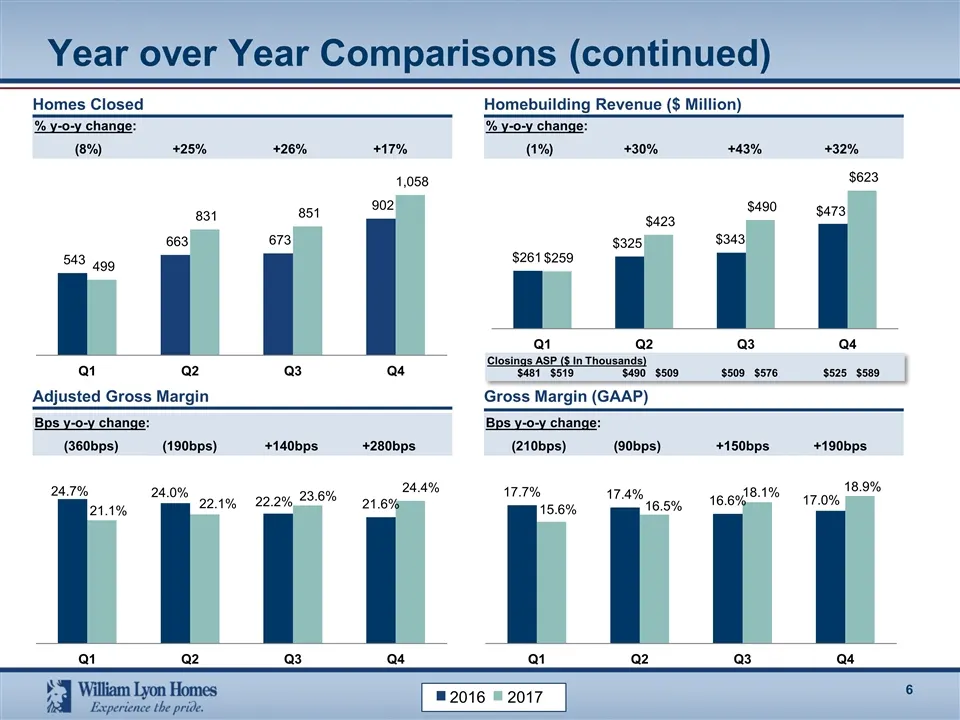
% y-o-y change: (1%) +30% +43% +32% Year over Year Comparisons (continued) % y-o-y change: (8%) +25% +26% +17% Homes Closed Homebuilding Revenue ($ Million) Bps y-o-y change: (360bps) (190bps) +140bps +280bps Bps y-o-y change: (210bps) (90bps) +150bps +190bps Adjusted Gross Margin Gross Margin (GAAP
Slide 8: 2017 Q4 and YTD Results vs. Prior-Year
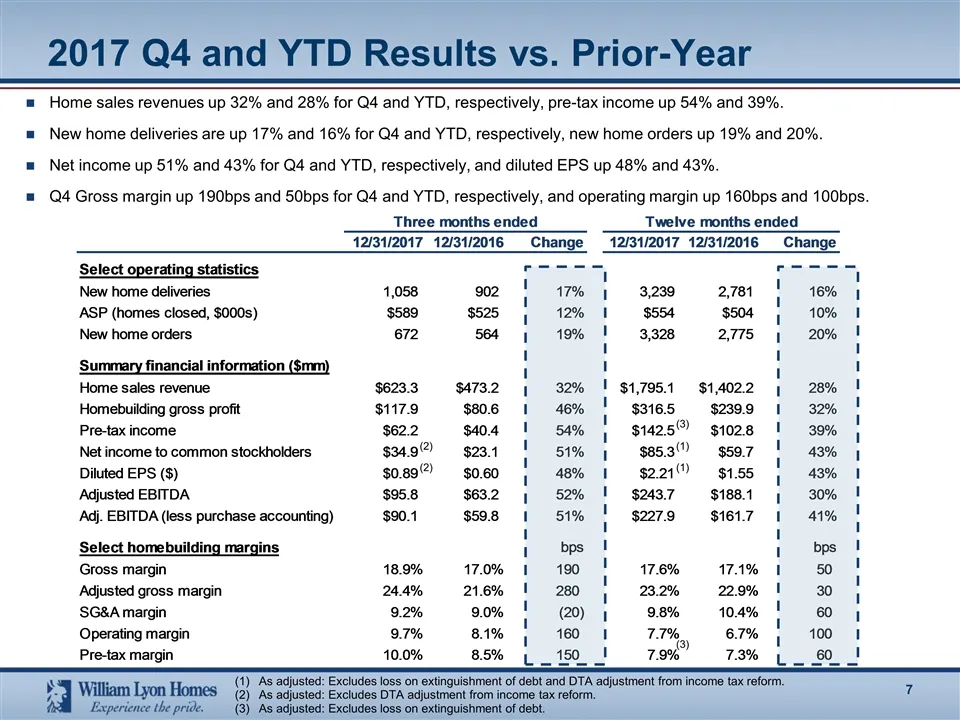
Home sales revenues up 32% and 28% for Q4 and YTD, respectively, pre-tax income up 54% and 39%. New home deliveries are up 17% and 16% for Q4 and YTD, respectively, new home orders up 19% and 20%. Net income up 51% and 43% for Q4 and YTD, respectively, and diluted EPS up 48% and 43%. Q4 Gross margin
Slide 9: Backlog Growth – Year over Year
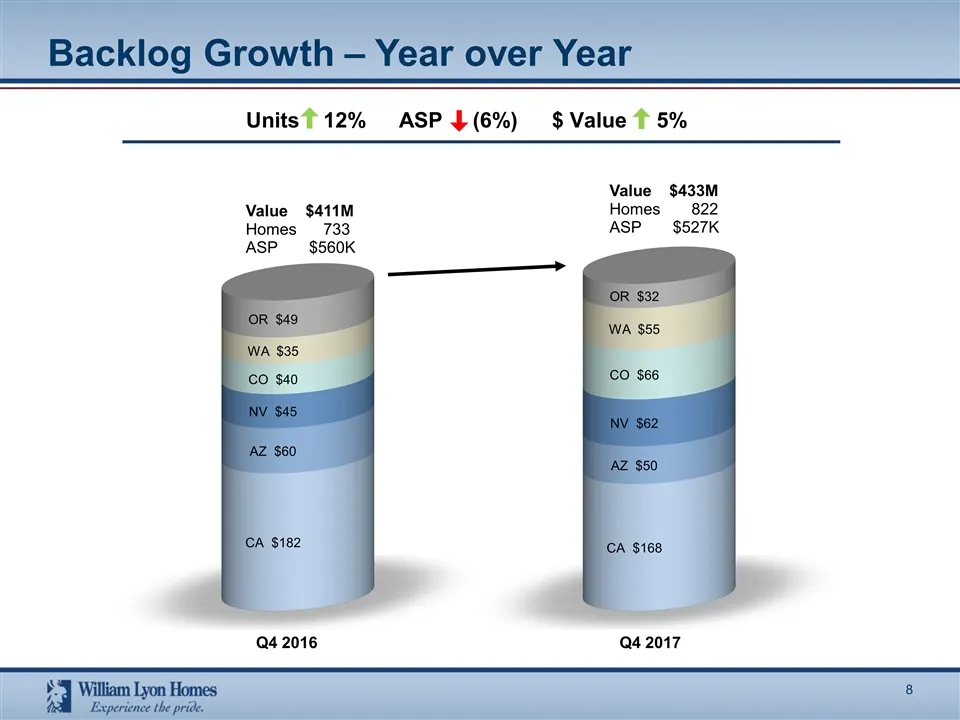
Backlog Growth – Year over Year Value $411M Homes 733 ASP $560K Q4 2016 Value $433M Homes 822 ASP $527K Units 12%ASP (6%)$ Value 5% Q4 2017
Slide 10: Backlog Conversion Rate
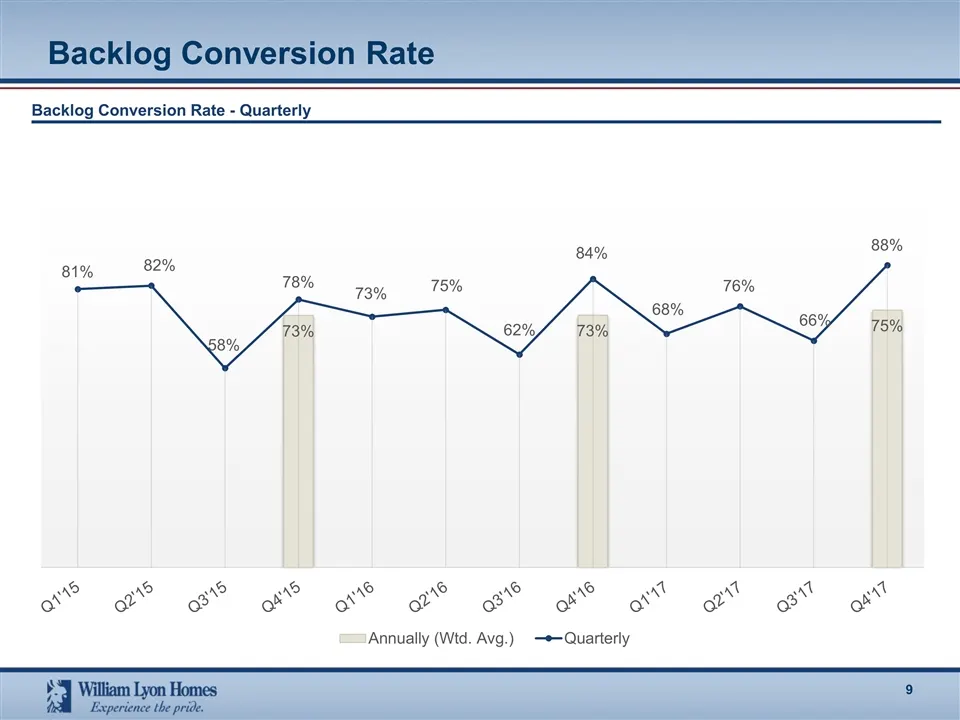
Backlog Conversion Rate Backlog Conversion Rate - Quarterly
Slide 11: Buyer Type Focus
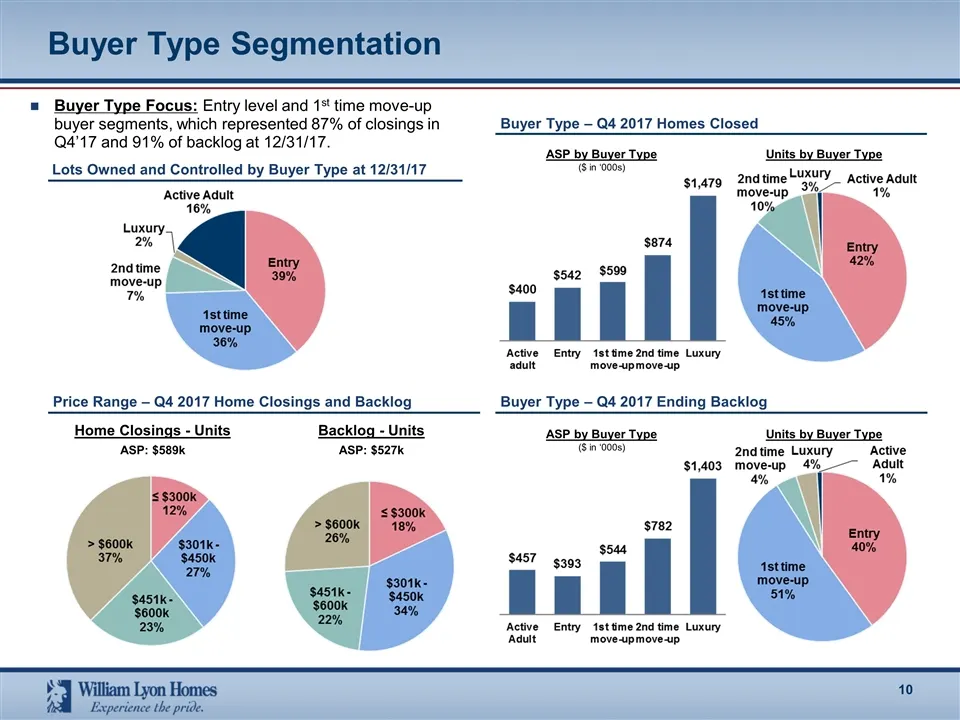
1 Buyer Type Focus: Entry level and 1st time move-up buyer segments, which represented 87% of closings in Q4’17 and 91% of backlog at 12/31/17. ASP by Buyer Type ($ in ‘000s) Units by Buyer Type Buyer Type Segmentation Buyer Type – Q4 2017 Homes Closed Price Range – Q4 2017 Home Closings and Backlog
Slide 12: Strong New Order Growth – Dollars Trailing Twelve Months
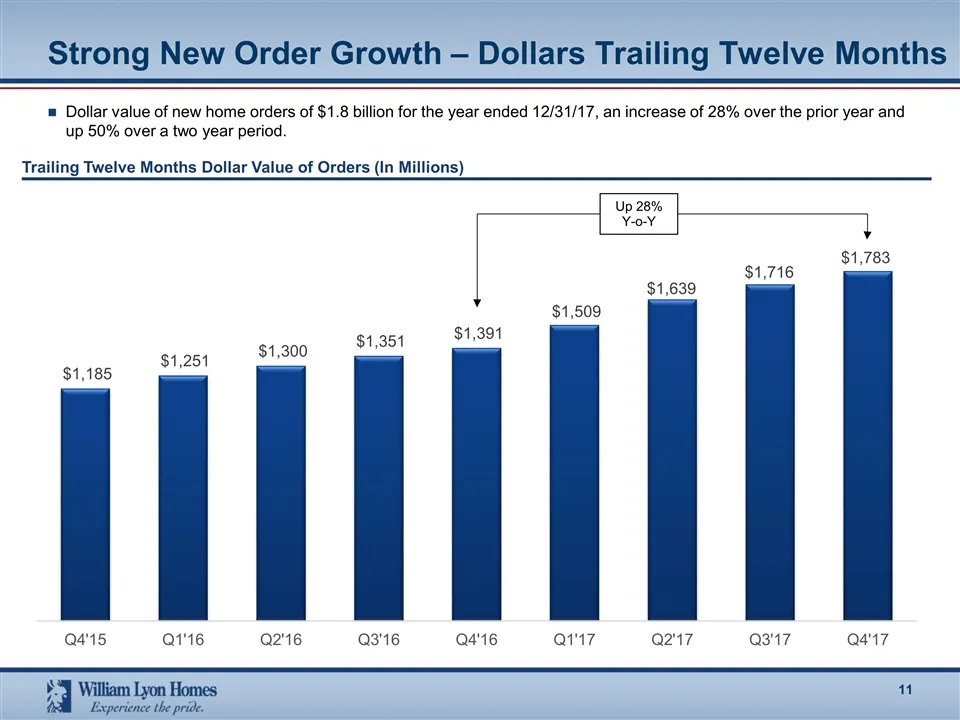
Strong New Order Growth – Dollars Trailing Twelve Months Dollar value of new home orders of $1.8 billion for the year ended 12/31/17, an increase of 28% over the prior year and up 50% over a two year period. Up 28% Y-o-Y Trailing Twelve Months Dollar Value of Orders (In Millions)
Slide 13: Growth and Operating Leverage – Trailing Twelve Months
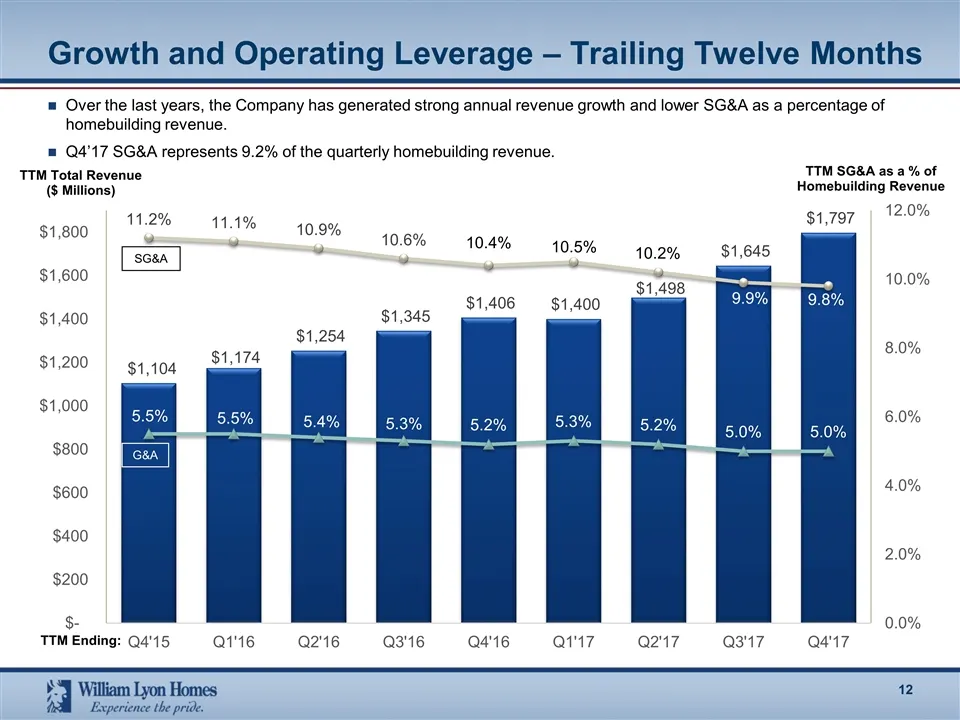
Growth and Operating Leverage – Trailing Twelve Months Over the last years, the Company has generated strong annual revenue growth and lower SG&A as a percentage of homebuilding revenue. Q4’17 SG&A represents 9.2% of the quarterly homebuilding revenue. TTM Total Revenue ($ Millions) TTM Ending: TTM
Slide 14: Continued Growth and Diversification Through Monetization of High Quality Land Positions
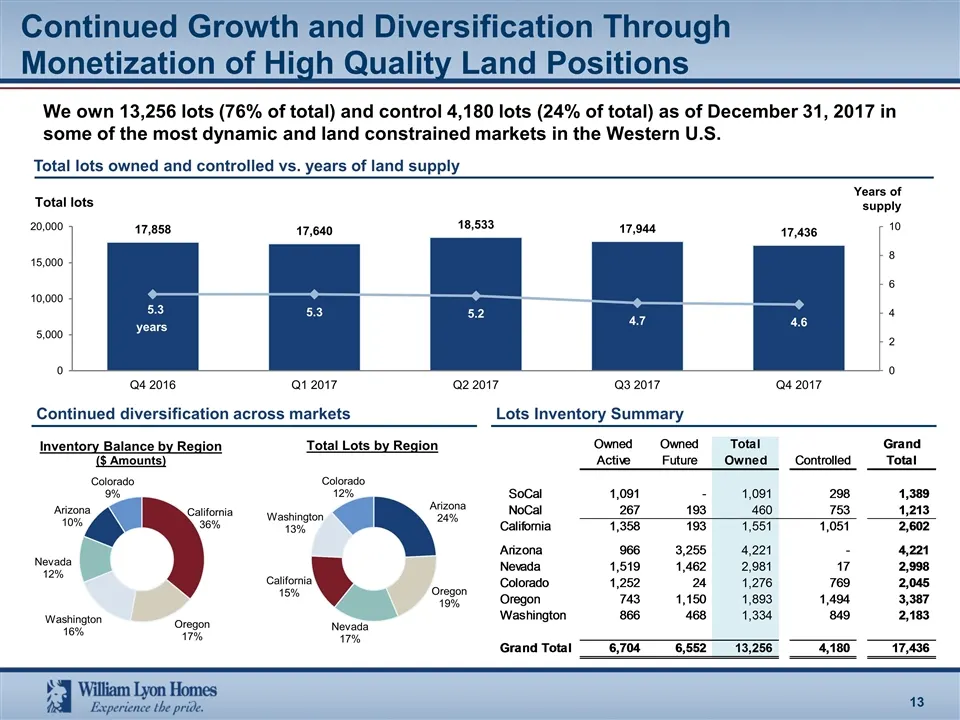
Continued Growth and Diversification Through Monetization of High Quality Land Positions Total lots owned and controlled vs. years of land supply Inventory Balance by Region ($ Amounts) Continued diversification across markets Lots Inventory Summary We own 13,256 lots (76% of total) and control 4,18
Slide 15: Acquisition of RSI Communities
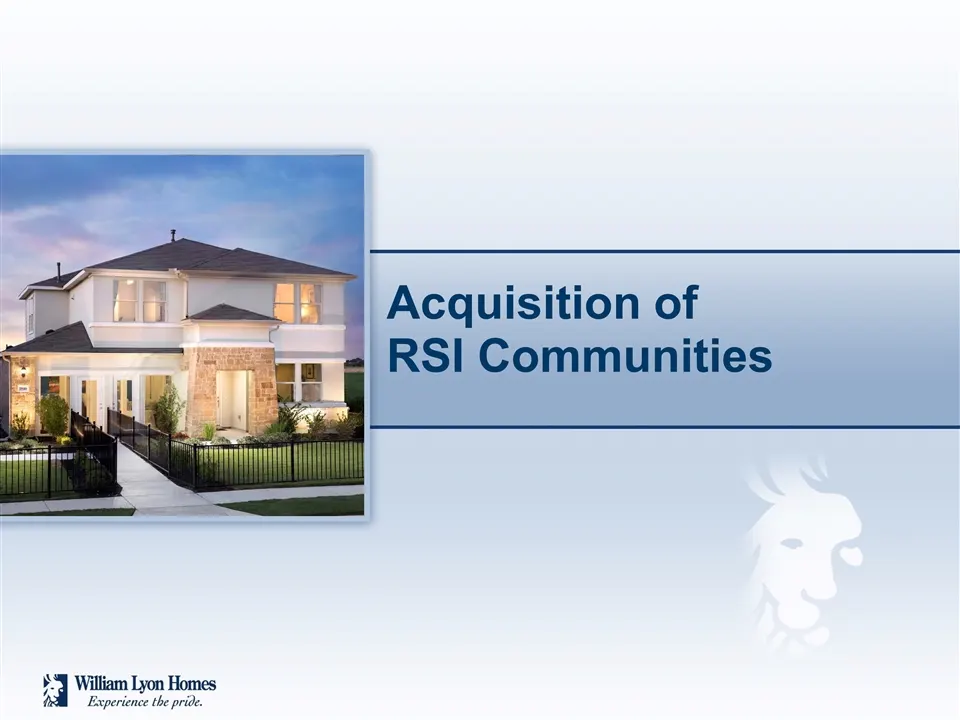
Acquisition of RSI Communities
Slide 16: Transaction Overview
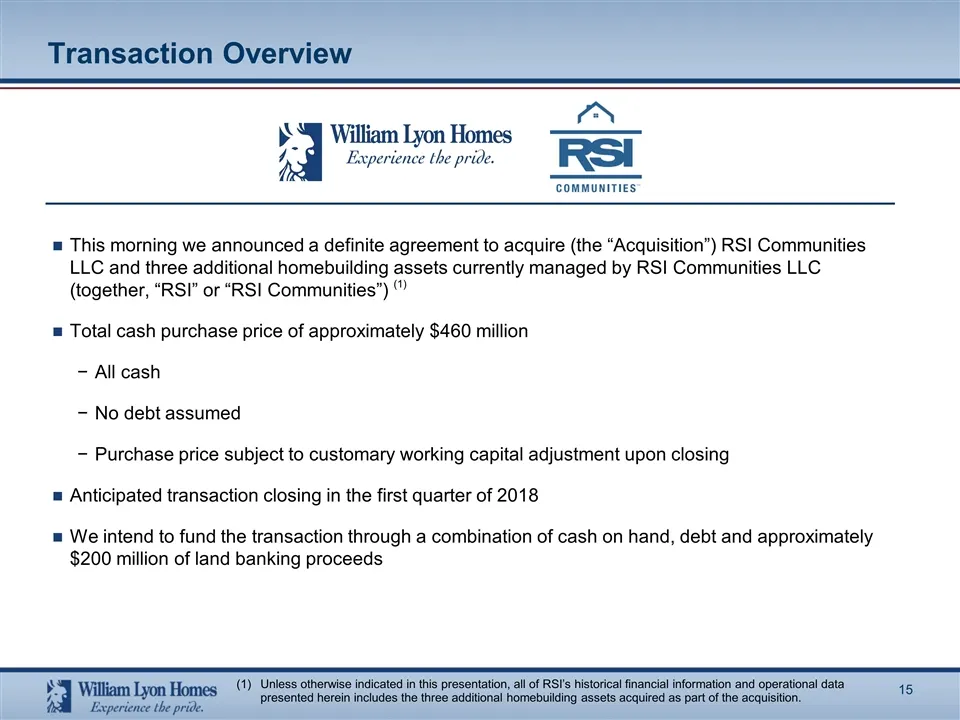
Transaction Overview This morning we announced a definite agreement to acquire (the “Acquisition”) RSI Communities LLC and three additional homebuilding assets currently managed by RSI Communities LLC (together, “RSI” or “RSI Communities”) Total cash purchase price of approximately $460 million All
Slide 17: Strategic Rationale for RSI Communities Acquisition
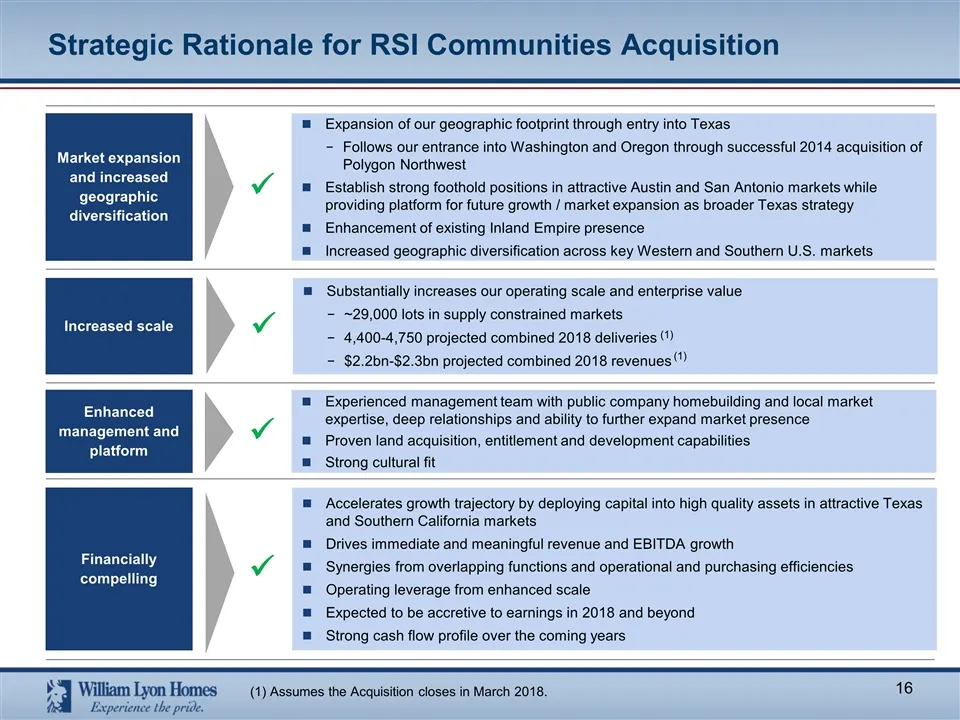
Strategic Rationale for RSI Communities Acquisition Market expansion and increased geographic diversification Expansion of our geographic footprint through entry into Texas Follows our entrance into Washington and Oregon through successful 2014 acquisition of Polygon Northwest Establish strong footh
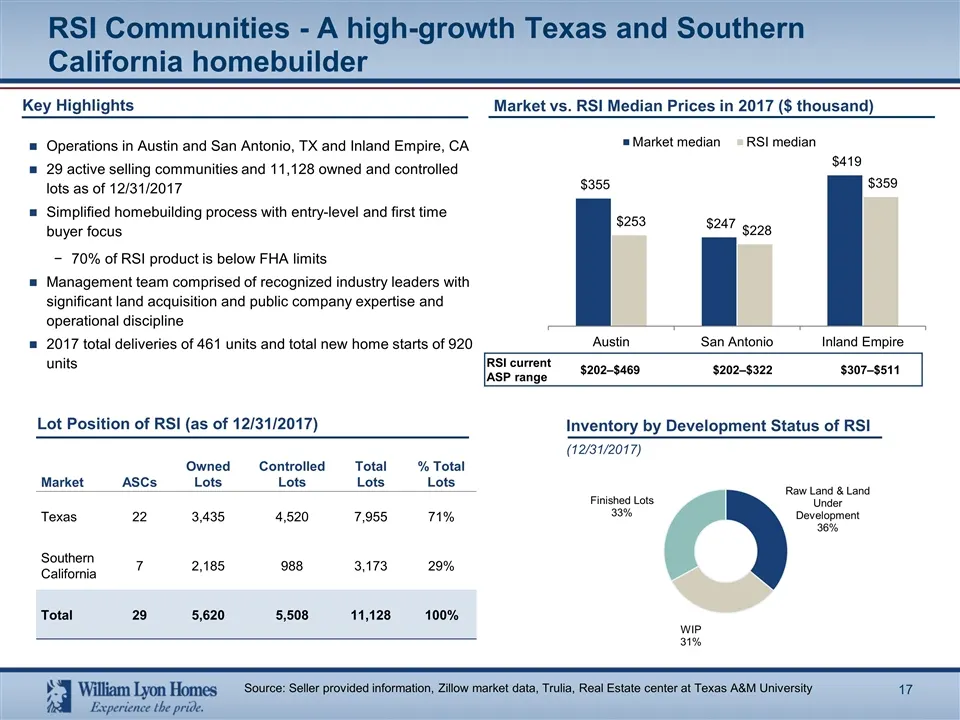
Slide 18: RSI Communities - A high-growth Texas and Southern California homebuilder
RSI Communities - A high-growth Texas and Southern California homebuilder Lot Position of RSI (as of 12/31/2017) Key Highlights Operations in Austin and San Antonio, TX and Inland Empire, CA 29 active selling communities and 11,128 owned and controlled lots as of 12/31/2017 Simplified homebuilding p
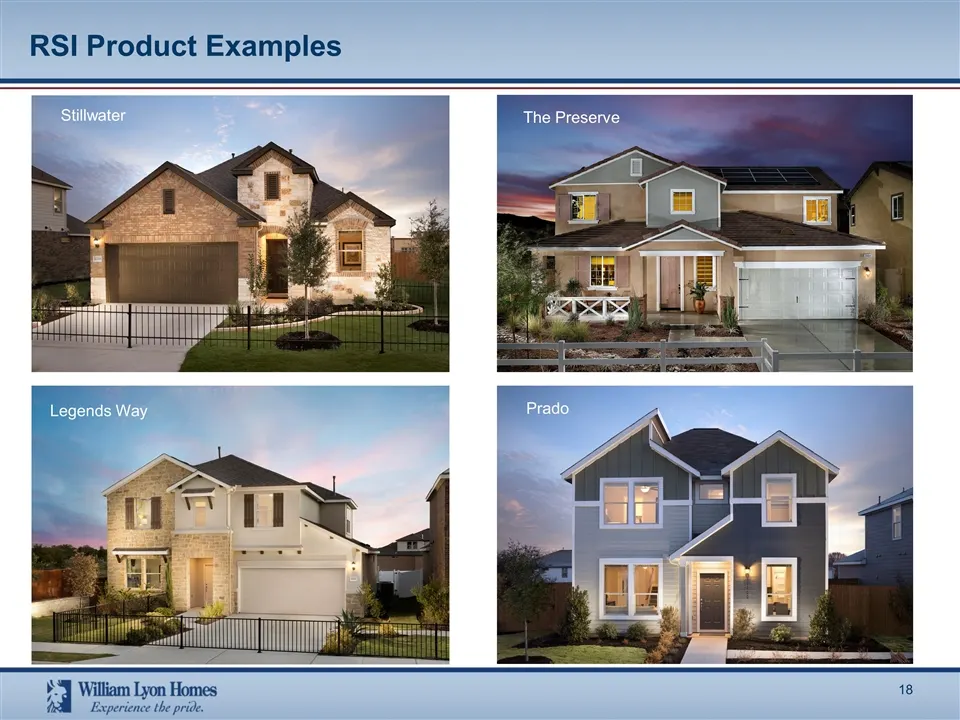
Slide 19: RSI Product Examples
RSI Product Examples The Preserve Pinehurst Willow Creek - Angelina Stillwater Legends Way Prado
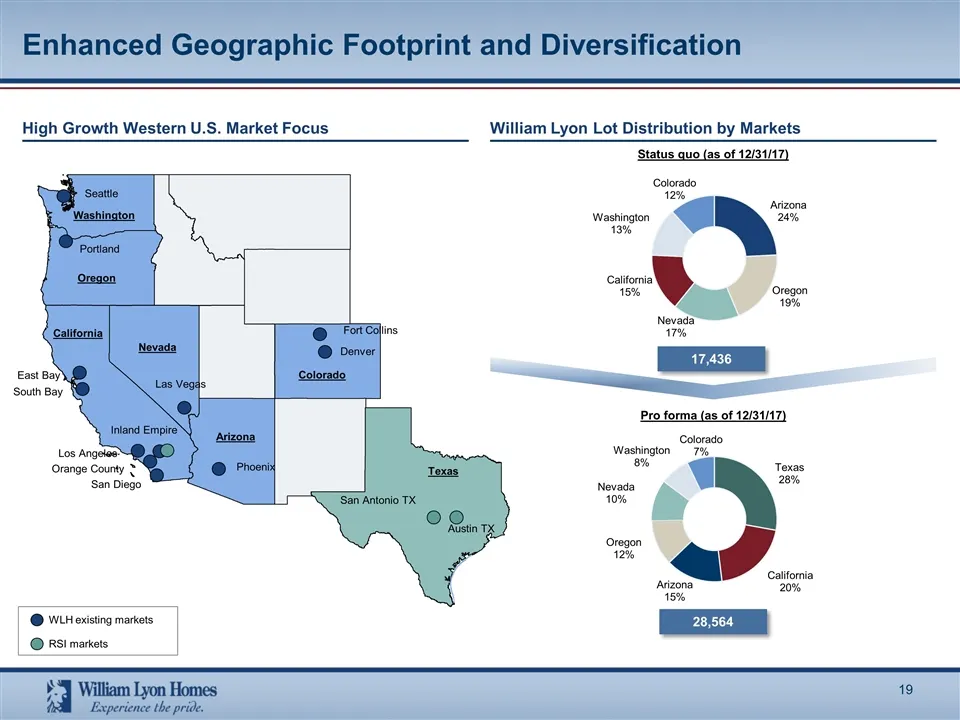
Slide 20: Enhanced Geographic Footprint and Diversification
Enhanced Geographic Footprint and Diversification High Growth Western U.S. Market Focus WLH existing markets RSI markets Seattle Portland East Bay South Bay Inland Empire Los Angeles Orange County San Diego Washington Oregon California Arizona Texas Colorado Fort Collins Denver Las Vegas Phoenix Aus
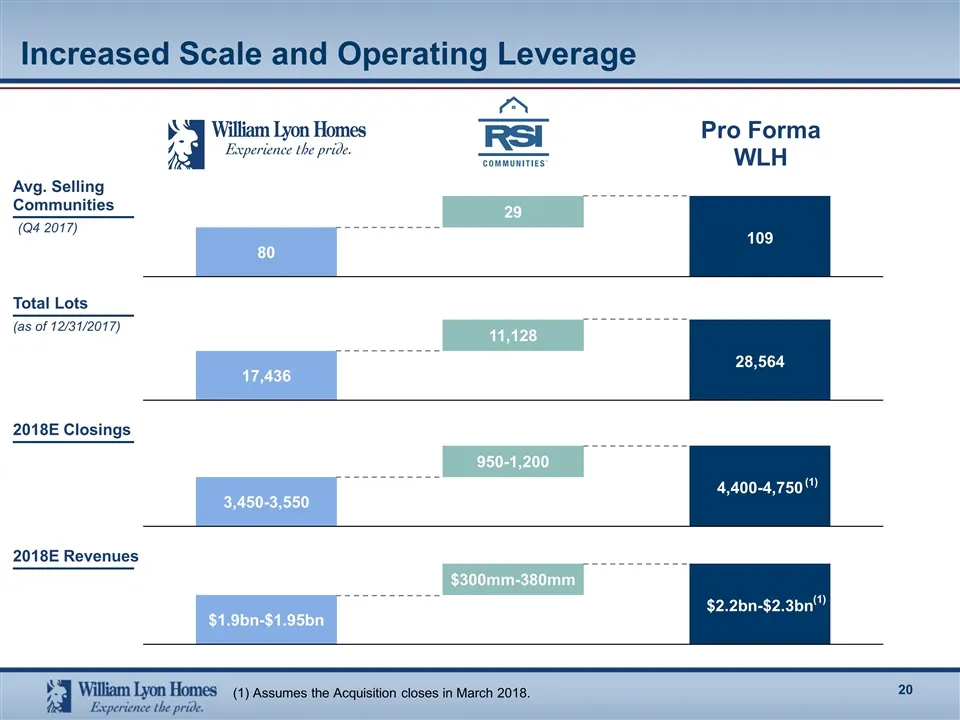
Slide 21: Increased Scale and Operating Leverage
Increased Scale and Operating Leverage Avg. Selling Communities 2018E Closings 2018E Revenues Total Lots (as of 12/31/2017) Pro Forma WLH (Q4 2017) (1) (1) (1) Assumes the Acquisition closes in March 2018.
Slide 22: Conclusion
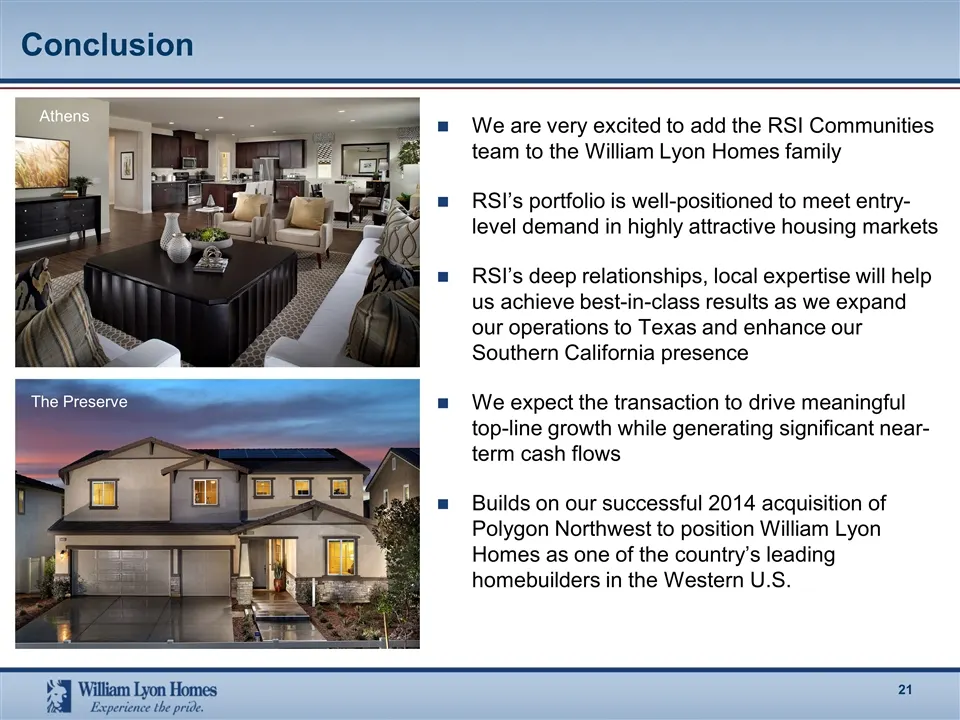
Conclusion We are very excited to add the RSI Communities team to the William Lyon Homes family RSI’s portfolio is well-positioned to meet entry-level demand in highly attractive housing markets RSI’s deep relationships, local expertise will help us achieve best-in-class results as we expand our ope
Slide 23: Ay ies Leen Hone
Ay ies Leen Hone xe the pride.
Slide 24: Adjusted EBITDA
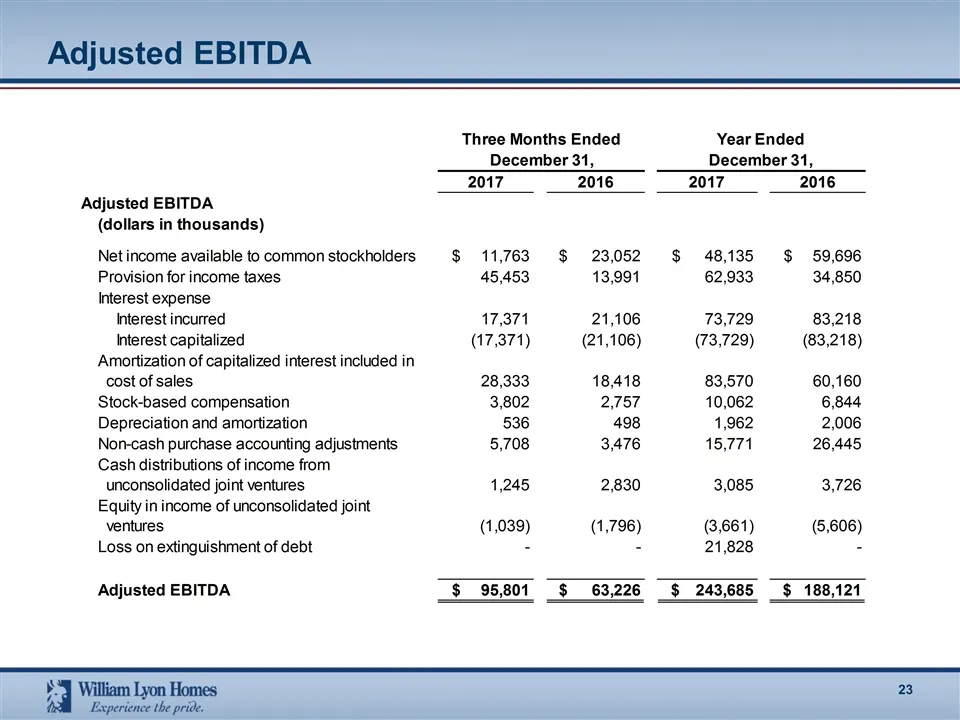
Adjusted EBITDA (dollars in thousands) Net income available to common stockholders Provision for income taxes Interest expense interest incurred interest capitalized Amortization of capitalized interest included in f sales Stock-based compensation Depreciation and amortization purchase accounting ad
Slide 25: Adjusted Homebuilding Gross Margin
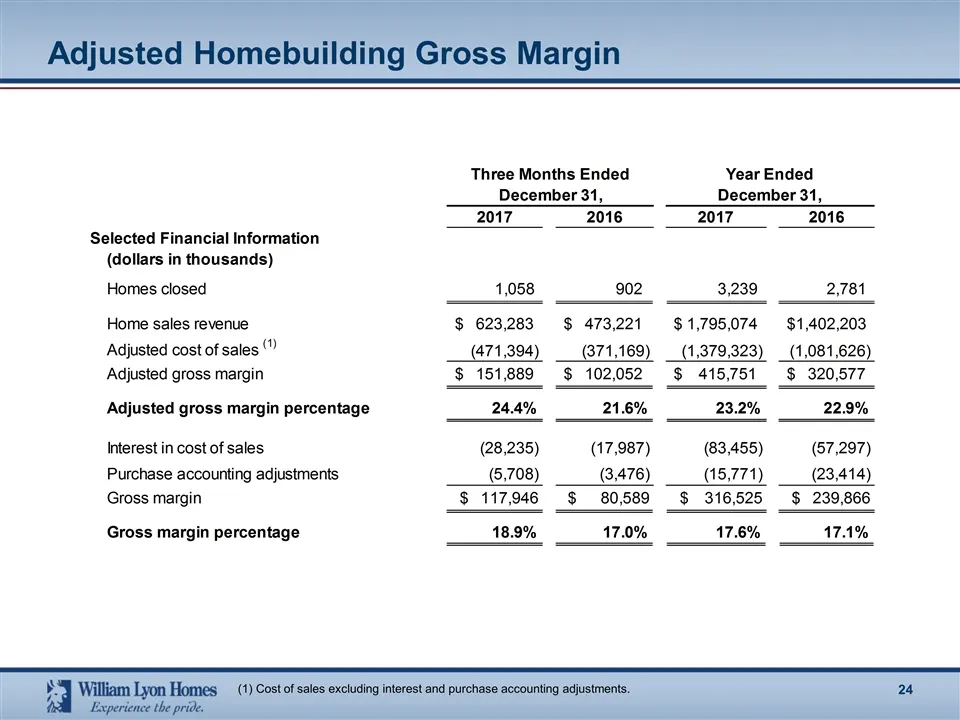
Adjusted Homebuilding Gross Margin (1) Cost of sales excluding interest and purchase accounting adjustments.
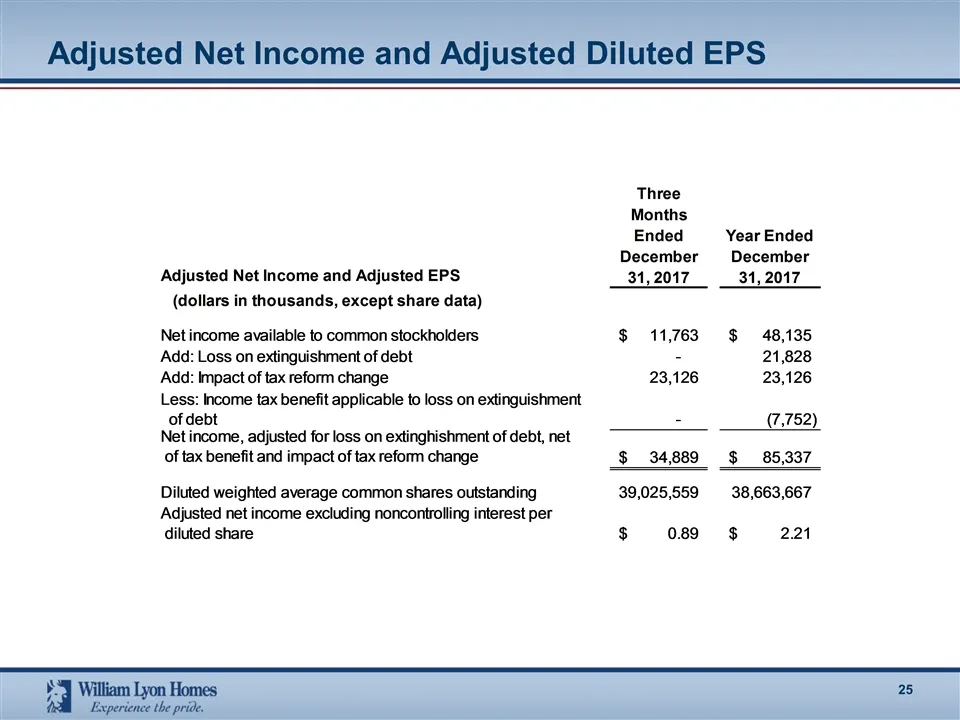
Slide 26: Adjusted Net Income and Adjusted Diluted EPS
Adjusted Net Income and Adjusted Diluted EPS
Source: SEC EDGAR · 8-K filed Feb 20, 2018
More decks from William Lyon Homes
 Merger or Acquisition (November 2019)18 slides · Nov 6, 2019
 Q2 2019 Earnings Presentation15 slides · Aug 1, 2019
 Q1 2019 Earnings Presentation14 slides · May 2, 2019
 Q4 2018 Earnings Presentation18 slides · Feb 14, 2019
 Q3 2018 Earnings Presentation17 slides · Oct 30, 2018
 2018 Zelman Housing Summit31 slides · Sep 27, 2018