State Bank Financial Corporation
State Bank Financial — 2014 Gulf South Bank Conference
19 slides from State Bank Financial's conference presentation, May 12, 2014
Slide 1: State Bank Financial Corporation 2014 Gulf South Bank Conference
State Bank Financial Corporation 2014 Gulf South Bank Conference Joe Evans – Chairman and CEO Tom Callicutt – Executive Vice President and CFO May 2014
Slide 2: Cautionary Note Regarding Forward-Looking Statements
2 Cautionary Note Regarding Forward-Looking Statements Certain statements contained in this earnings deck that are not statements of historical fact are forward-looking statements. These forward-looking statements, which are based on certain assumptions and describe our future plans, strategies and
Slide 3: State Bank Financial Corporation Profile
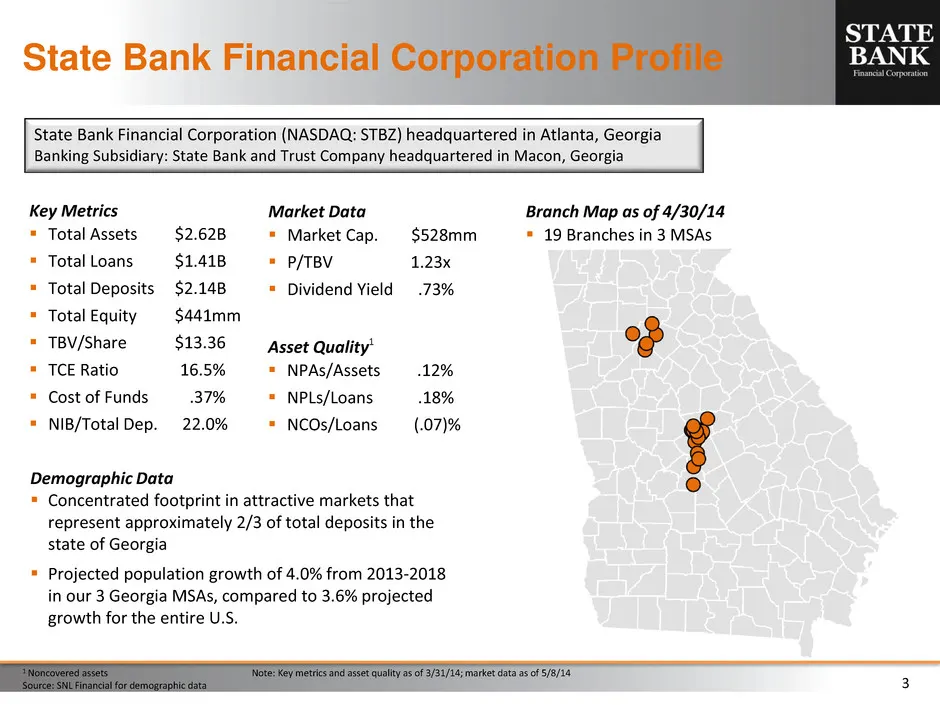
3 State Bank Financial Corporation Profile 1 Noncovered assets Note: Key metrics and asset quality as of 3/31/14; market data as of 5/8/14 Source: SNL Financial for demographic data State Bank Financial Corporation (NASDAQ: STBZ) headquartered in Atlanta, Georgia Banking Subsidiary: State Bank and T
Slide 4: Efficient Network in Attractive Markets
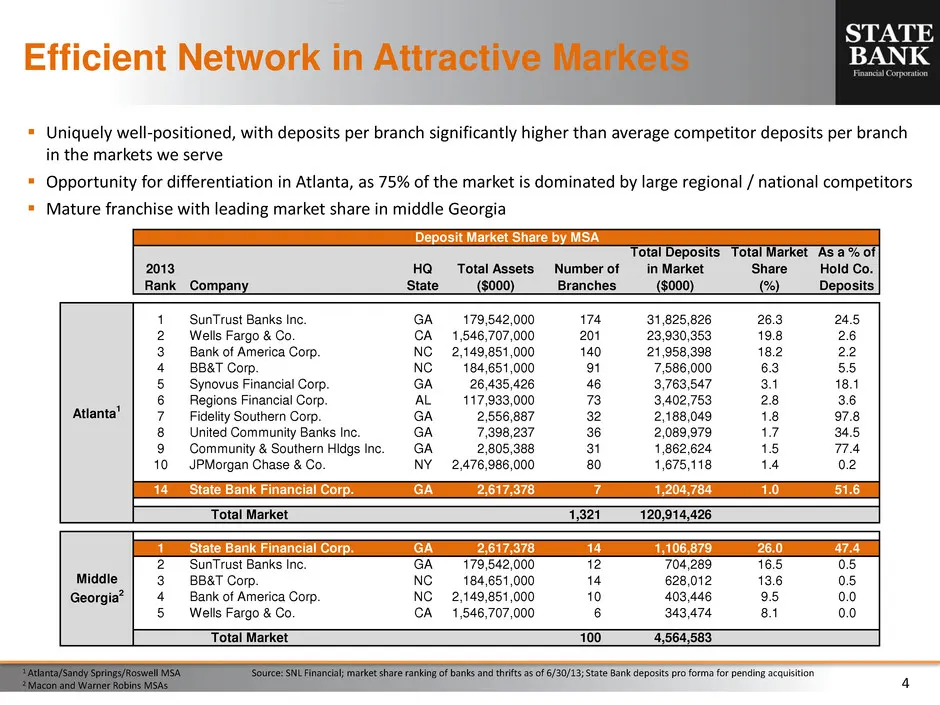
4 Efficient Network in Attractive Markets Uniquely well-positioned, with deposits per branch significantly higher than average competitor deposits per branch in the markets we serve Opportunity for differentiation in Atlanta, as 75% of the market is dominated by large regional / national competi
Slide 5: Management Depth
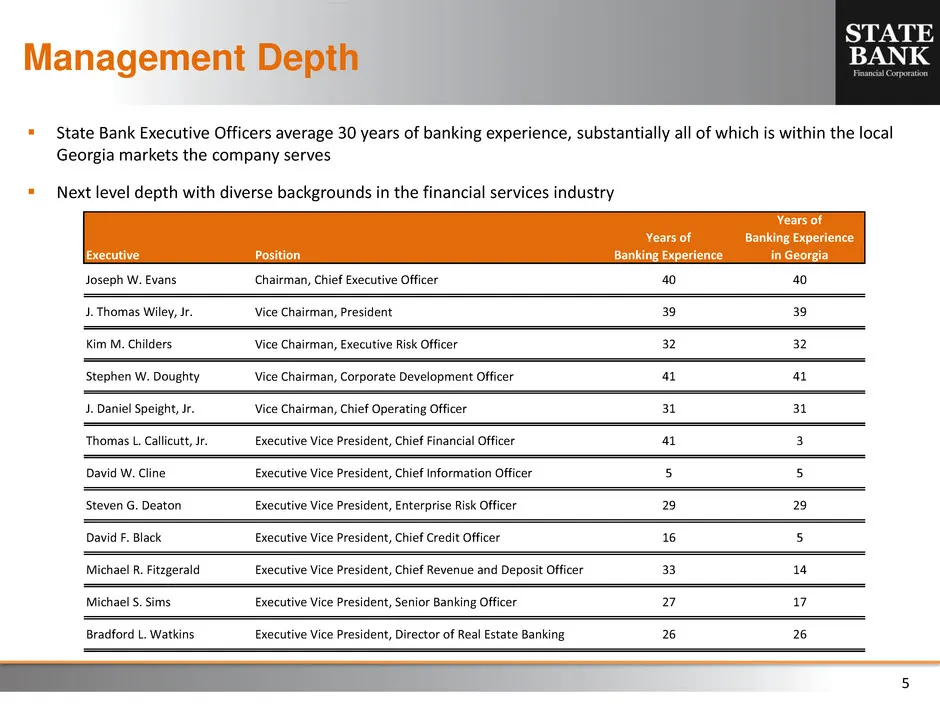
5 Management Depth State Bank Executive Officers average 30 years of banking experience, substantially all of which is within the local Georgia markets the company serves Next level depth with diverse backgrounds in the financial services industry Executive Position Years of Banking Experience Y
Slide 6: Bank of Atlanta Transaction Rationale
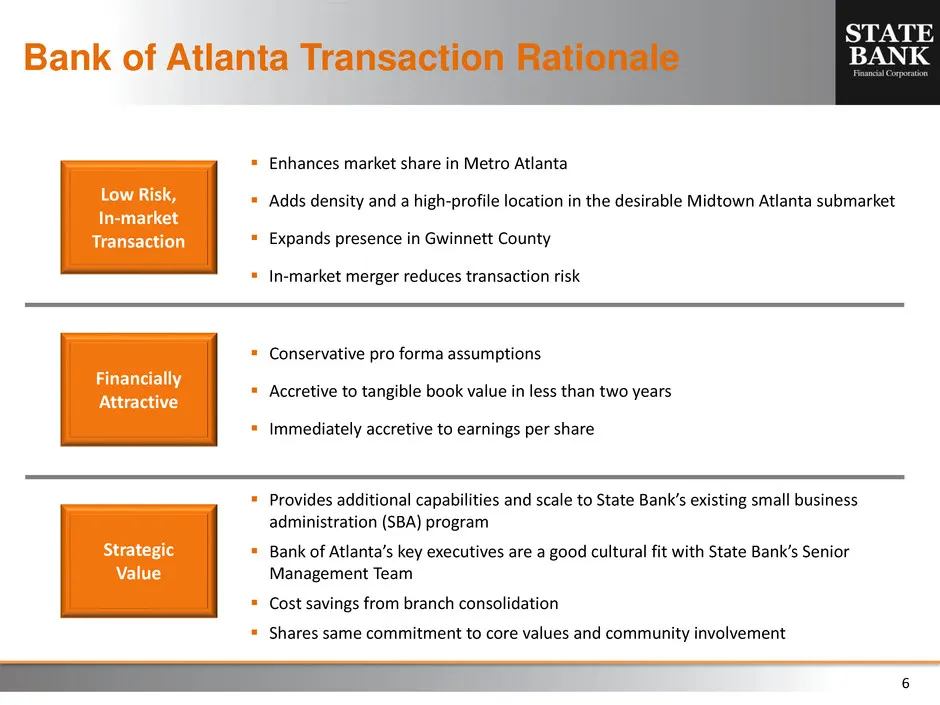
6 Bank of Atlanta Transaction Rationale Financially Attractive Strategic Value Conservative pro forma assumptions Accretive to tangible book value in less than two years Immediately accretive to earnings per share Provides additional capabilities and scale to State Bank’s existing small busi
Slide 7: Bank of Atlanta Transaction Terms
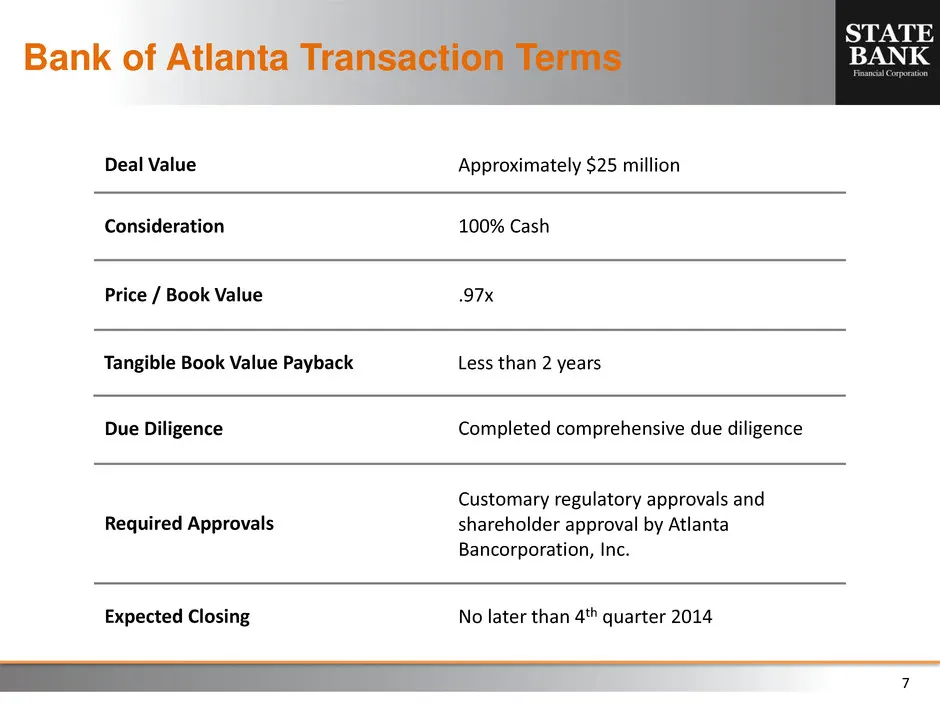
7 Bank of Atlanta Transaction Terms Deal Value Price / Book Value Required Approvals Consideration Expected Closing Approximately $25 million .97x Customary regulatory approvals and shareholder approval by Atlanta Bancorporation, Inc. 100% Cash No later than 4th quarter 2014 Due Diligence Completed
Slide 8: Bank of Atlanta Overview
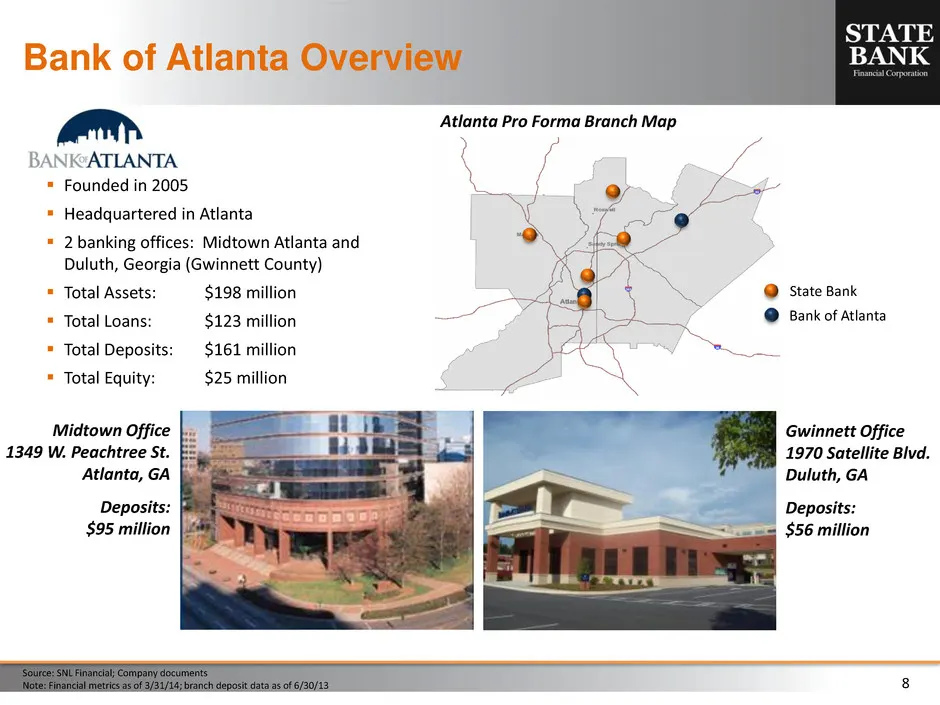
8 Bank of Atlanta Overview Founded in 2005 Headquartered in Atlanta 2 banking offices: Midtown Atlanta and Duluth, Georgia (Gwinnett County) Total Assets: $198 million Total Loans: $123 million Total Deposits: $161 million Total Equity: $25 million Gwinnett Office 1970 Satellite Blvd.
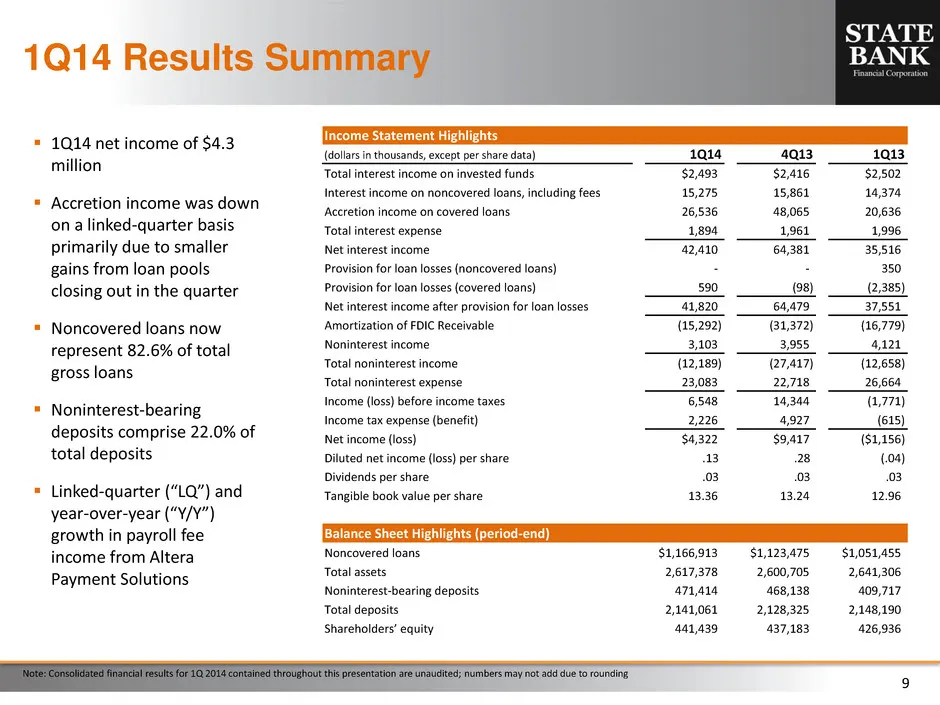
Slide 9: 1Q14 Results Summary
9 1Q14 net income of $4.3 million Accretion income was down on a linked-quarter basis primarily due to smaller gains from loan pools closing out in the quarter Noncovered loans now represent 82.6% of total gross loans Noninterest-bearing deposits comprise 22.0% of total deposits Linked-qua
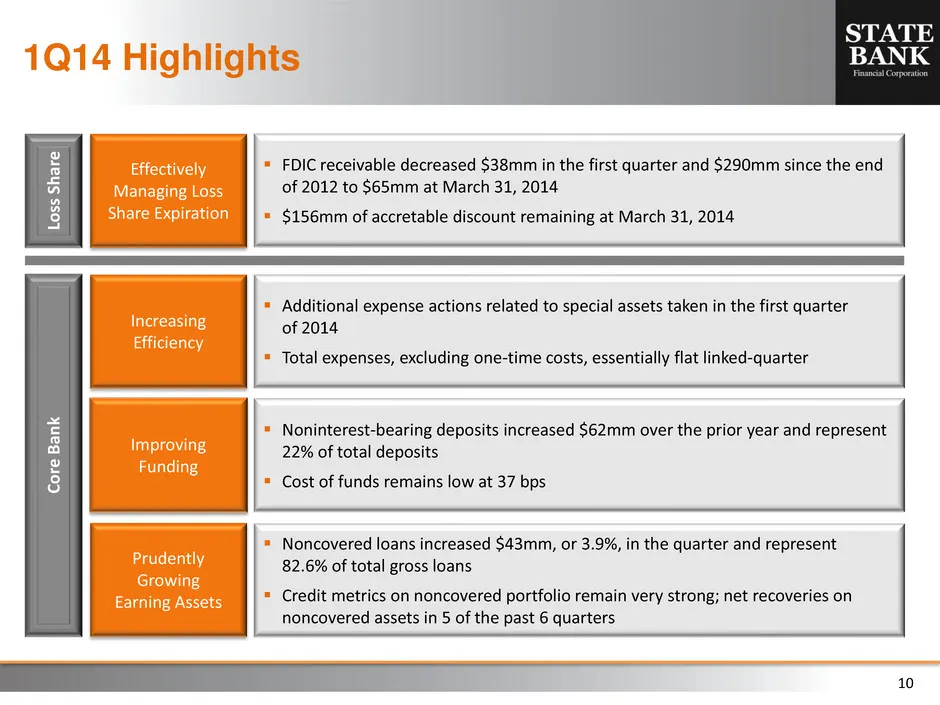
Slide 10: 1Q14 Highlights
10 1Q14 Highlights Increasing Efficiency Improving Funding Prudently Growing Earning Assets Additional expense actions related to special assets taken in the first quarter of 2014 Total expenses, excluding one-time costs, essentially flat linked-quarter Noninterest-bearing deposits increased $
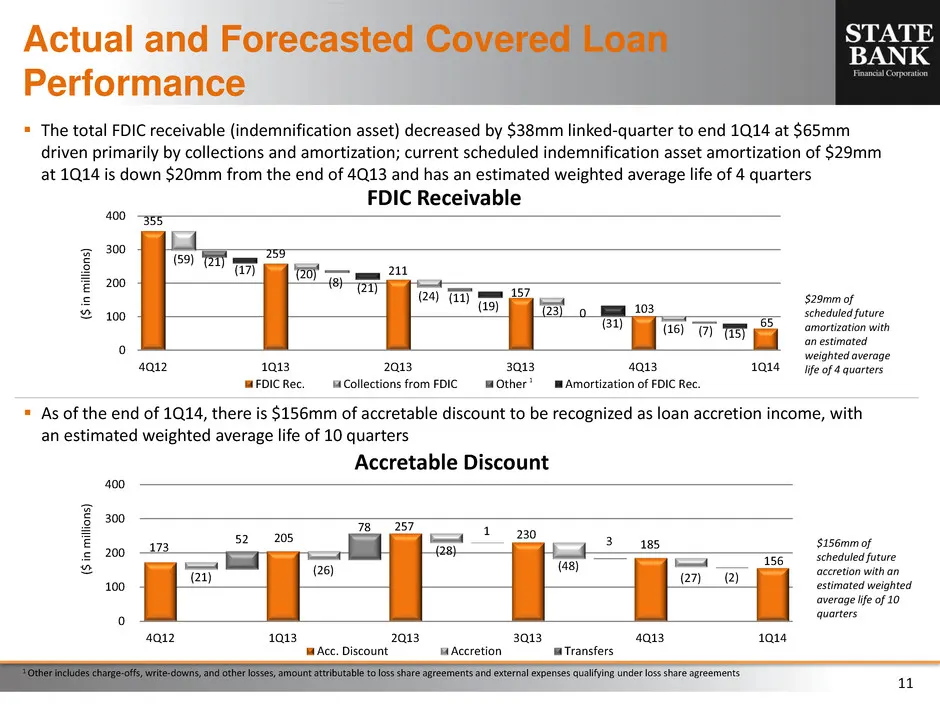
Slide 11: FDIC Receivable and Covered Loan Performance
11 355 259 211 157 103 65 (59) (20) (24) (23) (16) (21) (8) (11) 0 (7) (17) (21) (19) (31) (15) 0 100 200 300 400 4Q12 1Q13 2Q13 3Q13 4Q13 1Q14 FDIC Receivable FDIC Rec. Collections from FDIC Other Amortization of FDIC Rec. The total FDIC receivable (indemnification asset) decreased by $38mm linke
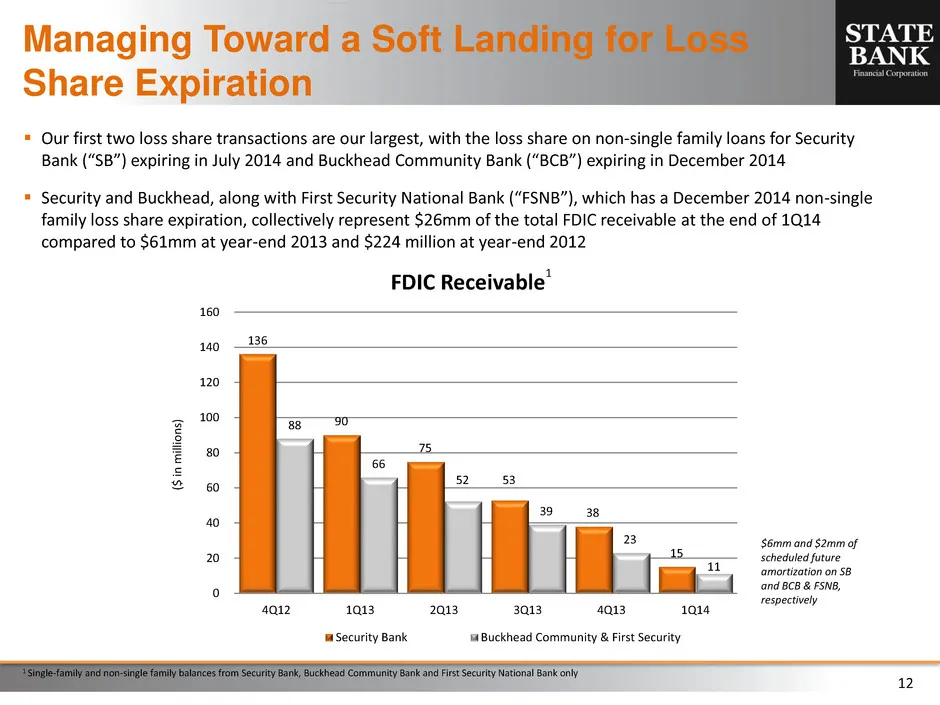
Slide 12: Managing Toward a Soft Landing for Loss Share Expiration
12 (0) (0) (0) (0) (0) (0) (0) (0) (0) (0) 0 Security Bank Buckhead Community & First Security Our first two loss share transactions are our largest, with the loss share on non-single family loans for Security Bank (“SB”) expiring in July 2014 and Buckhead Community Bank (“BCB”) expiring in Decemb
Slide 13: Financial Results: Revenue
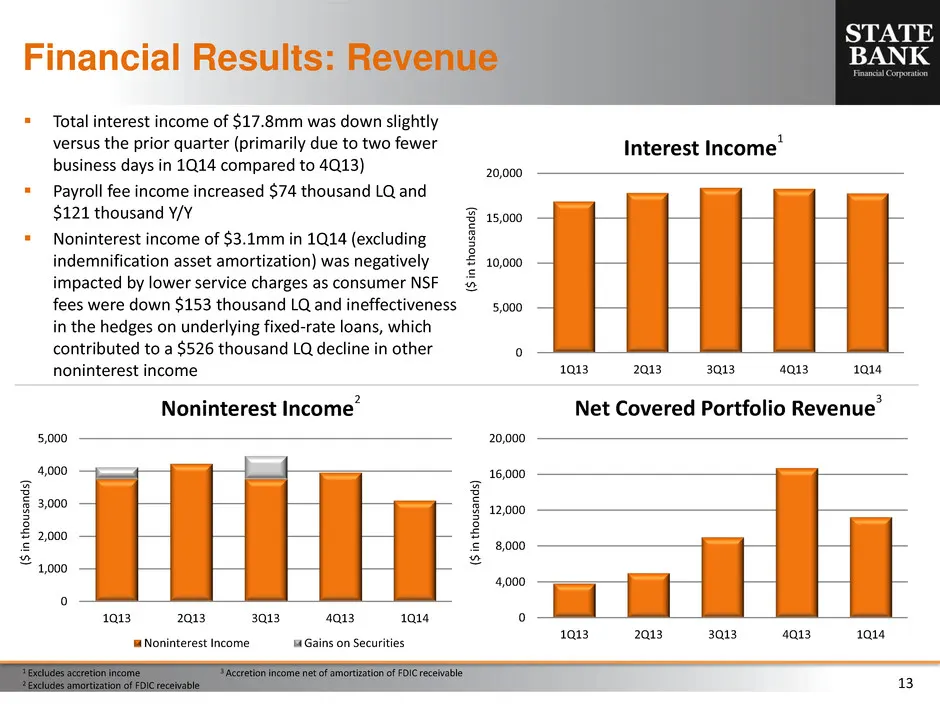
13 Financial Results: Revenue 1 Excludes accretion income 2 Excludes amortization of FDIC receivable Total interest income of $17.8mm was down slightly versus the prior quarter (primarily due to two fewer business days in 1Q14 compared to 4Q13) Payroll fee income increased $74 thousand LQ and $1
Slide 14: Financial Results: Expense
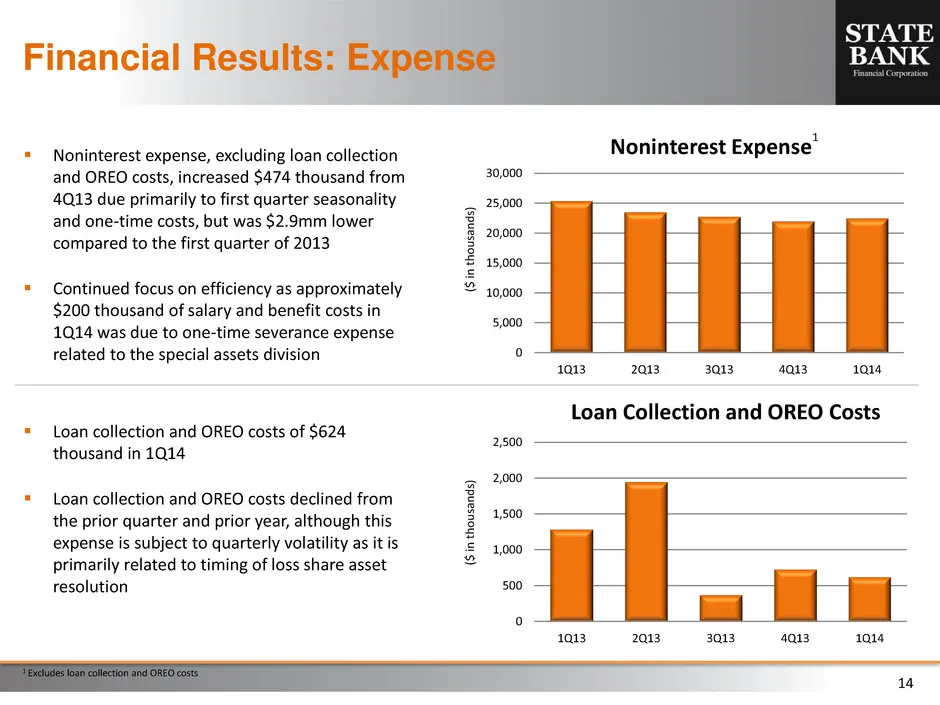
14 Financial Results: Expense 1 Excludes loan collection and OREO costs Noninterest expense, excluding loan collection and OREO costs, increased $474 thousand from 4Q13 due primarily to first quarter seasonality and one-time costs, but was $2.9mm lower compared to the first quarter of 2013 Conti
Slide 15: Financial Results: Earning Assets
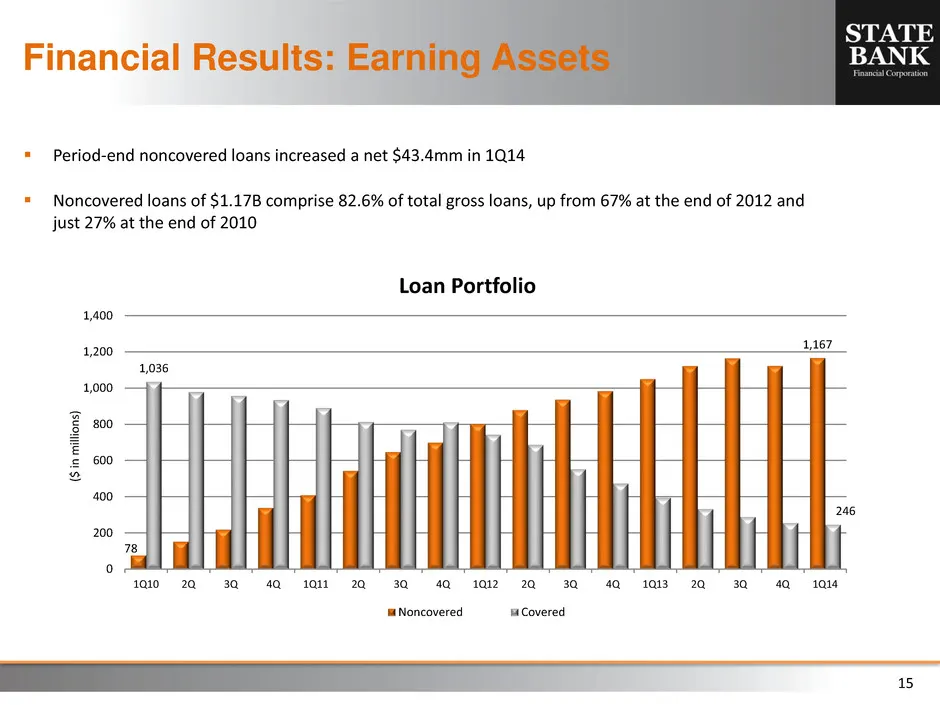
15 Financial Results: Earning Assets Period-end noncovered loans increased a net $43.4mm in 1Q14 Noncovered loans of $1.17B comprise 82.6% of total gross loans, up from 67% at the end of 2012 and just 27% at the end of 2010 78 1,167 1,036 246 0 200 400 600 800 1,000 1,200 1,400 1Q10 2Q 3Q 4Q 1Q1
Slide 16: Financial Results: Funding
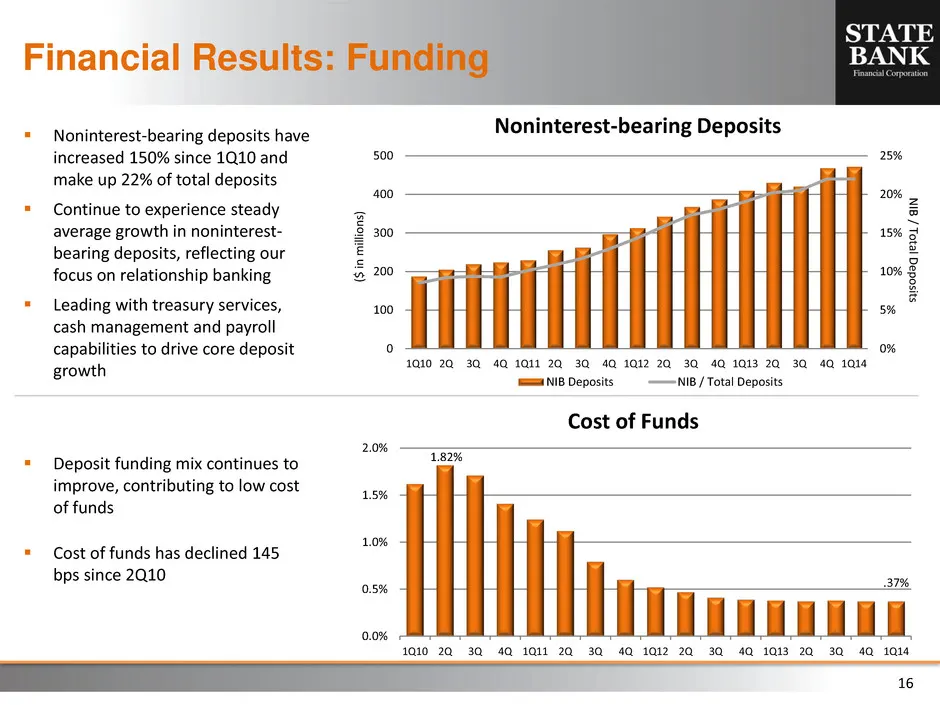
16 Financial Results: Funding Noninterest-bearing deposits have increased 150% since 1Q10 and make up 22% of total deposits Continue to experience steady average growth in noninterest- bearing deposits, reflecting our focus on relationship banking Leading with treasury services, cash managemen
Slide 17: Credit: Noncovered Portfolio
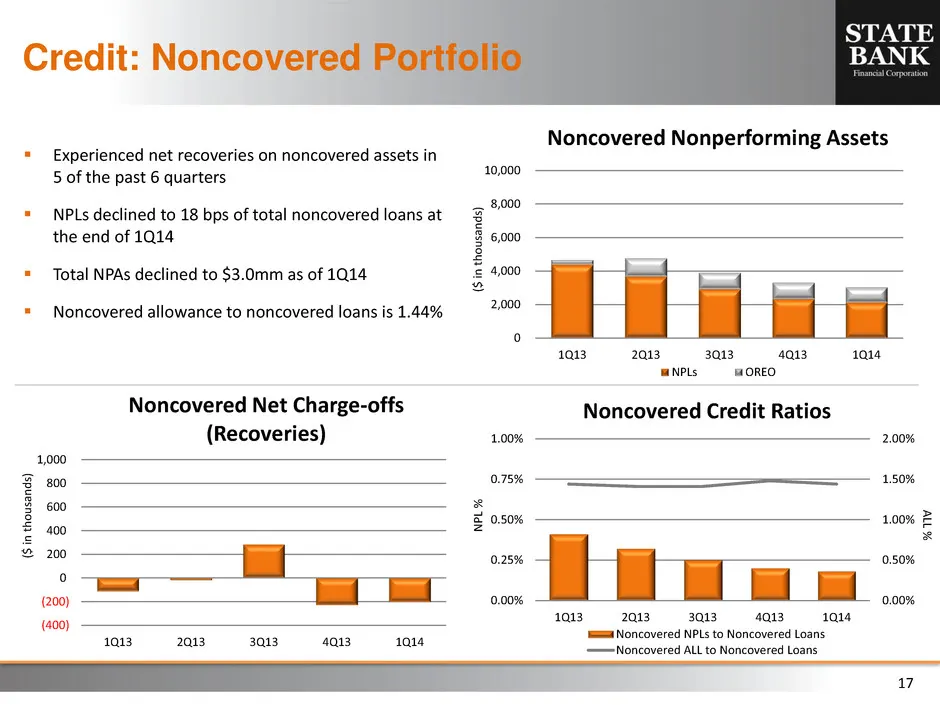
17 Credit: Noncovered Portfolio Experienced net recoveries on noncovered assets in 5 of the past 6 quarters NPLs declined to 18 bps of total noncovered loans at the end of 1Q14 Total NPAs declined to $3.0mm as of 1Q14 Noncovered allowance to noncovered loans is 1.44% ($ i n t h o u sa n d s)
Slide 18: Credit: Covered OREO
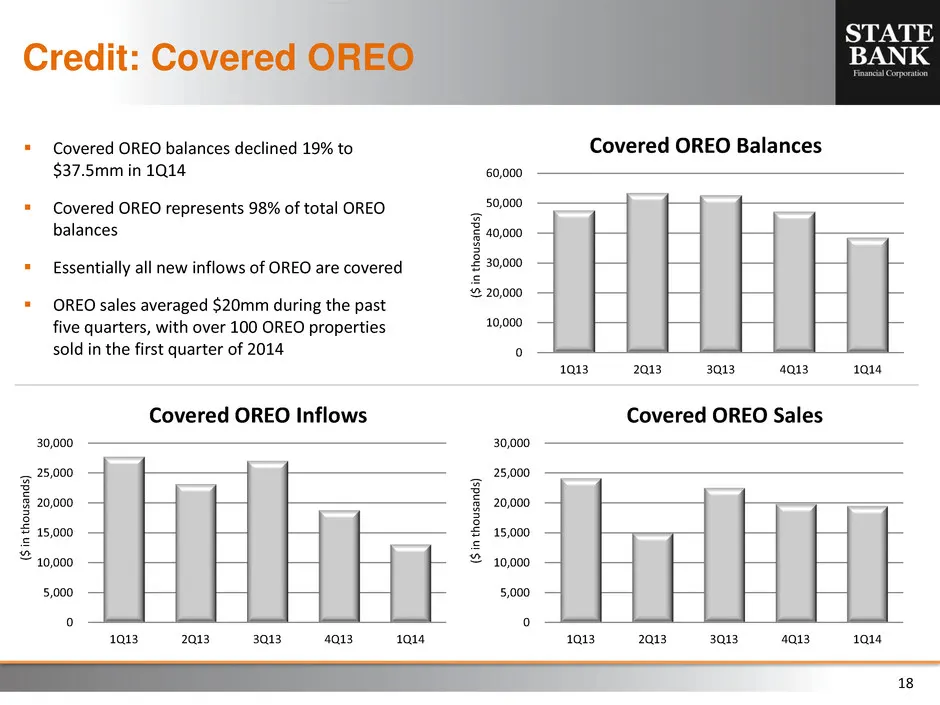
18 Credit: Covered OREO ($ i n t h o u sa n d s) ($ i n t h o u sa n d s) ($ i n t h o u sa n d s) Covered OREO balances declined 19% to $37.5mm in 1Q14 Covered OREO represents 98% of total OREO balances Essentially all new inflows of OREO are covered OREO sales averaged $20mm during the pas
Slide 19: Summary
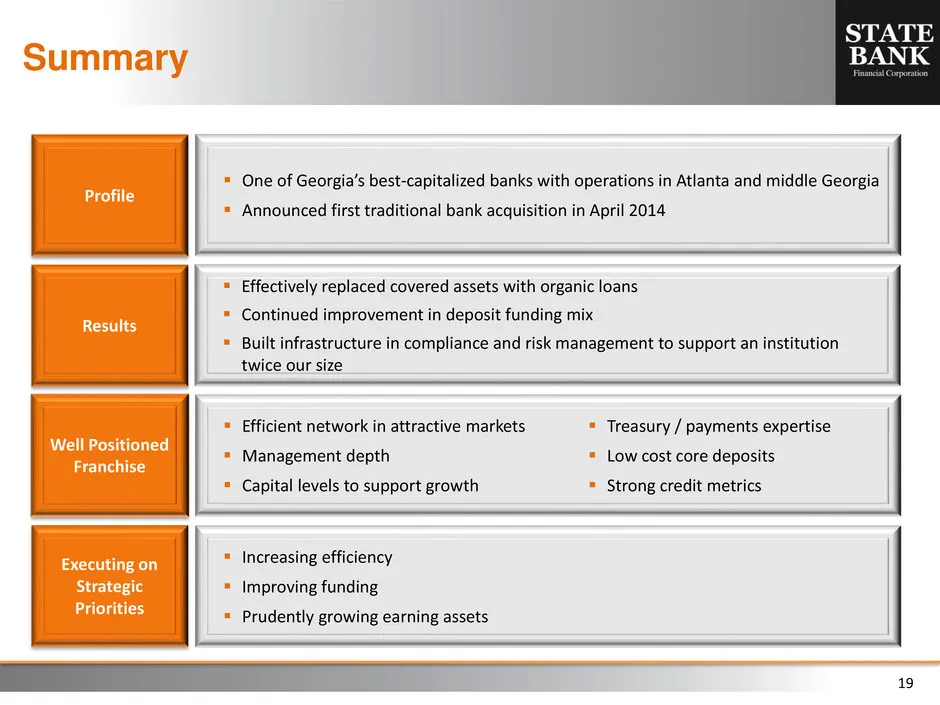
19 Summary Results Well Positioned Franchise Executing on Strategic Priorities Efficient network in attractive markets Management depth Capital levels to support growth Increasing efficiency Improving funding Prudently growing earning assets Profile One of Georgia’s best-capitalized ba
Source: SEC EDGAR · 8-K filed May 12, 2014
More decks from State Bank Financial Corporation
 Merger or Acquisition (May 2018)20 slides · May 14, 2018
 Investor Presentation (May 2018)18 slides · May 7, 2018
 Q1 2018 Earnings Presentation11 slides · Apr 26, 2018
 Q4 2017 Earnings Presentation14 slides · Jan 25, 2018
 Investor Presentation (December 2017)18 slides · Dec 11, 2017
 Q3 2017 Earnings Presentation12 slides · Oct 26, 2017