Kraft Foods — Barclays Back-to-School Conference 2013
39 slides from Kraft Foods's conference presentation, Sep 4, 2013
Slide 1: Kraft Foods Group Barclays Back-to-School Conference
Kraft Foods Group Barclays Back-to-School Conference September 4, 2013 Exhibit 99.1

Slide 2: Tony Vernon, Chief Executive Officer
Tony Vernon Chief Executive Officer

Slide 3: Forward-Looking Statements
Forward-Looking Statements This presentation contains a number of forward-looking statements. The words “plan,” “build,” “make,” “improve,” “invest,” “focus,” “will,” “execute,” “target” and similar expressions are intended to identify the forward-looking statements. Examples of forward-looking stat
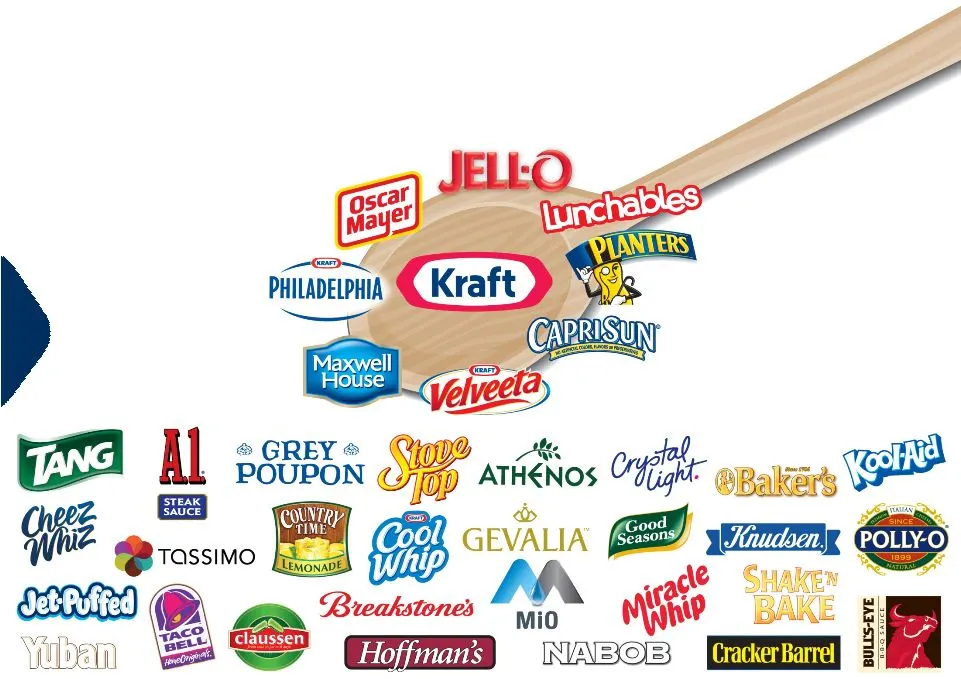
Slide 4: One year ago, we introduced the new Kraft Foods Group
One year ago, we introduced the new Kraft Foods Group
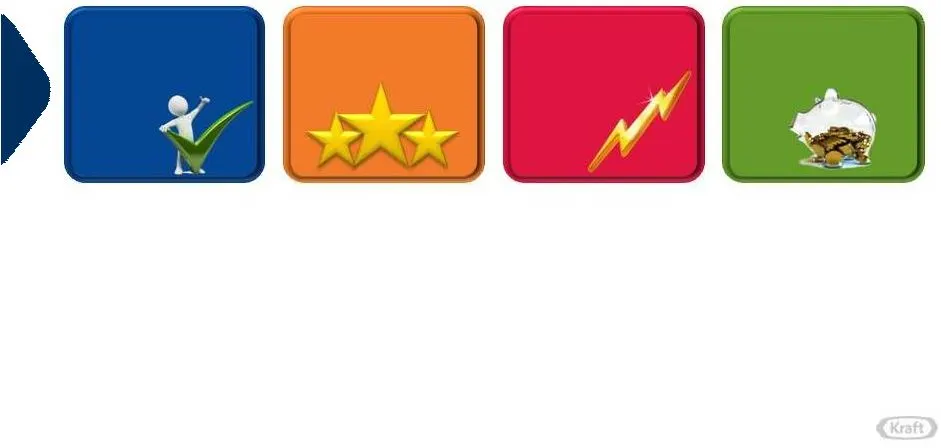
Slide 5: We laid out our four-part plan
Turbocharge Our Iconic Brands Execute with Excellence Make Our People Our Competitive Edge Redefine Efficiency We laid out our four-part plan
Slide 6: We stated our mission
We stated our mission Make Kraft North American Food & Beverage Company THE Innovator THE Strongest Portfolio THE Lowest Cost Producer

Slide 7: In February, we outlined our innovation journey
In February, we outlined our innovation journey THE Innovator

Slide 8: Today, we'll chart our path on costs
Today, we’ll chart our path on costs THE Lowest Cost Producer

Slide 9: Bob Gorski, EVP, Integrated Supply Chain
Bob Gorski Executive Vice President, Integrated Supply Chain
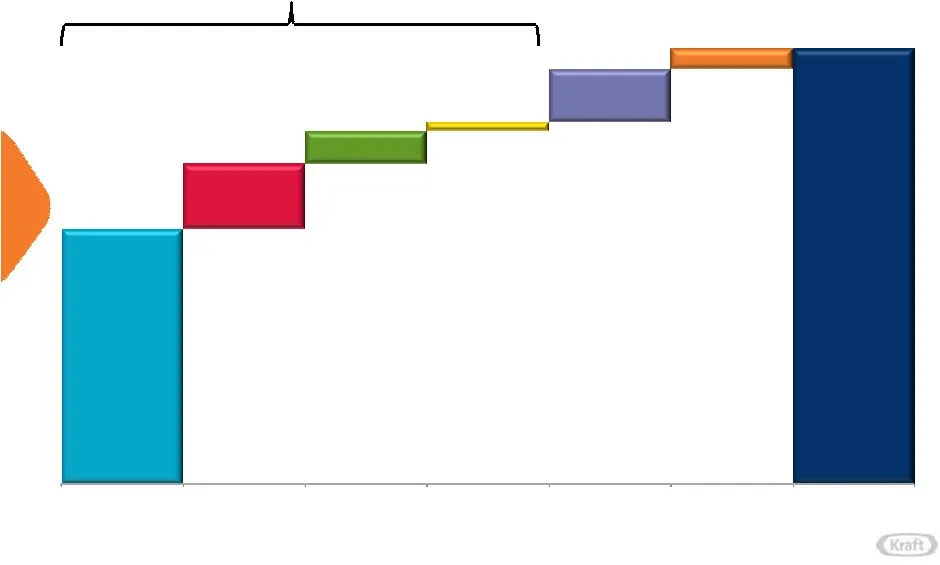
Slide 10: We manage a $15 billion value chain
Plant Conversion Indirect Commodities Ingredients & Packaging Total Value Chain We manage a $15 billion value chain ~$15B Other Manufacturing Transportation & Warehousing Scrap & Waste $Billions Cost of Goods Sold ~$12.5B
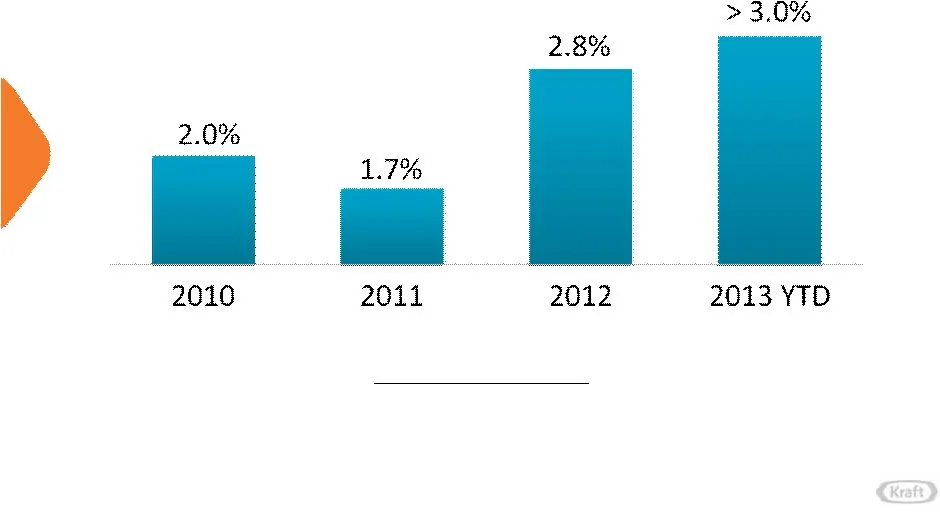
Slide 11: We've made great progress on productivity
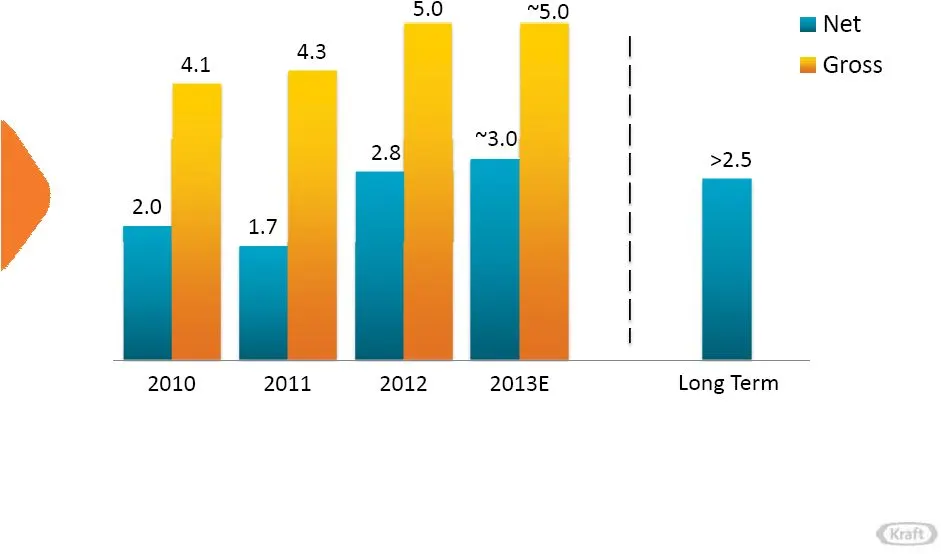
We’ve made great progress on productivity *Net Productivity Gross productivity less inflation, business investments and changes in HQ overhead supporting COGS Net Productivity* as a % of COGS
Slide 12: How long can it last?
> HOW LONG CAN IT LAST?
Slide 13: Building a simpler, more integrated supply chain
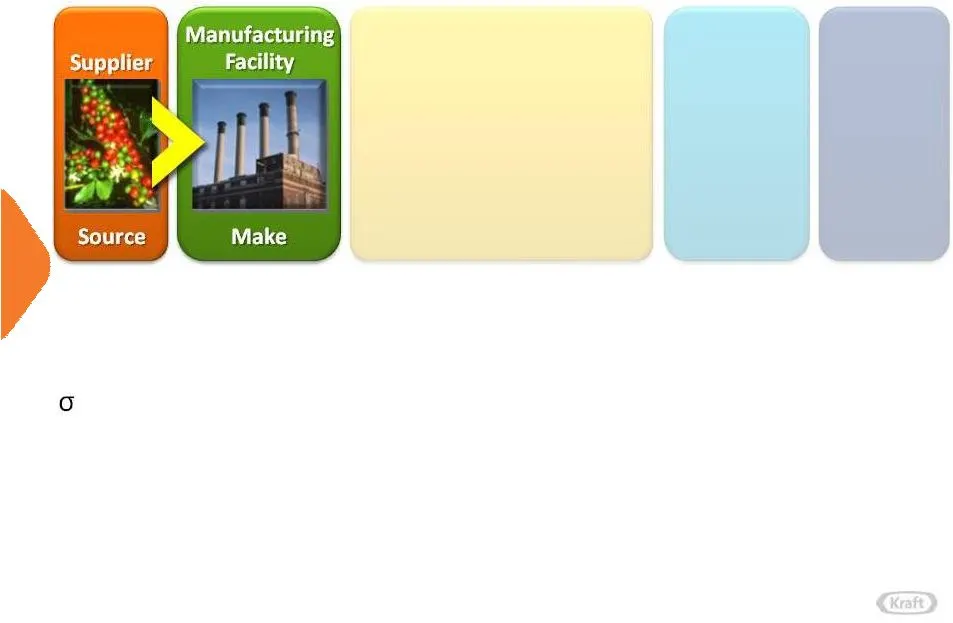
Building a simpler, more integrated supply chain Today Future State Suppliers > 7,000 < 1,000 Packaging Component Specifications ~ 6,800 < 500
Slide 14: Building a simpler, more integrated supply chain
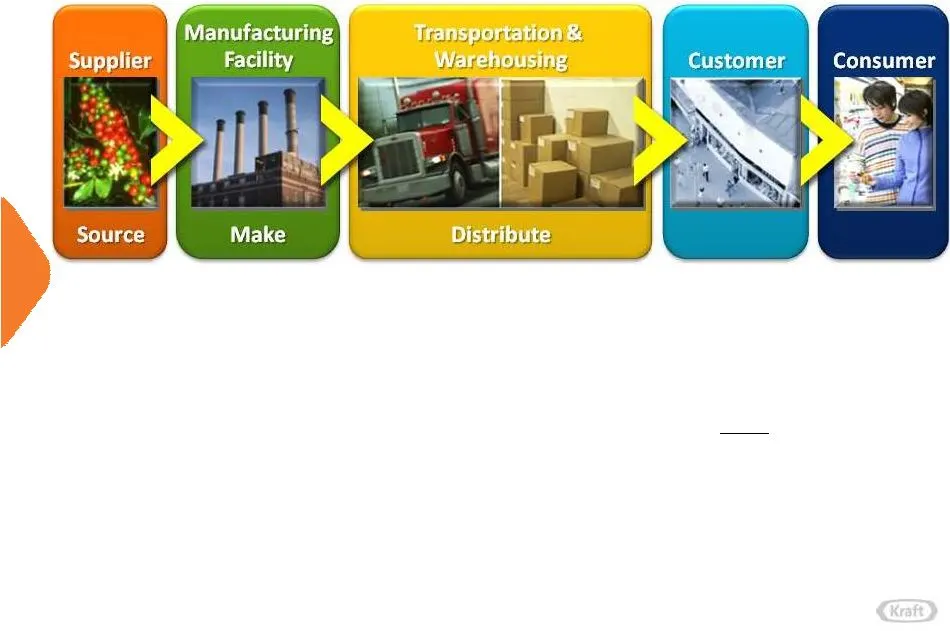
Building a simpler, more integrated supply chain Today Future State -rated Production Lines 14% > 90% Planned Maintenance 35% > 80% Production Breakdowns every 4 minutes > 240 minutes
Slide 15: Building a simpler, more integrated supply chain
Building a simpler, more integrated supply chain Today Future State SKUs ~ 5,500 20% net reduction Direct Plant-to-Customer Shipments ~ 30% ~ 60%
Slide 16: Room to improve gross-to-net conversion
Room to improve gross-to-net conversion Productivity as a % of COGS Gross-to-Net Conversion 49% 40% 56% ~60% 70%-plus
Slide 17: Sizable opportunity to take out working capital
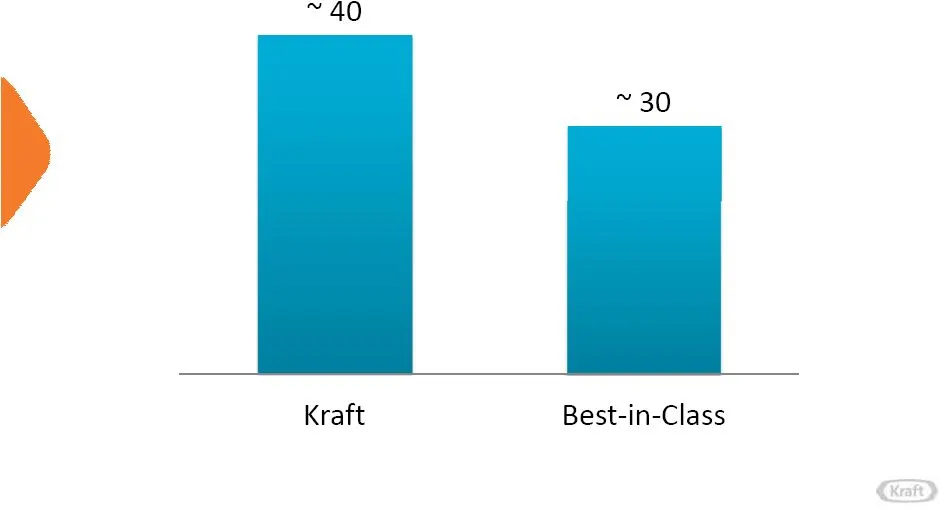
Sizable opportunity to take out working capital Cash Conversion Cycle (days) (1) Reflects four-quarter average of Receivables Days plus Days Inventory on Hand, less Accounts Payable Days

Slide 18: How do we get there?
How DO WE GET THERE?

Slide 19: Invest in people to close capability gaps
Invest in people to close capability gaps LOW HIGH Current State INTEGRATED LEAN SIX SIGMA MAINTENANCE NETWORK OPTIMIZATION GROSS-TO-NET PRODUCTIVITY CONVERSION END-TO-END VALUE-CHAIN MAPPING CASH CONVERSION CYCLE QUALITY SERVICE / SUPPLY CHAIN RELIABILITY SAFETY SIMPLIFICATION ENGINEERING BUSINESS

Slide 20: Invest in people to close capability gaps
Invest in people to close capability gaps LOW HIGH Current State INTEGRATED LEAN SIX SIGMA MAINTENANCE NETWORK OPTIMIZATION GROSS-TO-NET PRODUCTIVITY CONVERSION END-TO-END VALUE-CHAIN MAPPING CASH CONVERSION CYCLE QUALITY SERVICE / SUPPLY CHAIN RELIABILITY SIMPLIFICATION ENGINEERING BUSINESS PROCESS
Slide 21: Invest in people to close capability gaps
Invest in people to close capability gaps LOW HIGH Current State INTEGRATED LEAN SIX SIGMA MAINTENANCE NETWORK OPTIMIZATION GROSS-TO-NET PRODUCTIVITY CONVERSION END-TO-END VALUE-CHAIN MAPPING CASH CONVERSION CYCLE QUALITY SERVICE / SUPPLY CHAIN RELIABILITY SIMPLIFICATION ENGINEERING BUSINESS PROCESS
Slide 22: Invest in people to close capability gaps
Invest in people to close capability gaps LOW HIGH Current State INTEGRATED LEAN SIX SIGMA MAINTENANCE NETWORK OPTIMIZATION GROSS-TO-NET PRODUCTIVITY CONVERSION END-TO-END VALUE-CHAIN MAPPING CASH CONVERSION CYCLE QUALITY SERVICE / SUPPLY CHAIN RELIABILITY SAFETY SIMPLIFICATION ENGINEERING BUSINESS

Slide 23: Seven building blocks will deliver our potential
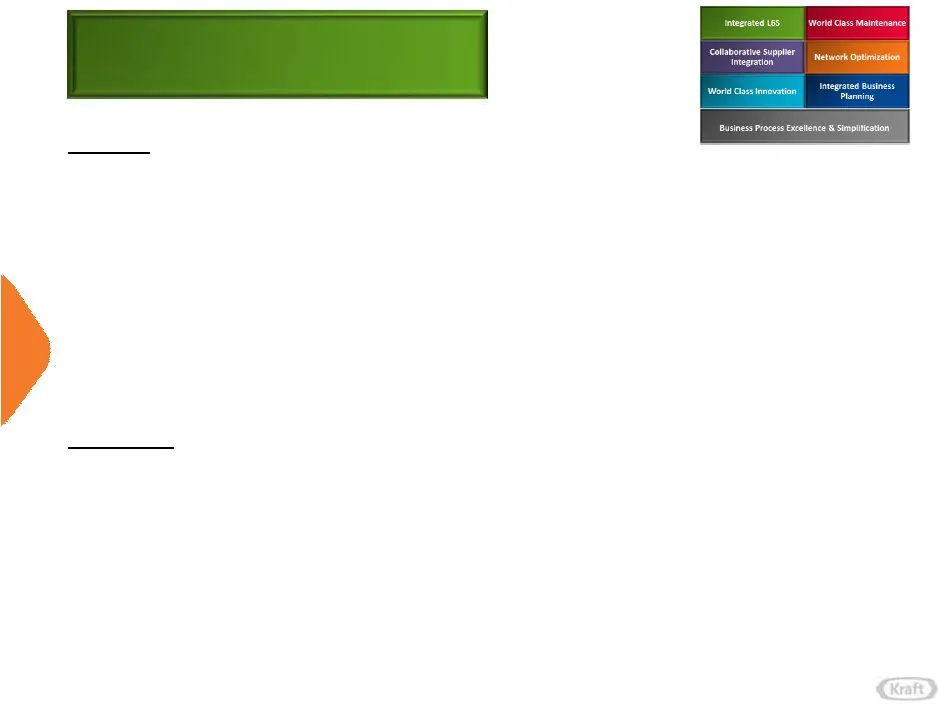
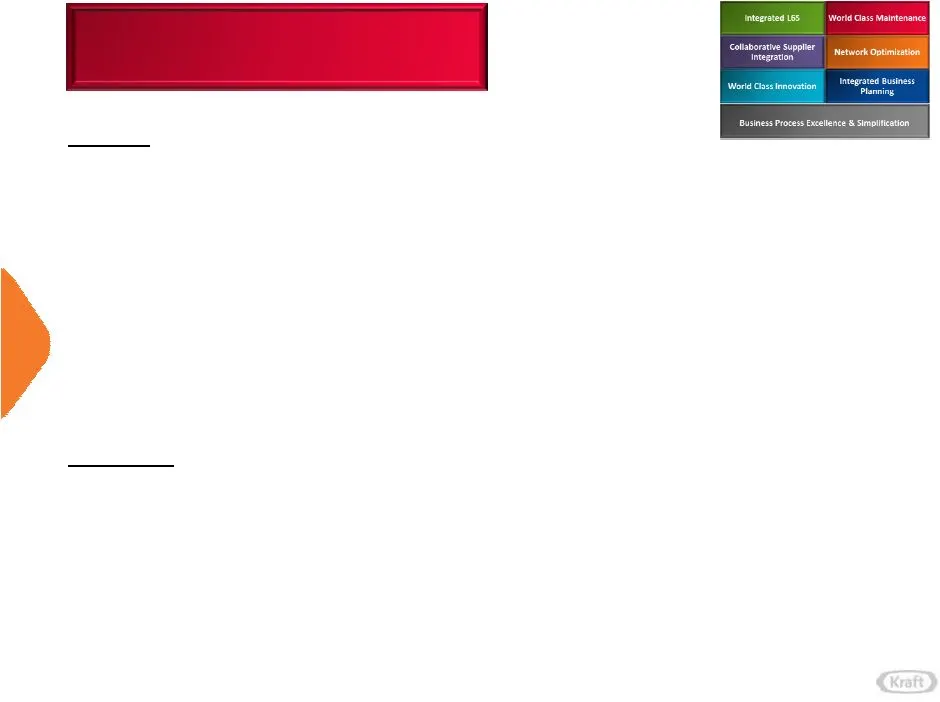
Integrated L6S World Class Maintenance Network Optimization Collaborative Supplier Integration World Class Innovation Integrated Business Planning Business Process Excellence & Simplification Seven building blocks will deliver our potential
Slide 24: Integrated L6S
Integrated L6S Focus • Extend Black Belt capabilities to customer service & logistics • Build “end-to-end” capabilities and eliminate “intersection losses” through value stream mapping and loss analysis • 100% employee engagement via unique ownership of equipment, work areas, systems Benefit • Reduc
Slide 25: World Class Maintenance
World Class Maintenance Focus • Real-time equipment performance • Master preventative maintenance • Transform parts buying into Just-in-Time methodology and drastically reduce suppliers Benefit • Reduce costs and spare parts inventory • Enable growth via more predictable throughput
Slide 26: World Class Innovation
World Class Innovation Focus • Simplify, streamline, standardize engineering processes • Strategically allocate technical resources in best-for-Kraft manner • Selectively develop, implement high tech/state-of-the-art equipment platforms with step-change performance Benefit • Lower delivered cost wit
Slide 27: Collaborative Supplier Integration
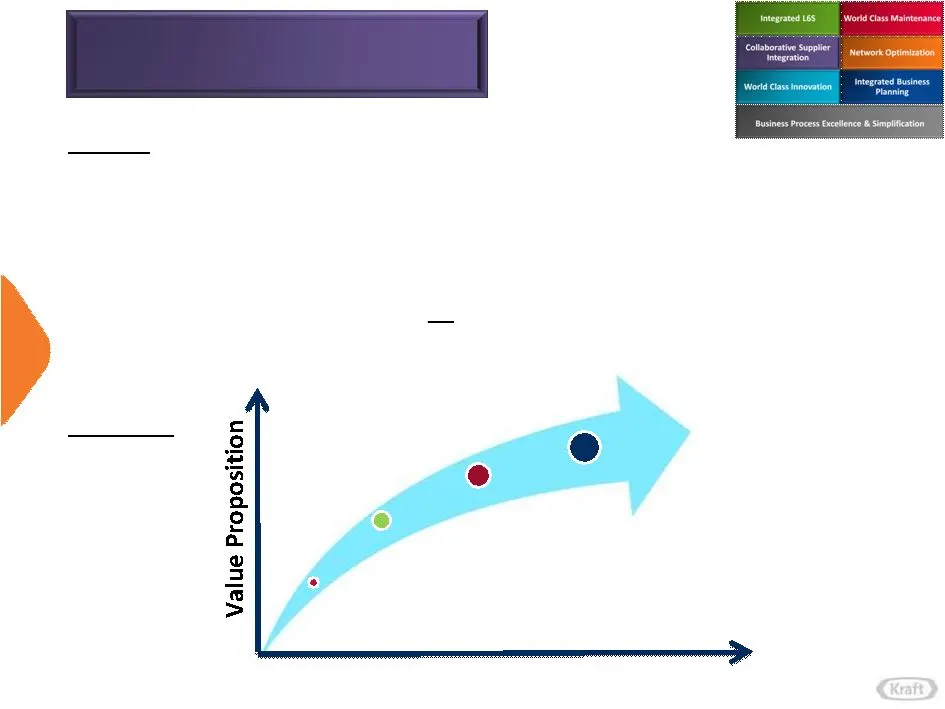
ColaborativeSupler usnes Process Excallene &Simpiication Value Proposition
Slide 28: Network Optimization
Network Optimization Focus • Establish metrics to track network-wide lowest landed cost • Move to pull system with demand-driven front end • Optimize End-to-End network design Benefit • Improve customer service levels • Reduce costs and total cost of ownership • Improve working capital, free cash fl
Slide 29: Integrated Business Planning
Integrated Business Planning Focus • Establish integrated product, demand, supply review processes across business units • Optimize sku’s within each product line Benefit • Achieve world-class customer service levels and lower inventory through increased forecast accuracy, on-time delivery, improved
Slide 30: Business Process Excellence & Simplification
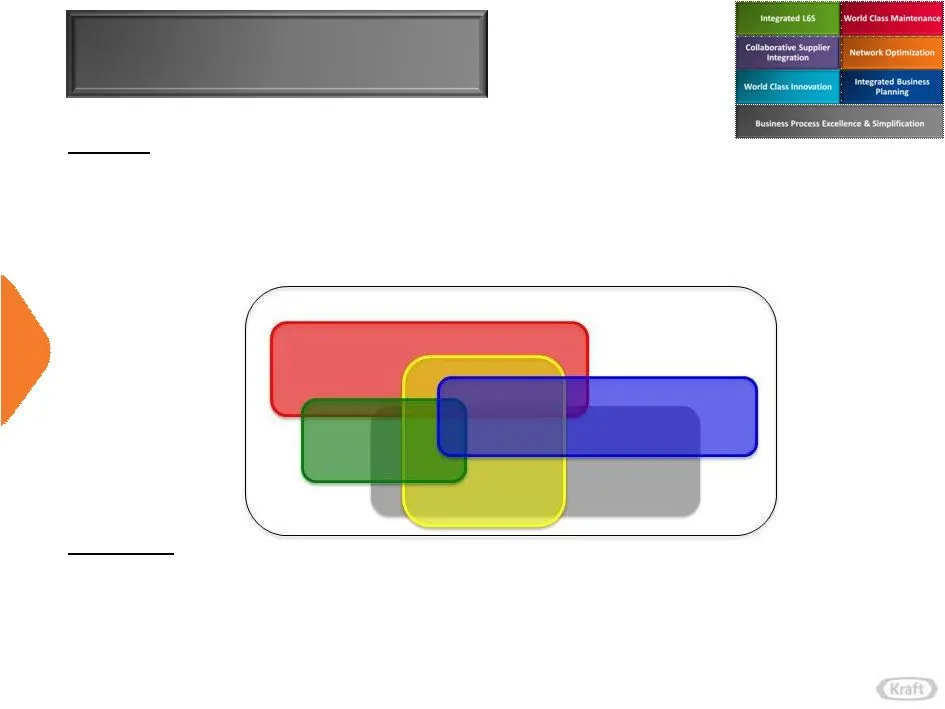
Business Process Excellence & Simplification Order Management Procurement Demand & Supply Planning Financials Focus • Define standard plant metrics and supply chain KPI’s • Optimize, integrate operational reporting Benefit • Lower manufacturing, customer service and logistics costs • Drive long-term

Slide 31: Tim McLevish, Chief Financial Officer
Tim McLevish Chief Financial Officer
Slide 32: Business process situation and discovery
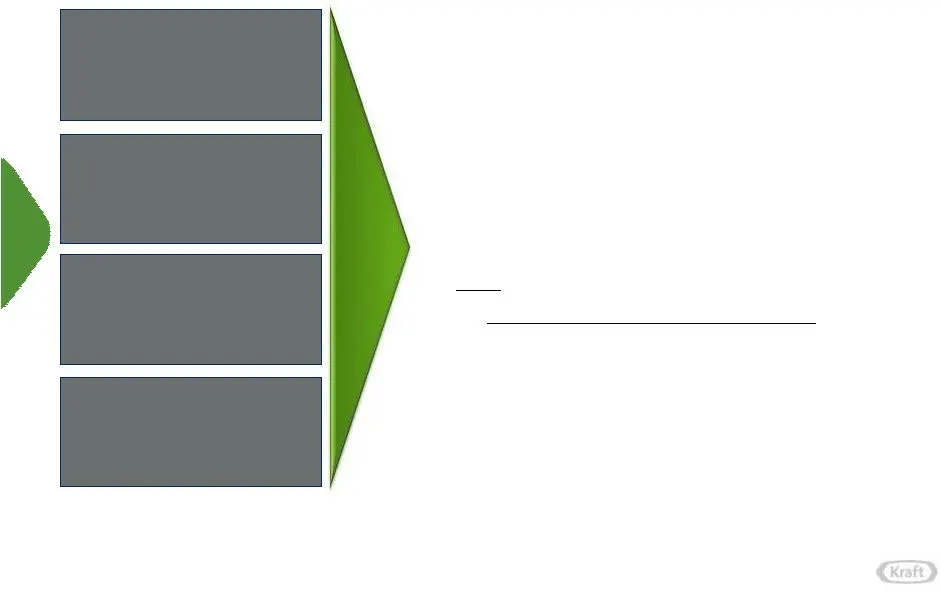
Integrated Business Planning Business Process Excellence SAP Refresh Integrated Lean Six Sigma Situation and discovery • Fragmented systems designed for a complex business model • Ownership and accountabilities of processes not defined • Processes lacked uniformity; complex; siloed; fragmented; not
Slide 33
Slide 34: We put dollars in shareholders' pockets
To We put dollars in Shareholders’ pockets… not growth rates, not margins Inconsistent commitment Revenue growth and OI margin focus No capital charges Functional silos, metrics and incentives Data and reports Key cultural priority Balanced emphasis on both P&L and Balance Sheet ROIC focus from stra
Slide 35: A sustainable long-term growth algorithm
A sustainable long-term growth algorithm Metric Long-Term Target (1) Market defined as the North American Food & Beverage market Organic Net Revenue Operating Income Dividends Profitable growth at or above market growth Consistent mid-single-digit growth Consistent mid-single-digit growth EPS Consis

Slide 36: Tony Vernon, Chief Executive Officer
Tony Vernon Chief Executive Officer

Slide 37: Our transformation is a marathon, not a sprint
Way we think Way we behave Way work gets done Way we use our enablers Our transformation is a marathon, not a sprint Way we think Way we behave Way work gets done Way we use our enablers Way we run our business
Slide 38: Best Investment in the Industry
Profitable Top-Line Growth Consistent Bottom-Line Growth Superior Dividend Payout Our Mission Make Kraft North American Food & Beverage Company Best Investment in the Industry
Slide 39
Source: SEC EDGAR · 8-K filed Sep 4, 2013
More decks from Kraft Foods Group Inc
 Merger or Acquisition (March 2015)35 slides · Mar 25, 2015
 Merger or Acquisition (March 2015)34 slides · Mar 25, 2015
 Kraft Foods Group Back-to-School Conference 201438 slides · Sep 3, 2014
 CAGE Conference 201436 slides · Mar 17, 2014
 CAGNY Conference 201438 slides · Feb 18, 2014
 CAGNY Monthly Lunch Program (June 2013)21 slides · Jun 20, 2013