Uici — AIFA Conference March 2003
37 slides from Uici's conference presentation, Mar 3, 2003

Slide 1: Investor Presentation, AIFA Conference, March 2003
investor Presentation AIFA Conference March 2003 Confidential
Slide 2: Forward-looking statements
ey /, Certain statements in this presentation may constitute forward- looking statements within the meaning of the Private Securities Litigation Reform Act. Actual results may differ materially from those included in the forward-looking statements. Various factors that could cause actual results to
Slide 3: Today's Agenda
Today’s Agenda |. UIC! Overview ll. Business Unit Summary = Self Employed Agency Health Insurance Group Health Insurance Life Insurance Senior Market Student Loan and Finance - AMS Ill. Challenges and Risks IV. Financial Information & Metrics ‘March 2003 3
Slide 4: Business Overview
Business Overview * Holding Company Niche Markets = Health, Life, LTC Insurance = Self-Employed, Students, Seniors, Part time Employees = Student Finance Headquartered in Dallas, TX Founded in 1985 IPO in 1986 * Traded on NYSE: UCI UICI mm ‘March 2003 4
Slide 5: Founding Principles
Founding Principles , ¢ UICI Founded by Ron Jensen to Build Wealth for Agents and Employees ¢ Powerful Direct Selling Organization ¢ Conservative Financial Philosophy = Accounting and Financial Reporting = Minimal Leverage ‘March 2003 5 paanen
Slide 6: Snap Shot as of 2/21/03
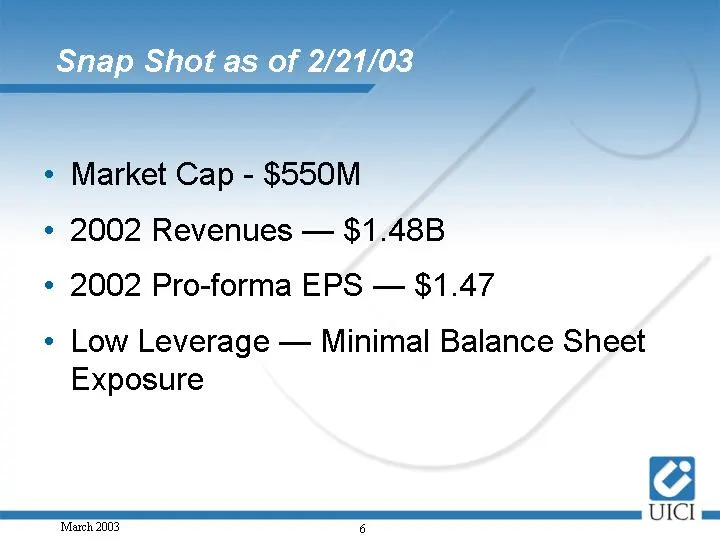
Snap Shot as of 2/21/03 Market Cap - $550M 2002 Revenues — $1.48B 2002 Pro-forma EPS — $1.47 Low Leverage — Minimal Balance Sheet Exposure UICI me ‘March 2003 6
Slide 7: Self Employed Agency Health Insurance
‘March 2003 Self Employed Agency Health Insurance UICI
Slide 8: Self Employed and Individual
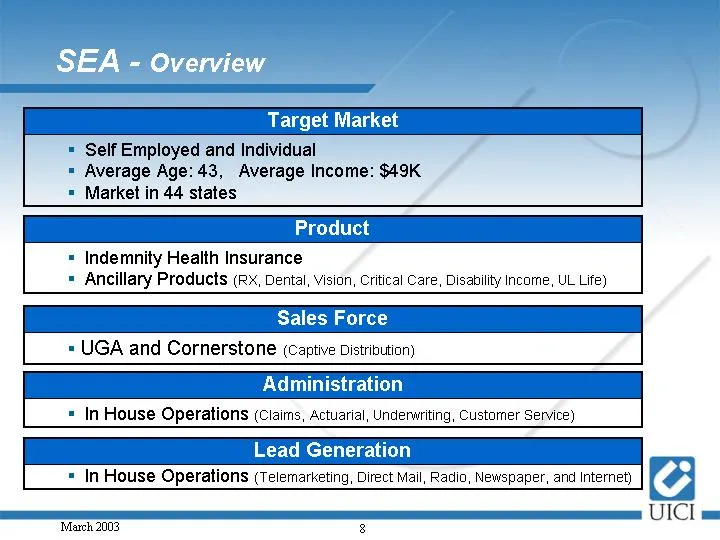
« Self Employed and Individual Average Age: 43, Average Income: $49K Market in 44 states Indemnity Health Insurance Ancillary Products (Rx, Dental, Vision, Critical Care, Disability Income, UL Life) UGA and Cornerstone (captive Distribution) In House Operations (ciaims, Actuarial, Underwriting, Cust
Slide 9: SEA - Focus on Sales and Operations
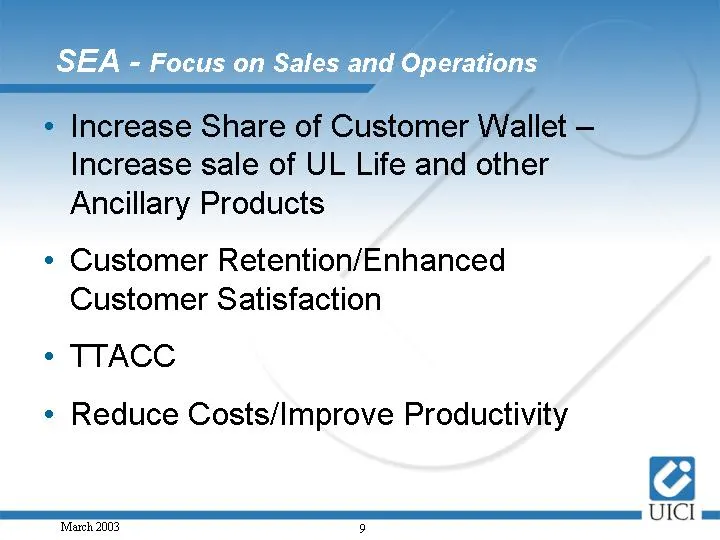
SEA - Focus on Sales and Operations ¢ Increase Share of Customer Wal Increase sale of UL Life and other Ancillary Products « Customer Retention/Enhanced Customer Satisfaction * TTACC « Reduce Costs/Improve Productivity UICI me ‘March 2003 9
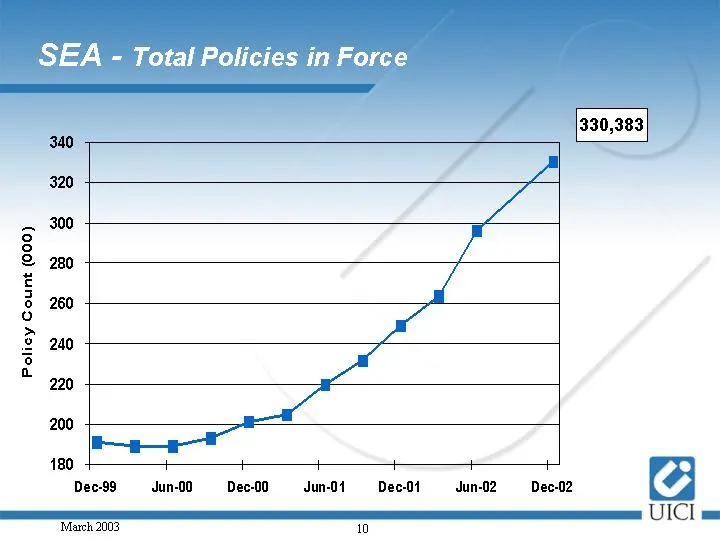
Slide 10: Policy Count (000)
Policy Count (000) 340 330,383 320 300 280 260 240 220 200 180 Dec-99 ‘March 2003 dJun-00 Dec-00 dJun-04 10 Dec-04 Jun-02 Dec-02 UICI
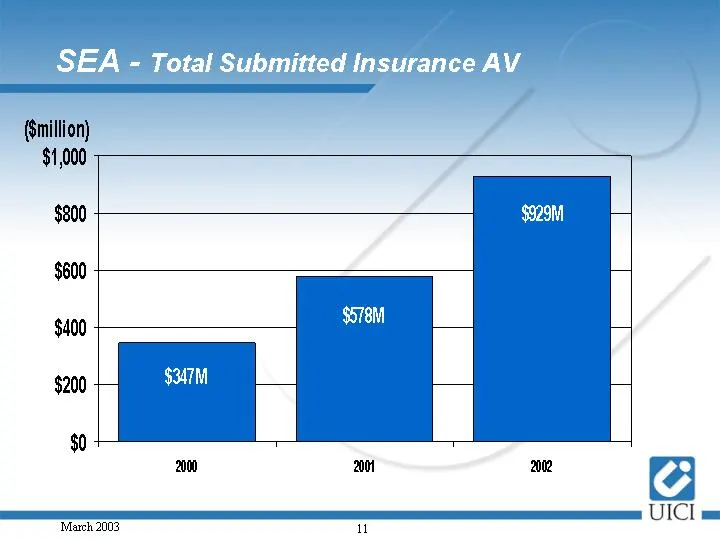
Slide 11: ($million)
(Smillion) $1,000 $800 $600 $400 $200 $0 200 an Balla UICI ‘March 2003 i
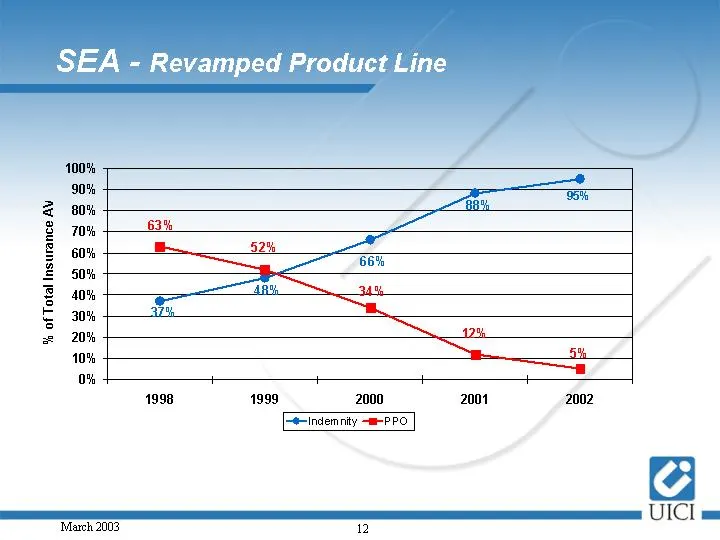
Slide 12: SEA - Revamped Product Line
SEA - Revamped Product Line % of Total Insurance AV 2 1998 1999 2000 2001 2002 [Fe-indemnity —m-PPO
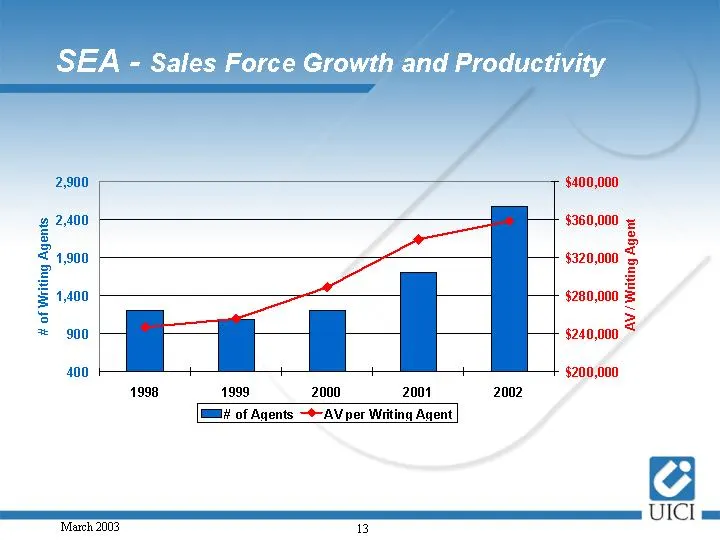
Slide 13: Agents and AV per Writing Agent
_ $400,000 J — s360,000 : Cam $320,000 a $280,000 z x Rast $240,000 z $200,000 1998 1999 2000 2001 2002 EE? of Agents AV per Whiting Agent UICI ‘March 2003 3
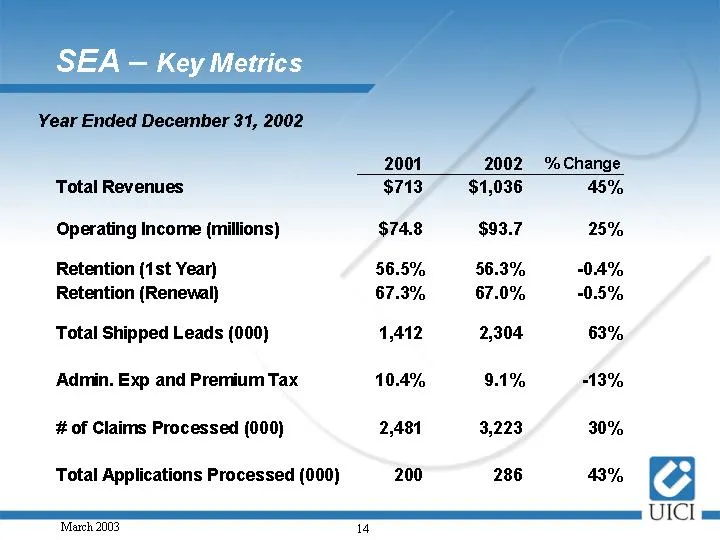
Slide 14: SEA — Key Metrics
SEA — Key Metrics Year Ended December 31, 2002 Total Revenues Operating Income (millions) Retention (1st Year) Retention (Renewal) Total Shipped Leads (000) Admin. Exp and Premium Tax # of Claims Processed (000) Total Applications Processed (000) ‘March 2003 14 2,481 200 2002 $1,036 $93.7 56.3% 67.0
Slide 15: Group Health Insurance (Student Insurance and STAR)
Group Health Insurance (Student Insurance and STAR) UICI ‘March 2003 15
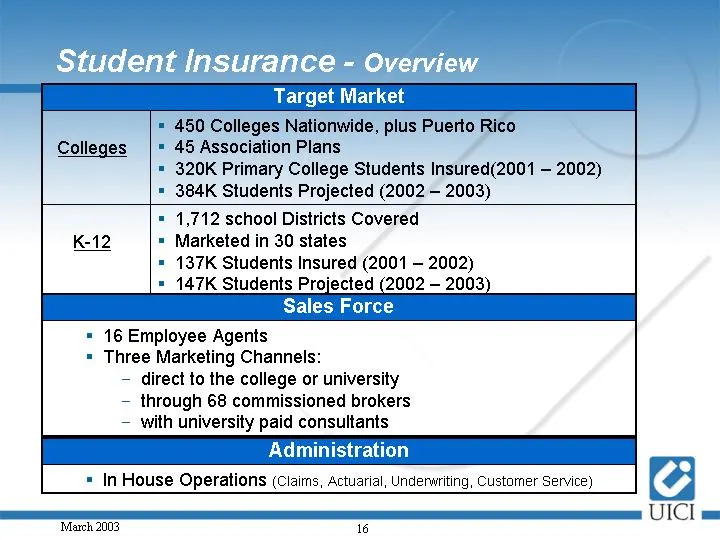
Slide 16: Student Insurance: Colleges and Association Plans
= 450 Colleges Nationwide, plus Puerto Rico Colleges 45 Association Plans = 320K Primary College Students Insured(2001 — 2002) = 384K Students Projected (2002 — 2003) = 1,712 school Districts Covered 12 = Marketed in 30 states = 137K Students Insured (2001 — 2002) = 147K Students Projected (2002 — 2
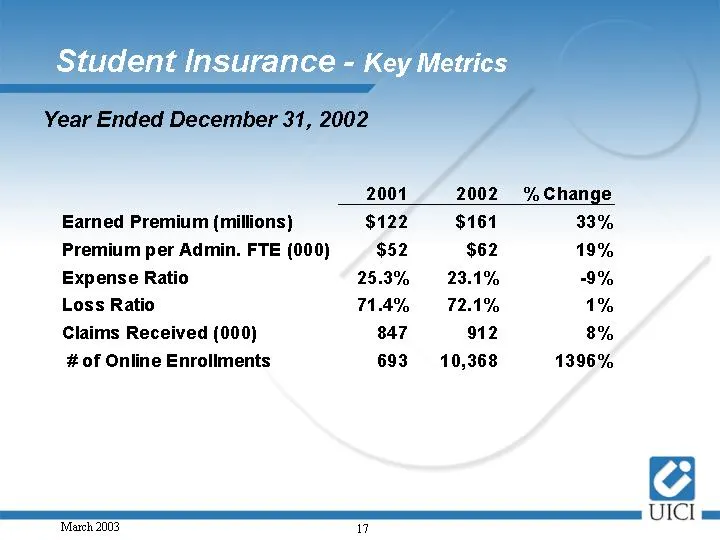
Slide 17: Student Insurance - Key Metrics
Student Insurance - Key Metrics 2001 2002 %Change Earned Premium (millions) $122 $161 33% Premium per Admin. FTE (000) $52 $62 19% Expense Ratio 25.3% 23.1% 9% Loss Ratio 71.4% 72.1% 1% Claims Received (000) 847 912 8% # of Online Enrollments 693 10,368 1396%
Slide 18: Employers with large numbers of uninsured hourly employees
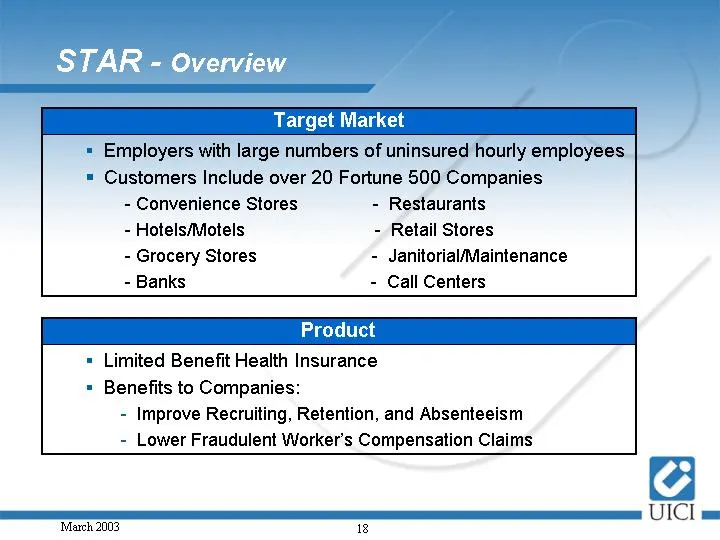
Employers with large numbers of uninsured hourly employees = Customers Include over 20 Fortune 500 Companies - Convenience Stores - Restaurants - Hotels/Motels - Retail Stores - Grocery Stores - JanitorialfMaintenance - Banks - Call Centers = Limited Benefit Health Insurance = Benefits to Companies:
Slide 19: Annualized Premium
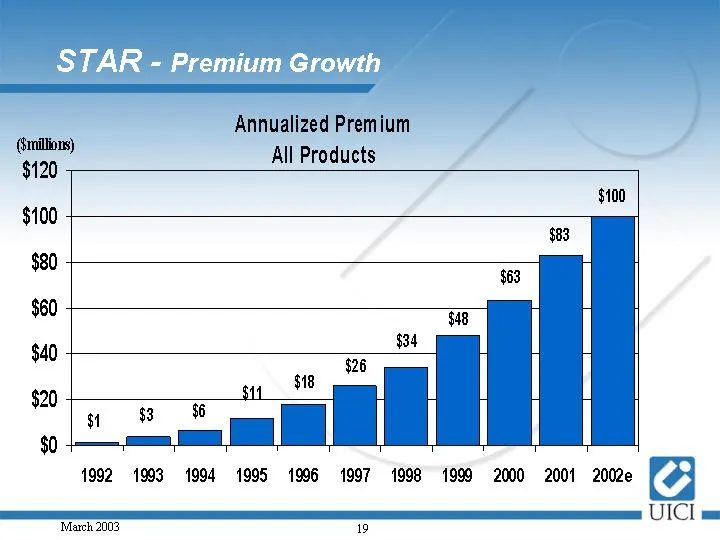
Annualized Premium a All Products $120 $100 $83 $80 rm H $60 7 1 $34 $40 7 H H $20 $11 a 8 6 | | $0 sees $100 1992 1903 1994 1995 1996 1997 1998 1999 2000 2001 2002 UICI ‘March 2003 19
Slide 20: STAR — Market Leader
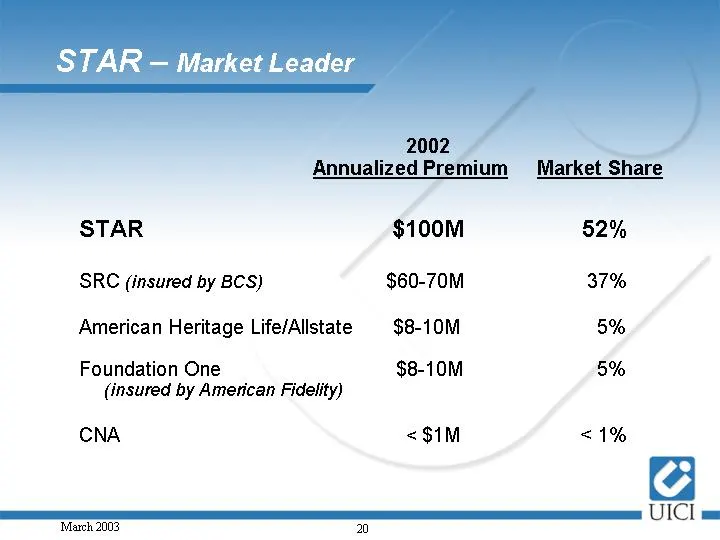
STAR — Market Leader Market Share 2002 Annualized Premium STAR $100M SRC (insured by BCS) $60-70M American Heritage Life/Allstate $8-10M Foundation One $8-10M (insured by American Fidelity) CNA <$1M 52% 37% 5% 5% <1%
Slide 21: Senior Market Group
Senior Market Group UICI ‘March 2003 a
Slide 22: Senior Market — Reasons for Entering
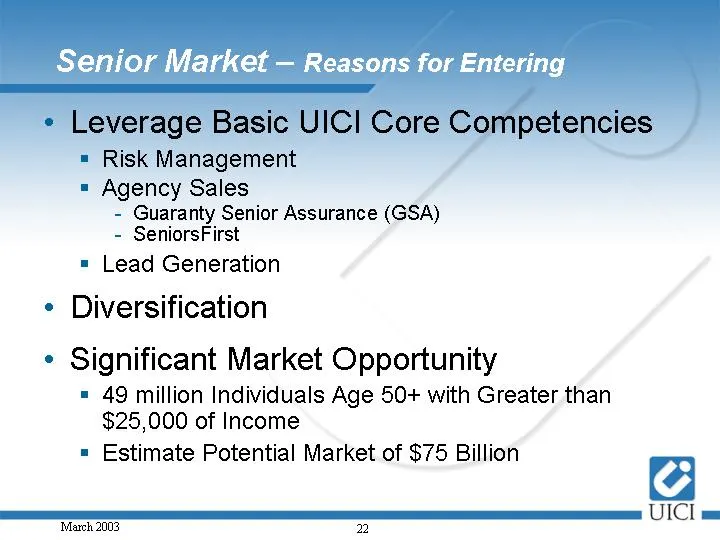
Senior Market — Reasons for Entering * Leverage Basic UICI Core Competencies = Risk Management = Agency Sales - Guaranty Senior Assurance (GSA) - SeniorsFirst = Lead Generation ¢ Diversification ¢ Significant Market Opportunity = 49 million Individuals Age 50+ with Greater than $25,000 of Income = E
Slide 23: Senior Market — Insurance Products
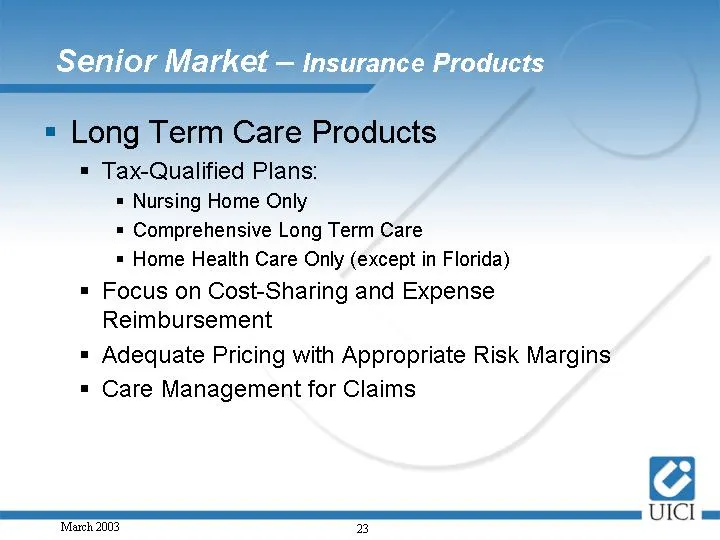
Senior Market — insurance Products = Long Term Care Products = Tax-Qualified Plans: = Nursing Home Only = Comprehensive Long Term Care = Home Health Care Only (except in Florida) = Focus on Cost-Sharing and Expense Reimbursement = Adequate Pricing with Appropriate Risk Margins = Care Management for
Slide 24: Student Loan and Finance (AMS)
Student Loan and Finance (AMS) UICI ‘March 2003 24
Slide 25: AMS: Colleges and Universities services
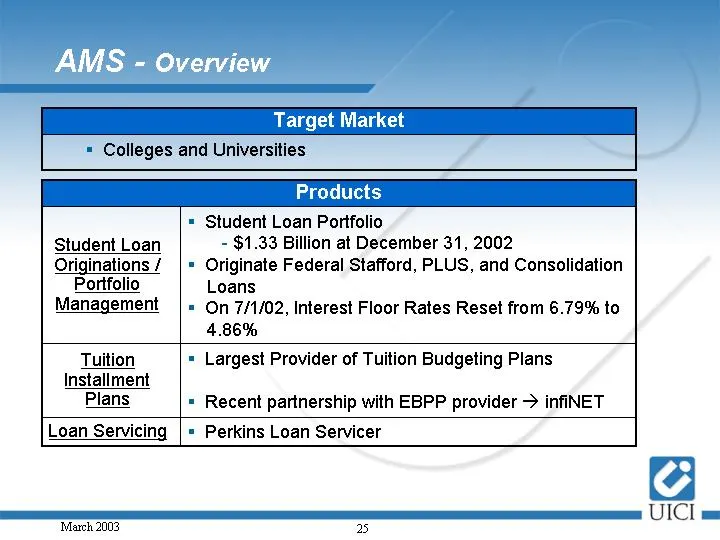
= Colleges and Universities Student Loan Originations / Portfolio Management = Student Loan Portfolio - $1.33 Billion at December 31, 2002 Originate Federal Stafford, PLUS, and Consolidation Loans On 7/1/02, Interest Floor Rates Reset from 6.79% to 4.86% Tuition Installment Plans Largest Provider of
Slide 26: AMS - Key Metrics
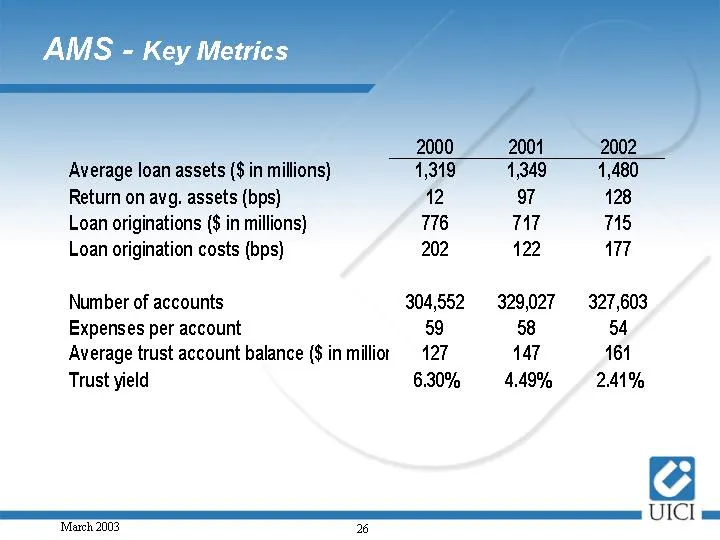
AMS - Key Metrics 2000-2004 2002 Average loan assets ($ in millions) 41,319 1,349 4,480 Return on avg. assets (bps) 12 7 128 Loan originations ($ in millions) 716 717 715 Loan origination costs (bps) 202 122 7 Number of accounts 304,552 329,027 327,603 Expenses per account 59 58 54 Average trust acc
Slide 27: UICI Overview: Business Unit Summary
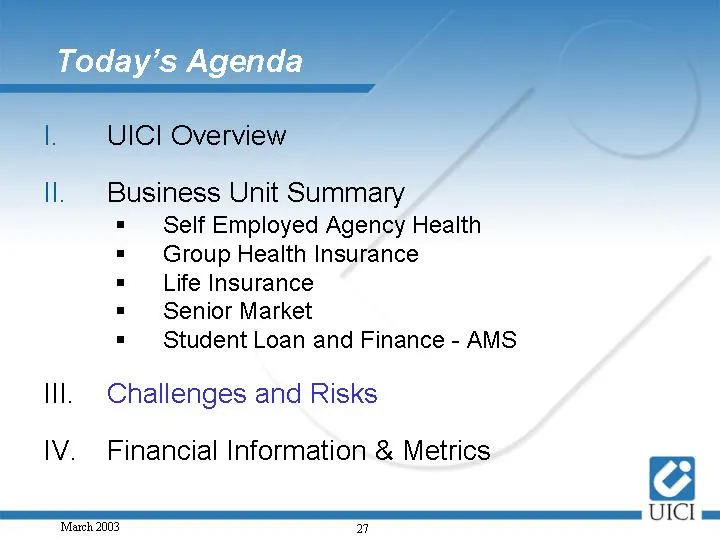
UICI Overview Business Unit Summary = Self Employed Agency Health = Group Health Insurance = Life Insurance = Senior Market = Student Loan and Finance - AMS IV. Financial Information & Metrics ‘March 2003 n UICI
Slide 28: Facts and Trends
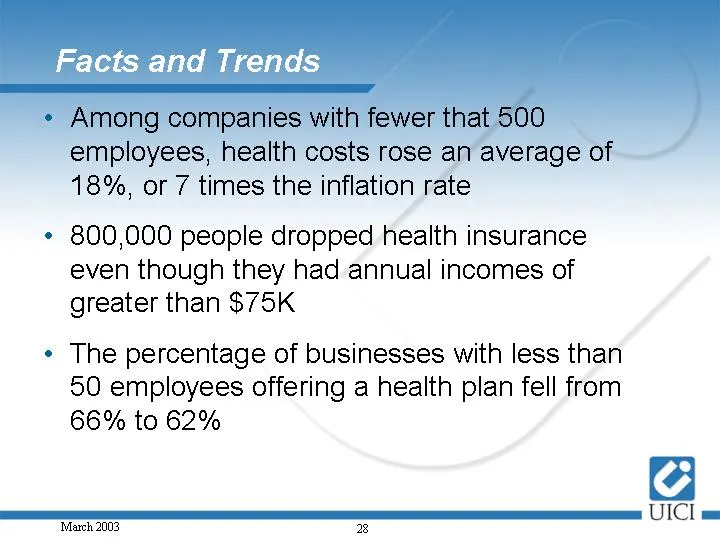
Facts and Trends employees, health costs rose an average of 18%, or 7 times the inflation rate « 800,000 people dropped health insurance even though they had annual incomes of greater than $75K « The percentage of businesses with less than 50 employees offering a health plan fell from 66% to 62%
Slide 29: Health Insurance costs are increasing at 7x the inflation rate
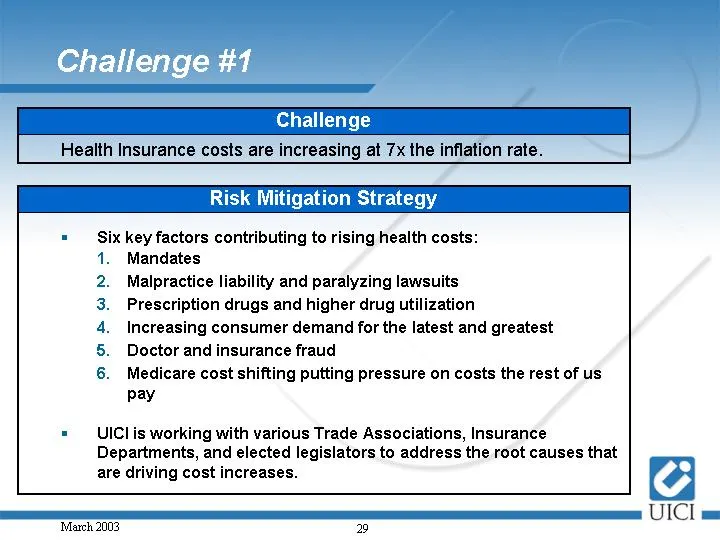
Health Insurance costs are increasing at 7x the inflation rate. Six key factors contributing to rising health costs: Mandates Malpractice liability and paralyzing lawsuits Prescription drugs and higher drug utilization Increasing consumer demand for the latest and greatest Doctor and insurance fraud
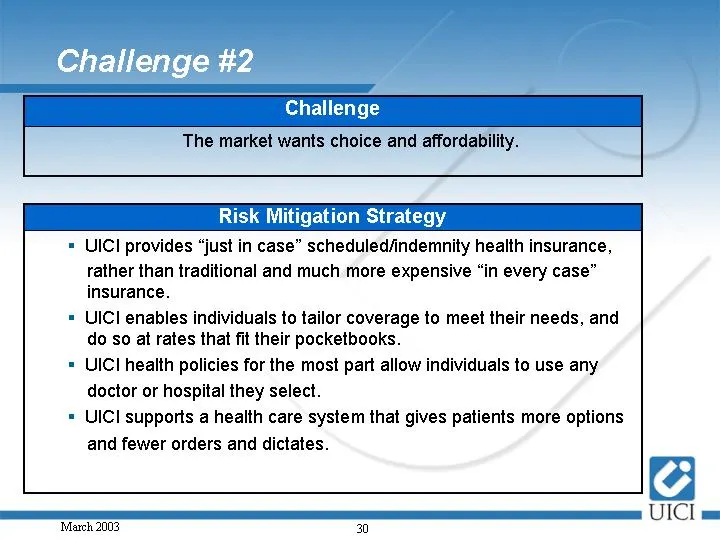
Slide 30: The market wants choice and affordability
The market wants choice and affordability. = UICI provides “just in case” scheduled/indemnity health insurance, rather than traditional and much more expensive “in every case” insurance. = UICI enables individuals to tailor coverage to meet their needs, and do so at rates that fit their pocketbooks.
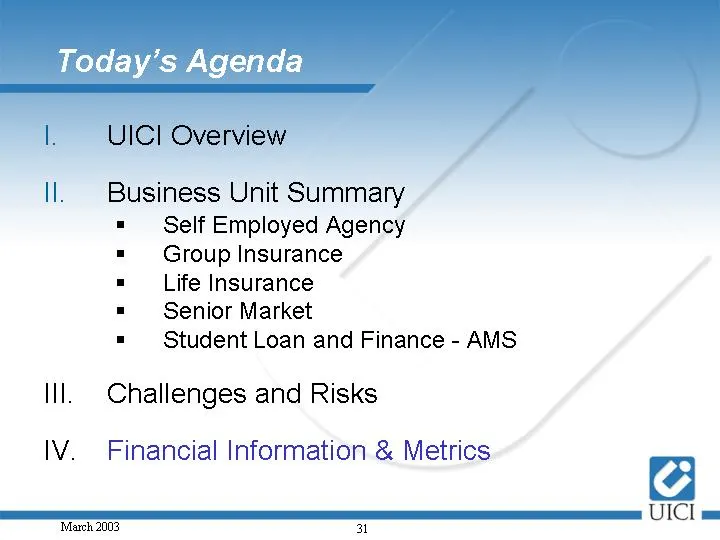
Slide 31: UICI Overview: Challenges and Risks
UICI Overview Business Unit Summary = Self Employed Agency = Group Insurance = Life Insurance = Senior Market = Student Loan and Finance - AMS Challenges and Risks ‘March 2003 31 UICI
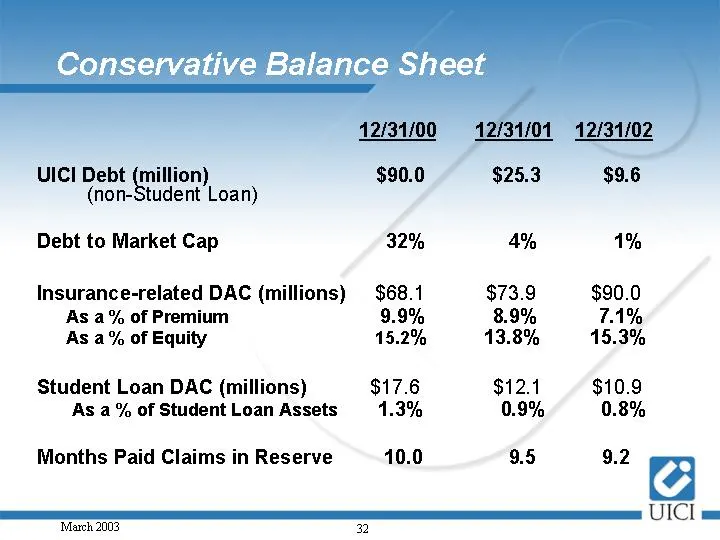
Slide 32: Conservative Balance Sheet
Conservative Balance Sheet 12/34/00 01 12/34/02 UICI Debt (million) $90.0 $25.3 $9.6 (non-Student Loan) Debt to Market Cap 32% 4% 1% Insurance-related DAC (millions) $68.1 $73.9 $90.0 As a% of Premium 9.9% 8.9% 7.1% As a% of Equity 15.2% 13.8% 15.3% Student Loan DAC (millions) $17.6 $12.1 $10.9 As a
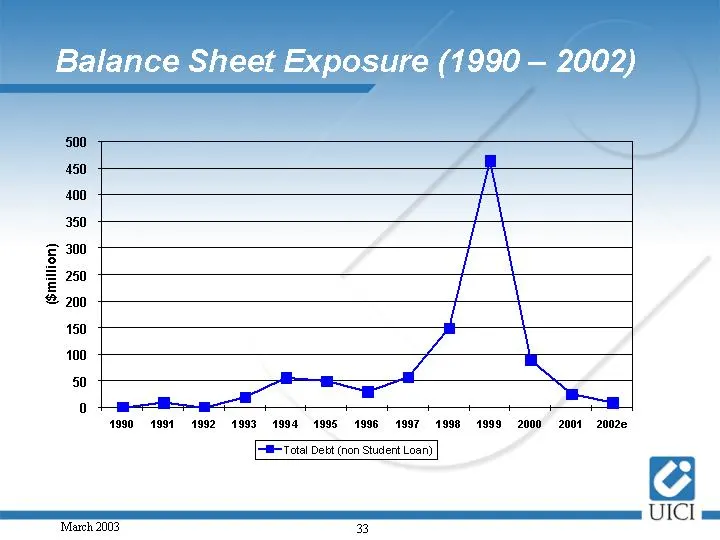
Slide 33: Balance Sheet Exposure (1990 — 2002)
Balance Sheet Exposure (1990 — 2002) 1990 1991 1992 1993 1994 1995 1996 1997 1998 1999 2000 2001 20026 [Fl Total Debt (non Student Loan) UICI me ‘March 2003 B
Slide 34: Strong Reserves
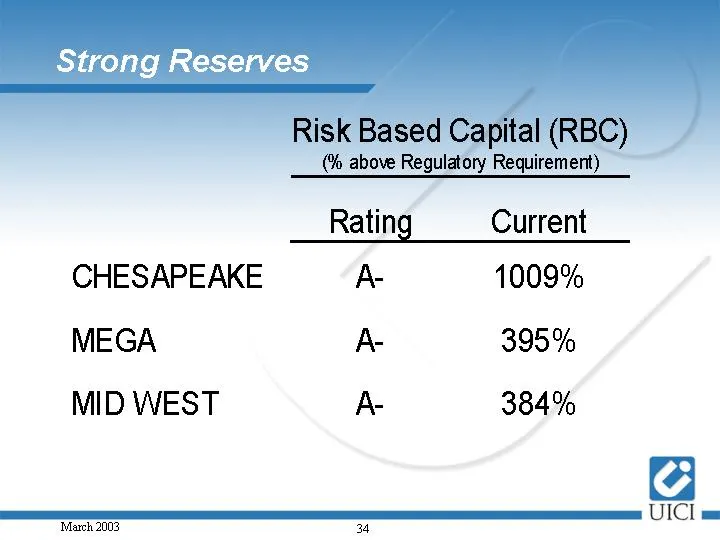
Strong Reserves Risk Based Capital (RBC) (% above Regulatory Requirement) Rating Current CHESAPEAKE A- 1009% MEGA A- 395% MID WEST A- 384% UICI me ‘March 2003 34
Slide 35: Segment Financials
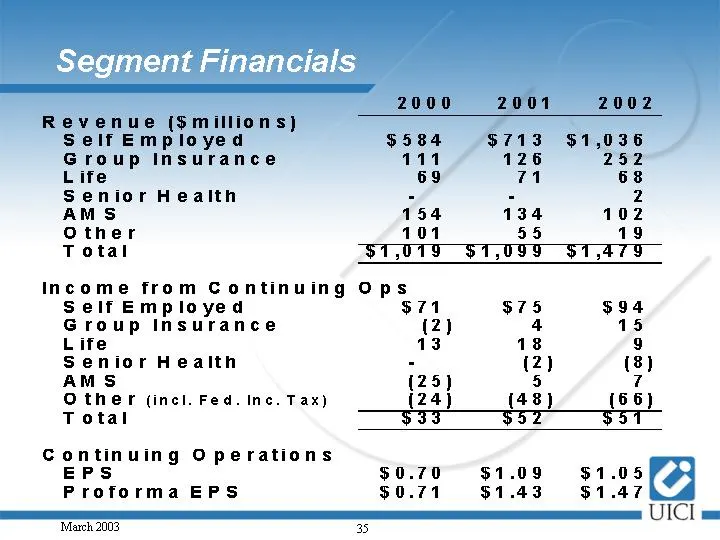
Segment Financials Revenue ($millions) SelfEmployed $584 $713 $1,036 Group Insurance 111 126 252 Life 69 71 63 Senior Health - - = AMS 154 134 102 Other 101 55 19 Total SUT _ $1,099 $1,479 Income from Continuing Ops selfEmployed $71 $75 $94 Group Insurance (2) 4 15 Life 13 18 9 Senior Health x (2) (
Slide 36: Earnings Guidance
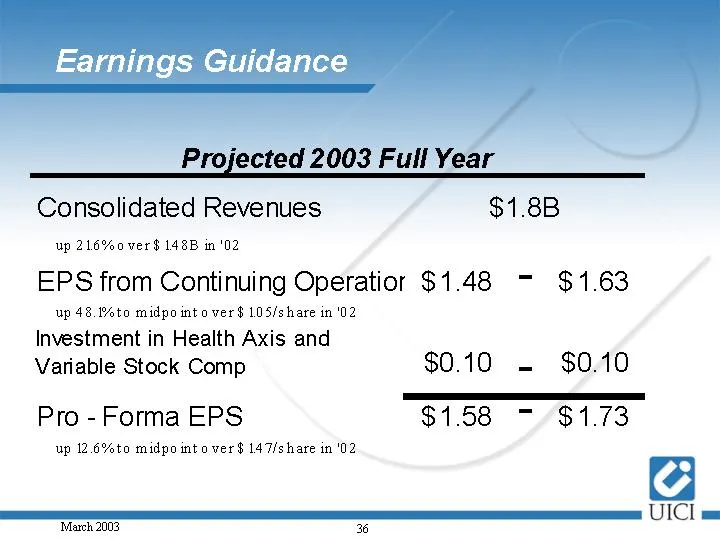
Earnings Guidance Projected 2003 Full Year Consolidated Revenues $1.8B up 216%o ver$ 148B in '02 EPS from Continuing Operatior $1.48 - $1.63 up 48.2%to midpo into ver$ 105/share in ‘02 Investment in Health Axis and Variable Stock Comp $0.10 = $0.10 Pro - Forma EPS $1.58 = $1.73 up 12.6%to midpo into

Slide 37
Source: SEC EDGAR · 8-K filed Mar 3, 2003