Novelis — FY2013 Earnings Presentation
25 slides from Novelis's earnings presentation, May 14, 2013
Slide 1: Novelis Q4 & Fiscal Year 2013 Earnings Conference Call
©2013Novelis Inc. 1 May 14, 2013 Philip Martens President and Chief Executive Officer Steve Fisher Senior Vice President and Chief Financial Officer Novelis Q4 & Fiscal Year 2013 Earnings Conference Call EXHIBIT 99.2
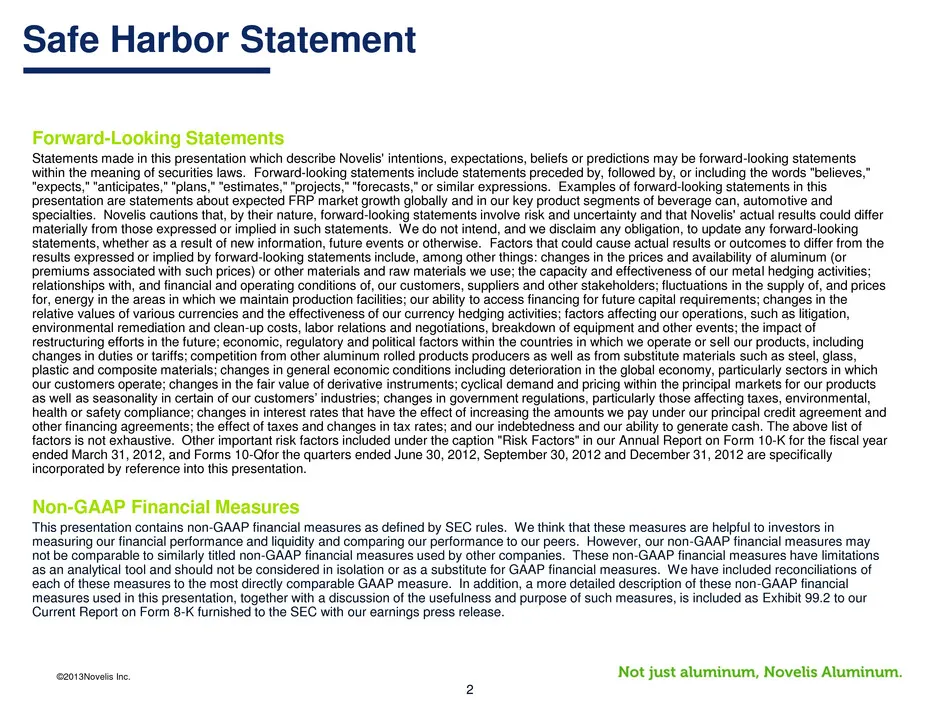
Slide 2: Safe Harbor Statement
©2013Novelis Inc. 2 Safe Harbor Statement Forward-Looking Statements Statements made in this presentation which describe Novelis' intentions, expectations, beliefs or predictions may be forward-looking statements within the meaning of securities laws. Forward-looking statements include statements pr
Slide 3: Agenda
©2013Novelis Inc. 3 Agenda Business Review Novelis Strategy Detailed Financial Performance Summary & Outlook
Slide 4: Business Review
©2013Novelis Inc. 4 Business Review
Slide 5: Fiscal Year 2013 Highlights
©2013Novelis Inc. 5 Fiscal Year 2013 Highlights Strong Recovery in Q4FY13 Driven by Solid Demand, Good Cost Control and Scrap Benefits Solid FY13 Results Despite Unexpected Headwinds Made Significant Progress on All Strategic Initiatives
Slide 6: FY13 Regional Business Performance
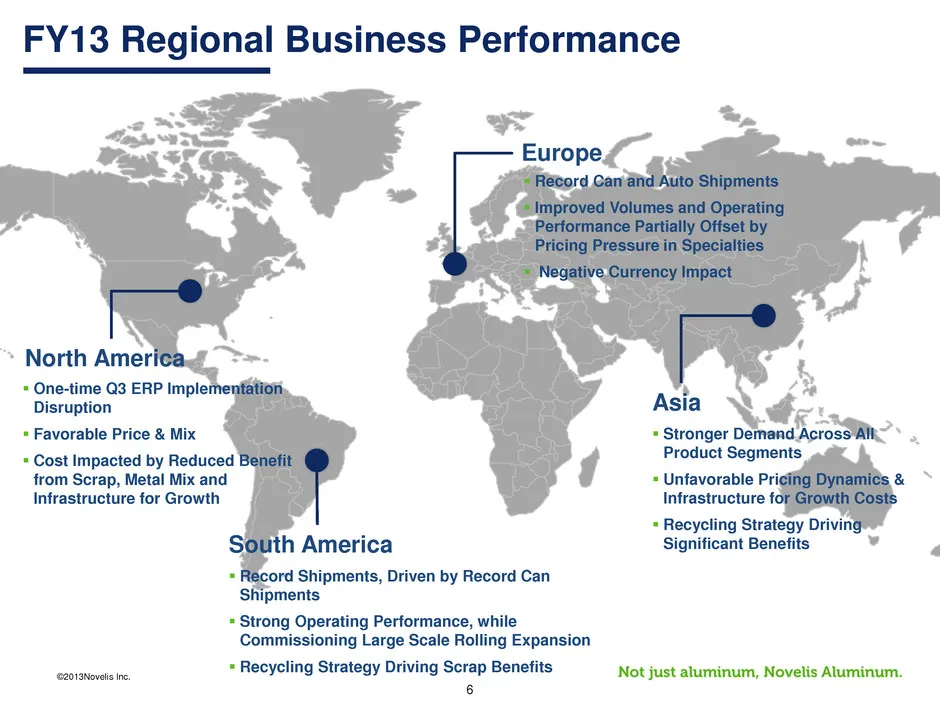
©2013Novelis Inc. 6 FY13 Regional Business Performance Europe Record Can and Auto Shipments Improved Volumes and Operating Performance Partially Offset by Pricing Pressure in Specialties Negative Currency Impact Asia North America South America Stronger Demand Across All Product Segments U
Slide 7: Novelis' Strategy
©2013Novelis Inc. 7 Novelis’ Strategy
Slide 8: Novelis' Strategy – FY13 Actions
©2013Novelis Inc. 8 Novelis’ Strategy – FY13 Actions Divested 3 Foil Plants in Europe Closed Saguenay Plant in Canada Shutdown Ouro Preto Pot Line in Brazil Implemented ERP System in 2 North American Plants Continue to Strengthen the Business Major Rolling Expansions Progressing Well Com
Slide 9: Strong FRP Growth Worldwide (2012-2017)
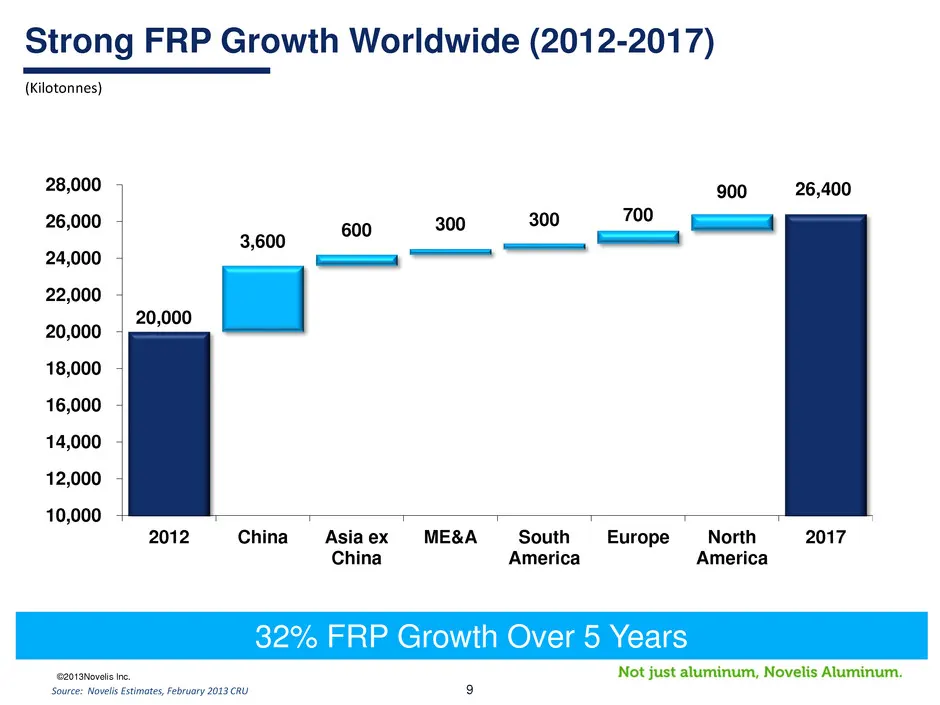
©2013Novelis Inc. 9 20,000 3,600 600 300 300 700 900 26,400 10,000 12,000 14,000 16,000 18,000 20,000 22,000 24,000 26,000 28,000 2012 China Asia ex China ME&A South America Europe North America 2017 (Kilotonnes) Strong FRP Growth Worldwide (2012-2017) Source: Novelis Estimates, February 2013 CRU 32
Slide 10: Long-Term Trends in Aluminum Demand
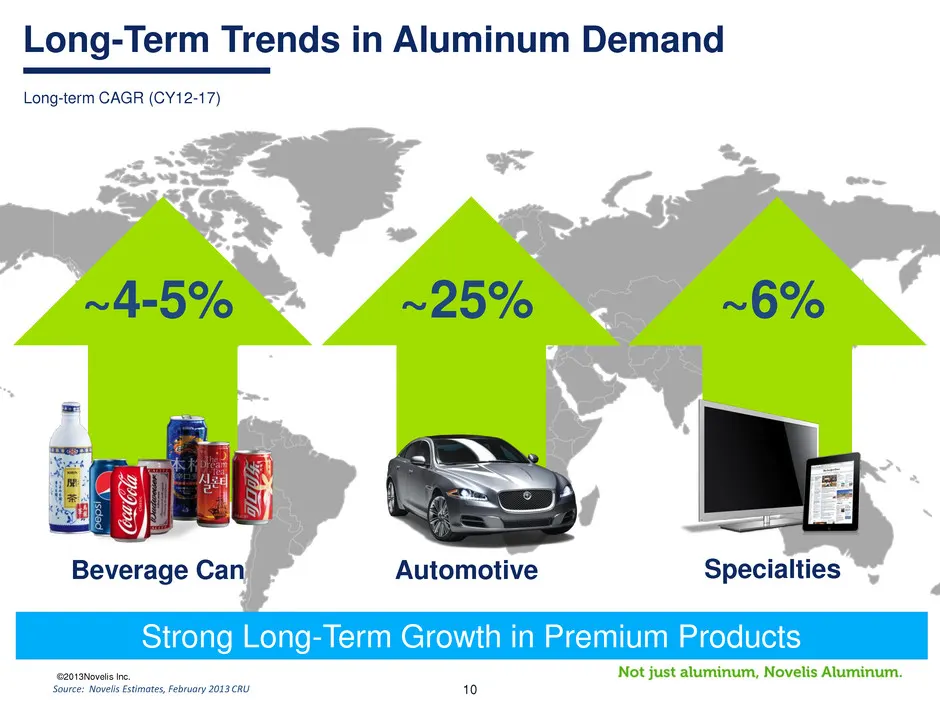
©2013Novelis Inc. 10 Long-Term Trends in Aluminum Demand Beverage Can Automotive Specialties ~4-5% ~25% ~6% Long-term CAGR (CY12-17) Source: Novelis Estimates, February 2013 CRU Strong Long-Term Growth in Premium Products
Slide 11: Global Strategic Investments Solidifying Leadership Position
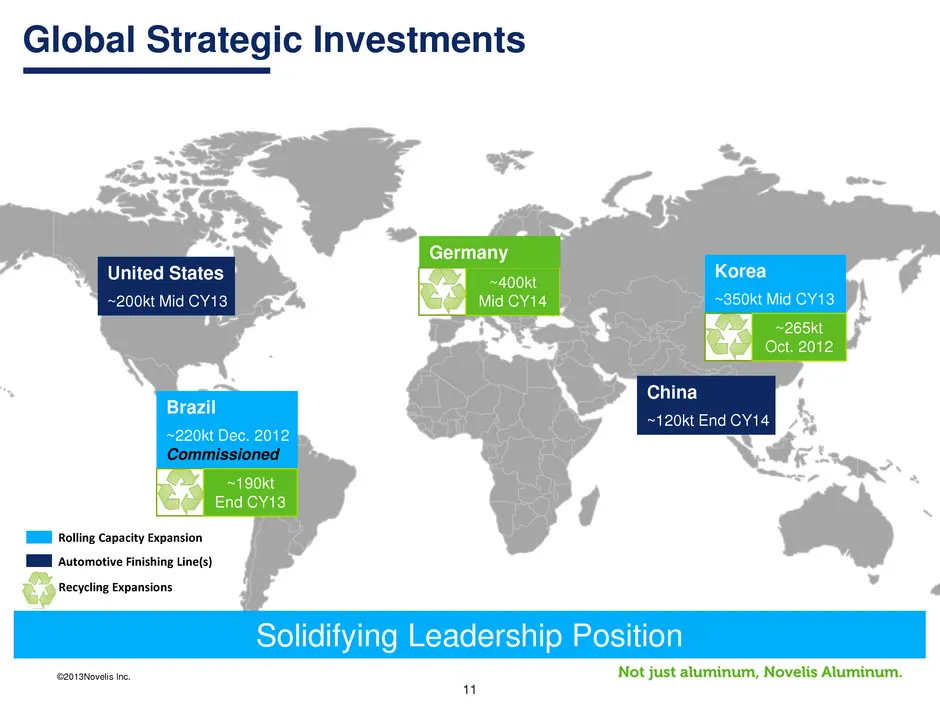
©2013Novelis Inc. 11 Global Strategic Investments Solidifying Leadership Position United States ~200kt Mid CY13 Korea ~350kt Mid CY13 China ~120kt End CY14 Brazil ~220kt Dec. 2012 Commissioned Rolling Capacity Expansion Automotive Finishing Line(s) ~190kt End CY13 ~400kt Mid CY14 ~265kt Oct. 2012 Ge
Slide 12: Detailed Financial Performance
©2013Novelis Inc. 12 Detailed Financial Performance
Slide 13: Fourth Quarter Highlights
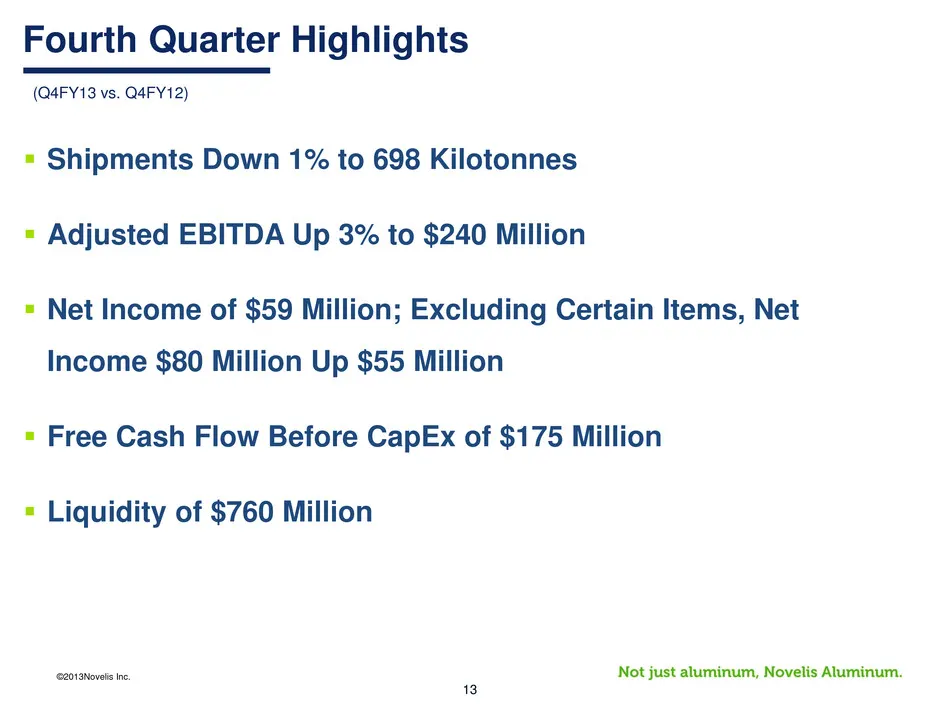
©2013Novelis Inc. 13 Fourth Quarter Highlights Shipments Down 1% to 698 Kilotonnes Adjusted EBITDA Up 3% to $240 Million Net Income of $59 Million; Excluding Certain Items, Net Income $80 Million Up $55 Million Free Cash Flow Before CapEx of $175 Million Liquidity of $760 Million (Q4FY13 v
Slide 14: Shipments & Sales
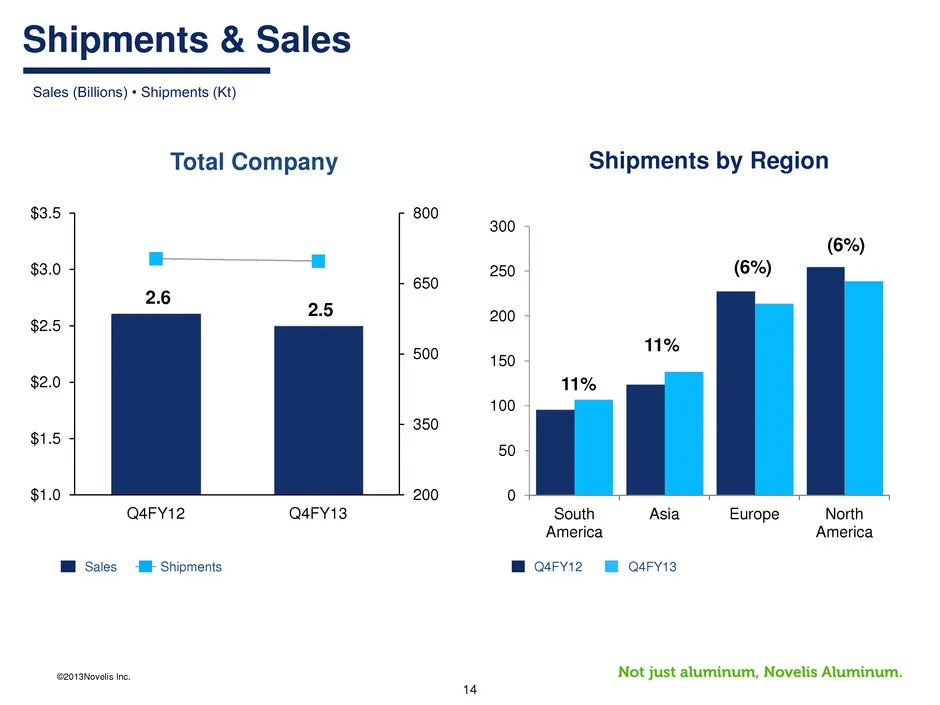
©2013Novelis Inc. 14 2.6 2.5 200 350 500 650 800 $1.0 $1.5 $2.0 $2.5 $3.0 $3.5 Q4FY12 Q4FY13 Shipments Sales 0 50 100 150 200 250 300 South America Asia Europe North America Q4FY13 Q4FY12 11% (6%) (6%) 11% Sales (Billions) • Shipments (Kt) Shipments & Sales Total Company Shipments by Region
Slide 15: Q4FY13 Adjusted EBITDA
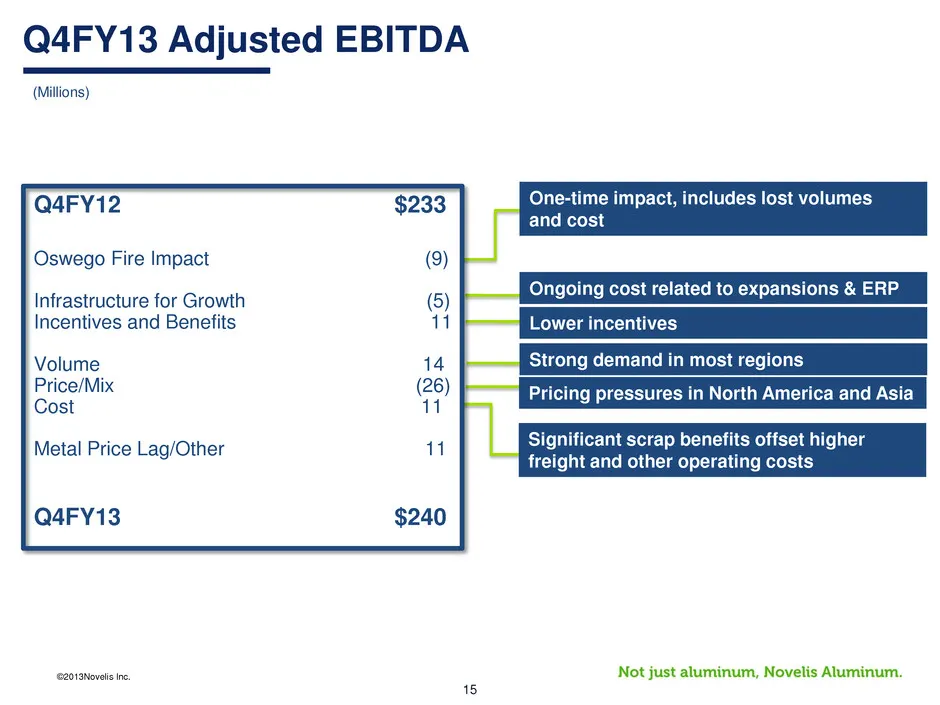
©2013Novelis Inc. 15 Q4FY13 Adjusted EBITDA (Millions) Q4FY12 $233 Oswego Fire Impact (9) Infrastructure for Growth (5) Incentives and Benefits 11 Volume 14 Price/Mix (26) Cost 11 Metal Price Lag/Other 11 Q4FY13 $240 One-time impact, includes lost volumes and cost Lower incentives Strong demand in m
Slide 16: EBITDA & Shipment Trend
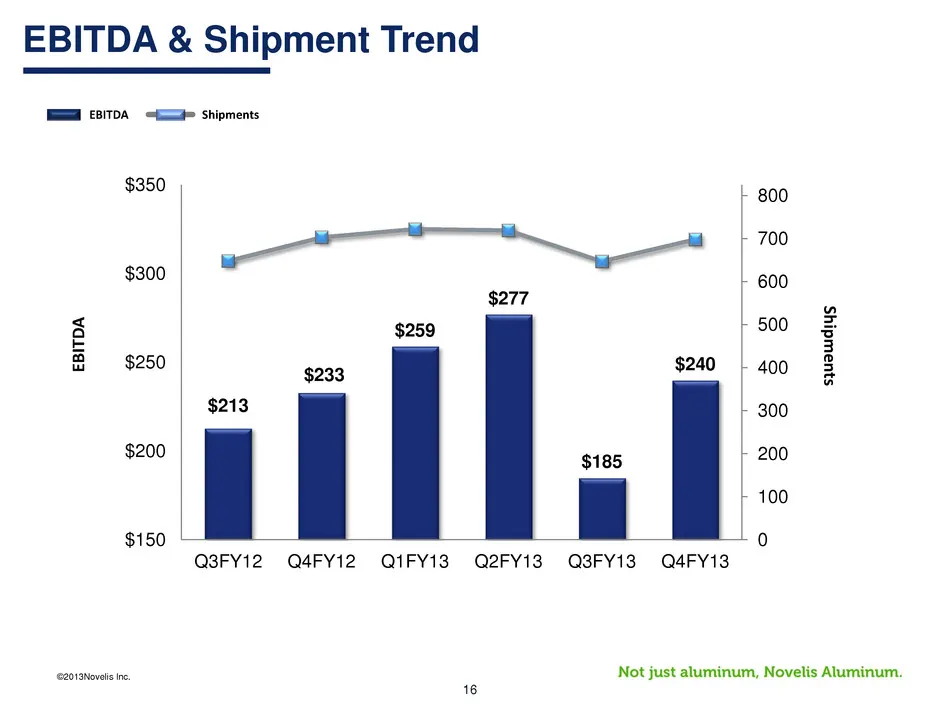
©2013Novelis Inc. 16 EBITDA & Shipment Trend $213 $233 $259 $277 $185 $240 0 100 200 300 400 500 600 700 800 $150 $200 $250 $300 $350 Q3FY12 Q4FY12 Q1FY13 Q2FY13 Q3FY13 Q4FY13 Shipme n ts EBIT D A Shipments EBITDA
Slide 17: Capital Expenditures & Free Cash Flow Before Capex
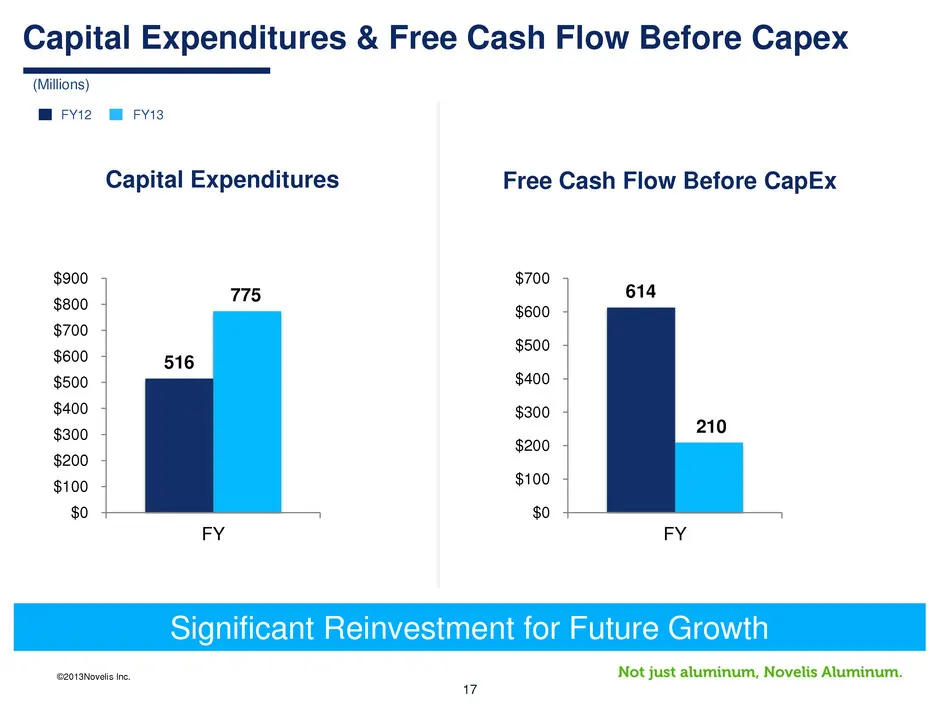
©2013Novelis Inc. 17 (Millions) Capital Expenditures & Free Cash Flow Before Capex FY13 FY12 Significant Reinvestment for Future Growth 614 210 $0 $100 $200 $300 $400 $500 $600 $700 FY 516 775 $0 $100 $200 $300 $400 $500 $600 $700 $800 $900 FY Free Cash Flow Before CapEx Capital Expenditures

Slide 18: Summary & Outlook
©2013Novelis Inc. 18 Summary & Outlook
Slide 19: Summary
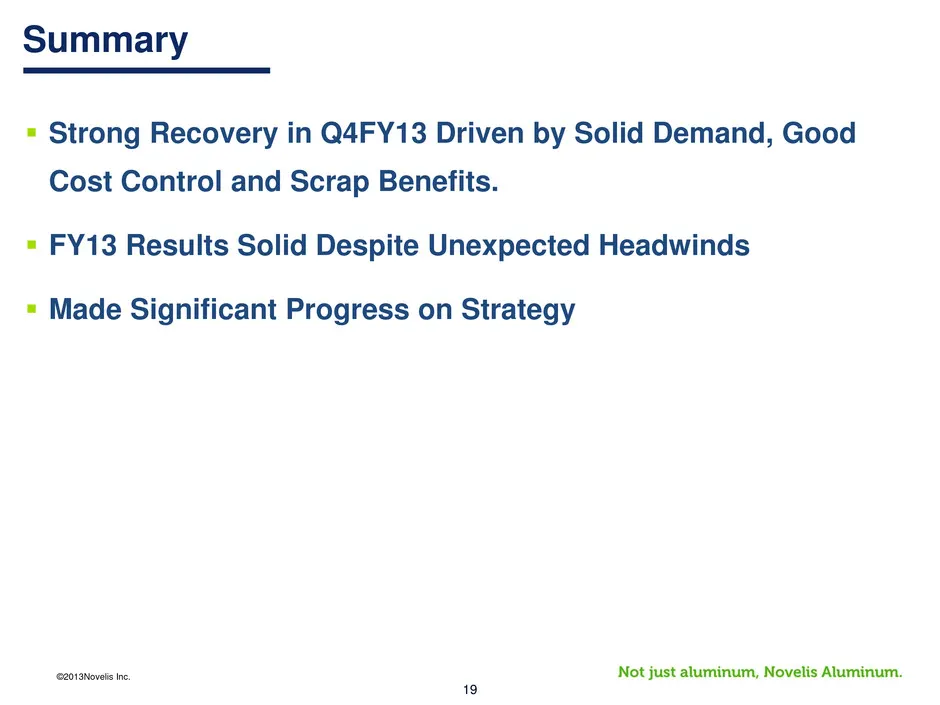
©2013Novelis Inc. 19 Summary Strong Recovery in Q4FY13 Driven by Solid Demand, Good Cost Control and Scrap Benefits. FY13 Results Solid Despite Unexpected Headwinds Made Significant Progress on Strategy
Slide 20: Outlook
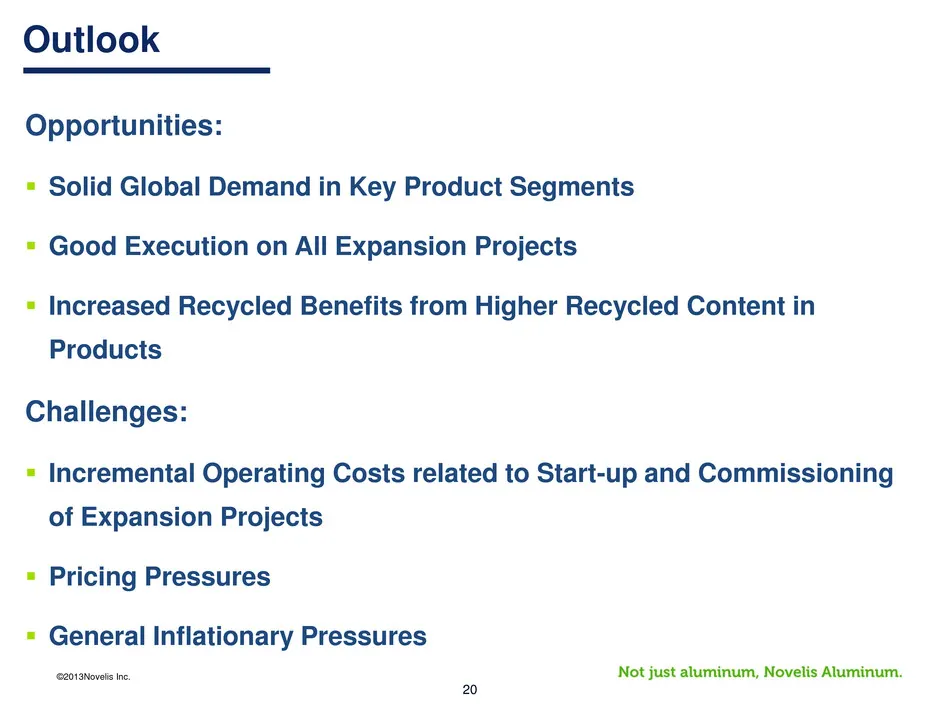
©2013Novelis Inc. 20 Outlook Opportunities: Solid Global Demand in Key Product Segments Good Execution on All Expansion Projects Increased Recycled Benefits from Higher Recycled Content in Products Challenges: Incremental Operating Costs related to Start-up and Commissioning of Expansion Pro
Slide 21: Questions & Answers
©2013Novelis Inc. 21 Questions & Answers

Slide 22: Appendix
©2013Novelis Inc. 22 Appendix
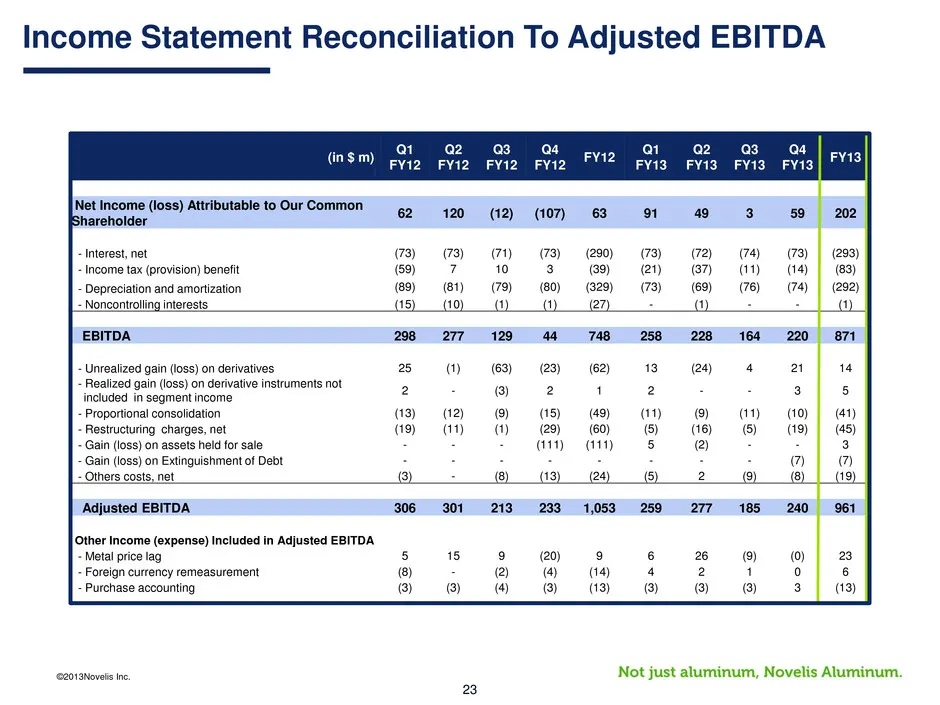
Slide 23: EBITDA Reconciliation
©2013Novelis Inc. 23 (in $ m) Q1 FY12 Q2 FY12 Q3 FY12 Q4 FY12 FY12 Q1 FY13 Q2 FY13 Q3 FY13 Q4 FY13 FY13 Net Income (loss) Attributable to Our Common Shareholder 62 120 (12) (107) 63 91 49 3 59 202 - Interest, net (73) (73) (71) (73) (290) (73) (72) (74) (73) (293) - Income tax (provision) benefit (5
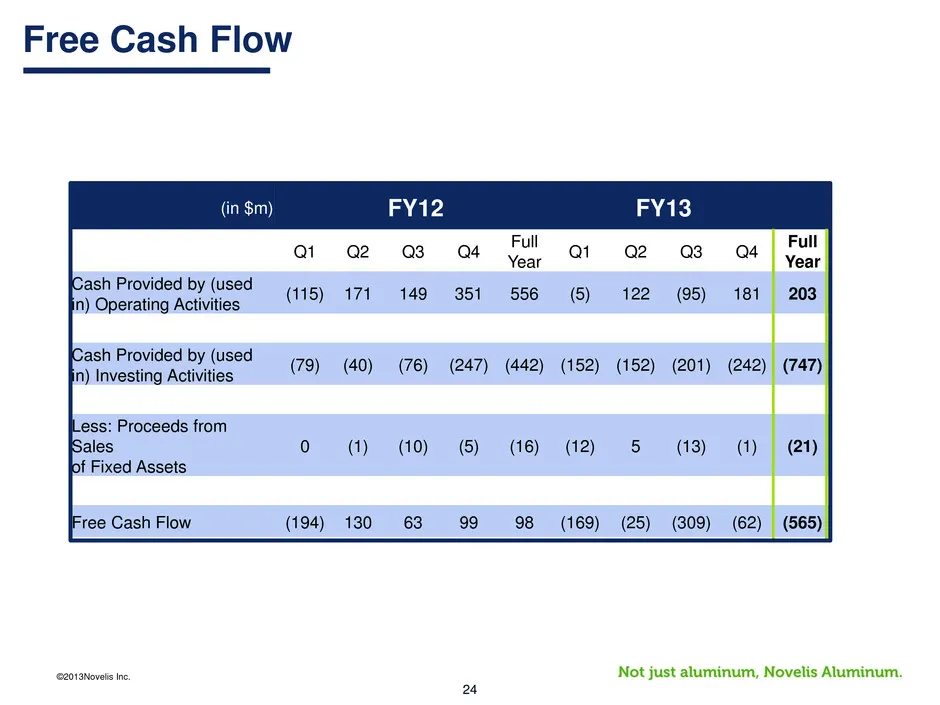
Slide 24: Free Cash Flow Reconciliation
©2013Novelis Inc. 24 (in $m) FY12 FY13 Q1 Q2 Q3 Q4 Full Year Q1 Q2 Q3 Q4 Full Year Cash Provided by (used in) Operating Activities (115) 171 149 351 556 (5) 122 (95) 181 203 Cash Provided by (used in) Investing Activities (79) (40) (76) (247) (442) (152) (152) (201) (242) (747) Less: Proceeds from S
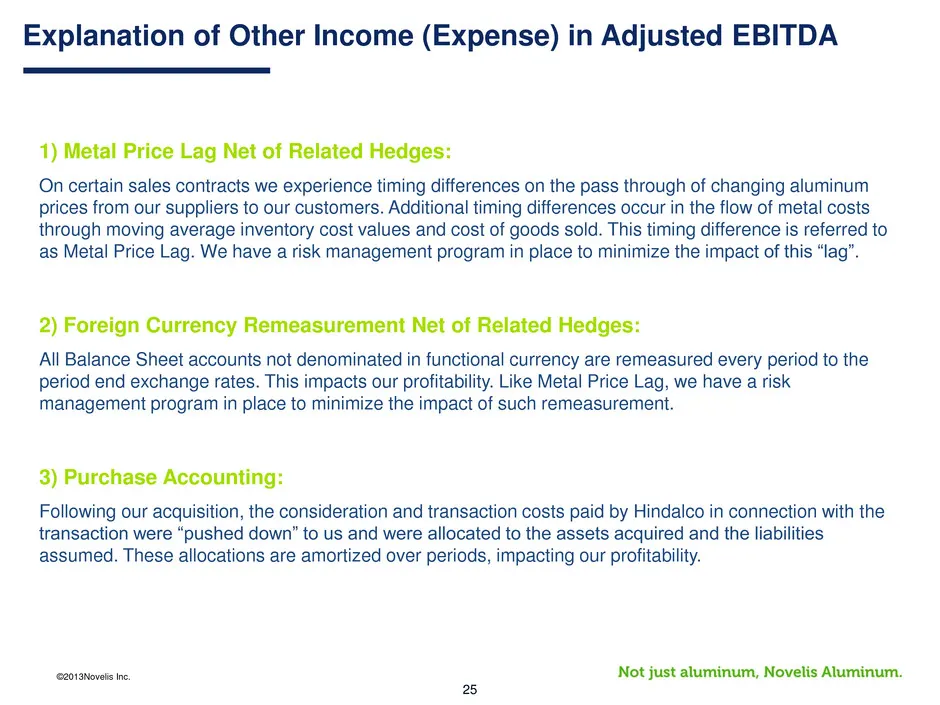
Slide 25: Definitions of Metal Price Lag, Currency Remeasurement, Purchase Accounting
©2013Novelis Inc. 25 1) Metal Price Lag Net of Related Hedges: On certain sales contracts we experience timing differences on the pass through of changing aluminum prices from our suppliers to our customers. Additional timing differences occur in the flow of metal costs through moving average invent
Source: SEC EDGAR · 8-K filed May 14, 2013
More decks from Novelis Inc.
 Q2 FY2027 Earnings Presentation20 slides · Nov 5, 2026
 Q2 FY2027 Earnings Presentation31 slides · Nov 5, 2026
 Q1 FY2027 Earnings Presentation21 slides · Aug 5, 2026
 Q1 FY2027 Earnings Presentation31 slides · Aug 5, 2026
 Q4 FY2026 Earnings Presentation33 slides · May 19, 2026
 Q3 FY2026 Earnings Presentation33 slides · Feb 11, 2026