Allegheny Energy — Edison Electric Institute Financial Conference 2005
31 slides from Allegheny Energy's conference presentation, Nov 7, 2005
Slide 1: Allegheny Energy - Edison Electric Institute Financial Conference
Allegheny Energy Edison Electric Institute Financial Conference November 6-9, 2005 Exhibit 99.1
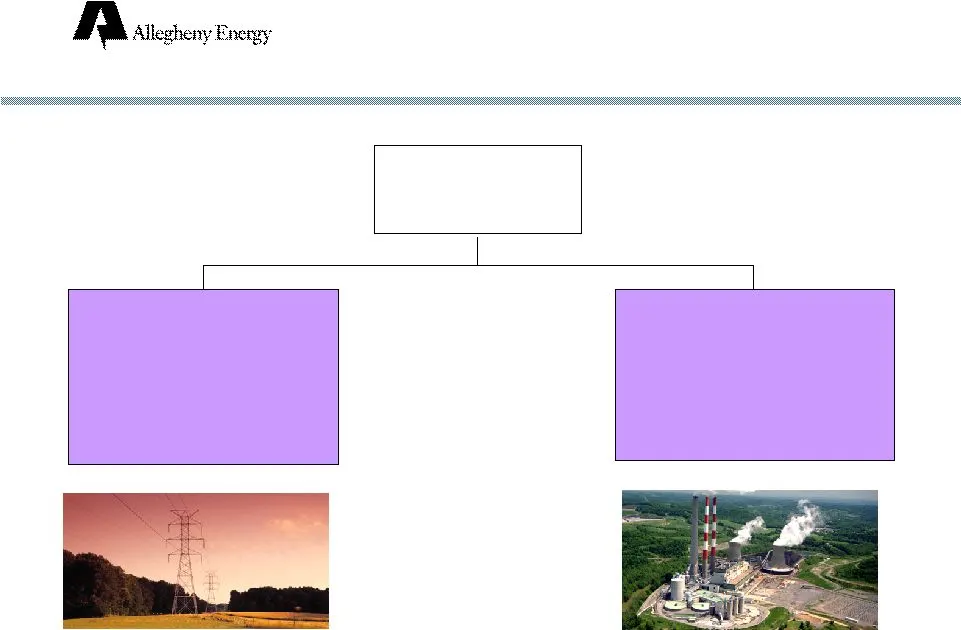
Slide 2: Generation and Delivery
Generation Delivery Allegheny Energy Allegheny Energy Coal-fired, PJM 47.8 million MWH* 1.6 million customers, PA-MD-WV-VA-OH * 12 months ended September 30, 2005
Slide 3: Turnaround: Entering a Growth Phase
• Restructured and reduced debt • Strengthened financial reporting, internal controls • Refocused on core business • Launched high performance organization • Returned to profitability Turnaround Entering a Growth Phase Growth
Slide 4: Earnings Growth Drivers
Earnings Growth Drivers Reduce interest expense Decrease O&M expense Improve plant availability Increase Pennsylvania POLR rates Transition to market-based rates

Slide 5: Growth Driver: Reduce Interest Expense
Growth Driver: Reduce Interest Expense Goal: reduce debt by $1.5 billion (Dec. 1, – Dec. 31, 2005) Achieved: $1.9 billion* (through Oct. 15, 2005) Potential future sources: Ohio sale, other asset sales, cash flow Projected reduction in interest expense: ~$65 million in 2006 * Includes tender offer f
Slide 6: Growth Driver: Decrease O&M Expense
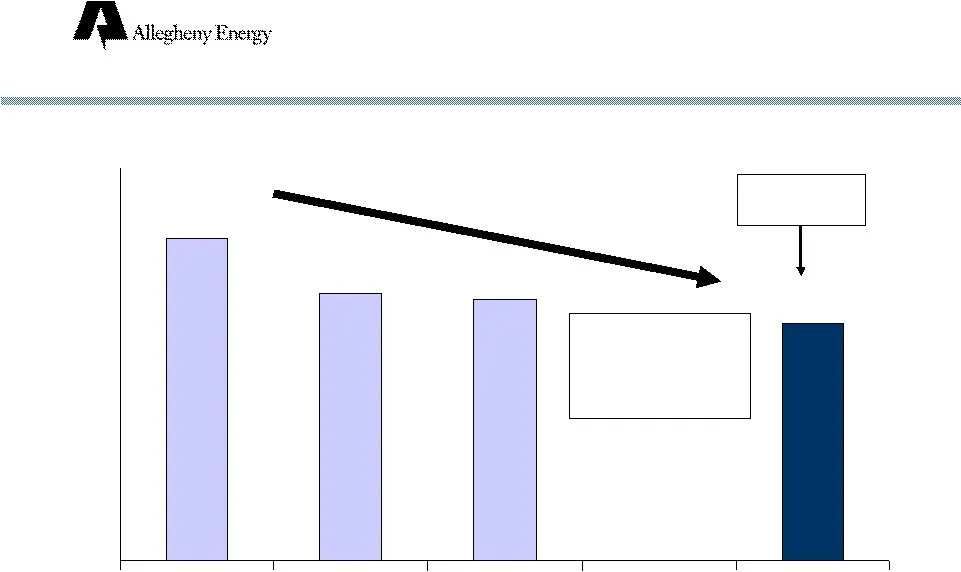
$818 <$800 $985 $700-750 Growth Driver: Decrease O&M Expense Target Further decrease
Slide 7: Growth Driver: Improve Plant Availability
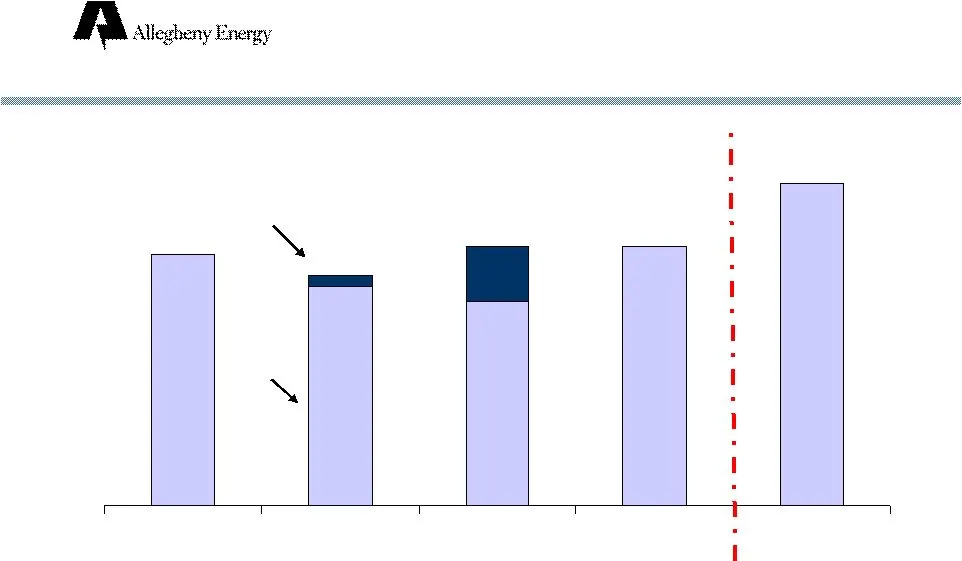
83% 78% 82% 76% 79% 91% 83% Goal Proforma* Actual * Adjusted for extended outages at Hatfield, Pleasants Improvement of ~$100 million if goal achieved (supercritical units) Est. Growth Driver: Improve Plant Availability
Slide 8: Achieving 91% Availability by 2008
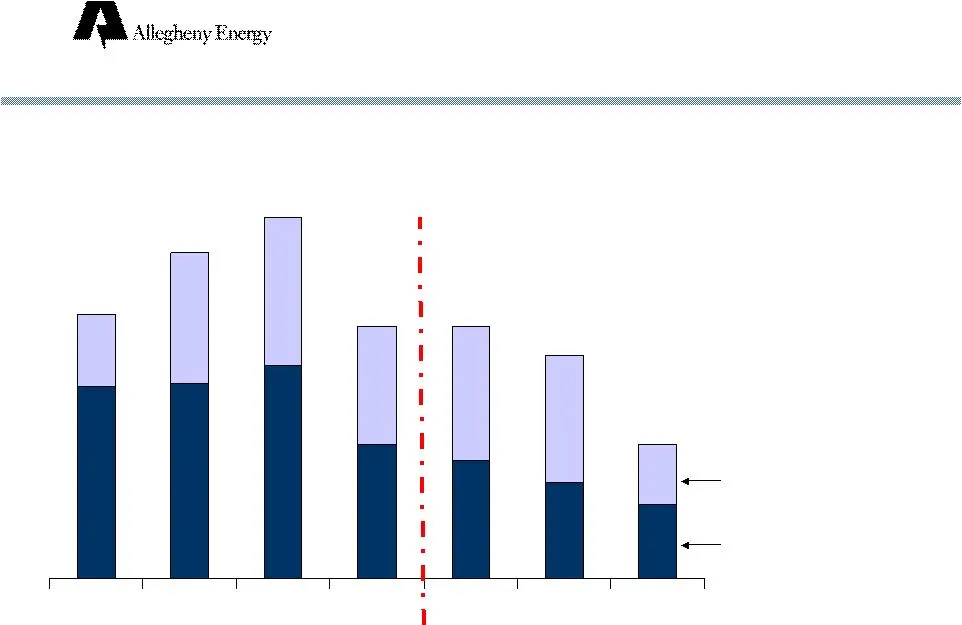
Achieving 91% Availability by 2008 Outage Rate (supercritical units) 22% 24% 17% 17% 15% 9% Reduce planned outages Reduce unplanned outages 18%
Slide 9: Growth Driver: Increase Pennsylvania POLR Rates
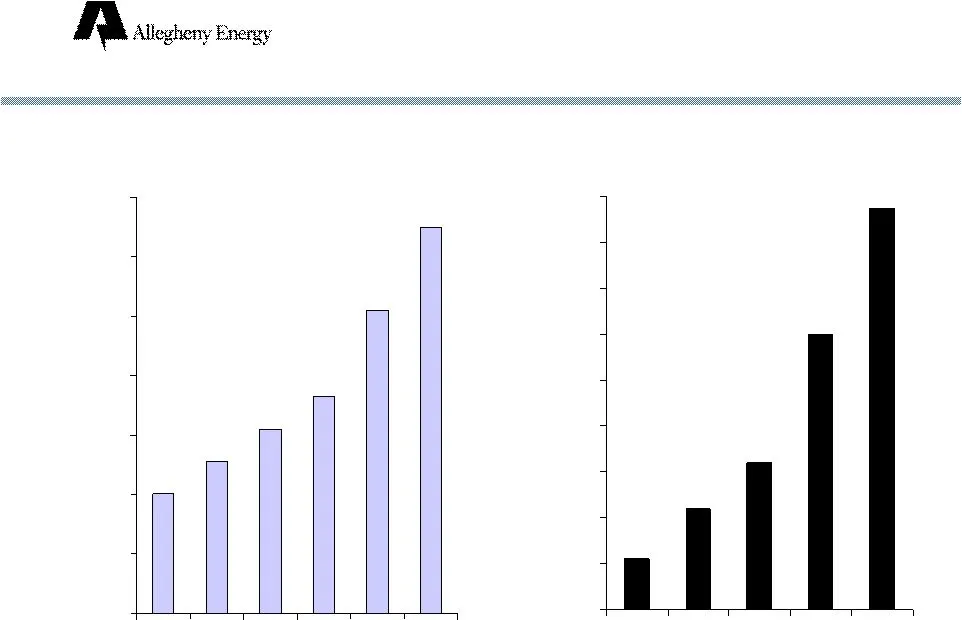
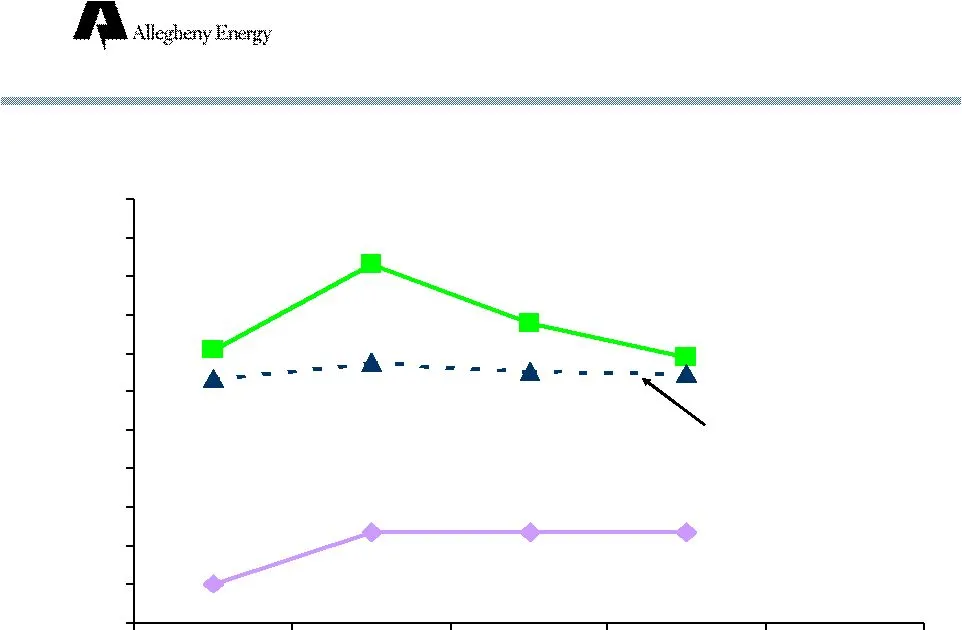
$20 $25 $30 $35 $40 $45 $50 $55 $0 $50 $100 $150 $200 $250 $300 $350 $400 $450 Generation Rate $ per MWH Cumulative Increase in Pre-Tax Operating Income $ millions; estimates Growth Driver: Increase Pennsylvania POLR Rates
Slide 10: Growth Driver: Transition to Market-Based Rates
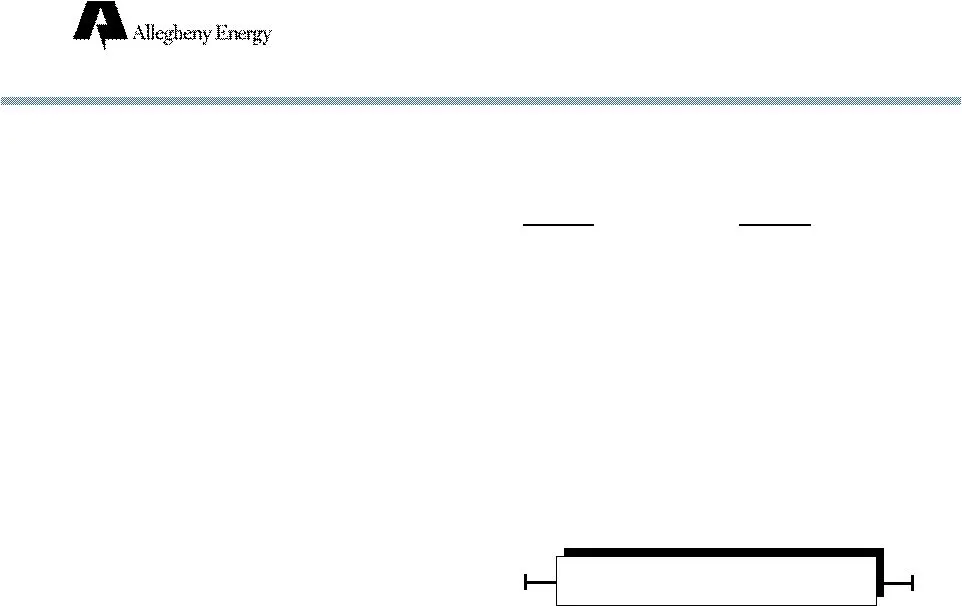
Growth Driver: Transition to Market-Based Rates Market: Current POLR: Maryland, Ohio Generation Rates $ per MWH Assumption for 2006 Outlook $25 $30 $35 $40 $45 $50 $55 $60 $65 $70 $75 $80
Slide 11: Growth Driver: Transition to Market-Based Rates
Growth Driver: Transition to Market-Based Rates State Maryland, Maryland Ohio MWH transitioning 4.8 million 3.5 million to market Increase in pre-tax income $90 million $60 million Total: $150 million

Slide 12: Managing Risk and Limiting Exposure
Managing Risk and Limiting Exposure Managing regulatory/political risk Reducing SO emissions Contracting coal supply needs
Slide 13: Reducing SO2 Emissions: Action Plan
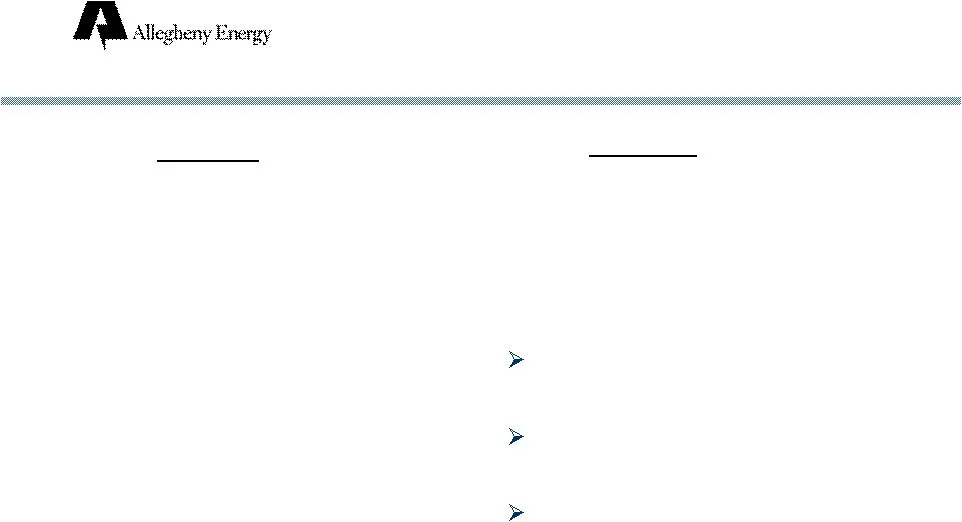
Reducing SO Emissions: Action Plan Under consideration Hatfield scrubbers (Pennsylvania) Seeking regulatory approvals Funded by securitized surcharge In service 2010 Fort Martin scrubbers (West Virginia) By early 2008 Close Pleasants bypass STATUS Began in 3 rd quarter 2005 Low-sulfur PRB coal ACTIO
Slide 14: Coal Supply Under Contract
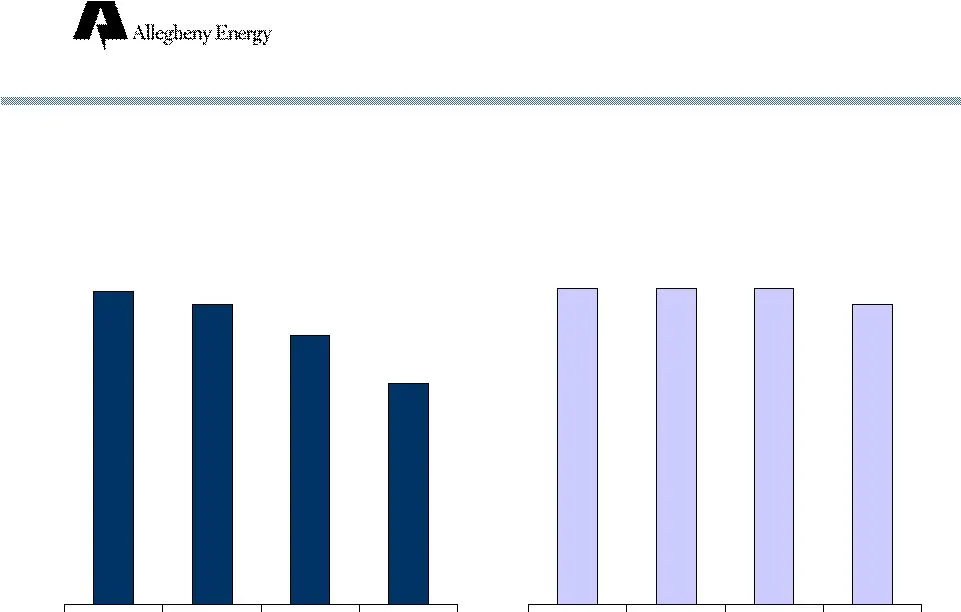
Coal Supply Under Contract 99% 95% 85% 70% % of Total Requirements 100% 100% 100% 95% % of POLR Requirements
Slide 15: Coal Costs and Usage
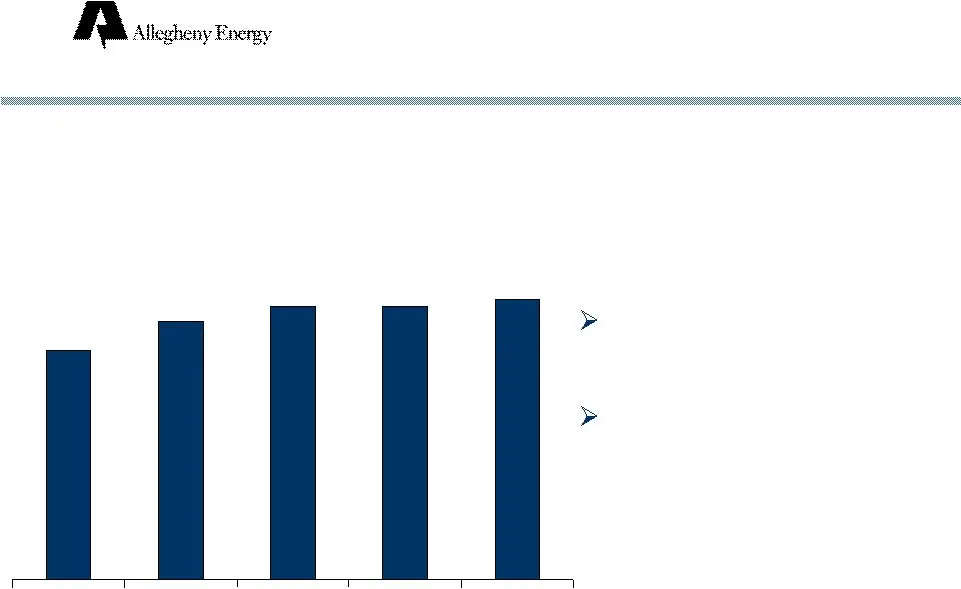
Coal Costs and Usage $38 $31 $35 $37 $37 Average Delivered Cost/Ton Existing contracts only Currently burn 18 million tons/year Expect to burn over 19 million tons in 2006 Increasing Coal Tonnage
Slide 16: Transforming Allegheny Energy
Transforming Allegheny Energy Financial Operational Environmental Risk profile Earnings growth
Slide 17: Improving Financial Results
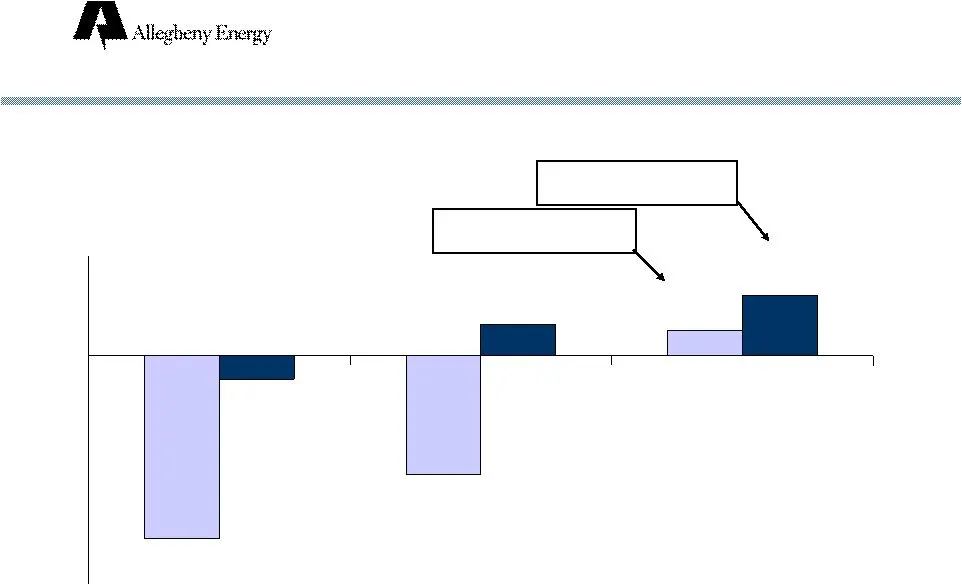
Improving Financial Results ($2.80) ($1.83) $0.38 ($0.37) $0.47 $0.90 As Reported As Adjusted (9 Months) Earnings per share; diluted
Slide 18: Increasing Free Cash Flow
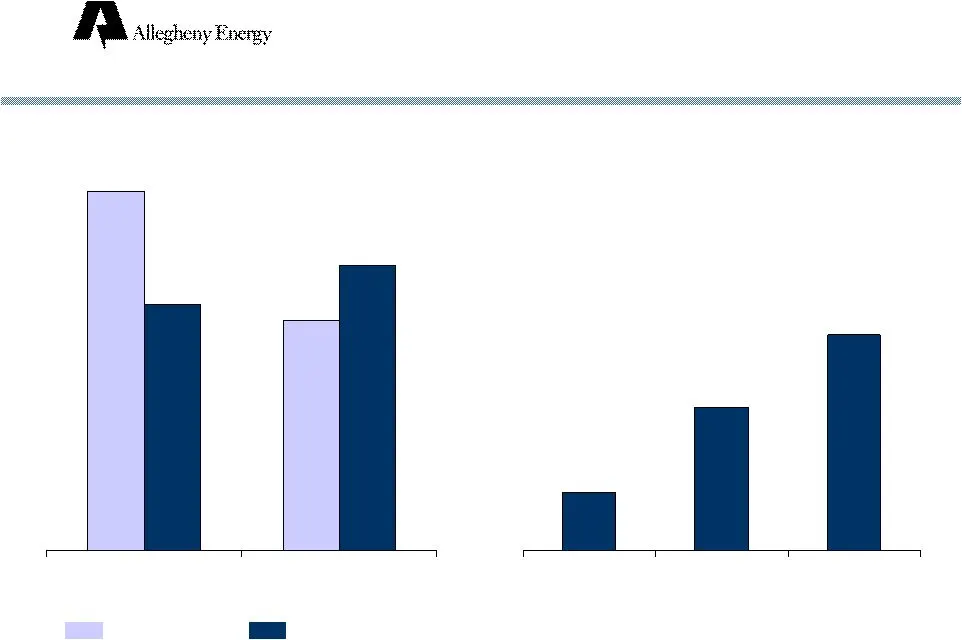
Increasing Free Cash Flow ($ millions) Cash from Operations Free Cash Flow (adjusted cash from operations net of capital expenditures) $507 $326 $403* $347* $81 $199 >$300 (9 months) (9 months) As reported As adjusted * 2004 excludes OVEC proceeds and California contract escrow release. 2005 exclude
Slide 19: Strengthening the Balance Sheet
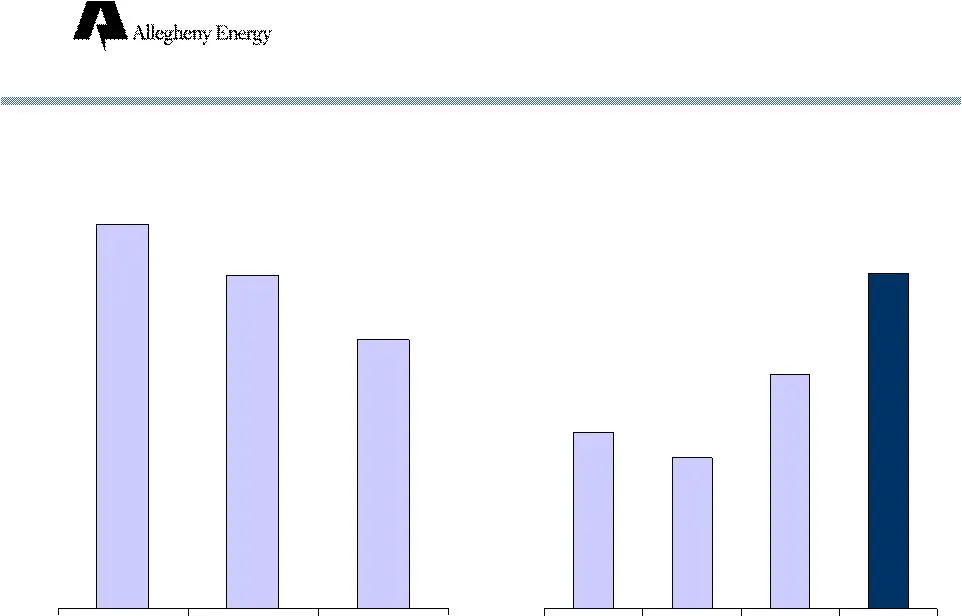
Achieve Investment Grade Rating: Strengthening the Balance Sheet Debt Outstanding ($ billions) Sept. Sept. Sept. Equity Ratio 21% 18% 28% >40% Sept. Sept. Sept. $6.0 $5.2 $4.2 Target
Slide 20: Improving Credit Statistics
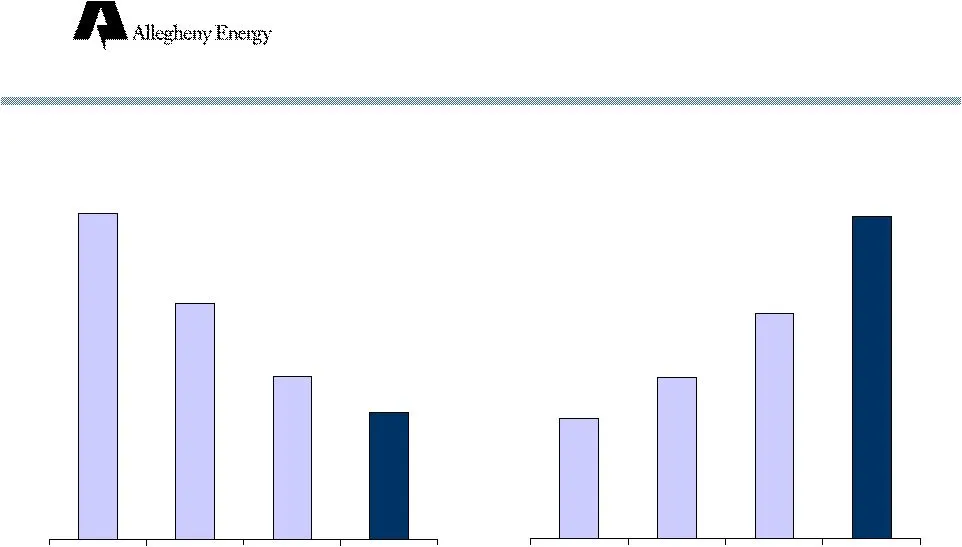
Achieve Investment Grade Rating: Improving Credit Statistics 9.0 6.5 4.5 <3.5 Dec. Dec. Sept. Target Debt/EBITDA* 1.5 2.0 2.8 >4.0 Dec. Dec. Sept. Target EBITDA/Interest* * based on adjusted EBITDA and adjusted interest for 12-month periods

Slide 21: Earnings (Loss) Per Share
Earnings (Loss) Per Share As Reported As Adjusted 2003: Q1 $ (0.46) $ (0.32) Q2 (1.82) (0.23) Q3 (0.40) 0.11 Q4 (0.11) (0.14) Year (2.80) (0.37) 2004: Q1 $ 0.25 $ (0.03) Q2 (0.31) (0.21) Q3 (2.40) 0.37 Q4 0.48 0.22 Year (1.83) 0.47 2005: Q1 $ 0.29 $ 0.39 Q2 (0.12) 0.08 Q3 0.21 0.45 Year to date 0.38
Slide 22: The Road to Recovery: Stock Price Performance
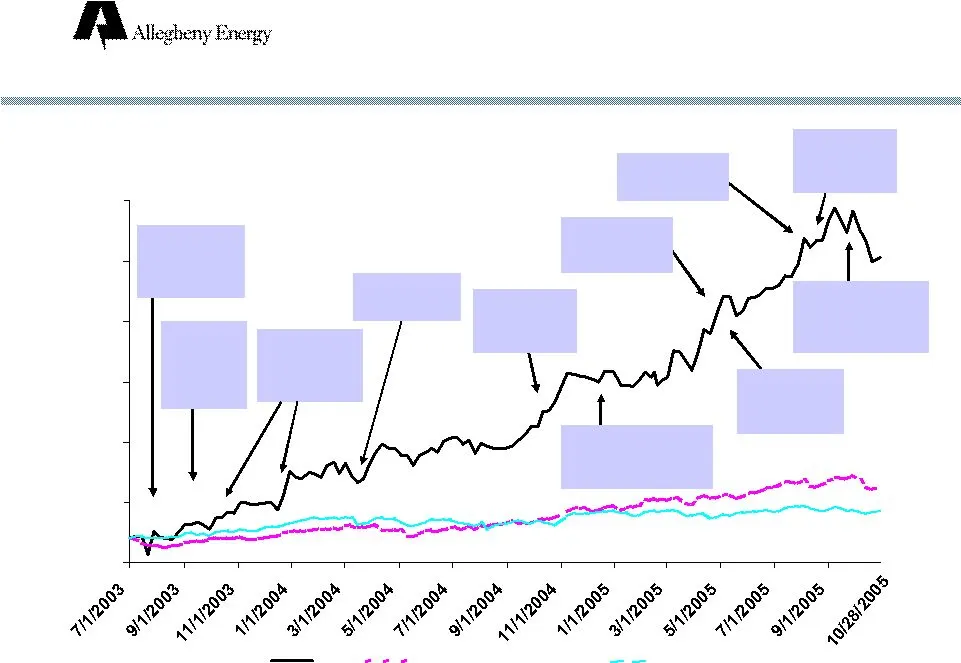
$80 $130 $180 $230 $280 $330 $380 AYE Dow Electric Utilities S&P 500 Brought reporting up to date PA rate proposal approved Completed convertible financing Completed tender offer Completed equity financing Completed OVEC, Lincoln sales Exited Western energy markets Refinanced bank debt Completed Whe

Slide 23: Vision: Top Performing Utility by Year-End 2007
Financial Performance Engaged Employees Environmental Stewardship Shareholder Value Operational Excellence Customer Satisfaction Enhance Operating Performance VISION: “To Be a Top Performing Utility by Year-End 2007”
Slide 24: Generation and Marketing: Overview
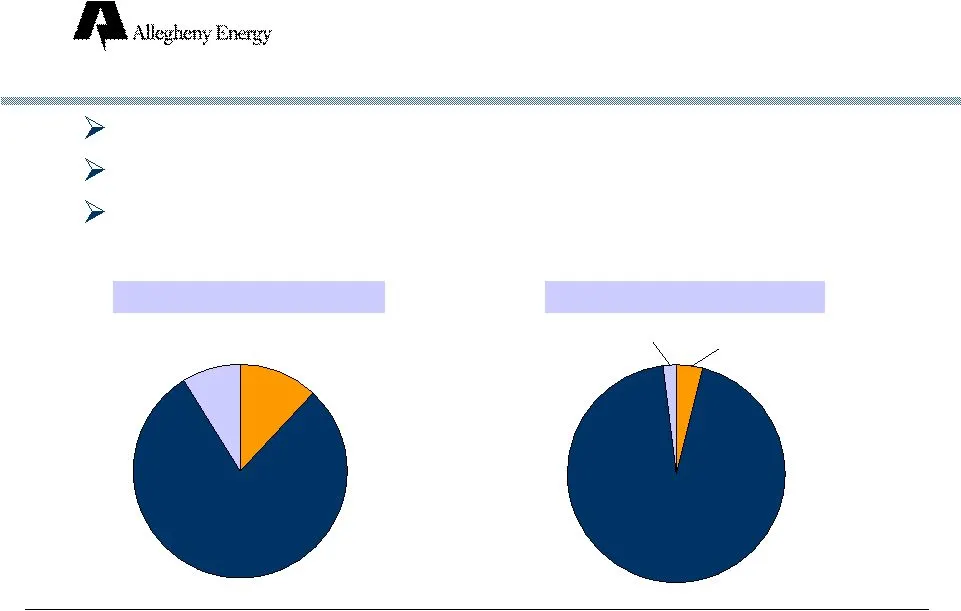
Generation and Marketing: Overview Capacity Coal 94% Gas 2% Hydro & Oil 4% * For year ended December 31, 2004 Capacity: 9,611 MW Primarily base load coal-fired plants Predominantly in Pennsylvania-New Jersey-Maryland (“PJM”) region Hydro & Oil 12% Gas 9% Coal 79% MWH Output*
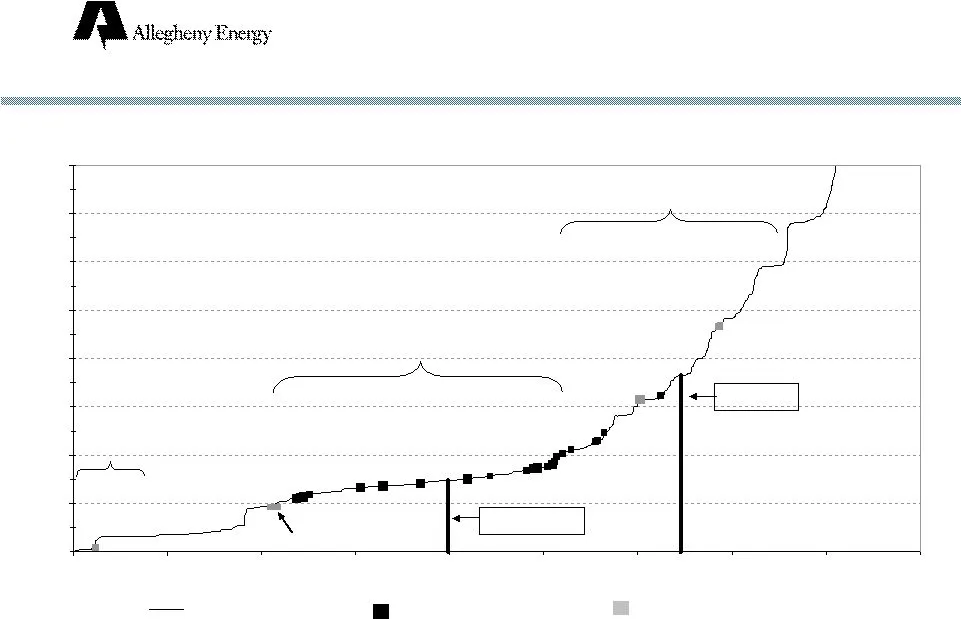
Slide 25: Low-Cost Generation Fleet
$0 $20 $40 $60 $80 $100 $120 $140 $160 20,000 40,000 60,000 80,000 100,000 120,000 140,000 160,000 180,000 Low-Cost Generation Fleet Allegheny has an advantaged dispatch in PJM PJM Dispatch Cost (Ozone Season): $/MWh Dispatch curve assumptions: natural gas delivered at approximately $9.00/mmBTU; coa
Slide 26: PJM -- An Attractive Market
World’s largest competitive power market 51 million people 700 million MWH of energy annually 160,000 MW of capacity Nation’s most liquid spot power market Model for FERC’s proposed Standard Market Design Provides transactional flexibility: contracts not required Generation and Marketing: PJM -- An
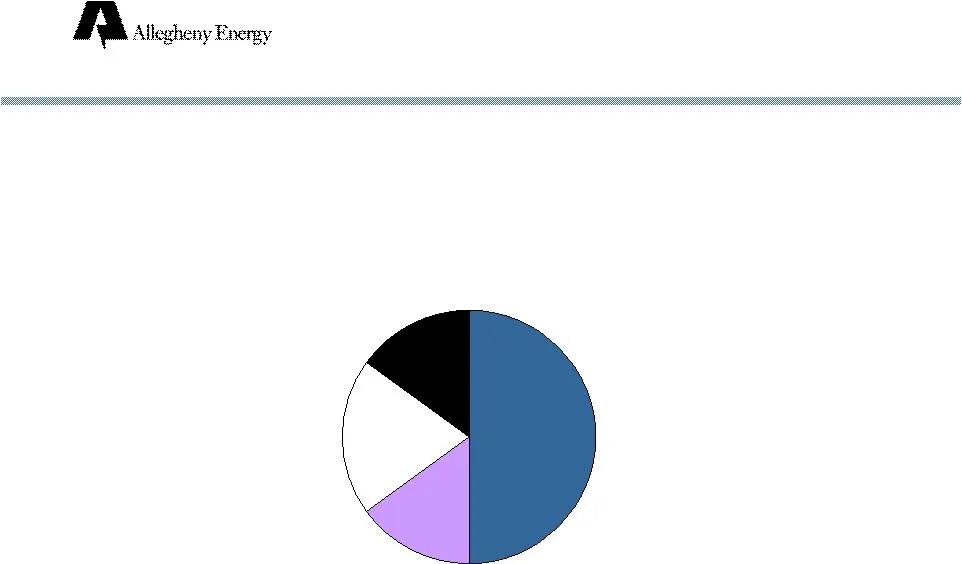
Slide 27: Only 15% of Coal Delivered by Rail
Only 15% of Coal Delivered by Rail Note: Some barge coal originates on short line railroads. Rail 15% Barge 50% Conveyor 15% Truck 20% Coal Delivery Methods
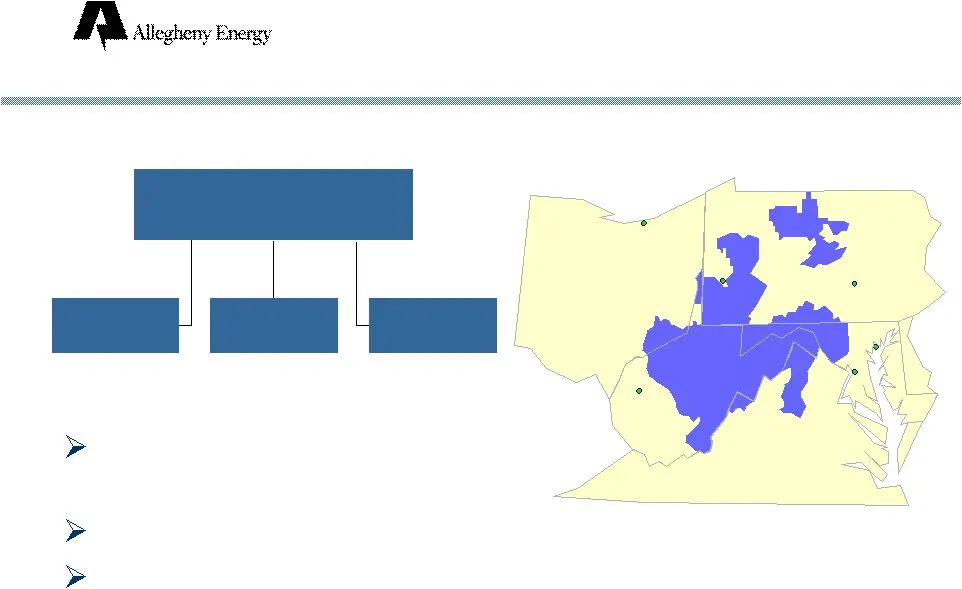
Slide 28: Delivery and Services: Overview
Allegheny Power West Penn Power Monongahela Power Potomac Edison WEST VIRGINIA Delivery and Services: Overview In 5 states (PA, WV, MD, VA, OH) 1.6 million electric customers Load growth: 2.2% compounded annually (1994-2004) VIRGINIA CHARLESTON OHIO HARRISBURG MARYLAND KENTUCKY PENNSYLVANIA CLEVELAN
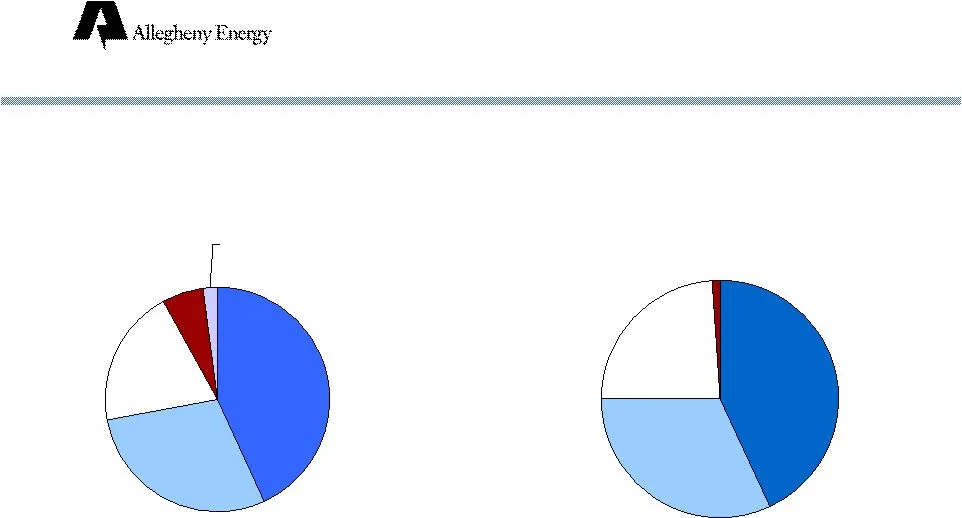
Slide 29: Delivery and Services: Retail Revenue Mix, 2004
PA 43% WV 29% MD 20% VA 6% OH 2% Delivery and Services: Retail Revenue Mix, 2004 By State By Customer Class Residential 43% Industrial 32% Commercial 24% Other 1%
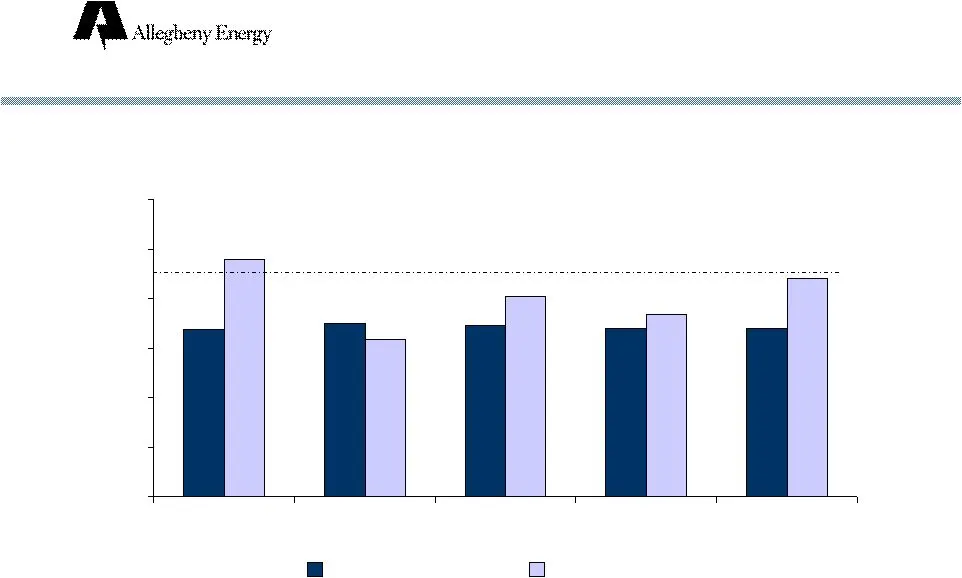
Slide 30: Delivery and Services: Competitive Rates
6.77 7.01 6.94 6.81 6.82 9.58 6.33 8.08 7.37 8.84 0.00 2.00 4.00 6.00 8.00 10.00 12.00 Pennsylvania West Virginia Maryland Virginia Ohio Allegheny Power State Average Delivery and Services: Competitive Rates National Average = 9.15 ¢/kWh Residential Rates ¢/kWh as of January 1, 2005
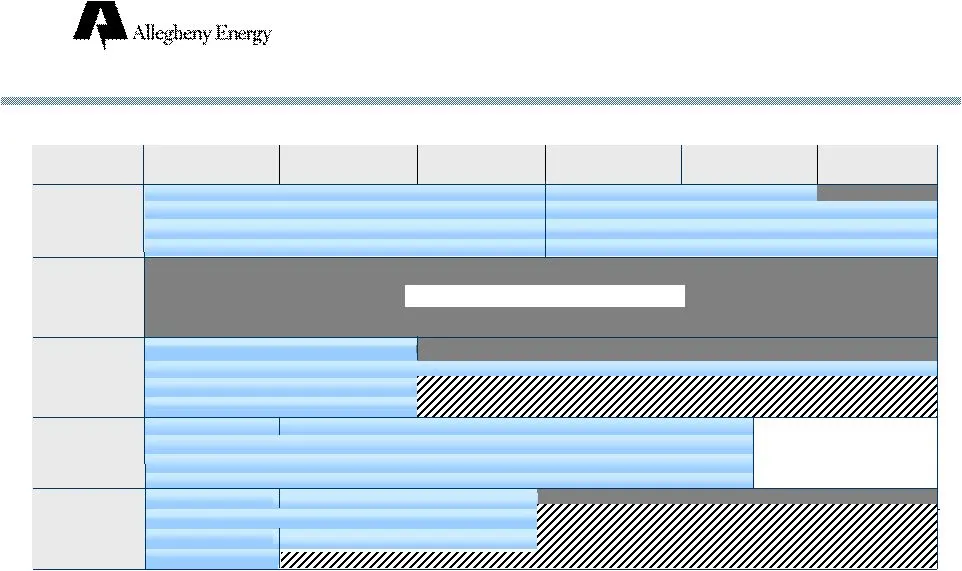
Slide 31: Regulatory Timeline
Regulatory Timeline 1) Generation rate caps extend through 2010 and include rate increases in each year, 2006-2010. 2) One-time T&D increase can be requested through 2007. After 2007, can request recovery of purchased power and annual incremental T& D reliability and environmental costs, and one add
Source: SEC EDGAR · 8-K filed Nov 7, 2005
More decks from Allegheny Energy Inc
 EEI Financial Conference 201045 slides · Nov 1, 2010
 Barclays Capital CEO Energy-Power Conference 20105 slides · Sep 15, 2010
 Merger or Acquisition (September 2010)19 slides · Sep 14, 2010
 Merger or Acquisition (August 2010)20 slides · Aug 13, 2010
 Merger or Acquisition (August 2010)7 slides · Aug 4, 2010
 Citigroup Conference June 7-8, 201056 slides · Jun 7, 2010