Synovus Financial — Raymond James Institutional Investor Conference 2019
32 slides from Synovus Financial's conference presentation, Mar 4, 2019
Slide 1: Synovus Financial Corp. Raymond James Institutional Investor Conference
Exhibit 99.1 Synovus Financial Corp. Raymond James Institutional Investor Conference Kevin Blair, Chief Operating Officer March 4th 2019
Slide 2: Forward Looking Statements
Forward Looking Statements This slide presentation and certain of our other filings with the Securities and Exchange Commission contain statements that constitute “forward-looking statements” within the meaning of, and subject to the protections of, Section 27A of the Securities Act of 1933, as amen
Slide 3: Synovus Business Overview
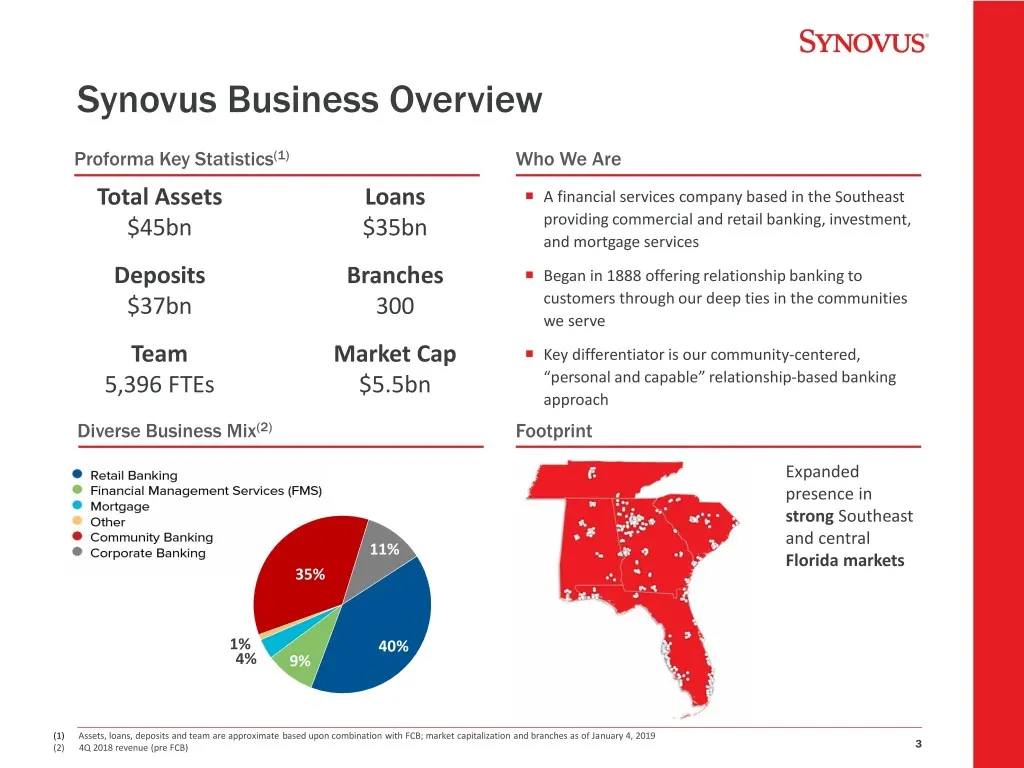
Synovus Business Overview Proforma Key Statistics(1) Who We Are Total Assets Loans A financial services company based in the Southeast $45bn $35bn providing commercial and retail banking, investment, and mortgage services Deposits Branches Began in 1888 offering relationship banking to $37bn 300
Slide 4: Synovus Recent Recognition
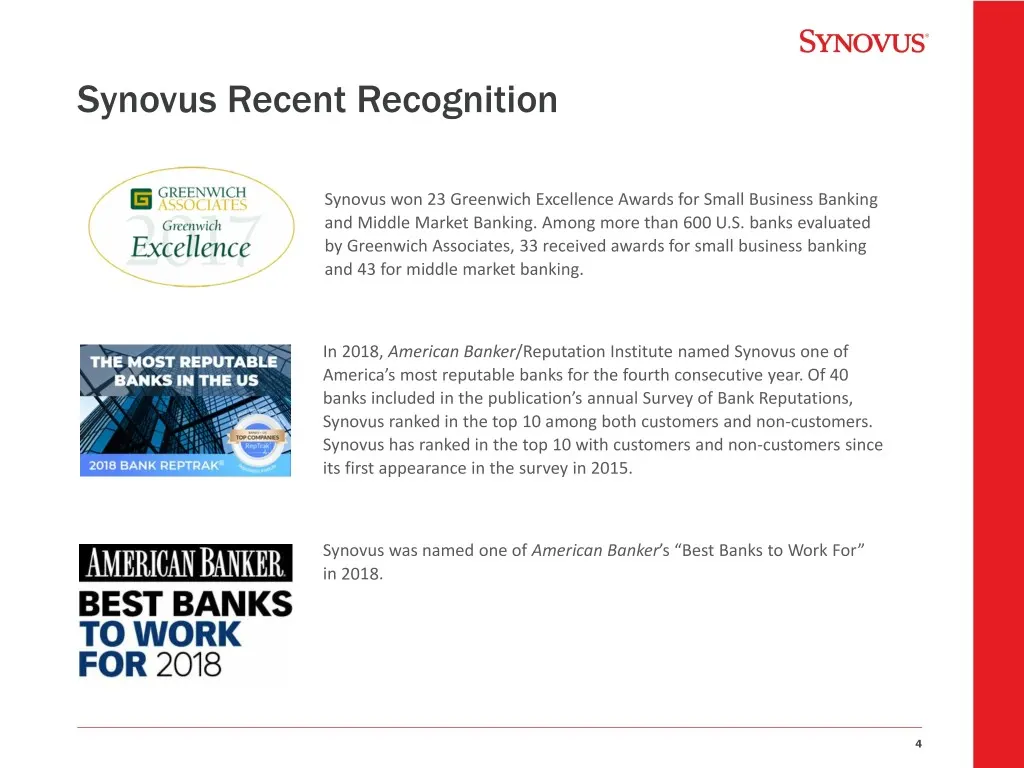
Synovus Recent Recognition Synovus won 23 Greenwich Excellence Awards for Small Business Banking and Middle Market Banking. Among more than 600 U.S. banks evaluated by Greenwich Associates, 33 received awards for small business banking and 43 for middle market banking. In 2018, American Banker/Reput
Slide 5: Value of a Unified Brand
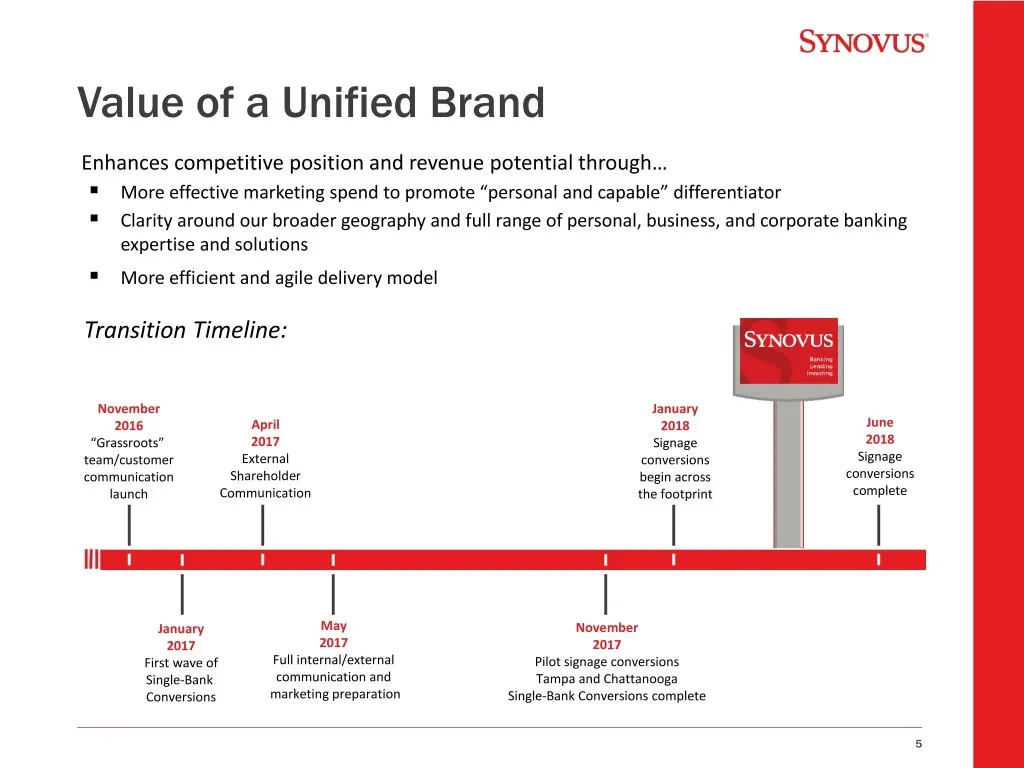
Value of a Unified Brand Enhances competitive position and revenue potential through… . More effective marketing spend to promote “personal and capable” differentiator . Clarity around our broader geography and full range of personal, business, and corporate banking expertise and solutions . More ef
Slide 6: Unified go to market team
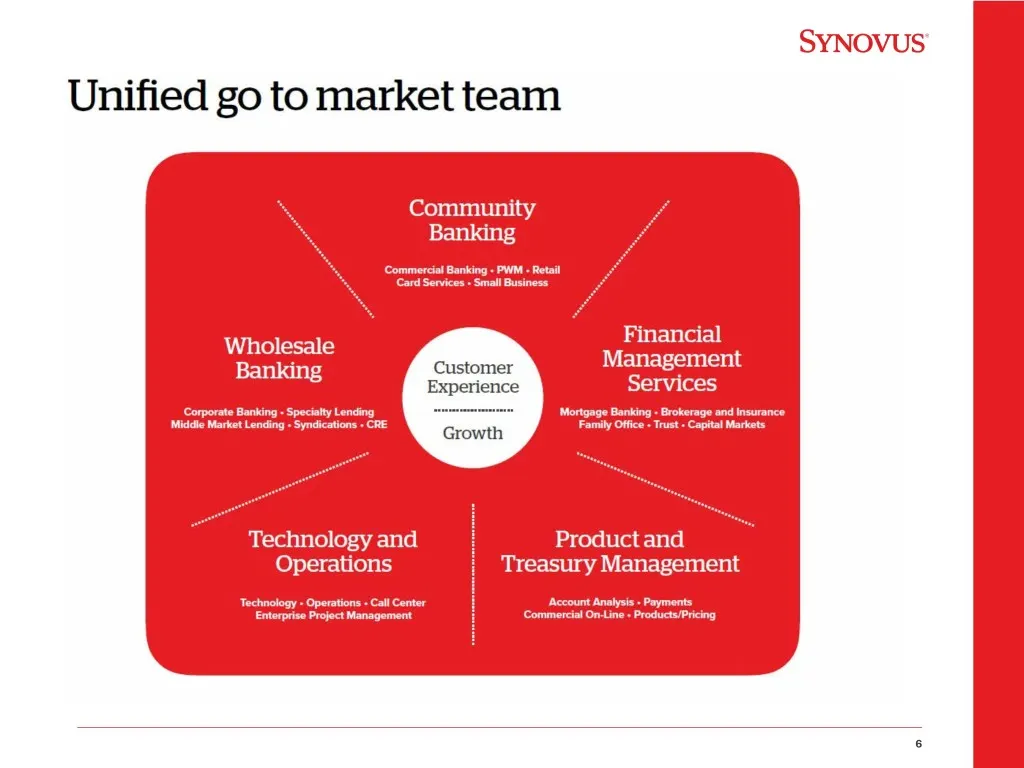
Unified go to market team Customer Experience
Slide 7: Broad-based Financial Improvement
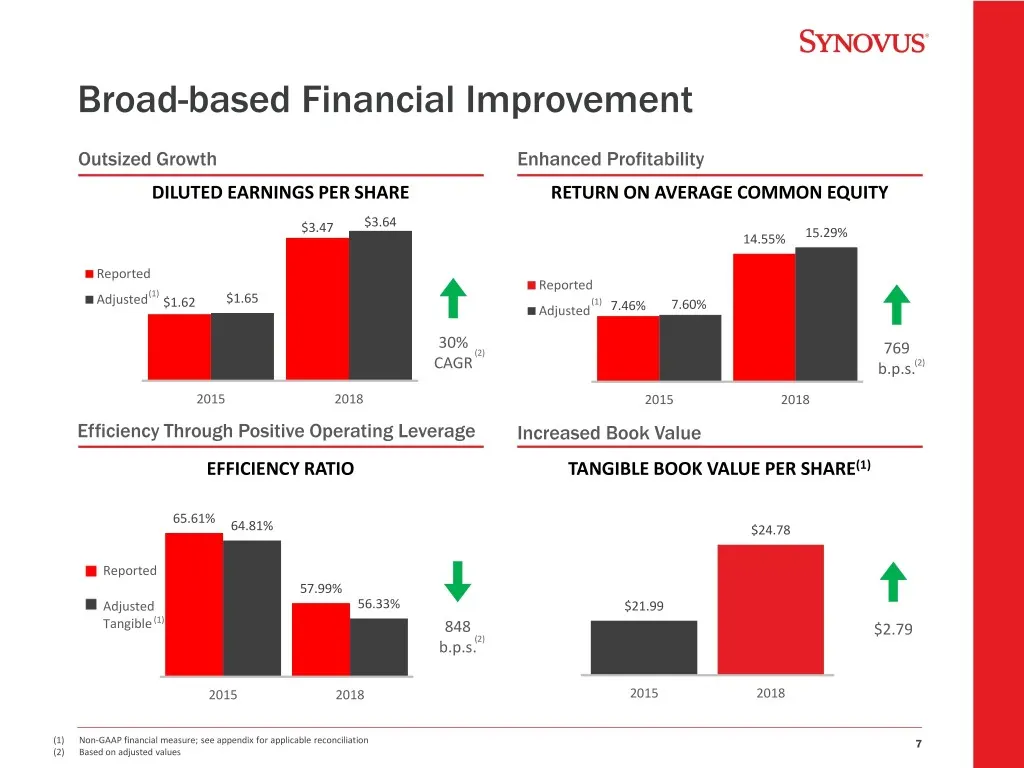
Broad-based Financial Improvement Outsized Growth Enhanced Profitability DILUTED EARNINGS PER SHARE RETURN ON AVERAGE COMMON EQUITY $3.47 $3.64 14.55% 15.29% Reported Reported (1) Adjusted $1.62 $1.65 (1) Adjusted 7.46% 7.60% 30% (2) 769 CAGR b.p.s.(2) 2015 2018 2015 2018 Efficiency Through Positive
Slide 8: Delivering Sustainable Growth
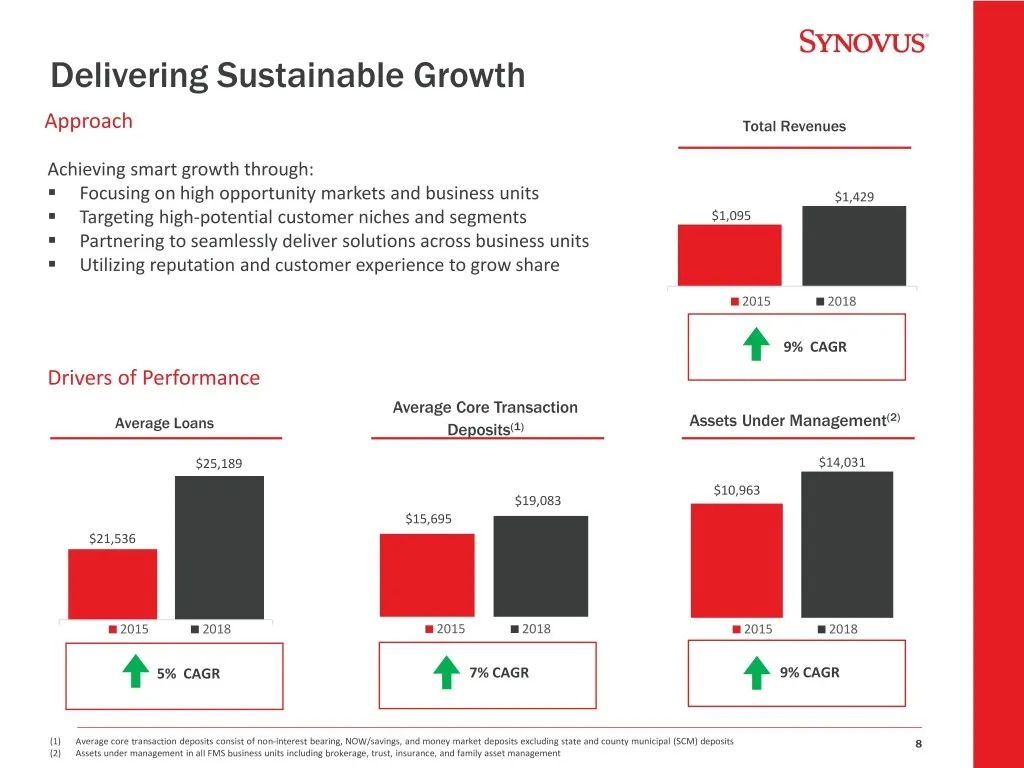
Delivering Sustainable Growth Approach Total Revenues Achieving smart growth through: . Focusing on high opportunity markets and business units $1,429 . Targeting high-potential customer niches and segments $1,095 . Partnering to seamlessly deliver solutions across business units . Utilizing reputat
Slide 9: Enhancing Returns and Optimizing Balance Sheet
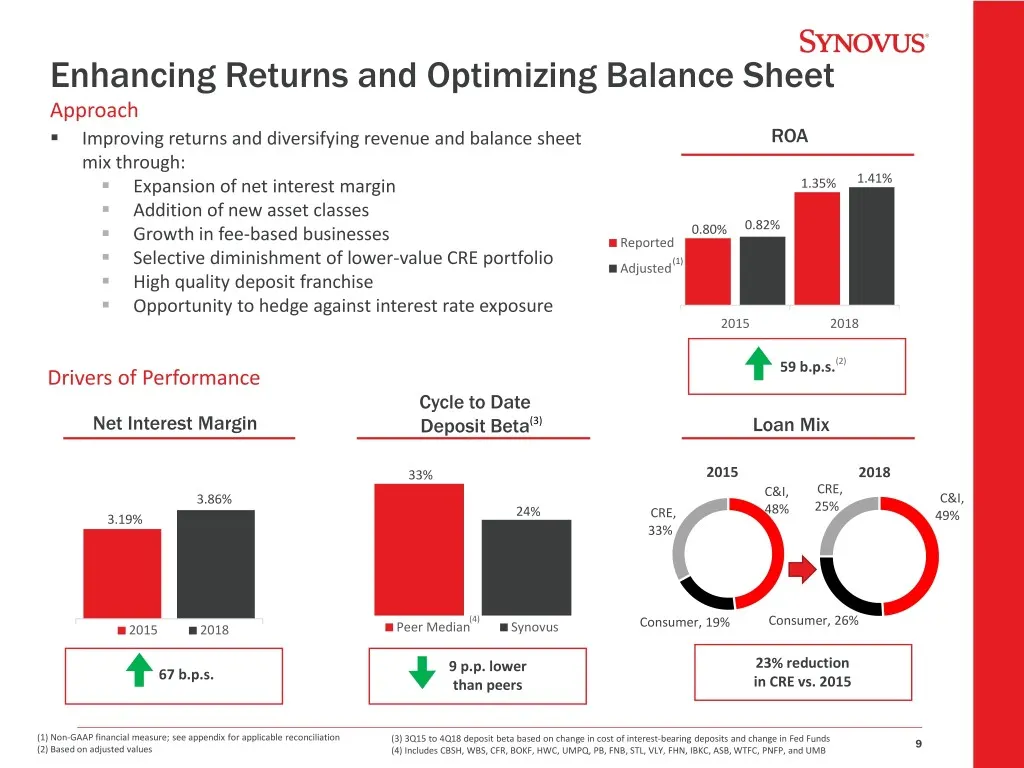
Enhancing Returns and Optimizing Balance Sheet Approach . Improving returns and diversifying revenue and balance sheet ROA mix through: . Expansion of net interest margin 1.35% 1.41% . Addition of new asset classes 0.80% 0.82% . Growth in fee-based businesses Reported . (1) Selective diminishment of
Slide 10: Significantly improving risk profile
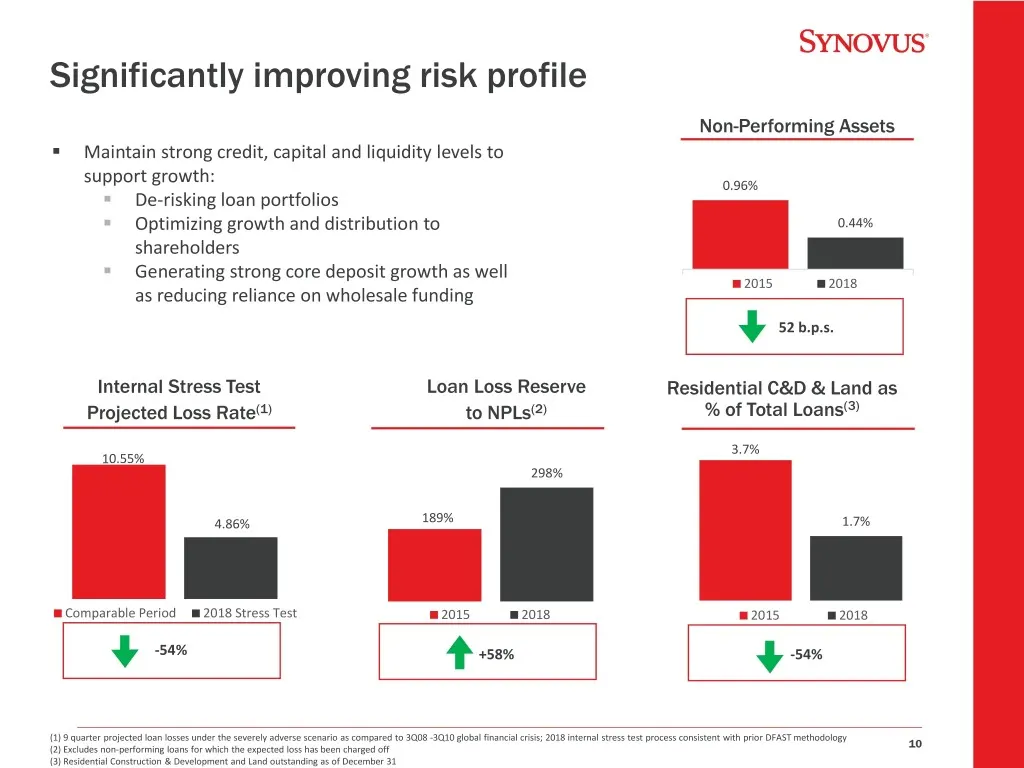
Significantly improving risk profile Non-Performing Assets . Maintain strong credit, capital and liquidity levels to support growth: 0.96% . De-risking loan portfolios . Optimizing growth and distribution to 0.44% shareholders . Generating strong core deposit growth as well 2015 2018 as reducing rel
Slide 11: Strategic Shift in Loan Mix highlights reduced risk profile
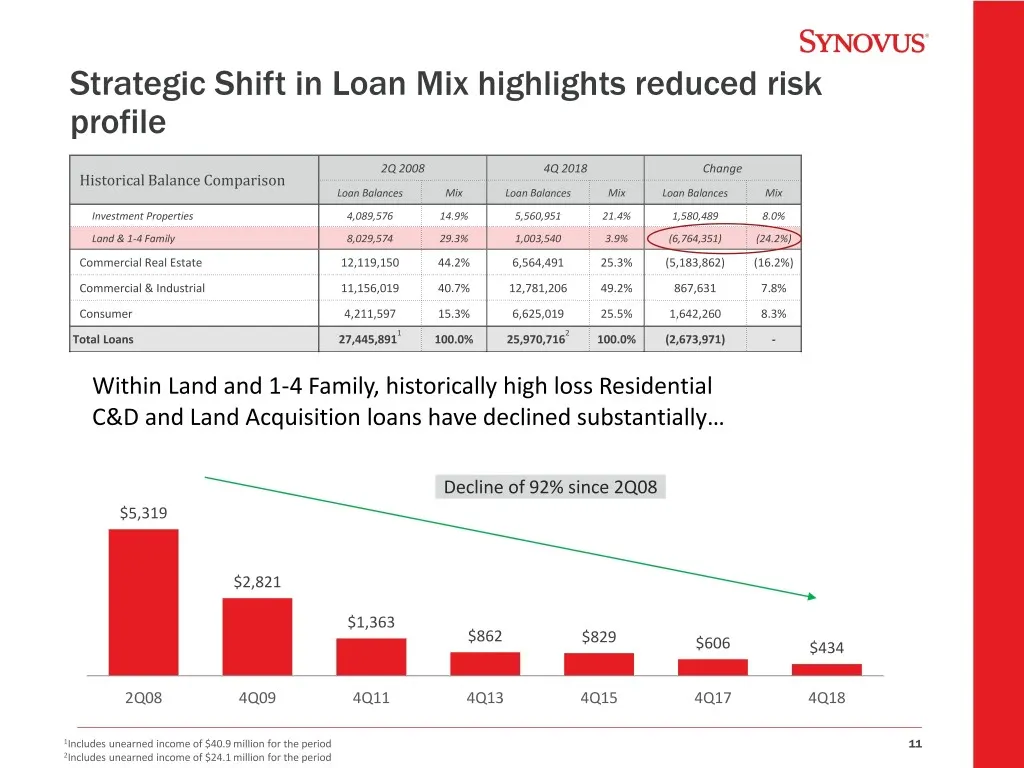
Strategic Shift in Loan Mix highlights reduced risk profile 2Q 2008 4Q 2018 Change Historical Balance Comparison Loan Balances Mix Loan Balances Mix Loan Balances Mix Investment Properties 4,089,576 14.9% 5,560,951 21.4% 1,580,489 8.0% Land & 1-4 Family 8,029,574 29.3% 1,003,540 3.9% (6,764,351) (24
Slide 12: Driving Efficiencies While Investing Strategically
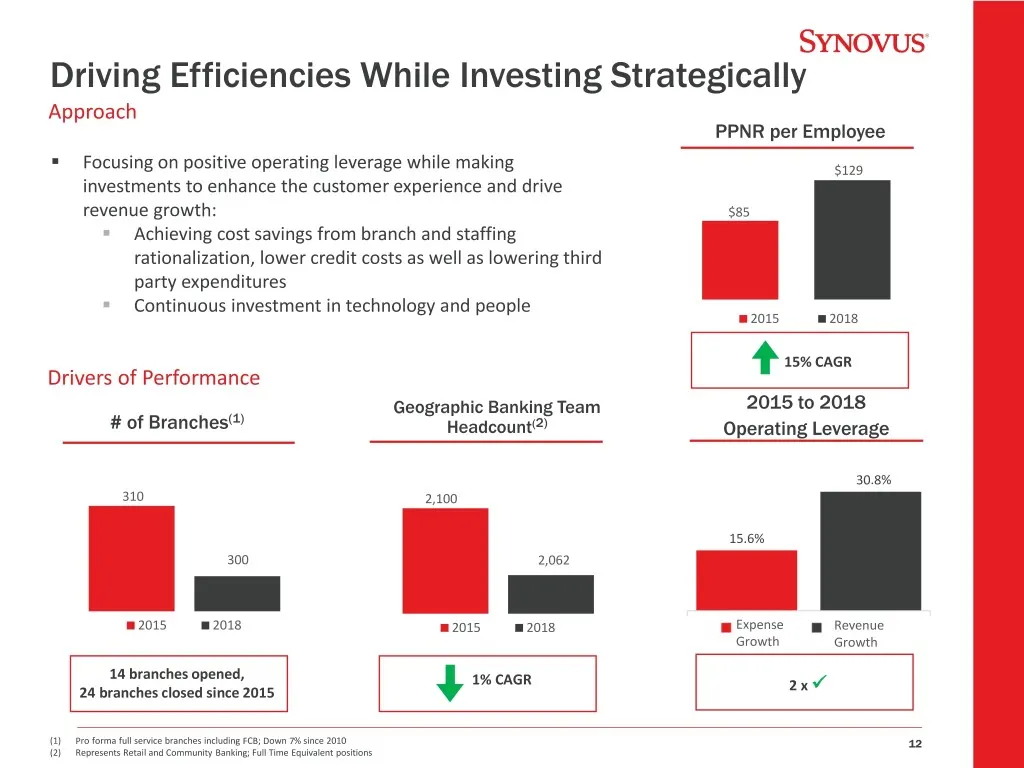
Driving Efficiencies While Investing Strategically Approach PPNR per Employee . Focusing on positive operating leverage while making $129 investments to enhance the customer experience and drive revenue growth: $85 . Achieving cost savings from branch and staffing rationalization, lower credit costs
Slide 13: Five Key Opportunities for 2019
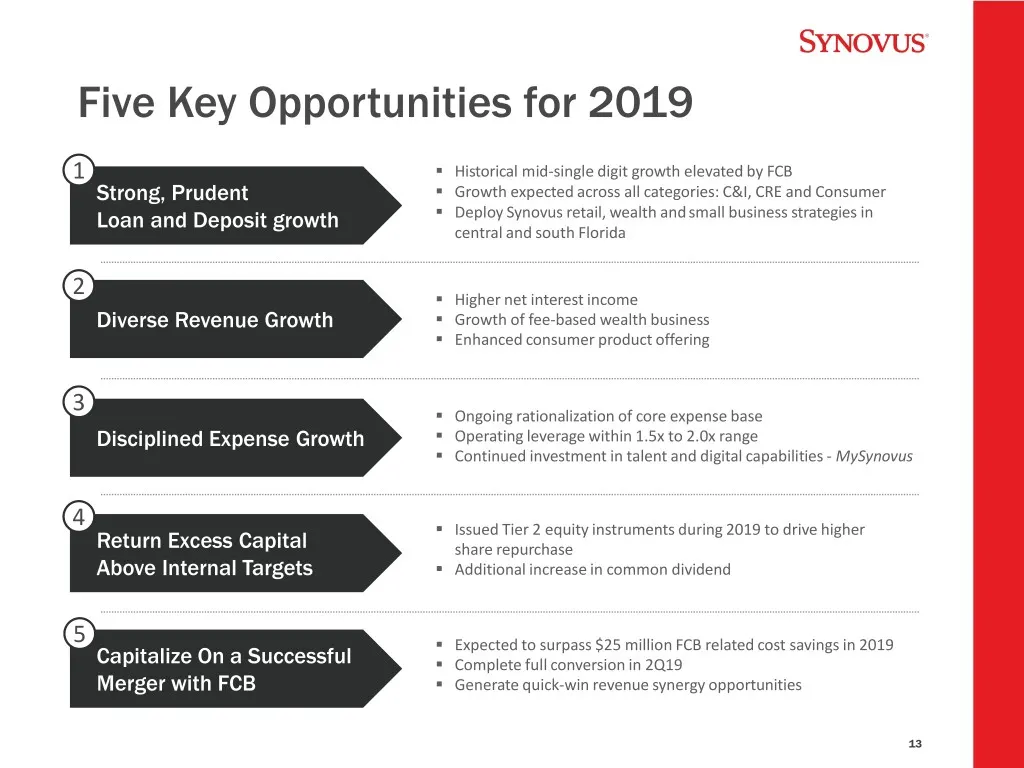
Five Key Opportunities for 2019 1 . Historical mid-single digit growth elevated by FCB Strong, Prudent . Growth expected across all categories: C&I, CRE and Consumer Loan and Deposit growth . Deploy Synovus retail, wealth and small business strategies in central and south Florida 2 . Higher net inte
Slide 14: 2019 Outlook
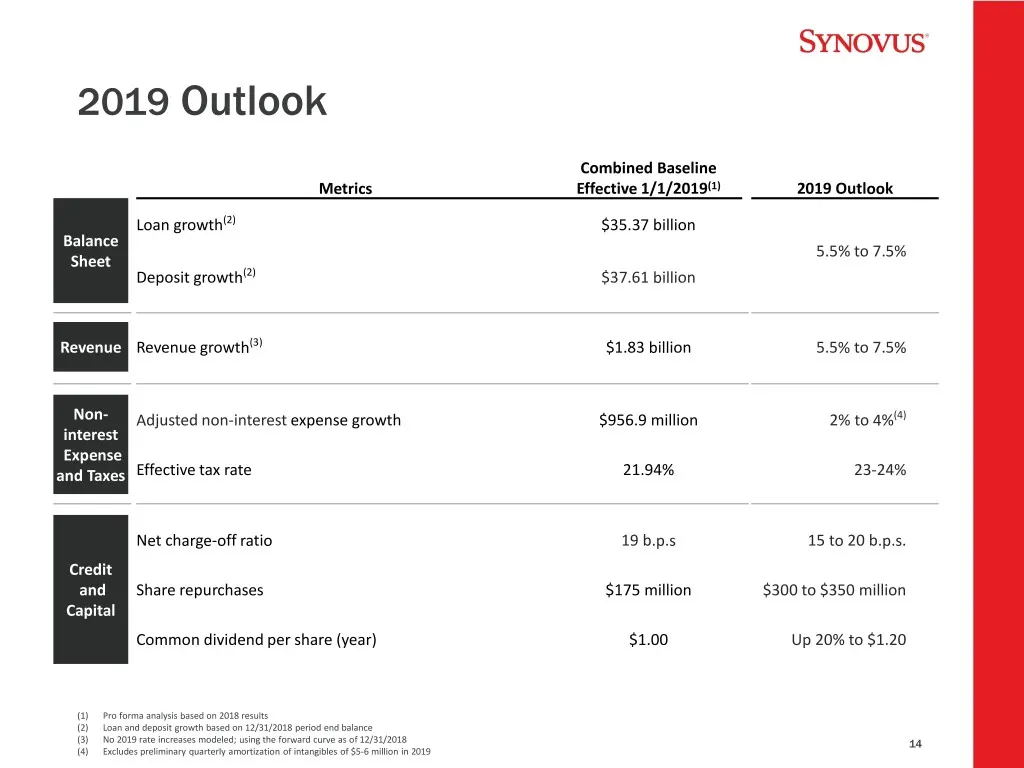
2019 Outlook Combined Baseline Metrics Effective 1/1/2019(1) 2019 Outlook Loan growth(2) $35.37 billion Balance 5.5% to 7.5% Sheet Deposit growth(2) $37.61 billion Revenue Revenue growth(3) $1.83 billion 5.5% to 7.5% Non- Adjusted non-interest expense growth $956.9 million 2% to 4%(4) interest Expen
Slide 15: FCB Merger Update
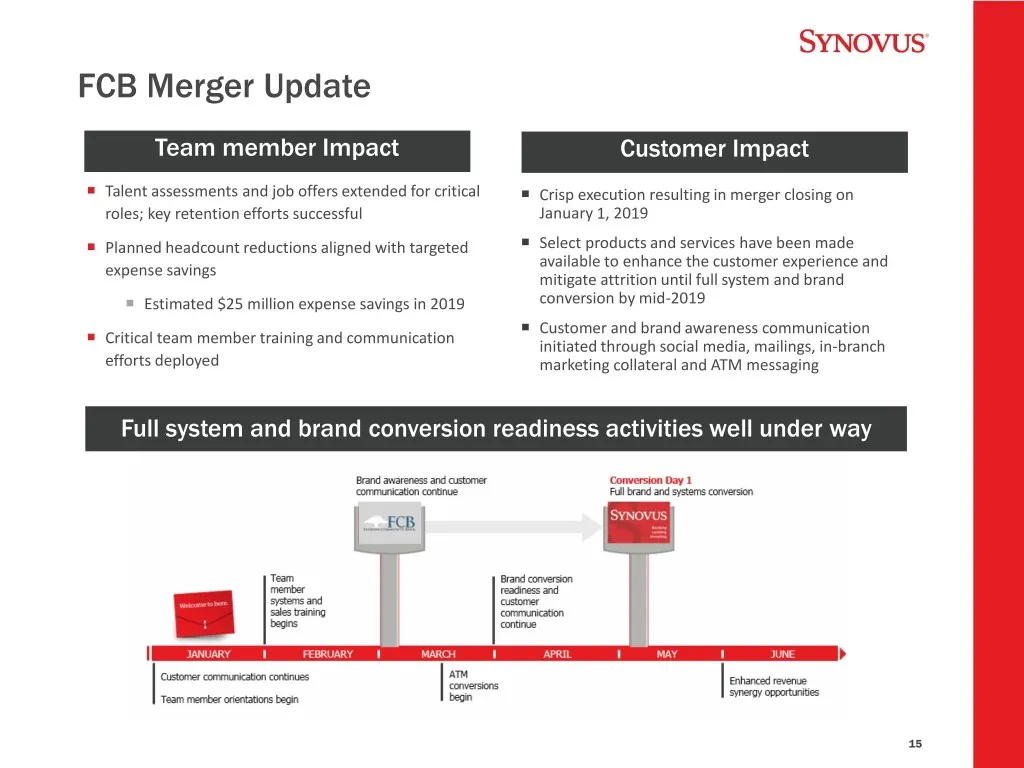
FCB Merger Update Team member Impact Customer Impact Talent assessments and job offers extended for critical Crisp execution resulting in merger closing on roles; key retention efforts successful January 1, 2019 Planned headcount reductions aligned with targeted Select products and services
Slide 16: Key Strategic Investments in 2019
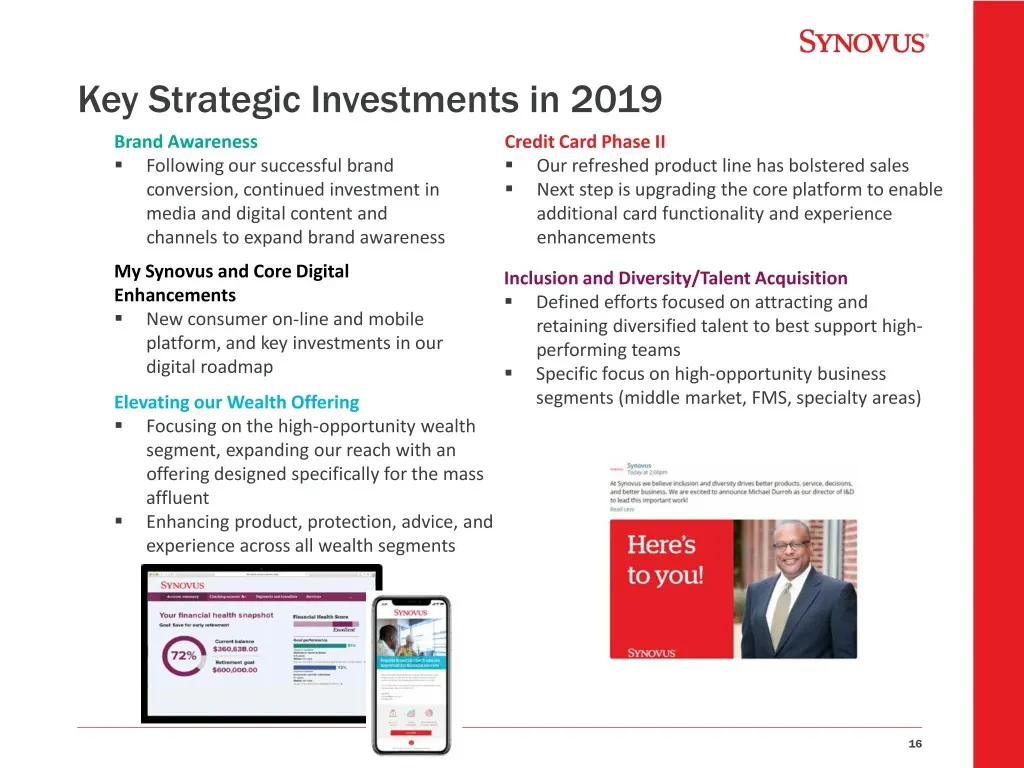
Key Strategic Investments in 2019 Brand Awareness Credit Card Phase II . Following our successful brand . Our refreshed product line has bolstered sales conversion, continued investment in . Next step is upgrading the core platform to enable media and digital content and additional card functionalit
Slide 17: 2019 Digital Priorities
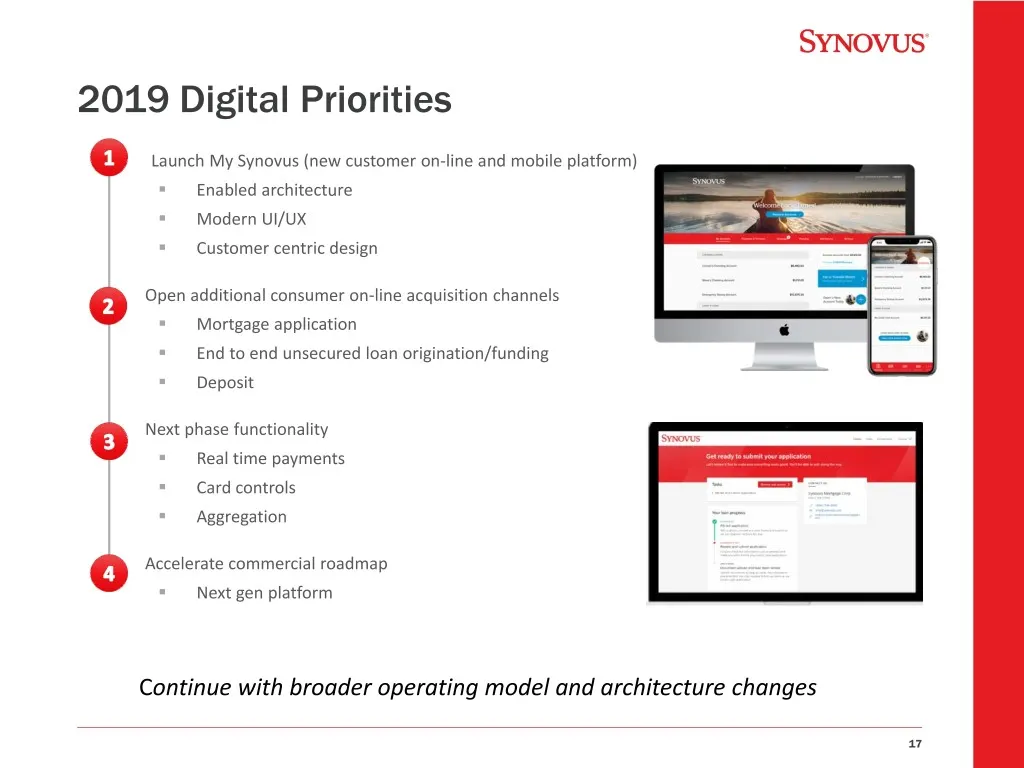
2019 Digital Priorities • Launch My Synovus (new customer on-line and mobile platform) . Enabled architecture . Modern UI/UX . Customer centric design Open additional consumer on-line acquisition channels . Mortgage application . End to end unsecured loan origination/funding . Deposit Next phase fun
Slide 18: Positioning for Growth
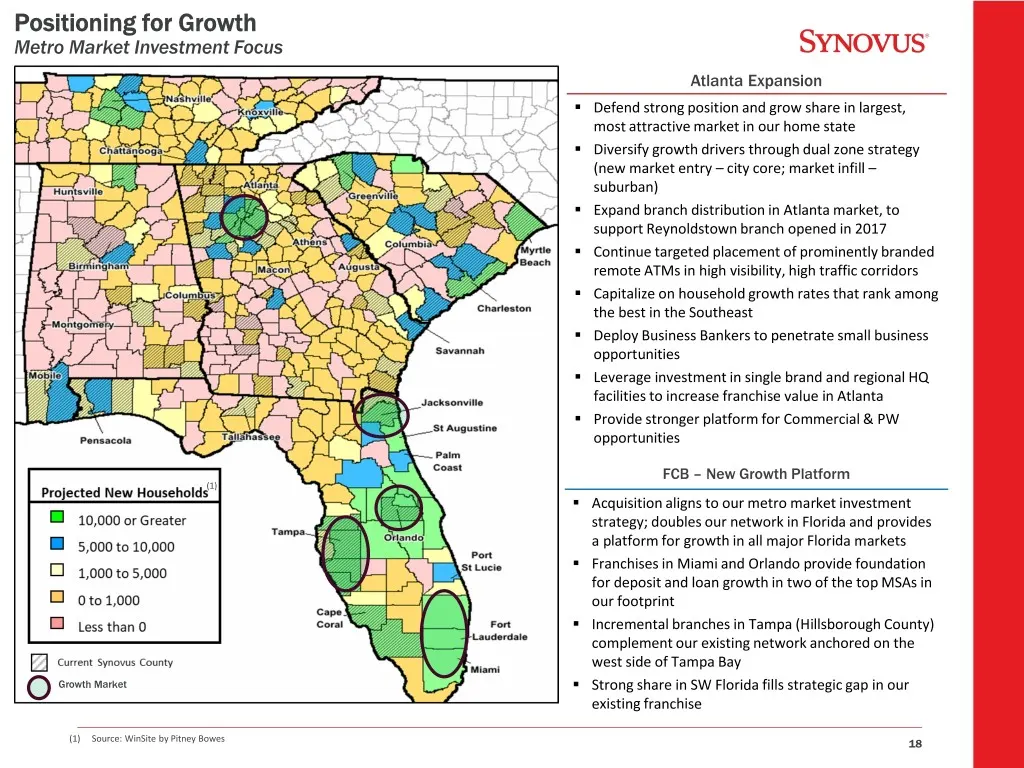
Positioning for Growth Metro Market Investment Focus Atlanta Expansion . Defend strong position and grow share in largest, most attractive market in our home state . Diversify growth drivers through dual zone strategy (new market entry – city core; market infill – suburban) . Expand branch distribut
Slide 19: 2019 Capital Actions
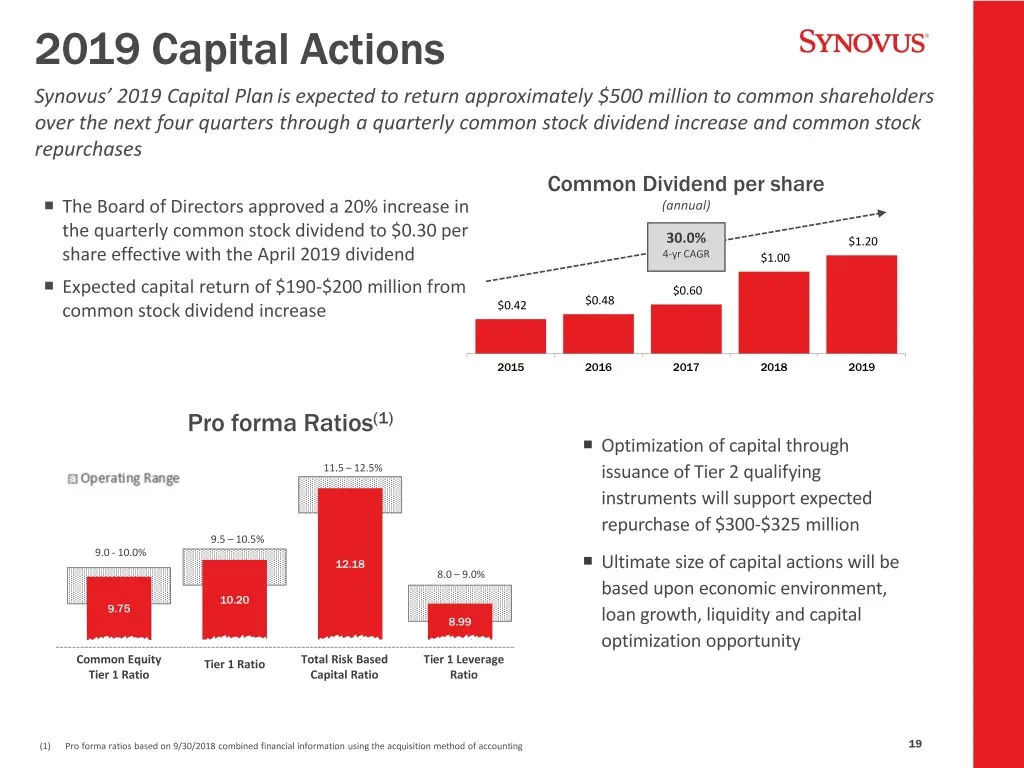
2019 Capital Actions Synovus’ 2019 Capital Plan is expected to return approximately $500 million to common shareholders over the next four quarters through a quarterly common stock dividend increase and common stock repurchases Common Dividend per share The Board of Directors approved a 20% increa
Slide 20: Strategic areas of focus will drive sustained 10+% CAGR EPS growth
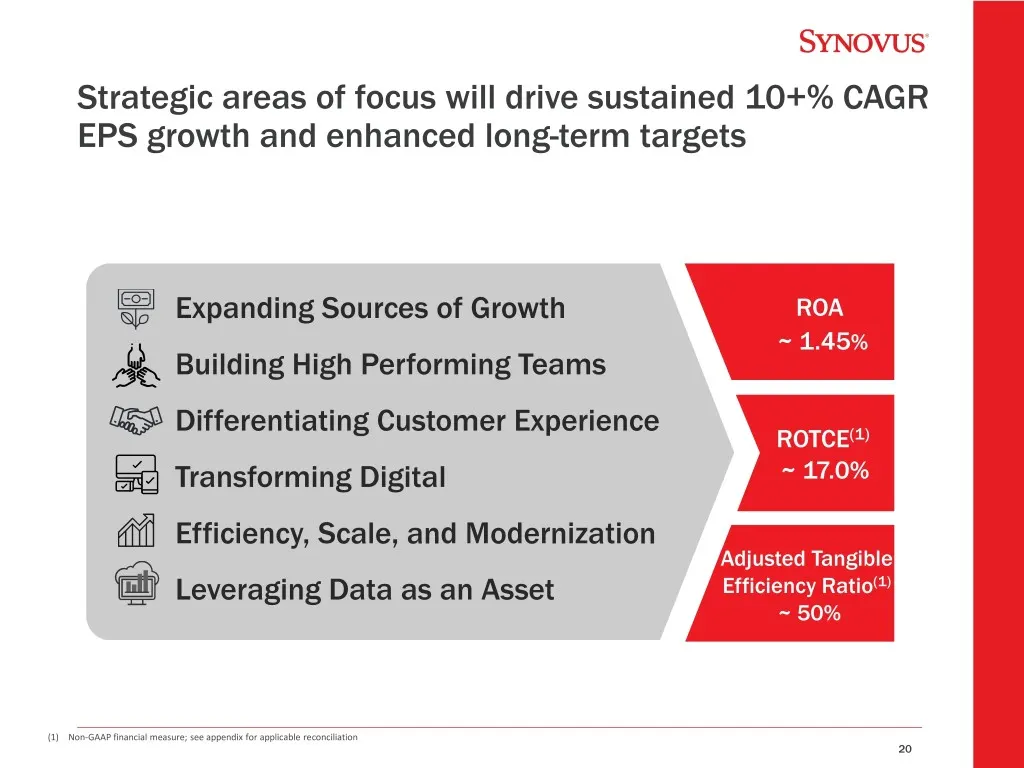
Strategic areas of focus will drive sustained 10+% CAGR EPS growth and enhanced long-term targets Expanding Sources of Growth ROA ~ 1.45% Building High Performing Teams Differentiating Customer Experience ROTCE(1) Transforming Digital ~ 17.0% Efficiency, Scale, and Modernization Adjusted Tangible Le

Slide 21: Appendix
SYNOVUS Appendix
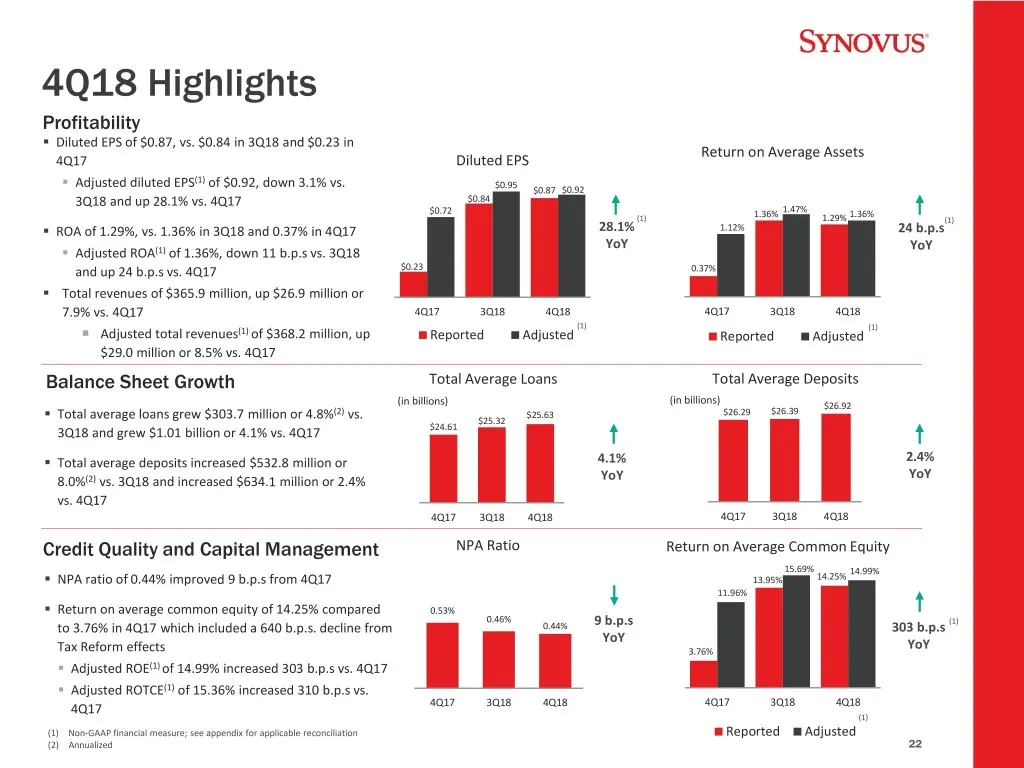
Slide 22: 4Q18 Highlights
4Q18 Highlights Profitability . Diluted EPS of $0.87, vs. $0.84 in 3Q18 and $0.23 in Return on Average Assets 4Q17 Diluted EPS (1) . Adjusted diluted EPS of $0.92, down 3.1% vs. $0.95 $0.87 $0.92 3Q18 and up 28.1% vs. 4Q17 $0.84 $0.72 1.36% 1.47% 1.36% (1) 1.29% (1) . ROA of 1.29%, vs. 1.36% in 3Q18
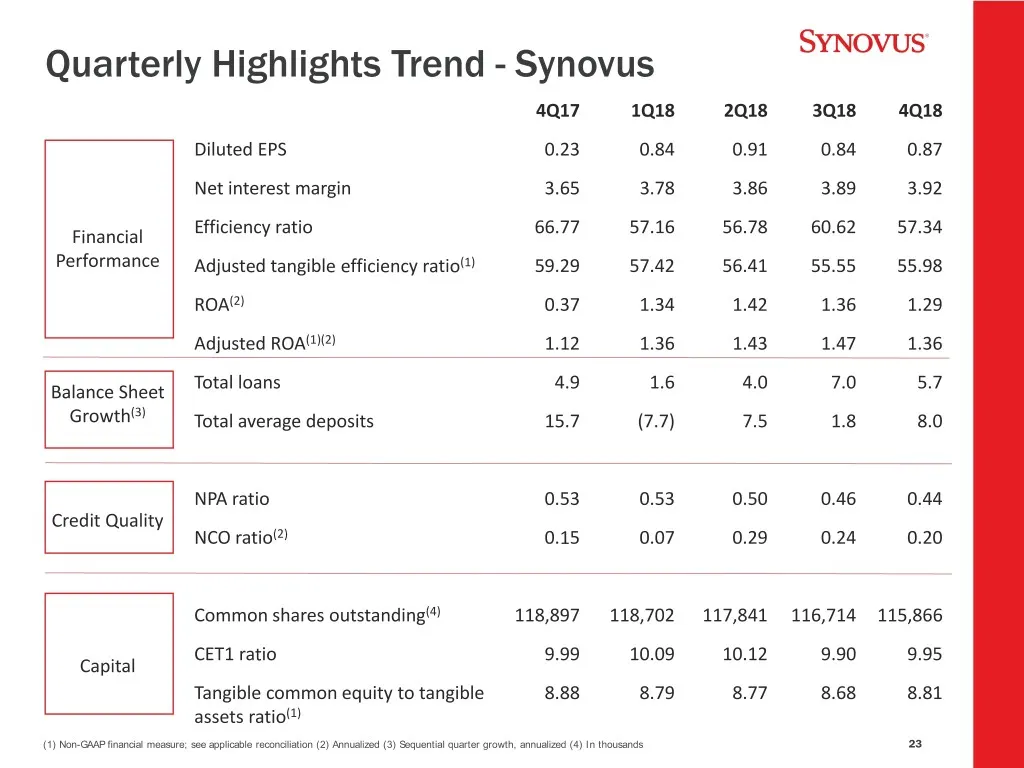
Slide 23: Quarterly Highlights Trend - Synovus
Quarterly Highlights Trend - Synovus 4Q17 1Q18 2Q18 3Q18 4Q18 Diluted EPS 0.23 0.84 0.91 0.84 0.87 Net interest margin 3.65 3.78 3.86 3.89 3.92 Financial Efficiency ratio 66.77 57.16 56.78 60.62 57.34 Performance Adjusted tangible efficiency ratio(1) 59.29 57.42 56.41 55.55 55.98 ROA(2) 0.37 1.34 1.
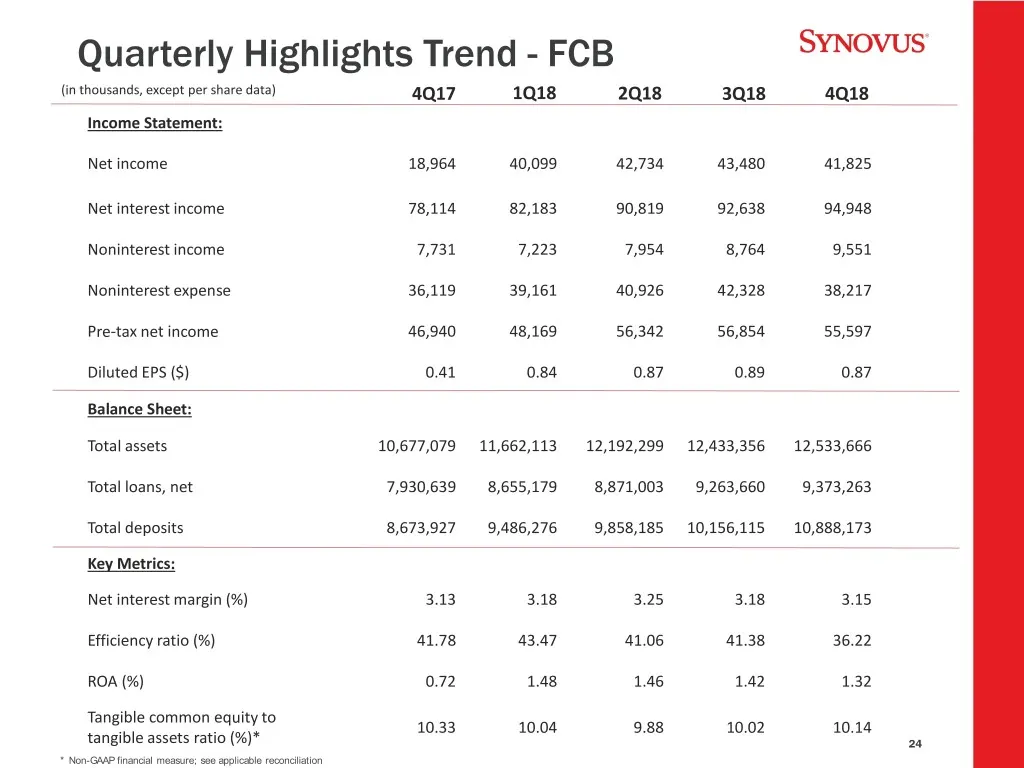
Slide 24: Quarterly Highlights Trend - FCB
Quarterly Highlights Trend - FCB (in thousands, except per share data) 4Q17 1Q18 2Q18 3Q18 4Q18 Income Statement: Net income 18,964 40,099 42,734 43,480 41,825 Net interest income 78,114 82,183 90,819 92,638 94,948 Noninterest income 7,731 7,223 7,954 8,764 9,551 Noninterest expense 36,119 39,161 40
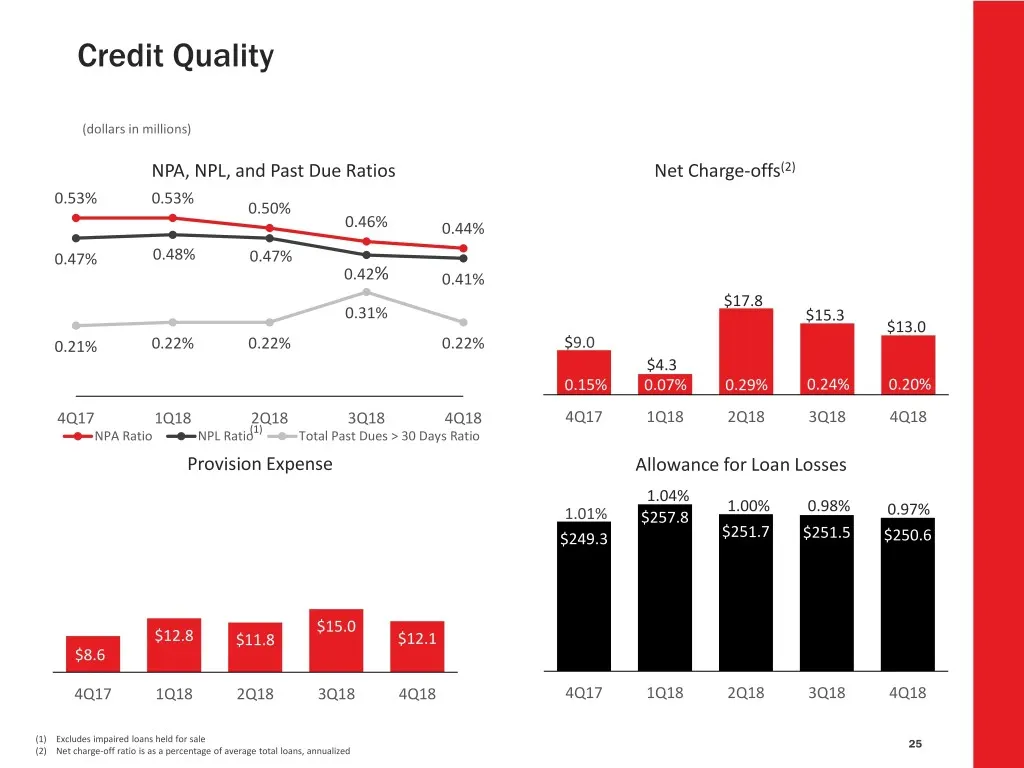
Slide 25: Credit Quality
Credit Quality (dollars in millions) NPA, NPL, and Past Due Ratios Net Charge-offs(2) 0.53% 0.53% 0.50% 0.46% (2)0.44% 0.47% 0.48% 0.47% 0.42% 0.41% $17.8 0.31% $15.30.29% $13.0 0.21% 0.22% 0.22% 0.22% $9.0 $4.3 0.15% 0.07% 0.29% 0.24% 0.20% % 4Q17 1Q18 2Q18 3Q18 4Q18 4Q17 1Q18 2Q18 3Q18 4Q18 (1) NP
Slide 26: Non-GAAP Financial Measures
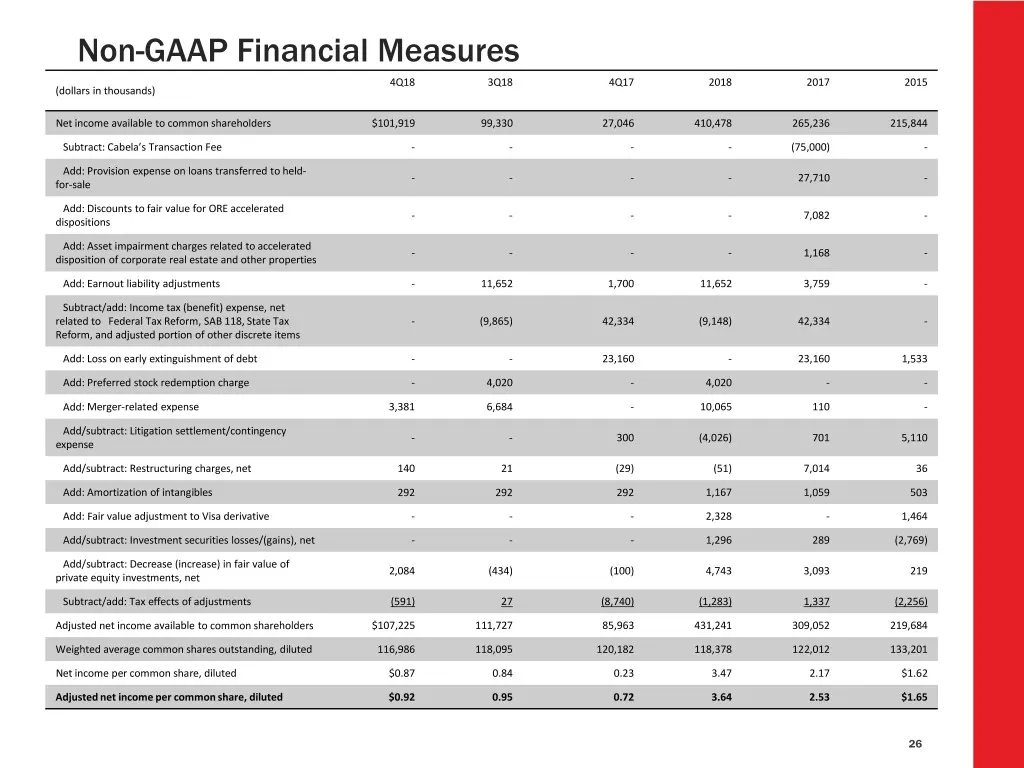
Non-GAAP Financial Measures 4Q18 3Q18 4Q17 2018 2017 2015 (dollars in thousands) Net income available to common shareholders $101,919 99,330 27,046 410,478 265,236 215,844 Subtract: Cabela’s Transaction Fee - - - - (75,000) - Add: Provision expense on loans transferred to held- - - - - 27,710 - for-
Slide 27: Non-GAAP Financial Measures, continued
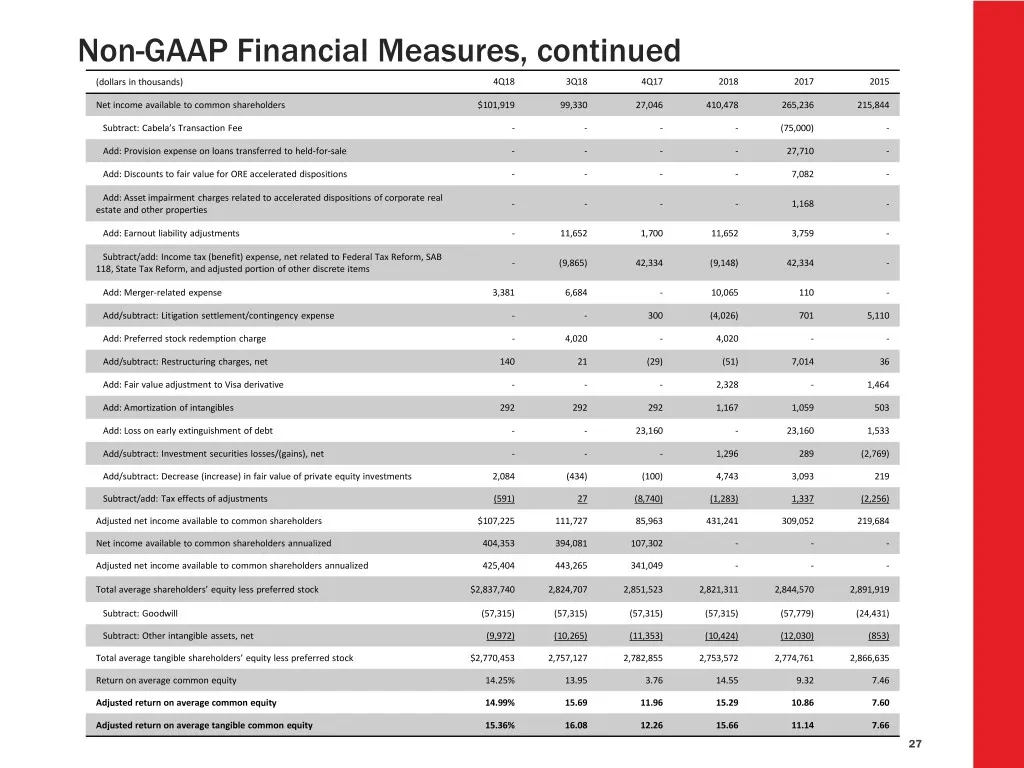
Non-GAAP Financial Measures, continued (dollars in thousands) 4Q18 3Q18 4Q17 2018 2017 2015 Net income available to common shareholders $101,919 99,330 27,046 410,478 265,236 215,844 Subtract: Cabela’s Transaction Fee - - - - (75,000) - Add: Provision expense on loans transferred to held-for-sale -
Slide 28: Non-GAAP Financial Measures, continued
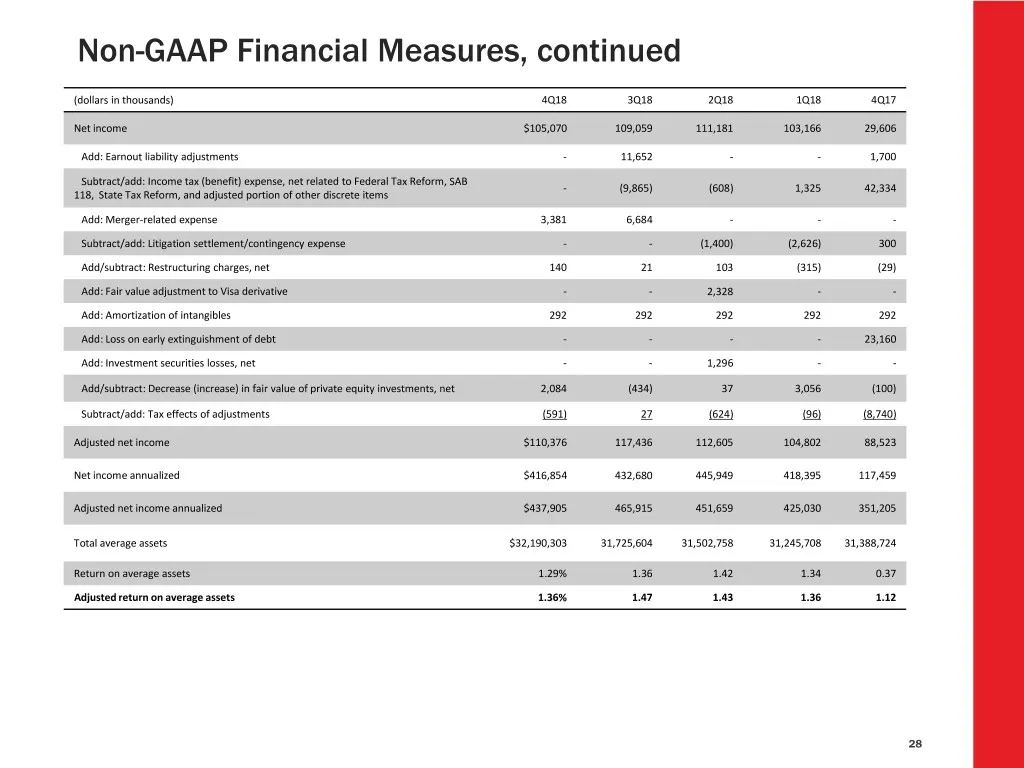
Non-GAAP Financial Measures, continued (dollars in thousands) 4Q18 3Q18 2Q18 1Q18 4Q17 Net income $105,070 109,059 111,181 103,166 29,606 Add: Earnout liability adjustments - 11,652 - - 1,700 Subtract/add: Income tax (benefit) expense, net related to Federal Tax Reform, SAB - (9,865) (608) 1,325 42,
Slide 29: Non-GAAP Financial Measures, continued
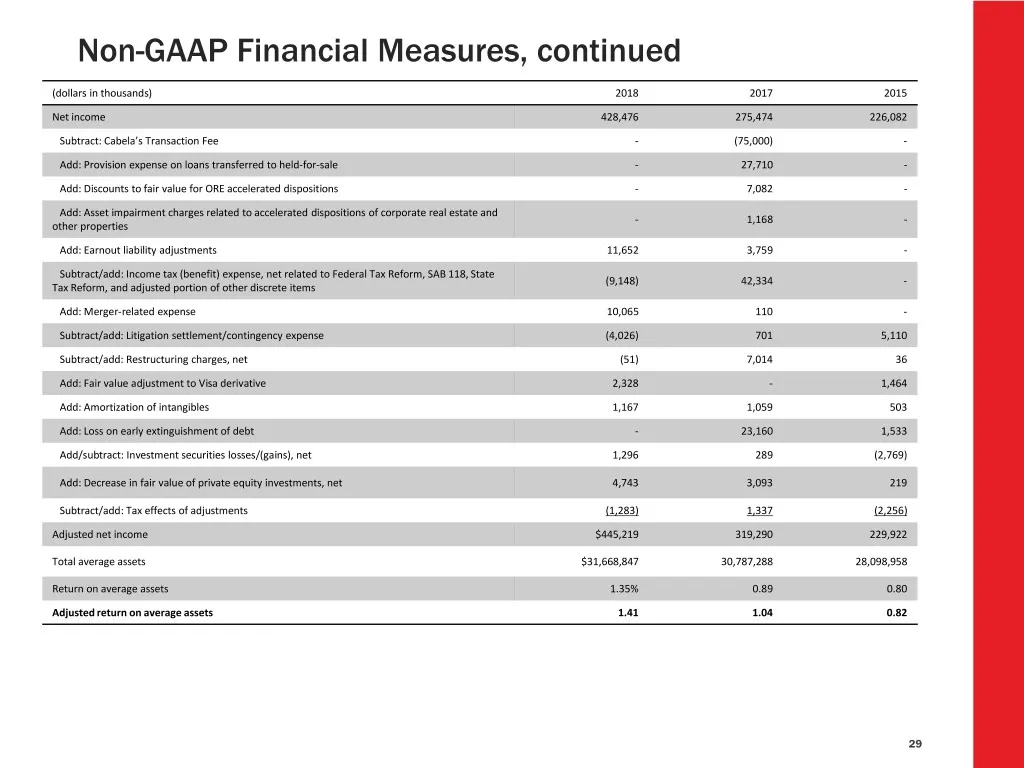
Non-GAAP Financial Measures, continued (dollars in thousands) 2018 2017 2015 Net income 428,476 275,474 226,082 Subtract: Cabela’s Transaction Fee - (75,000) - Add: Provision expense on loans transferred to held-for-sale - 27,710 - Add: Discounts to fair value for ORE accelerated dispositions - 7,08
Slide 30: Non-GAAP Financial Measures, continued
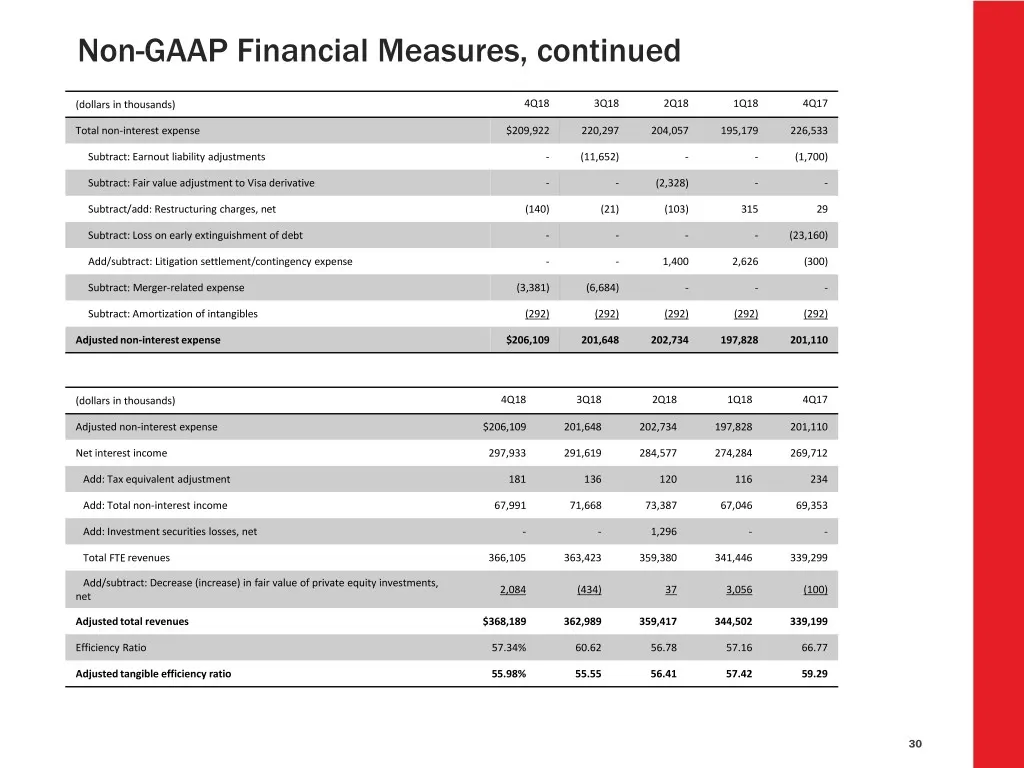
Non-GAAP Financial Measures, continued (dollars in thousands) 4Q18 3Q18 2Q18 1Q18 4Q17 Total non-interest expense $209,922 220,297 204,057 195,179 226,533 Subtract: Earnout liability adjustments - (11,652) - - (1,700) Subtract: Fair value adjustment to Visa derivative - - (2,328) - - Subtract/add: R
Slide 31: Non-GAAP Financial Measures, continued
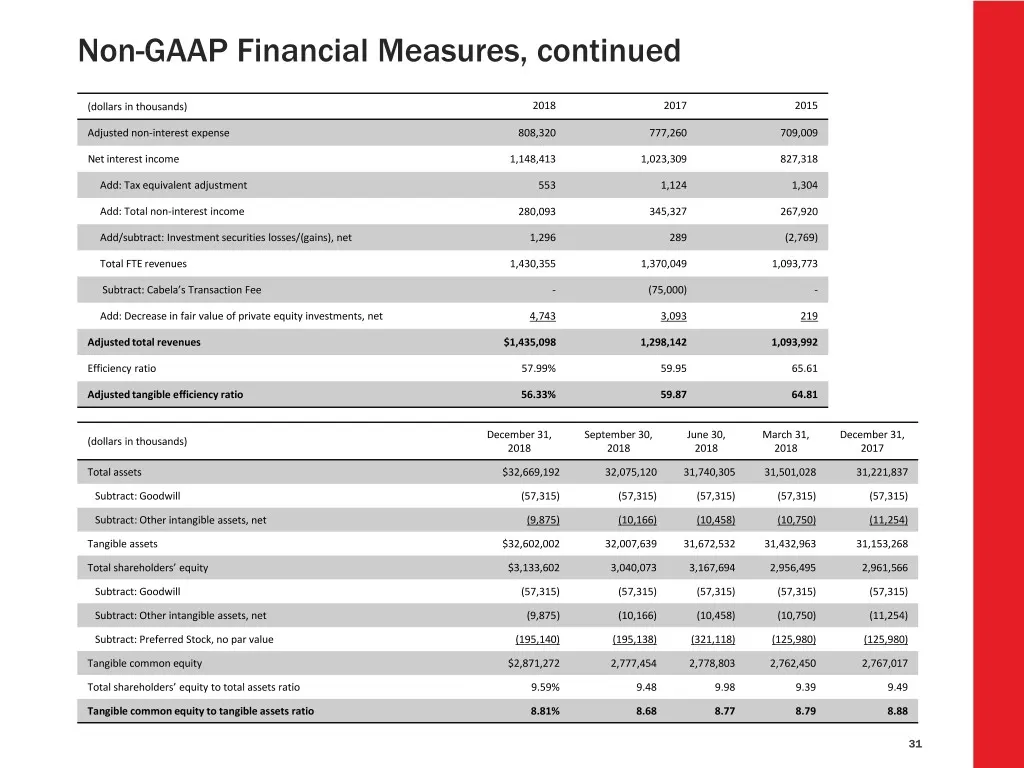
Non-GAAP Financial Measures, continued (dollars in thousands) 2018 2017 2015 Adjusted non-interest expense 808,320 777,260 709,009 Net interest income 1,148,413 1,023,309 827,318 Add: Tax equivalent adjustment 553 1,124 1,304 Add: Total non-interest income 280,093 345,327 267,920 Add/subtract: Inves
Slide 32: Non-GAAP Financial Measures, continued
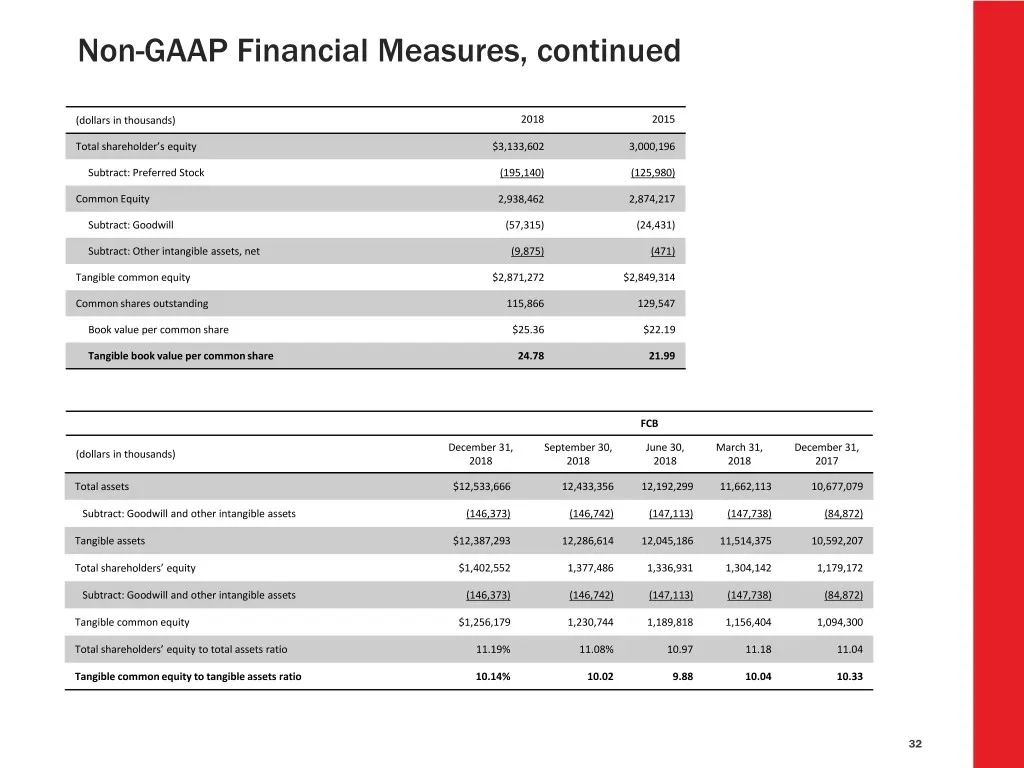
Non-GAAP Financial Measures, continued (dollars in thousands) 2018 2015 Total shareholder’s equity $3,133,602 3,000,196 Subtract: Preferred Stock (195,140) (125,980) Common Equity 2,938,462 2,874,217 Subtract: Goodwill (57,315) (24,431) Subtract: Other intangible assets, net (9,875) (471) Tangible c
Source: SEC EDGAR · 8-K filed Mar 4, 2019
More decks from Synovus Financial Corp
 Goldman Sachs 2025 Financial Services Conference15 slides · Dec 8, 2025
 Debt Investor Presentation (December 2025)9 slides · Dec 1, 2025
 Merger or Acquisition (November 2025)5 slides · Nov 26, 2025
 Merger or Acquisition (November 2025)6 slides · Nov 6, 2025
 Q3 2025 Earnings Presentation47 slides · Oct 16, 2025
 Merger or Acquisition (August 2025)27 slides · Aug 28, 2025