Premier Financial — First Defiance Financial — KBW Investor Conference (July 2013)
29 slides from Premier Financial's conference presentation, Jul 30, 2013
Slide 1: KBW Investor Conference
William J. Small Chairman, President & Chief Executive Officer Donald P. Hileman Executive Vice President & Chief Financial Officer KBW Investor Conference Exhibit 99
Slide 2: Forward-looking statements and offering notice
The issuer has filed a registration statement including a prospectus, and will file a related supplement with the Securities and Exchange Commission (“SEC”), for the offering to which this communication relates. Before you invest, you should read the prospectus, the prospectus supplement and any oth
Slide 3: William J. Small, Chairman, President & CEO
3 William J. Small Chairman, President & Chief Executive Officer First Defiance Financial Corp.
Slide 4: Company Profile
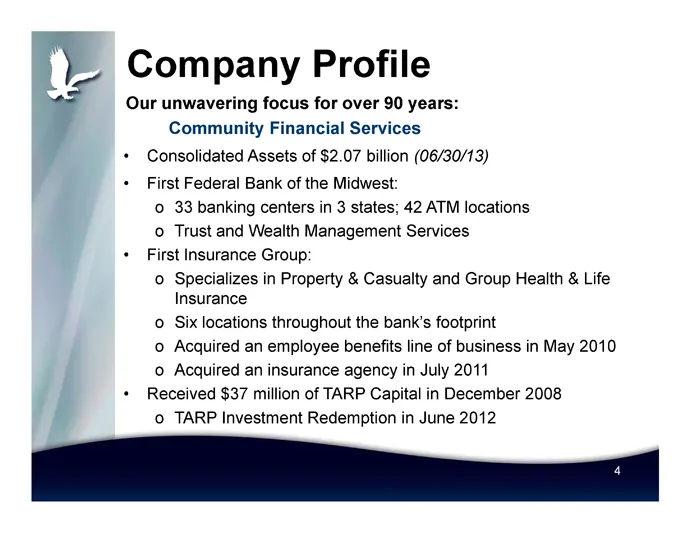
• Consolidated Assets of $2.07 billion (06/30/13) • First Federal Bank of the Midwest: o 33 banking centers in 3 states; 42 ATM locations o Trust and Wealth Management Services • First Insurance Group: o Specializes in Property & Casualty and Group Health & Life Insurance o Six locations throughout
Slide 5: Investment Highlights
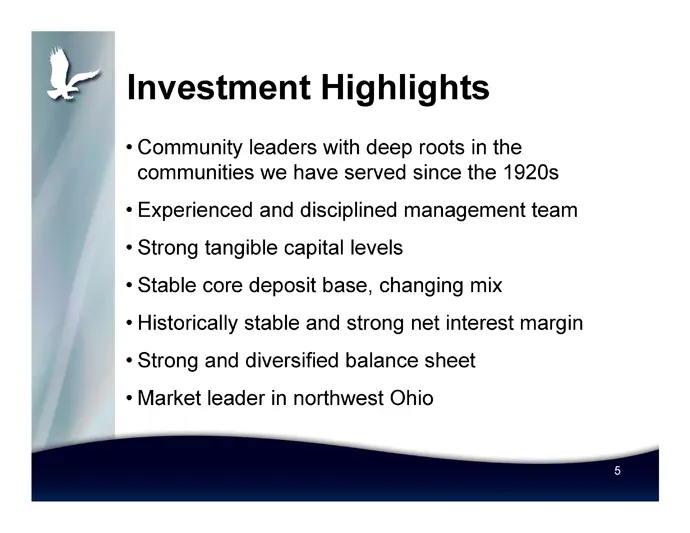
Investment Highlights • Community leaders with deep roots in the communities we have served since the 1920s • Experienced and disciplined management team • Strong tangible capital levels • Stable core deposit base, changing mix • Historically stable and strong net interest margin • Strong and divers
Slide 6: Executive Leadership
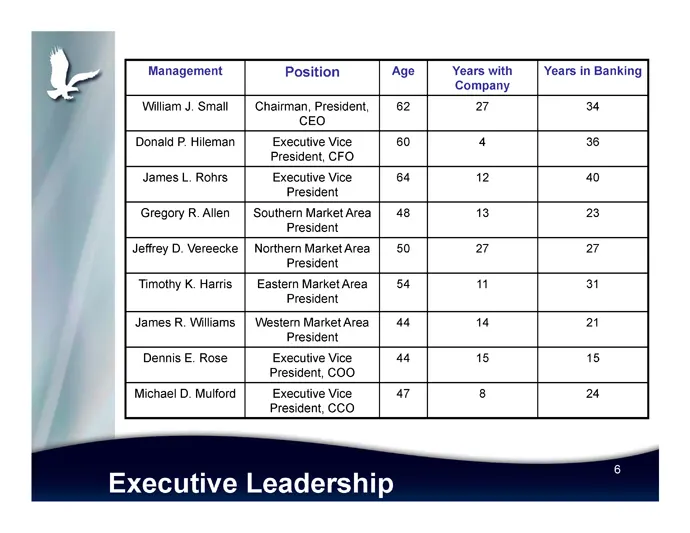
Management Position Age Years with Company Years in Banking William J. Small Chairman, President, CEO 62 27 34 Donald P. Hileman Executive Vice President, CFO 60 4 36 James L. Rohrs Executive Vice President 64 12 40 Gregory R. Allen Southern Market Area President 48 13 23 Jeffrey D. Vereecke Norther
Slide 7: First Defiance's Market
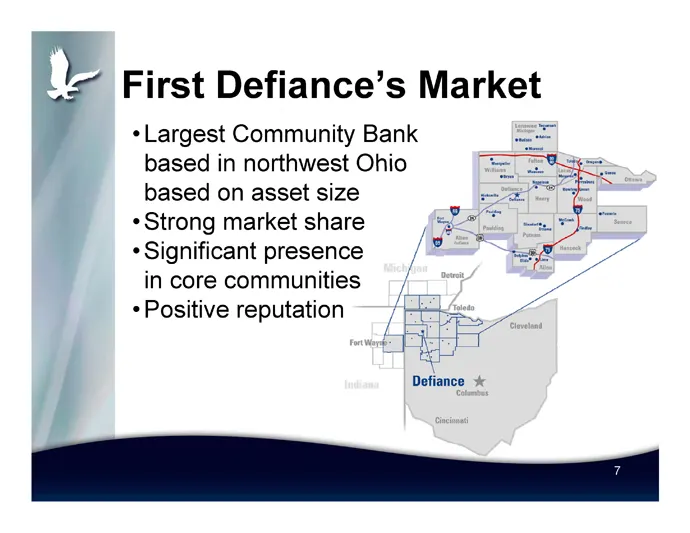
First Defiance’s Market • Largest Community Bank based in northwest Ohio based on asset size • Strong market share • Significant presence in core communities • Positive reputation 7
Slide 8: Stable Deposit Base
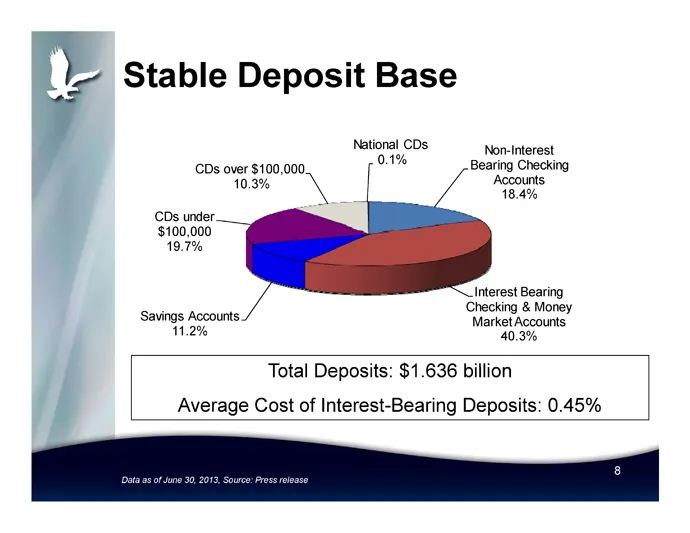
Non - Interest Bearing Checking Accounts 18.4% Interest Bearing Checking & Money Market Accounts 40.3% Savings Accounts 11.2% CDs under $100,000 19.7% CDs over $100,000 10.3% National CDs 0.1% Stable Deposit Base Total Deposits: $1.636 billion Average Cost of Interest - Bearing Deposits: 0.45% 8 Dat
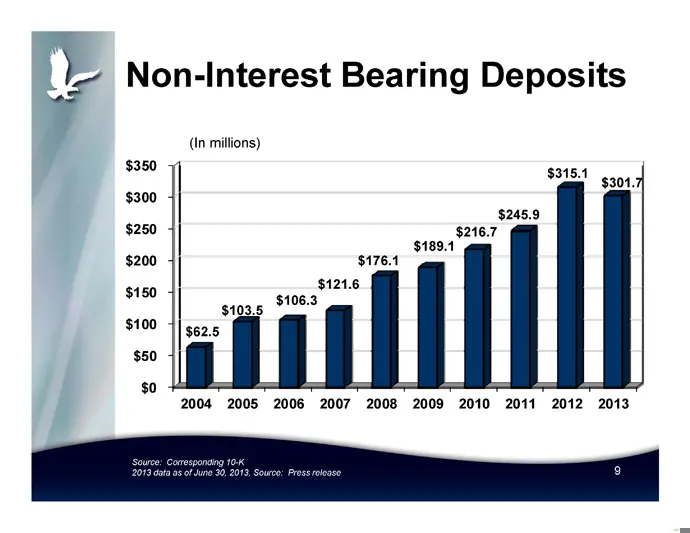
Slide 9: Non-Interest Bearing Deposits
$0 $50 $100 $150 $200 $250 $300 $350 2004 2005 2006 2007 2008 2009 2010 2011 2012 2013 $62.5 $103.5 $106.3 $121.6 $176.1 $189.1 $216.7 $245.9 $315.1 $301.7 Non - Interest Bearing Deposits Source: Corresponding 10 - K 2013 data as of June 30, 2013, Source: Press release 9 (In millions)
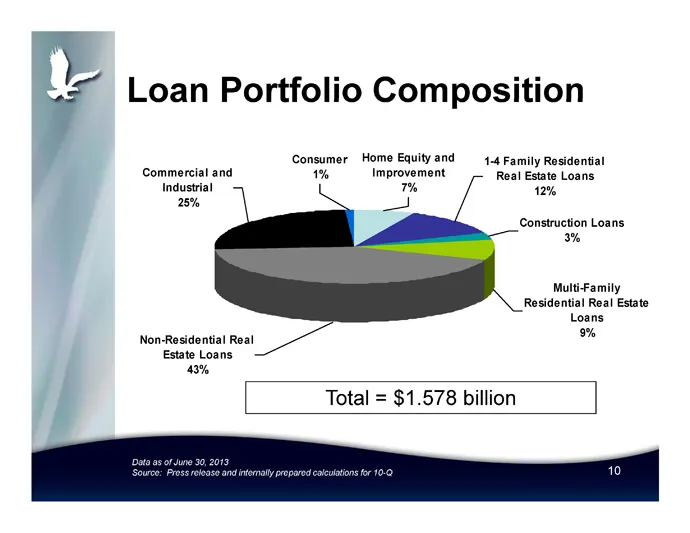
Slide 10: Loan Portfolio Composition
Home Equity and Improvement 7% 1-4 Family Residential Real Estate Loans 12% Construction Loans 3% Consumer 1% Multi-Family Residential Real Estate Loans 9% Non-Residential Real Estate Loans 43% Commercial and Industrial 25% Total = $1.578 billion Loan Portfolio Composition 10 Data as of June 30, 201
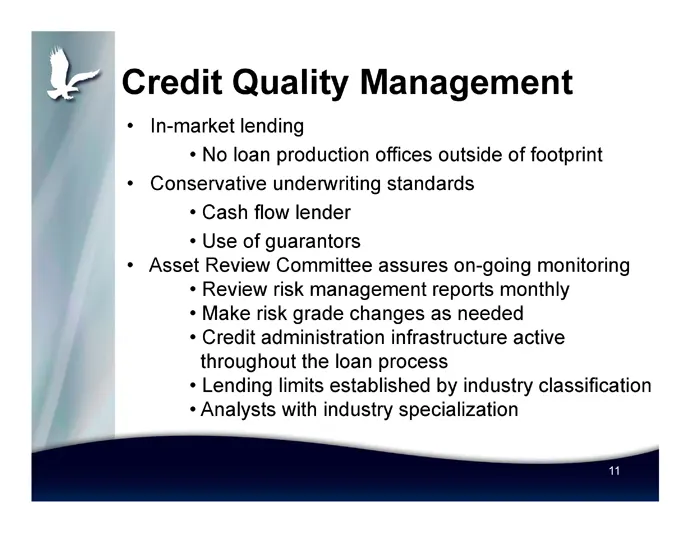
Slide 11: Credit Quality Management
• In - market lending • No loan production offices outside of footprint • Conservative underwriting standards • Cash flow lender • Use of guarantors • Asset Review Committee assures on - going monitoring • Review risk management reports monthly • Make risk grade changes as needed • Credit administra
Slide 12: Donald P. Hileman, EVP & Chief Financial Officer
12 Donald P. Hileman Executive Vice President & Chief Financial Officer First Defiance Financial Corp.
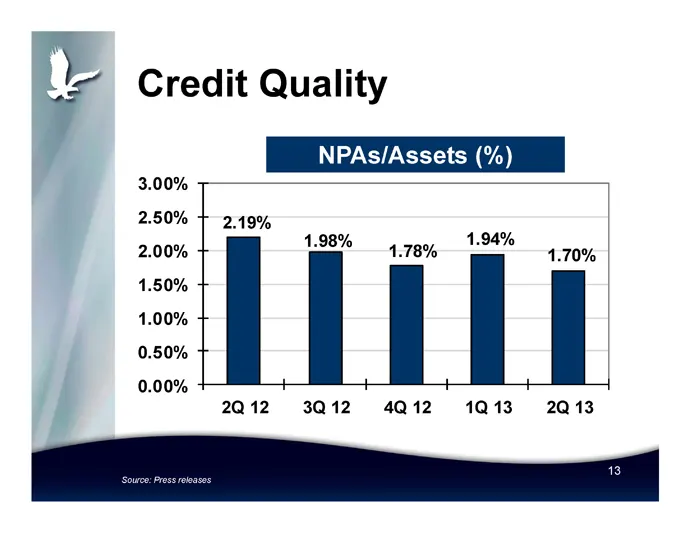
Slide 13: Credit Quality: NPAs/Assets
Credit Quality NPAs/Assets (%) 2.19% 1.98% 1.78% 1.94% 1.70% 0.00% 0.50% 1.00% 1.50% 2.00% 2.50% 3.00% 2Q 12 3Q 12 4Q 12 1Q 13 2Q 13 13 Source: Press releases
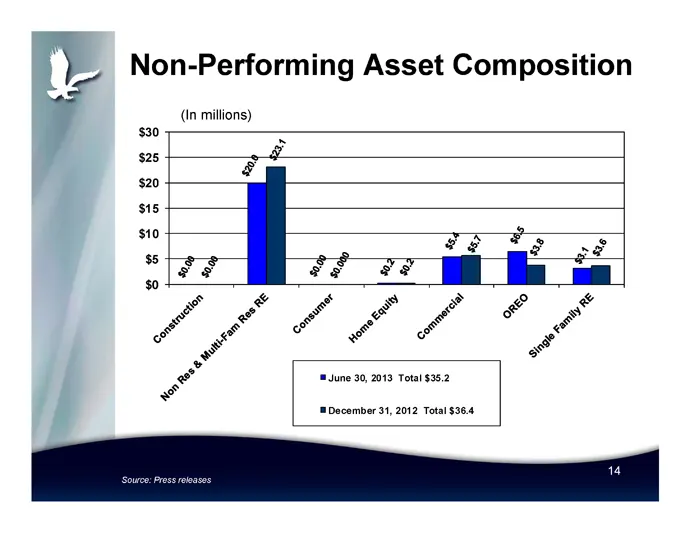
Slide 14: Non-Performing Asset Composition
$0 $5 $10 $15 $20 $25 $30 June 30, 2013 Total $35.2 December 31, 2012 Total $36.4 Non - Performing Asset Composition 14 Source: Press releases (In millions)
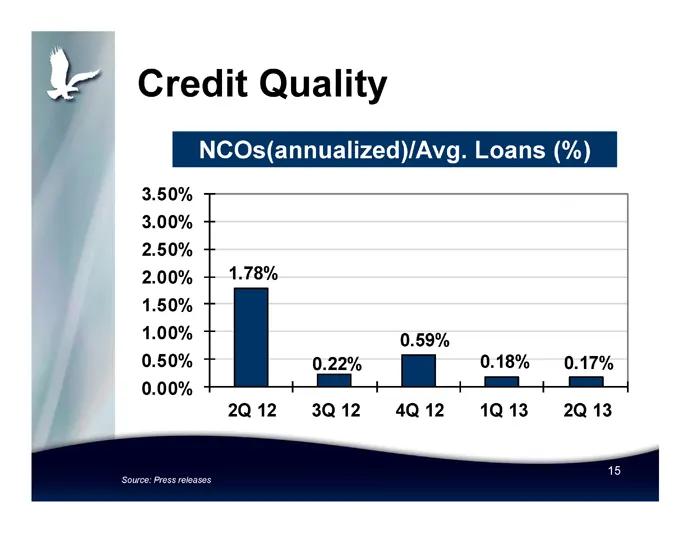
Slide 15: Credit Quality: NCOs/Avg. Loans
15 NCOs(annualized)/Avg. Loans (%) 1.78% 0.22% 0.59% 0.18% 0.17% 0.00% 0.50% 1.00% 1.50% 2.00% 2.50% 3.00% 3.50% 2Q 12 3Q 12 4Q 12 1Q 13 2Q 13 Credit Quality Source: Press releases
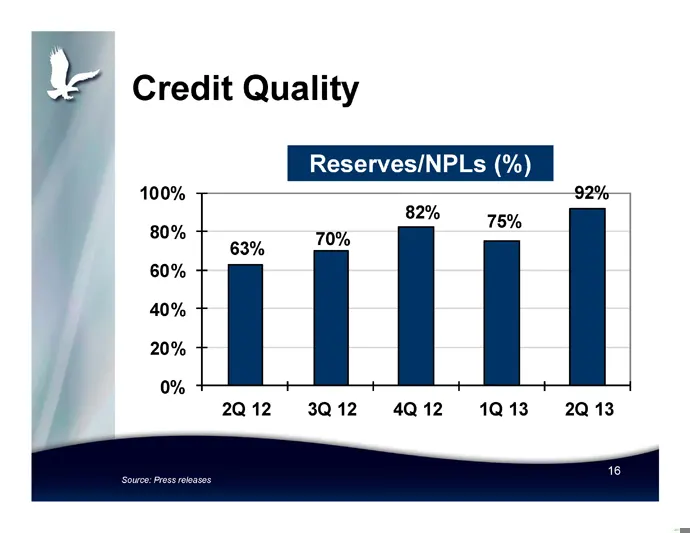
Slide 16: Credit Quality: Reserves/NPLs
Reserves/NPLs (%) Credit Quality 63% 70% 82% 75% 92% 0% 20% 40% 60% 80% 100% 2Q 12 3Q 12 4Q 12 1Q 13 2Q 13 16 Source: Press releases
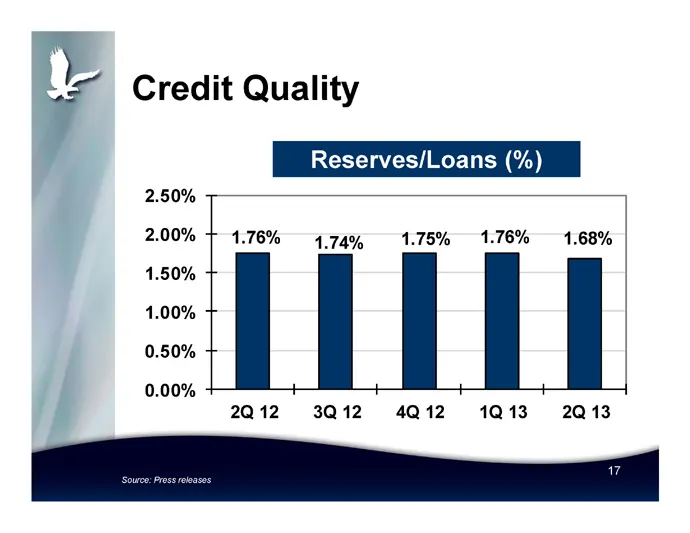
Slide 17: Credit Quality: Reserves/Loans
17 Credit Quality Reserves/Loans (%) 1.76% 1.74% 1.75% 1.76% 1.68% 0.00% 0.50% 1.00% 1.50% 2.00% 2.50% 2Q 12 3Q 12 4Q 12 1Q 13 2Q 13 Source: Press releases
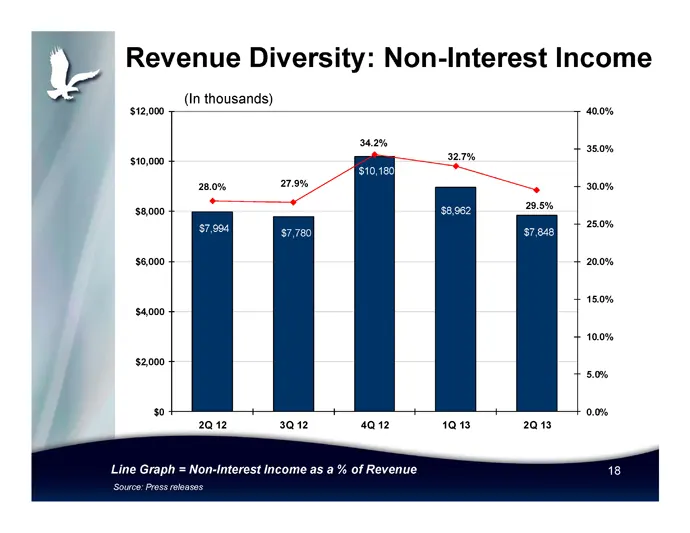
Slide 18: Revenue Diversity: Non-Interest Income
$7,994 $7,780 $10,180 $8,962 $7,848 28.0% 27.9% 34.2% 32.7% 29.5% 0.0% 5.0% 10.0% 15.0% 20.0% 25.0% 30.0% 35.0% 40.0% $0 $2,000 $4,000 $6,000 $8,000 $10,000 $12,000 2Q 12 3Q 12 4Q 12 1Q 13 2Q 13 Revenue Diversity: Non - Interest Income 18 Source: Press releases Line Graph = Non - Interest Income as
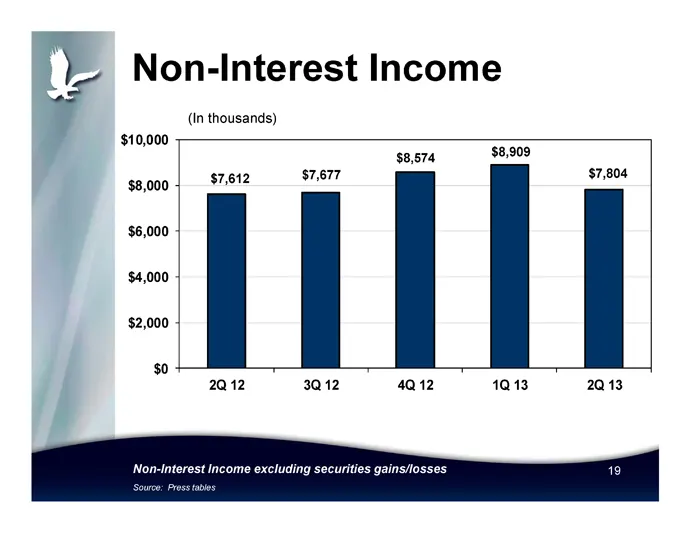
Slide 19: Non-Interest Income
$7,612 $7,677 $8,574 $8,909 $7,804 $0 $2,000 $4,000 $6,000 $8,000 $10,000 2Q 12 3Q 12 4Q 12 1Q 13 2Q 13 Non - Interest Income Source: Press tables 19 (In thousands) Non - Interest Income excluding securities gains/losses
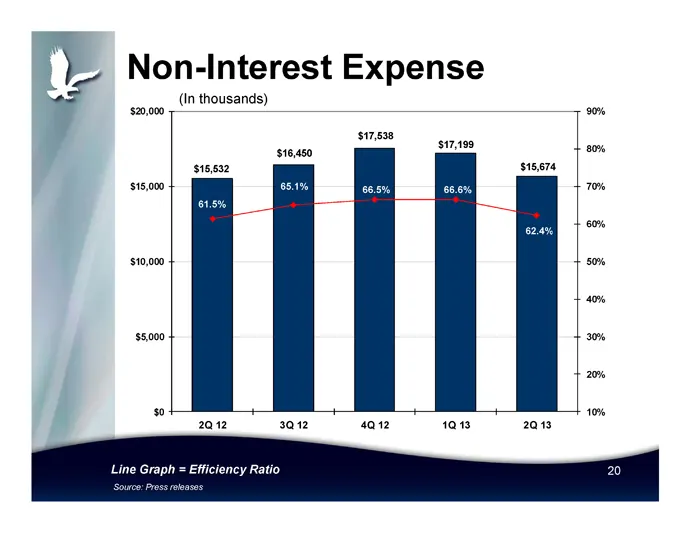
Slide 20: Non-Interest Expense
$15,532 $16,450 $17,538 $17,199 $15,674 61.5% 65.1% 66.5% 66.6% 62.4% 10% 20% 30% 40% 50% 60% 70% 80% 90% $0 $5,000 $10,000 $15,000 $20,000 2Q 12 3Q 12 4Q 12 1Q 13 2Q 13 Non - Interest Expense 20 Source: Press releases Line Graph = Efficiency Ratio (In thousands)
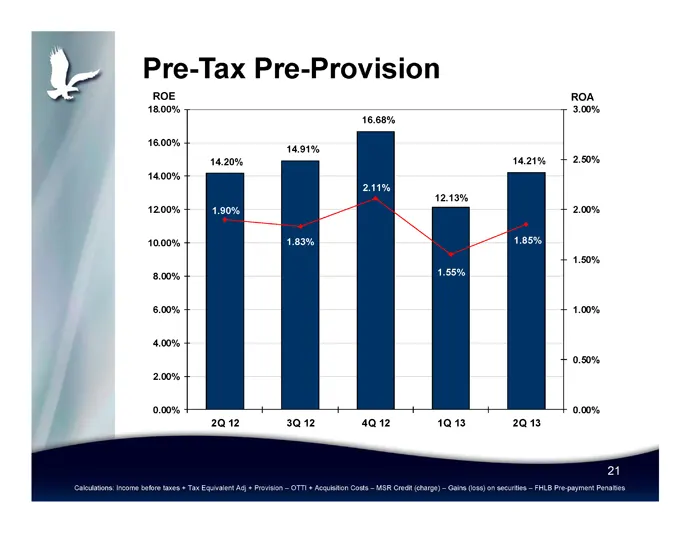
Slide 21: Pre-Tax Pre-Provision ROA and ROE
14.20% 14.91% 16.68% 12.13% 14.21% 1.90% 1.83% 2.11% 1.55% 1.85% 0.00% 0.50% 1.00% 1.50% 2.00% 2.50% 3.00% 0.00% 2.00% 4.00% 6.00% 8.00% 10.00% 12.00% 14.00% 16.00% 18.00% 2Q 12 3Q 12 4Q 12 1Q 13 2Q 13 Pre - Tax Pre - Provision ROA ROE 21 Calculations: Income before taxes + Tax Equivalent Adj + Prov
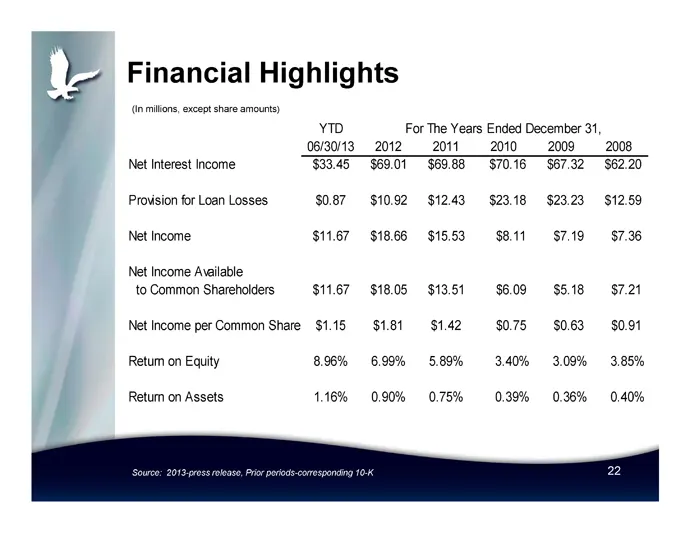
Slide 22: Financial Highlights
Financial Highlights Source: 2013 - press release, Prior periods - corresponding 10 - K YTD 06/30/13 2012 2011 2010 2009 2008 Net Interest Income $33.45 $69.01 $69.88 $70.16 $67.32 $62.20 Provision for Loan Losses $0.87 $10.92 $12.43 $23.18 $23.23 $12.59 Net Income $11.67 $18.66 $15.53 $8.11 $7.19 $
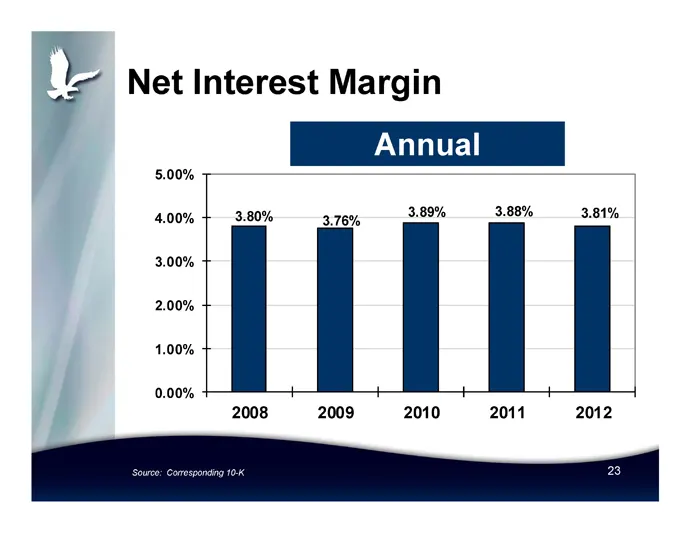
Slide 23: Net Interest Margin Annual
3.80% 3.76% 3.89% 3.88% 3.81% 0.00% 1.00% 2.00% 3.00% 4.00% 5.00% 2008 2009 2010 2011 2012 Net Interest Margin Annual 23 Source: Corresponding 10 - K
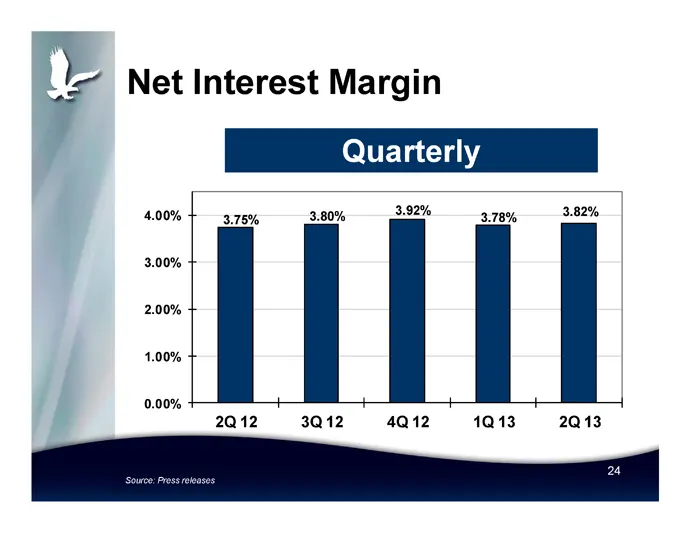
Slide 24: Net Interest Margin Quarterly
24 Net Interest Margin Quarterly 3.75% 3.80% 3.92% 3.78% 3.82% 0.00% 1.00% 2.00% 3.00% 4.00% 2Q 12 3Q 12 4Q 12 1Q 13 2Q 13 Source: Press releases
Slide 25: Quality Securities Portfolio
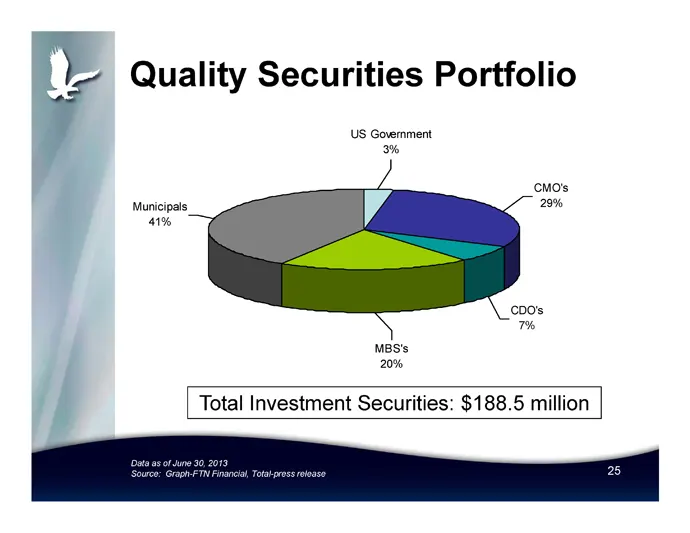
Municipals 41% US Government 3% CMO's 29% CDO's 7% MBS's 20% Total Investment Securities: $188.5 million Quality Securities Portfolio Data as of June 30, 2013 Source: Graph - FTN Financial, Total - press release 25
Slide 26: Bank Capital Levels
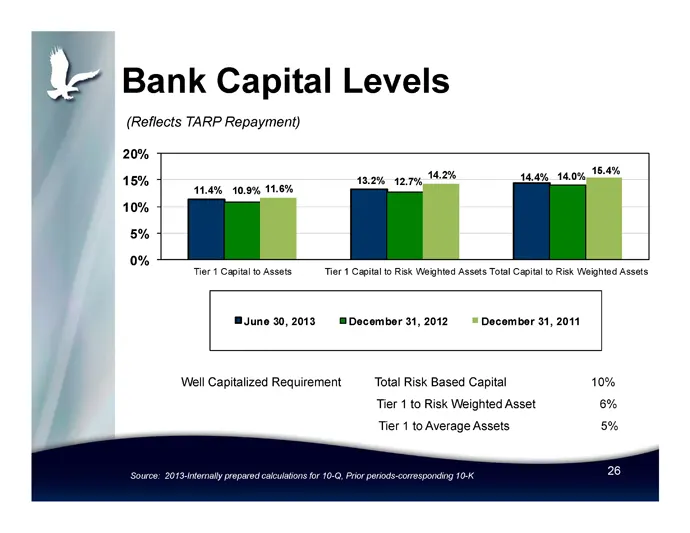
Bank Capital Levels 11.4% 13.2% 14.4% 10.9% 12.7% 14.0% 11.6% 14.2% 15.4% 0% 5% 10% 15% 20% Tier 1 Capital to Assets Tier 1 Capital to Risk Weighted Assets Total Capital to Risk Weighted Assets June 30, 2013 December 31, 2012 December 31, 2011 Well Capitalized Requirement Total Risk Based Capital 10
Slide 27: Holding Co. Capital Levels
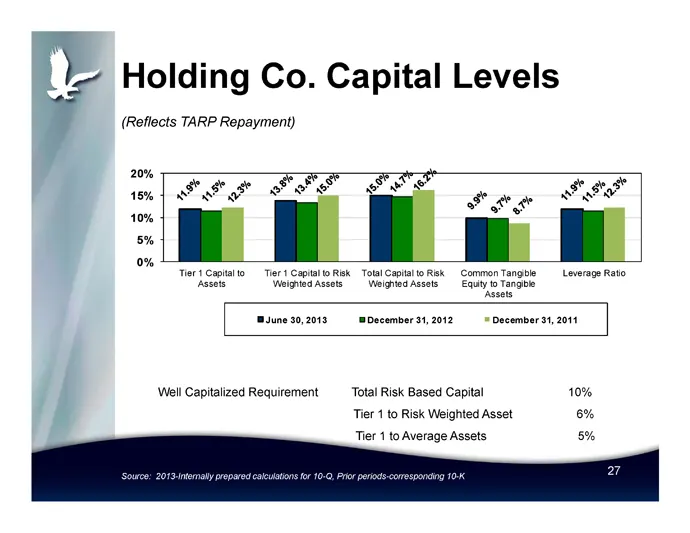
Holding Co. Capital Levels 0% 5% 10% 15% 20% Tier 1 Capital to Assets Tier 1 Capital to Risk Weighted Assets Total Capital to Risk Weighted Assets Common Tangible Equity to Tangible Assets Leverage Ratio June 30, 2013 December 31, 2012 December 31, 2011 Well Capitalized Requirement Total Risk Based
Slide 28: Strategic Focus
• Organic growth through newer markets, new relationships and deeper relationships in more established markets • Focus on revenue growth and expense control • Well - positioned for bank acquisition opportunities • Continued opportunities for insurance growth • Emphasize the Community Bank Difference
Slide 29: Summary
• Disciplined management team with proven track record • Reputation of focusing on fundamentals • Strong capital levels • Balance sheet strength – attractive core deposit base • Balanced loan portfolio with a disciplined approach to lending • History of successful integration of bank and insurance a
Source: SEC EDGAR · 8-K filed Jul 30, 2013
More decks from Premier Financial Corp
 Investor Presentation (February 2025)51 slides · Feb 10, 2025
 Q4 2024 Earnings Presentation23 slides · Jan 22, 2025
 Q3 2024 Earnings Presentation50 slides · Nov 6, 2024
 Q3 2024 Earnings Presentation22 slides · Oct 23, 2024
 Investor Presentation (August 2024)54 slides · Aug 30, 2024
 Merger or Acquisition (July 2024)39 slides · Jul 26, 2024