Cantel Medical — Investor Presentation (December 2020)
32 slides from Cantel Medical's investor presentation, Dec 10, 2020
Slide 1: Investor Presentation December 2020
Investor Presentation December 2020
Slide 2: Leading Global Brands consistently able to grow faster than the market
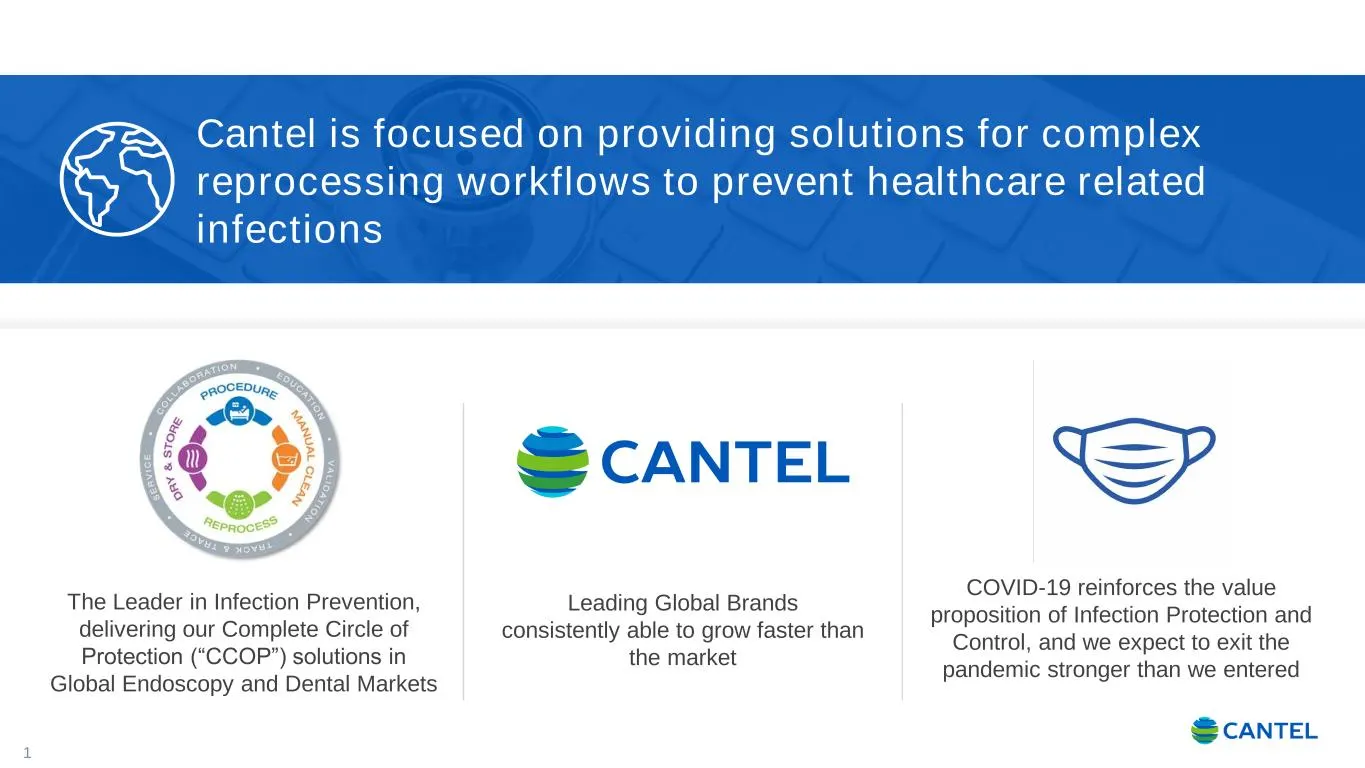
1 Leading Global Brands consistently able to grow faster than the market Cantel is focused on providing solutions for complex reprocessing workflows to prevent healthcare related infections The Leader in Infection Prevention, delivering our Complete Circle of Protection (“CCOP”) solutions in Global
Slide 3: Leveraging Our Fundamental Capabilities Across Channels
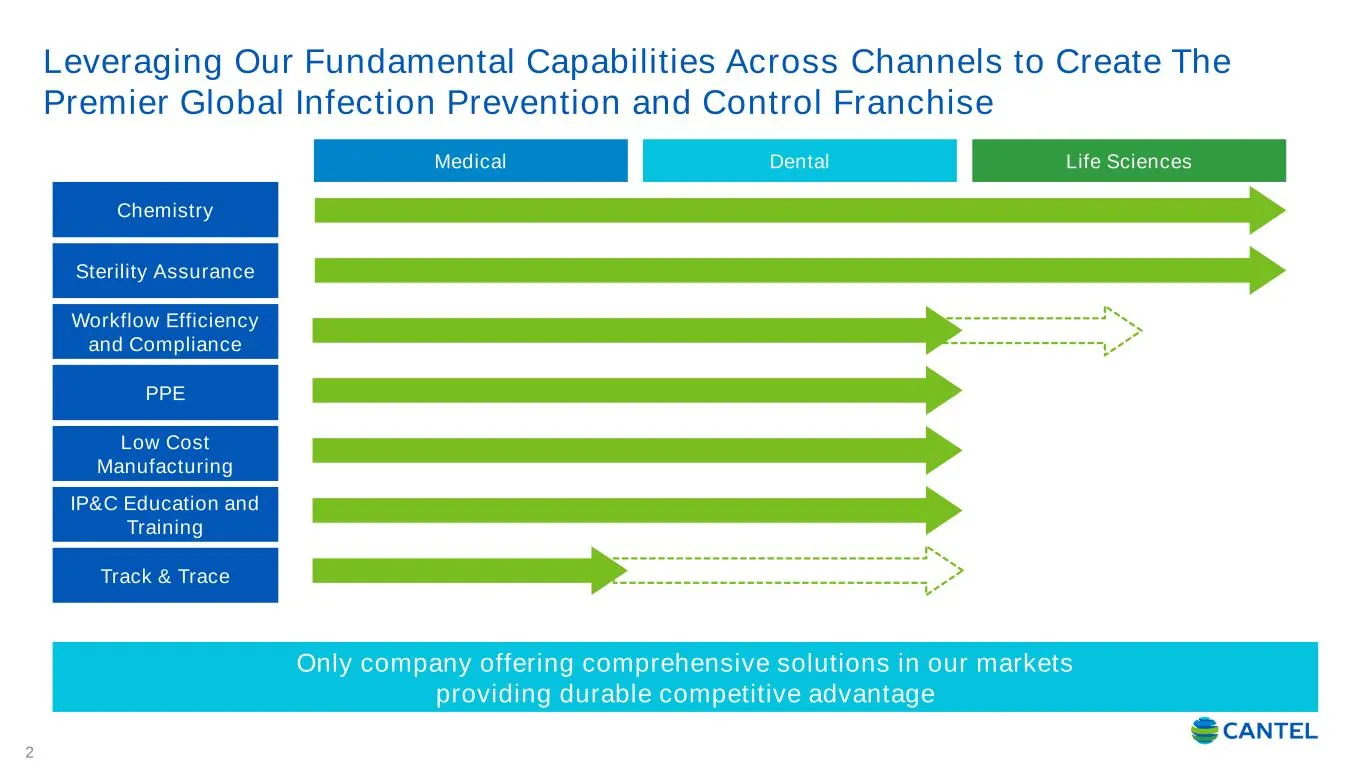
Leveraging Our Fundamental Capabilities Across Channels to Create The Premier Global Infection Prevention and Control Franchise 2 2 Chemistry Sterility Assurance Workflow Efficiency and Compliance PPE Low Cost Manufacturing IP&C Education and Training Track & Trace Only company offering comprehensiv
Slide 4: Cantel Quick Stats
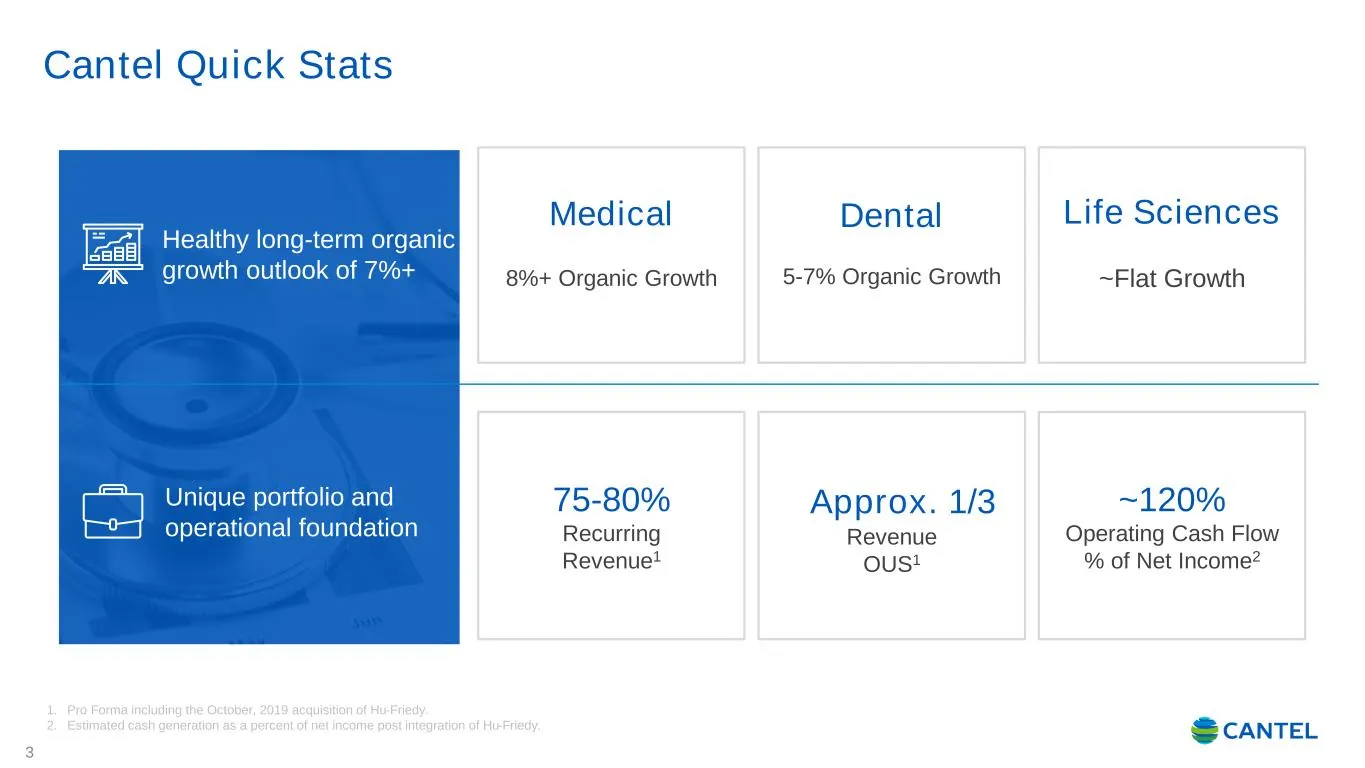
Cantel Quick Stats 3 1. Pro Forma including the October, 2019 acquisition of Hu-Friedy. 2. Estimated cash generation as a percent of net income post integration of Hu-Friedy. Healthy long-term organic growth outlook of 7%+ Unique portfolio and operational foundation Medical 8%+ Organic Growth Dental
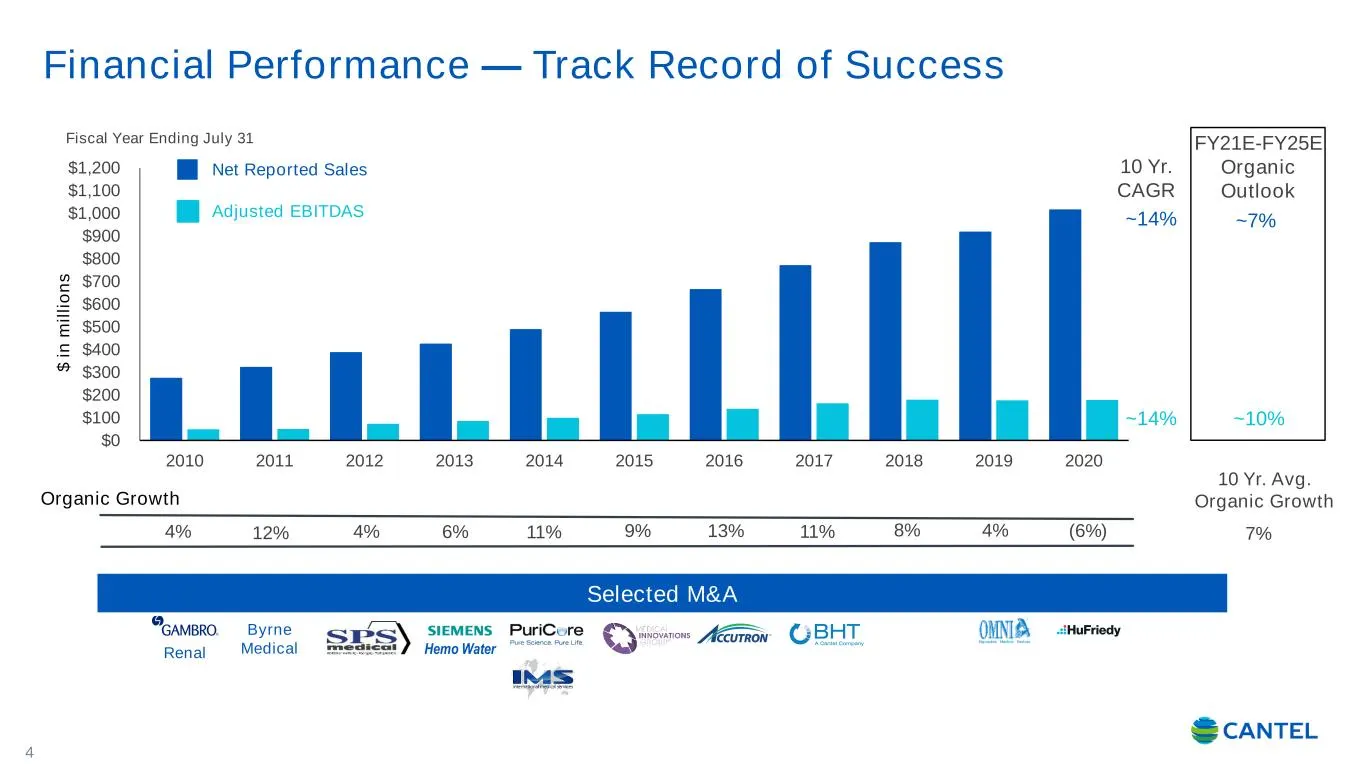
Slide 5: Financial Performance — Track Record of Success
$0 $100 $200 $300 $400 $500 $600 $700 $800 $900 $1,000 $1,100 $1,200 2010 2011 2012 2013 2014 2015 2016 2017 2018 2019 2020 $ i n m il li o n s 2,3 Financial Performance — Track Record of Success 4 10 Yr. CAGR ~14% ~14% Net Reported Sales Adjusted EBITDAS Organic Growth 4% 12% 6% 11% 9% 11% 8% 4% 4%
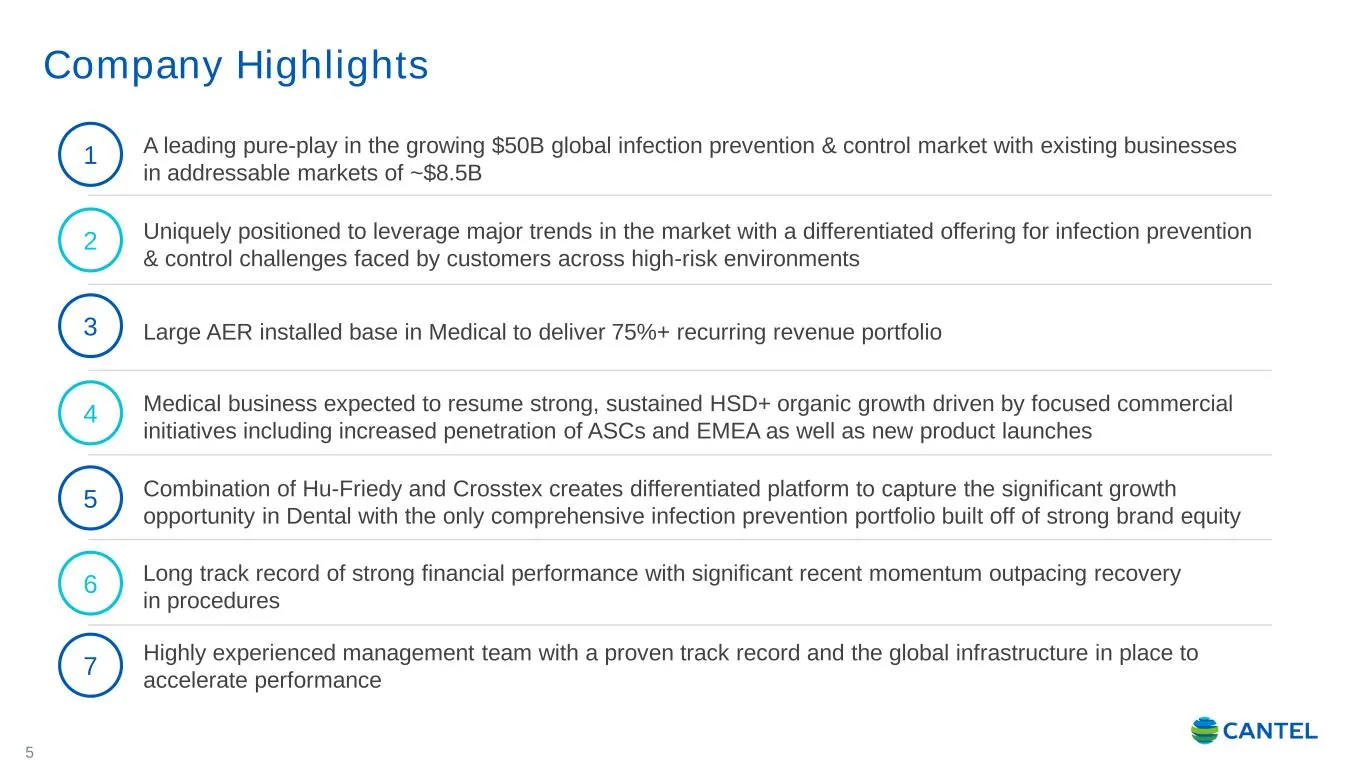
Slide 6: Company Highlights
Company Highlights 5 A leading pure-play in the growing $50B global infection prevention & control market with existing businesses in addressable markets of ~$8.5B 1 Uniquely positioned to leverage major trends in the market with a differentiated offering for infection prevention & control challenge
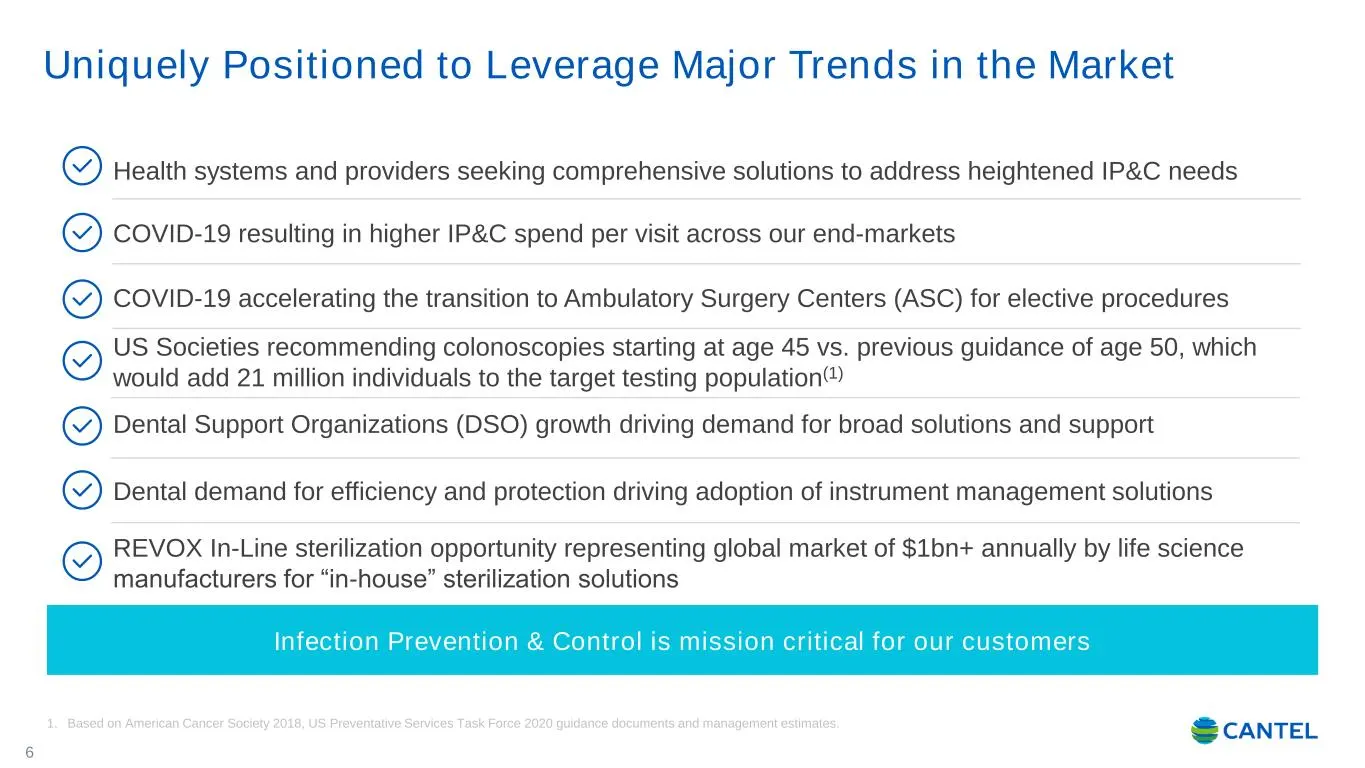
Slide 7: Uniquely Positioned to Leverage Major Trends in the Market
COVID-19 resulting in higher IP&C spend per visit across our end-markets COVID-19 accelerating the transition to Ambulatory Surgery Centers (ASC) for elective procedures Uniquely Positioned to Leverage Major Trends in the Market 6 Health systems and providers seeking comprehensive solutions to addre
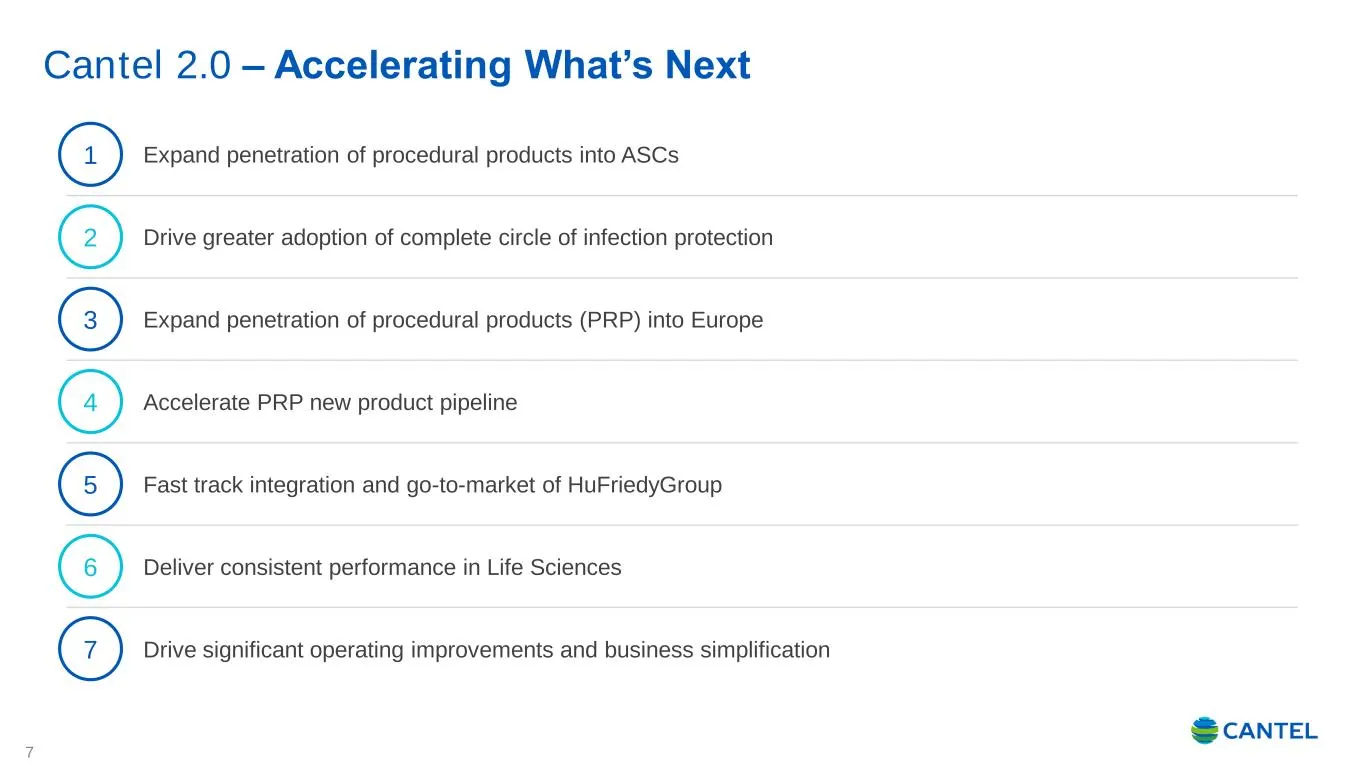
Slide 8: Cantel 2.0 – Accelerating What's Next
Expand penetration of procedural products into ASCs Drive greater adoption of complete circle of infection protection Expand penetration of procedural products (PRP) into Europe Accelerate PRP new product pipeline Fast track integration and go-to-market of HuFriedyGroup Deliver consistent performanc
Slide 9: Well Diversified Portfolio of IP&C Businesses
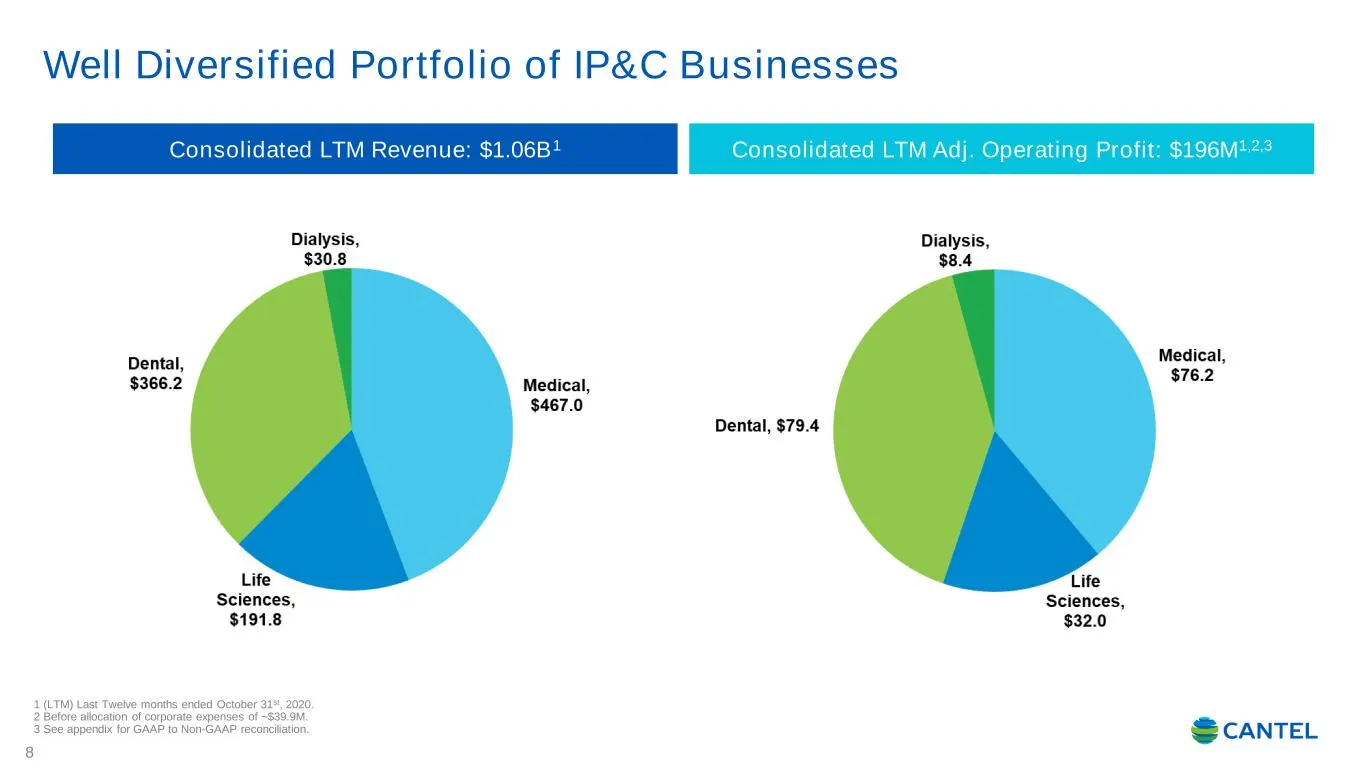
Well Diversified Portfolio of IP&C Businesses 8 Consolidated LTM Adj. Operating Profit: $196M1,2,3Consolidated LTM Revenue: $1.06B1 1 (LTM) Last Twelve months ended October 31st, 2020. 2 Before allocation of corporate expenses of ~$39.9M. 3 See appendix for GAAP to Non-GAAP reconciliation.
Slide 10: Medical Segment Overview
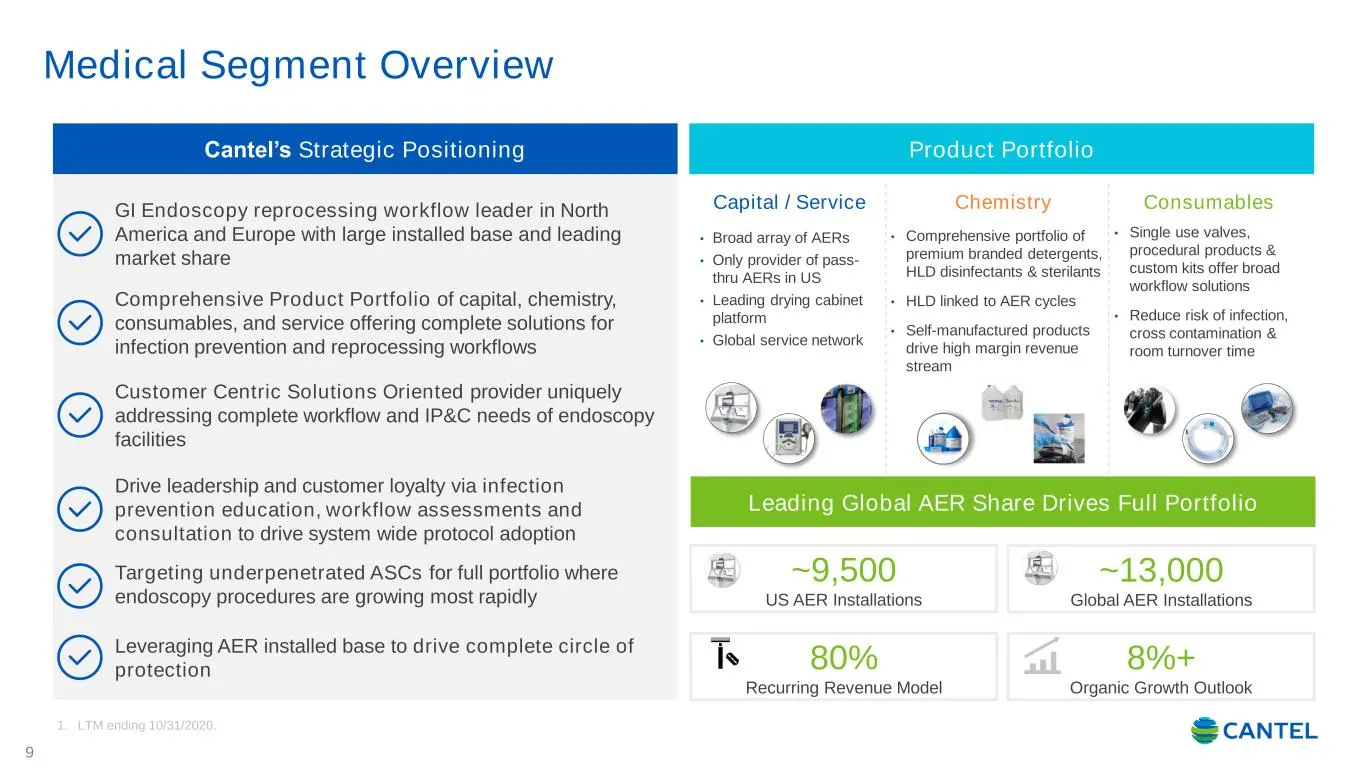
Medical Segment Overview 9 Product PortfolioCantel’s Strategic Positioning GI Endoscopy reprocessing workflow leader in North America and Europe with large installed base and leading market share Comprehensive Product Portfolio of capital, chemistry, consumables, and service offering complete soluti
Slide 11: Our Complete Circle of Protection in the Endoscope Reprocessing Cycle
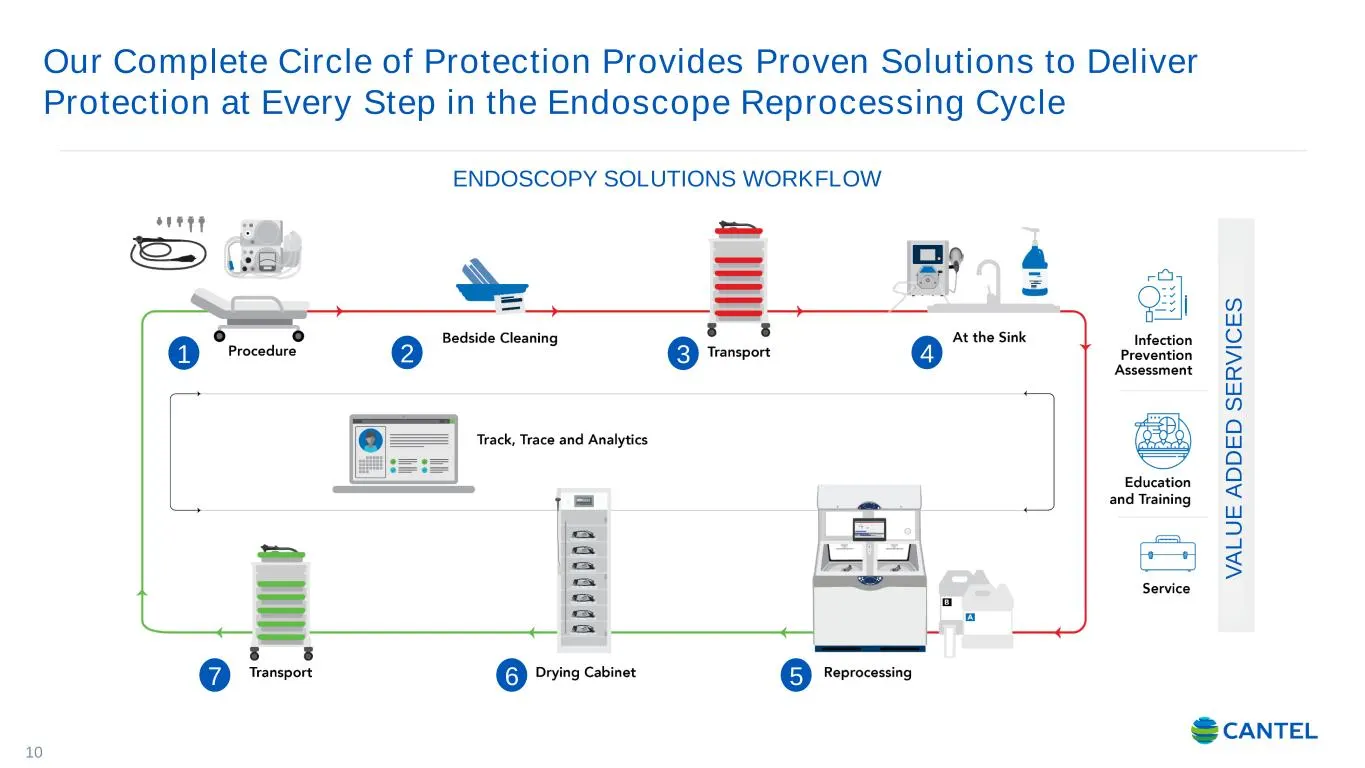
Our Complete Circle of Protection Provides Proven Solutions to Deliver Protection at Every Step in the Endoscope Reprocessing Cycle 10 ENDOSCOPY SOLUTIONS WORKFLOW V A L U E A D D E D S E R V IC E S 1 2 3 4 567
Slide 12: Endoscopy Market Dynamics
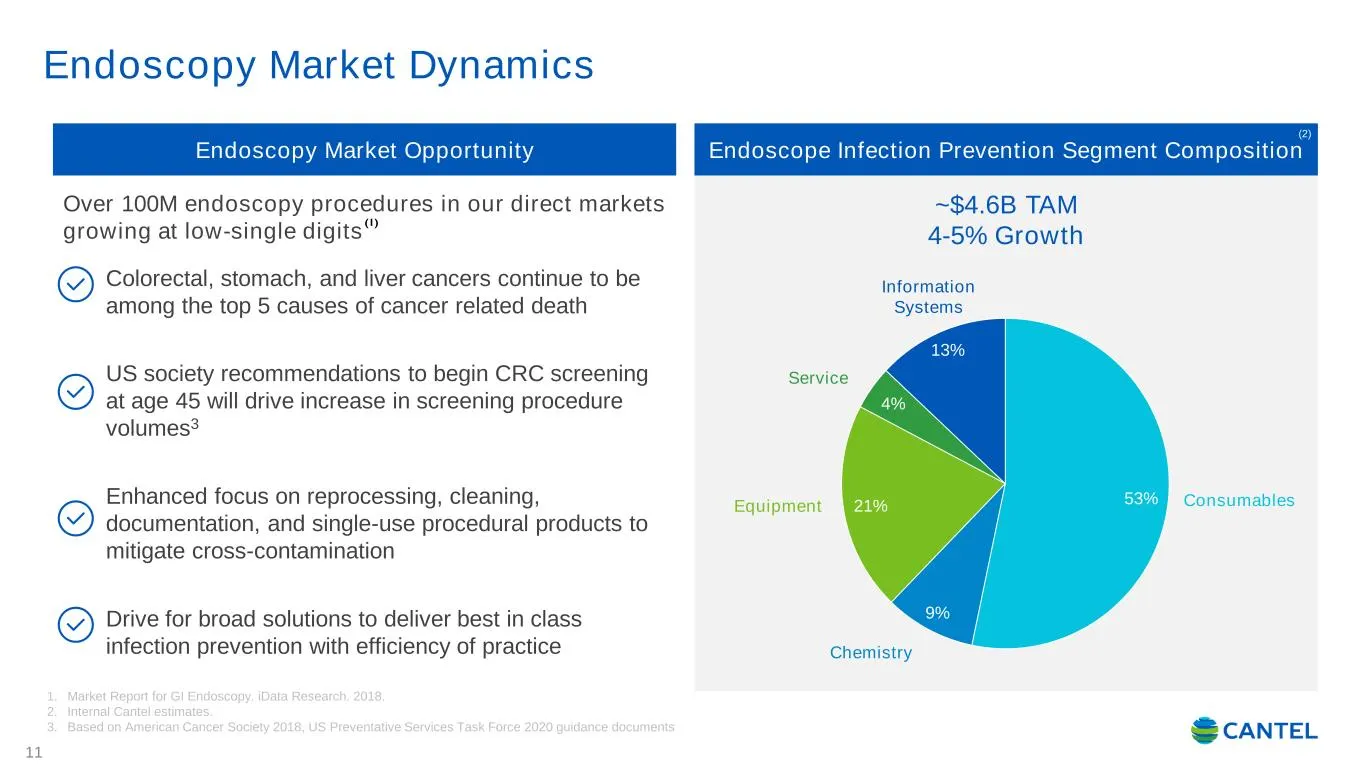
Endoscopy Market Dynamics 11 Endoscopy Market Opportunity Over 100M endoscopy procedures in our direct markets growing at low-single digits Colorectal, stomach, and liver cancers continue to be among the top 5 causes of cancer related death US society recommendations to begin CRC screening at age 45
Slide 13: Key Growth Drivers – Medical
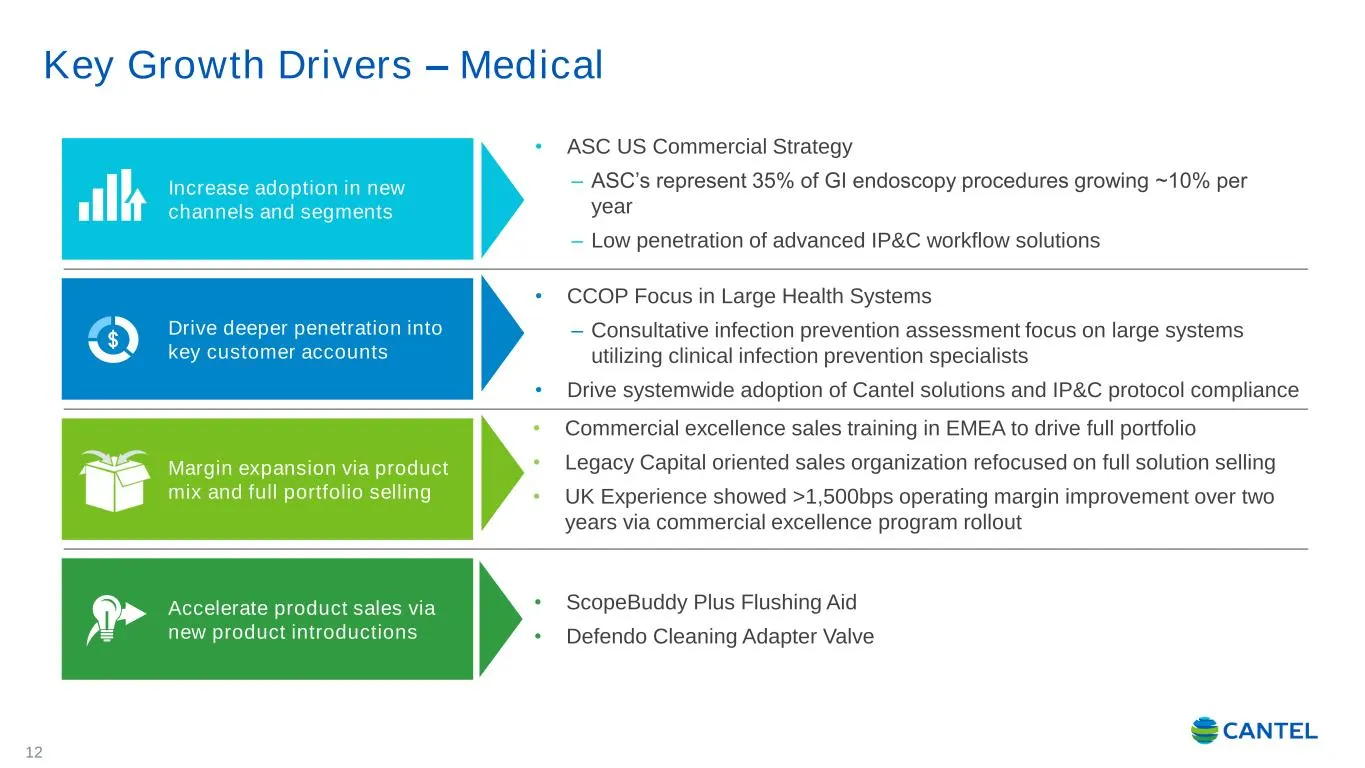
Key Growth Drivers – Medical 12 Increase adoption in new channels and segments Drive deeper penetration into key customer accounts Margin expansion via product mix and full portfolio selling Accelerate product sales via new product introductions • ASC US Commercial Strategy – ASC’s represent 35% of
Slide 14: Dental Segment Overview
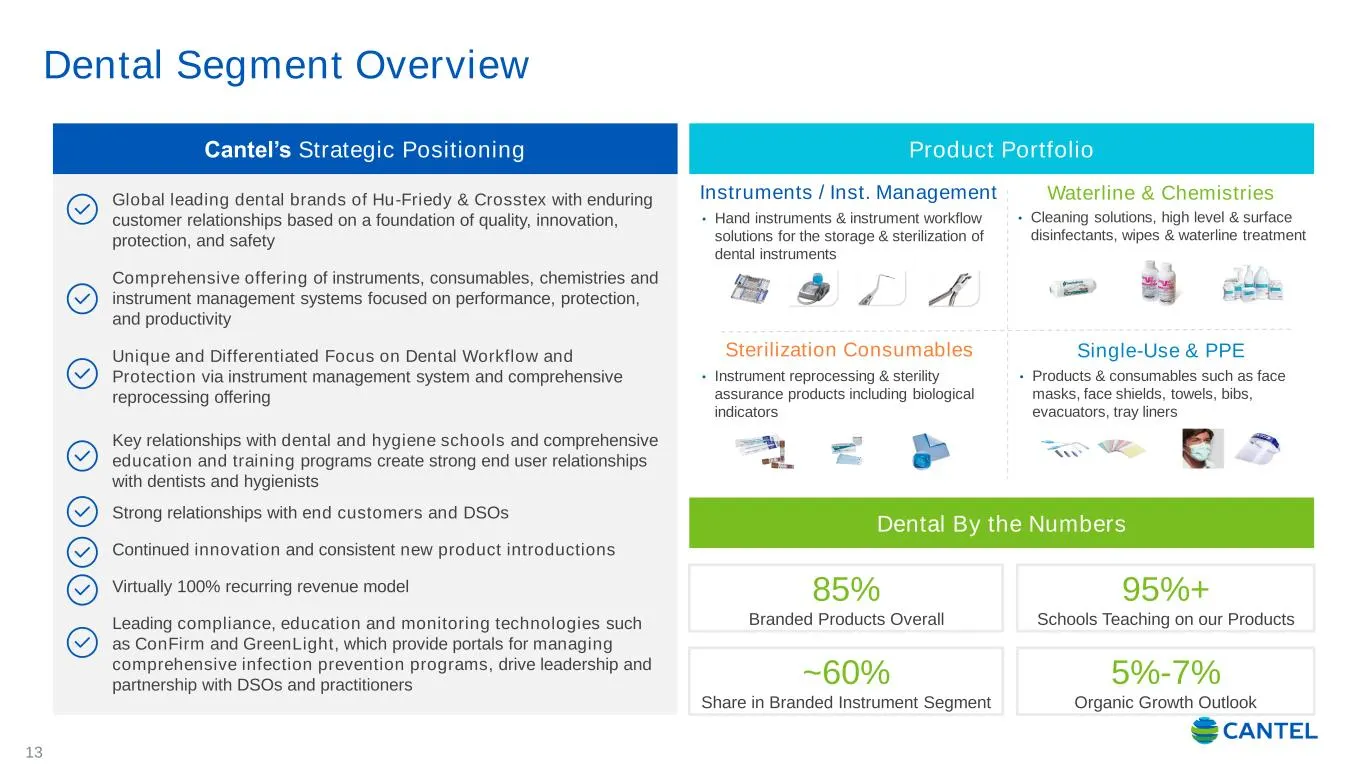
Dental Segment Overview 13 Product Portfolio Dental By the Numbers Cantel’s Strategic Positioning Global leading dental brands of Hu-Friedy & Crosstex with enduring customer relationships based on a foundation of quality, innovation, protection, and safety Comprehensive offering of instruments, cons
Slide 15: Our Complete Circle of Prevention – Dental
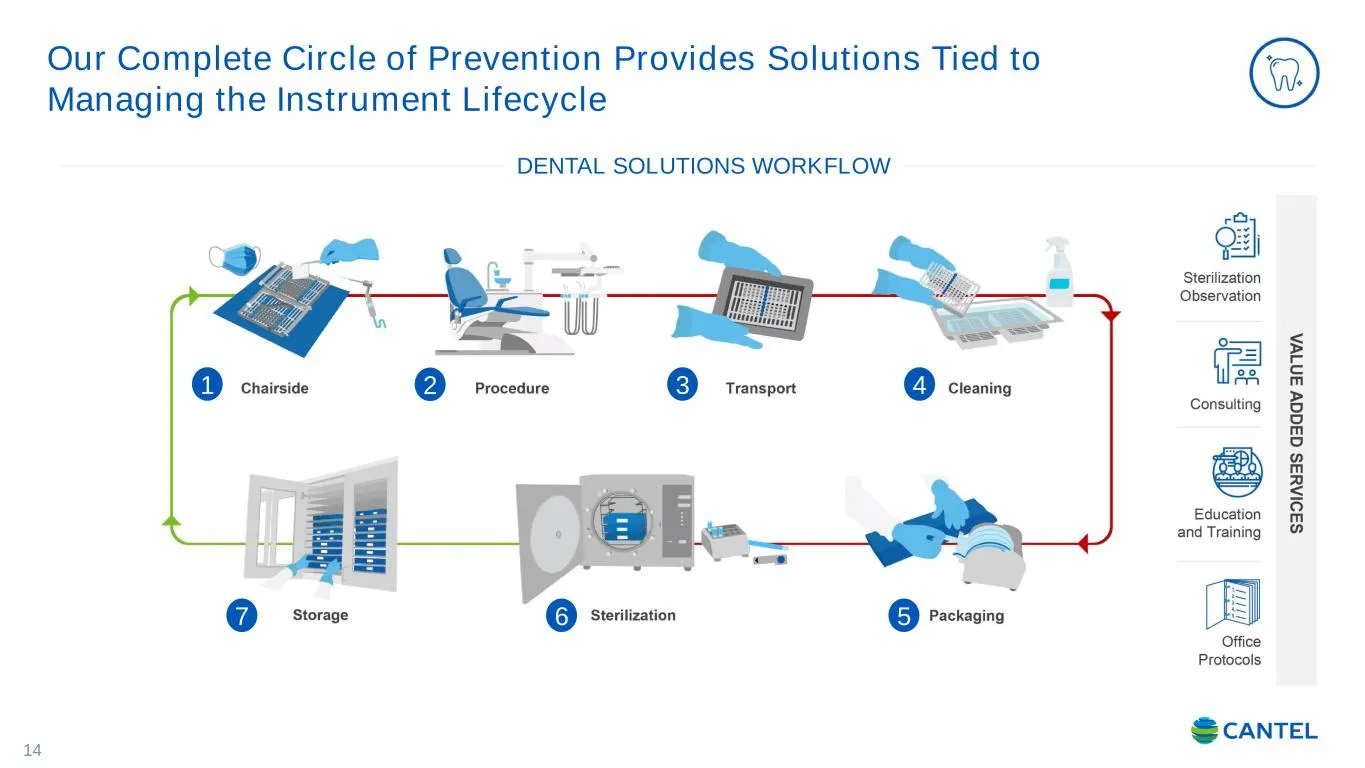
1 Our Complete Circle of Prevention Provides Solutions Tied to Managing the Instrument Lifecycle DENTAL SOLUTIONS WORKFLOW 4 1 2 3 4 567
Slide 16: Dental Market Dynamics
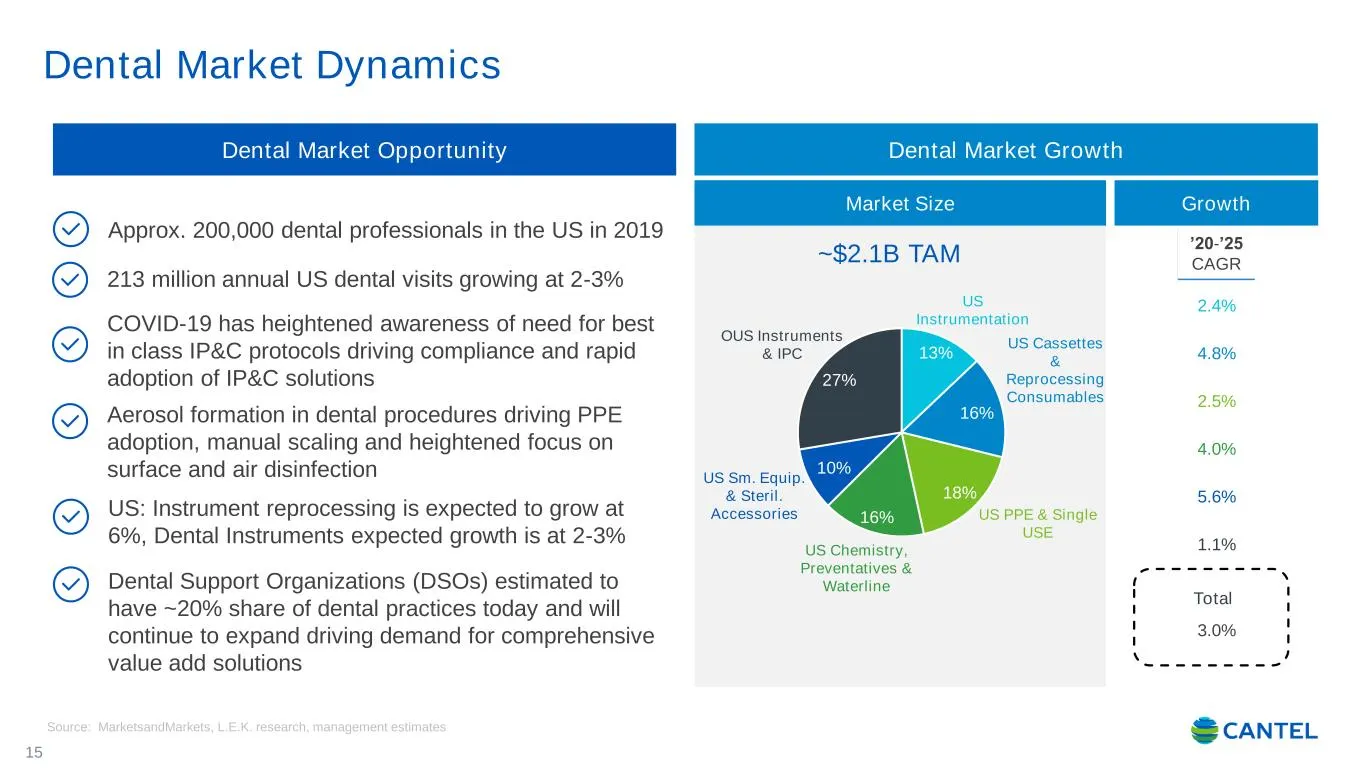
Dental Market Dynamics 15 Dental Market Opportunity Approx. 200,000 dental professionals in the US in 2019 213 million annual US dental visits growing at 2-3% COVID-19 has heightened awareness of need for best in class IP&C protocols driving compliance and rapid adoption of IP&C solutions US: Instru
Slide 17: Key Growth Drivers – Dental
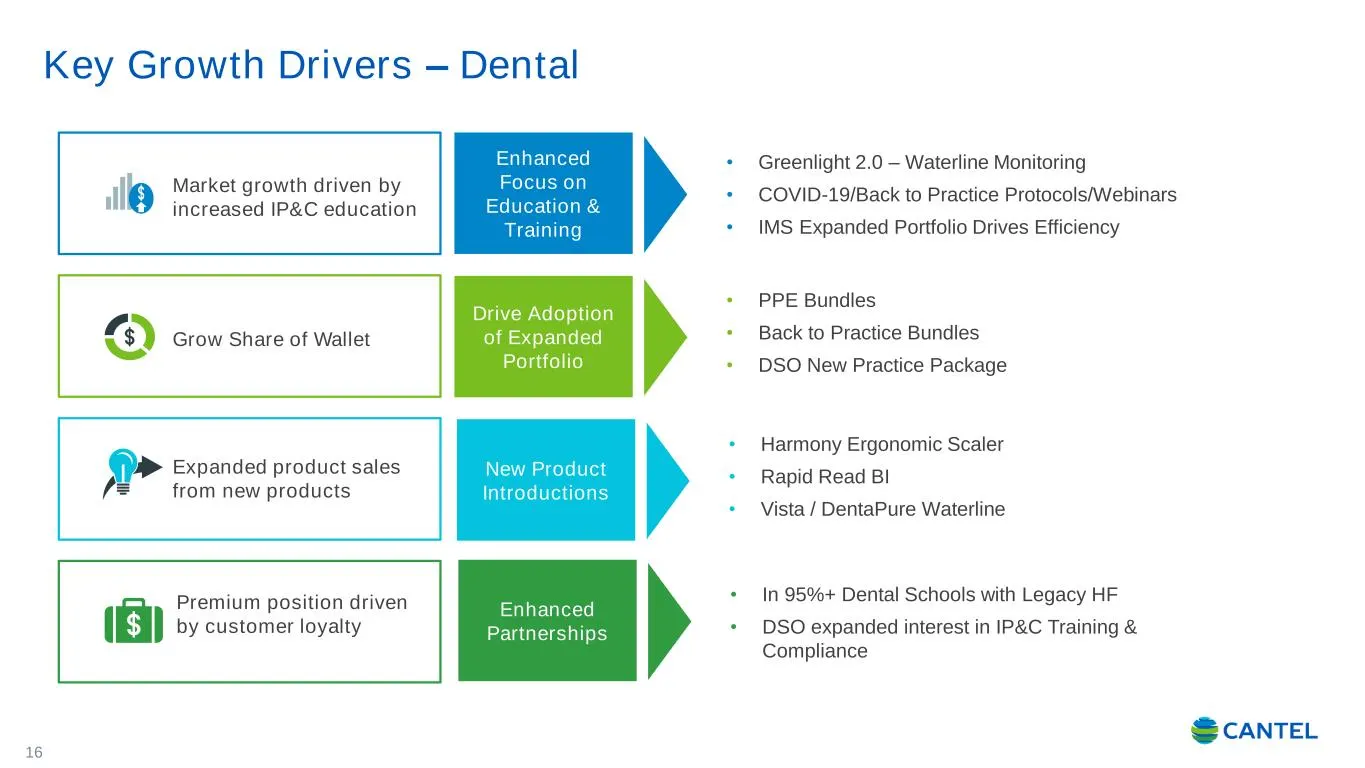
Key Growth Drivers – Dental 16 New Product Introductions Enhanced Focus on Education & Training Drive Adoption of Expanded Portfolio Enhanced Partnerships Expanded product sales from new products Market growth driven by increased IP&C education Grow Share of Wallet Premium position driven by custome
Slide 18: Life Sciences Segment Overview
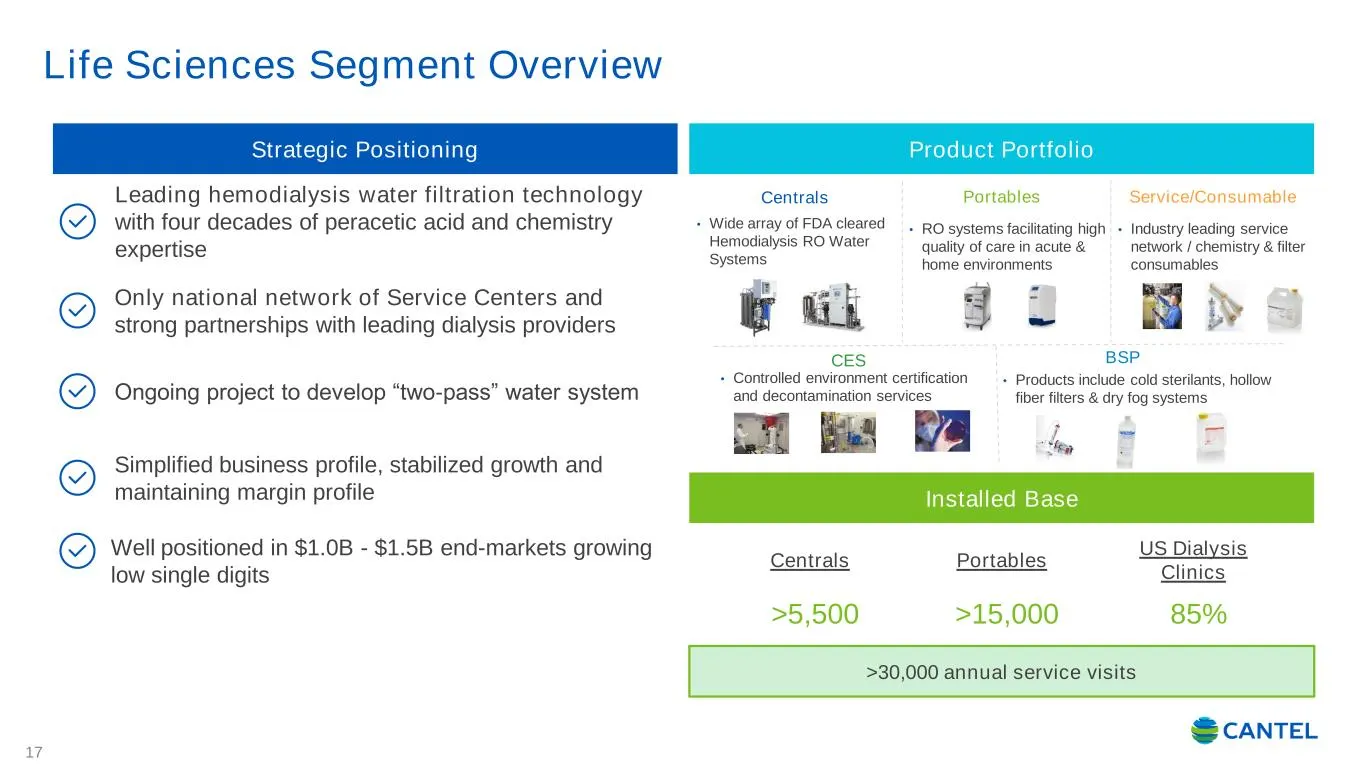
Life Sciences Segment Overview 17 Product Portfolio Installed Base Centrals Portables US Dialysis Clinics >30,000 annual service visits >5,500 >15,000 85% Strategic Positioning Leading hemodialysis water filtration technology with four decades of peracetic acid and chemistry expertise Only national
Slide 19: Capital Allocation Priorities
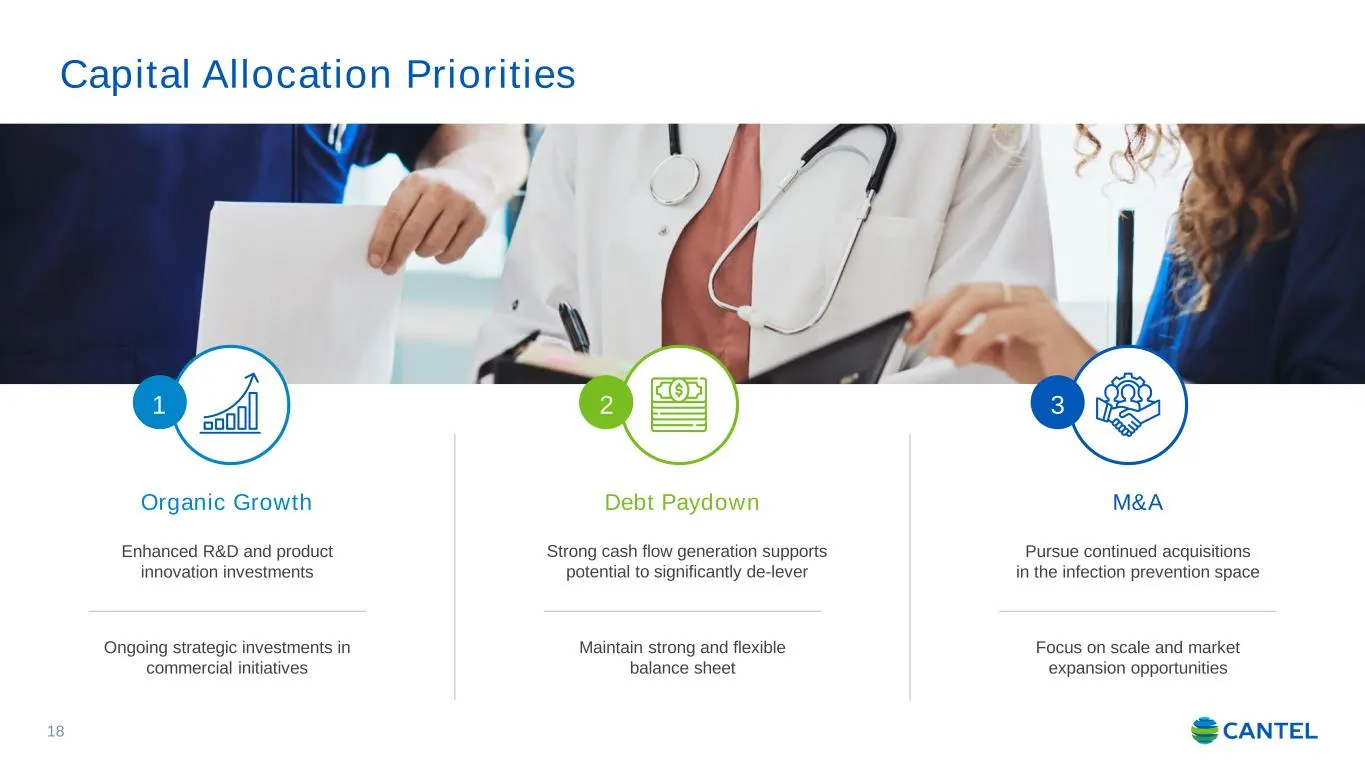
Capital Allocation Priorities 18 Enhanced R&D and product innovation investments Organic Growth Ongoing strategic investments in commercial initiatives 1 Strong cash flow generation supports potential to significantly de-lever Debt Paydown Maintain strong and flexible balance sheet 2 Pursue continue
Slide 20: Poised for Continued Growth and Margin Improvement
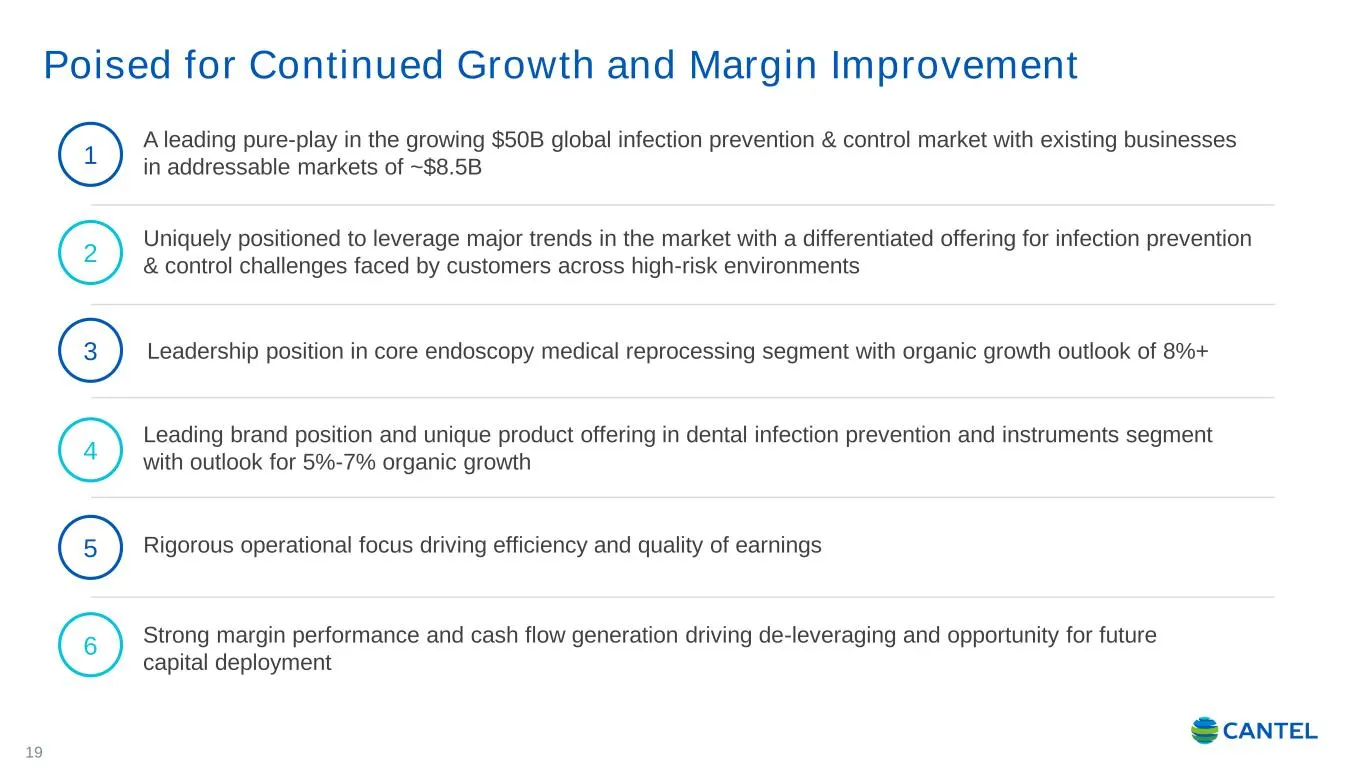
Poised for Continued Growth and Margin Improvement 19 A leading pure-play in the growing $50B global infection prevention & control market with existing businesses in addressable markets of ~$8.5B 1 Uniquely positioned to leverage major trends in the market with a differentiated offering for infecti
Slide 21: Cantel
S CANTEL
Slide 22: Forward Looking Statements
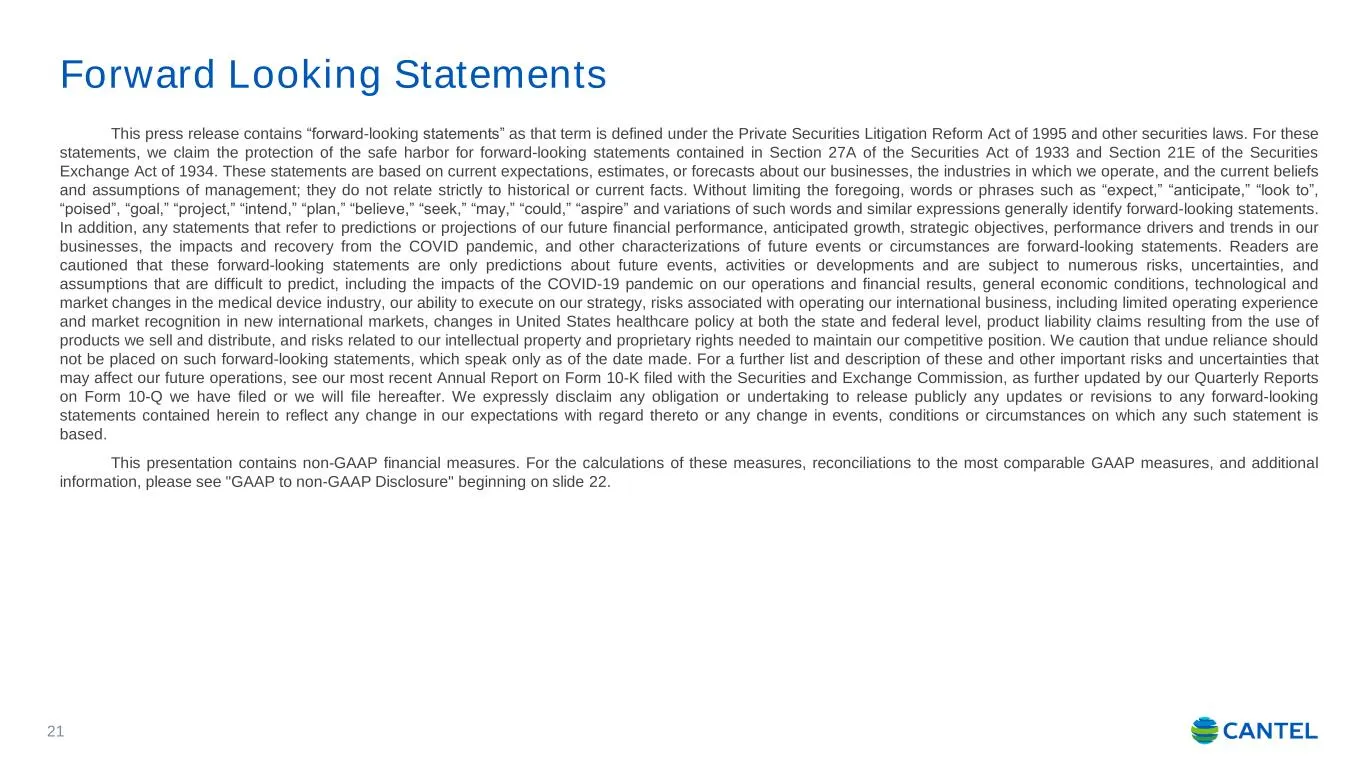
Forward Looking Statements 21 This press release contains “forward-looking statements” as that term is defined under the Private Securities Litigation Reform Act of 1995 and other securities laws. For these statements, we claim the protection of the safe harbor for forward-looking statements contain
Slide 23: GAAP to Non-GAAP EPS Disclosure
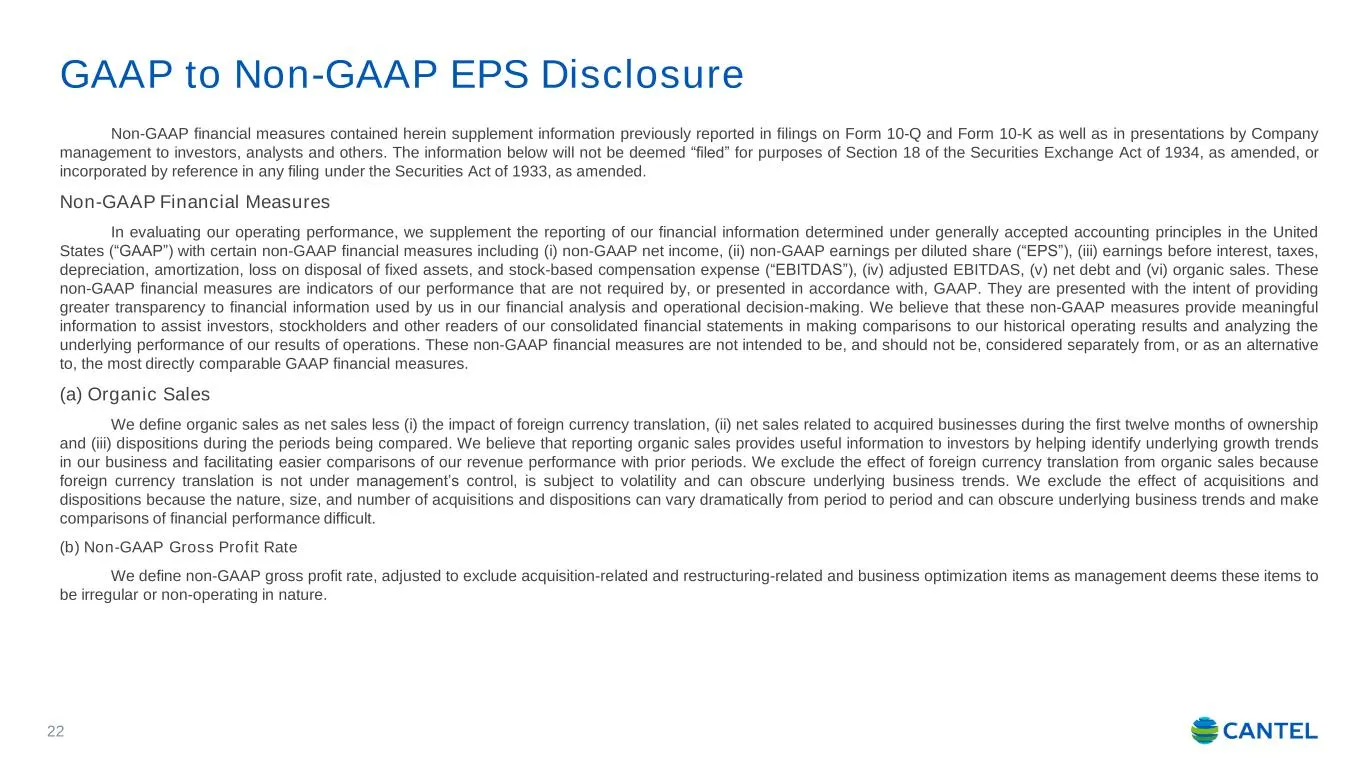
GAAP to Non-GAAP EPS Disclosure 22 Non-GAAP financial measures contained herein supplement information previously reported in filings on Form 10-Q and Form 10-K as well as in presentations by Company management to investors, analysts and others. The information below will not be deemed “filed” for p
Slide 24: GAAP to Non-GAAP EPS Disclosure (continued)
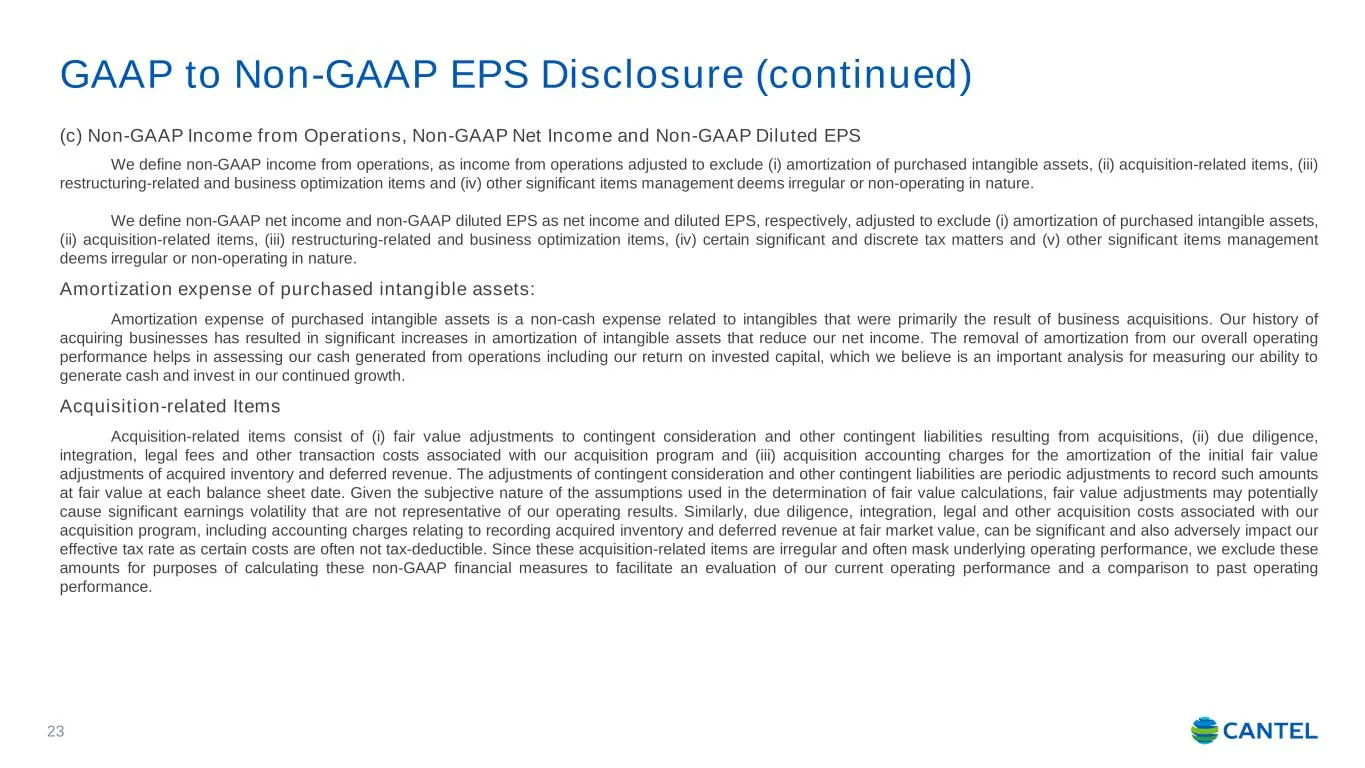
GAAP to Non-GAAP EPS Disclosure (continued) 23 (c) Non-GAAP Income from Operations, Non-GAAP Net Income and Non-GAAP Diluted EPS We define non-GAAP income from operations, as income from operations adjusted to exclude (i) amortization of purchased intangible assets, (ii) acquisition-related items, (
Slide 25: GAAP to Non-GAAP EPS Disclosure (continued)
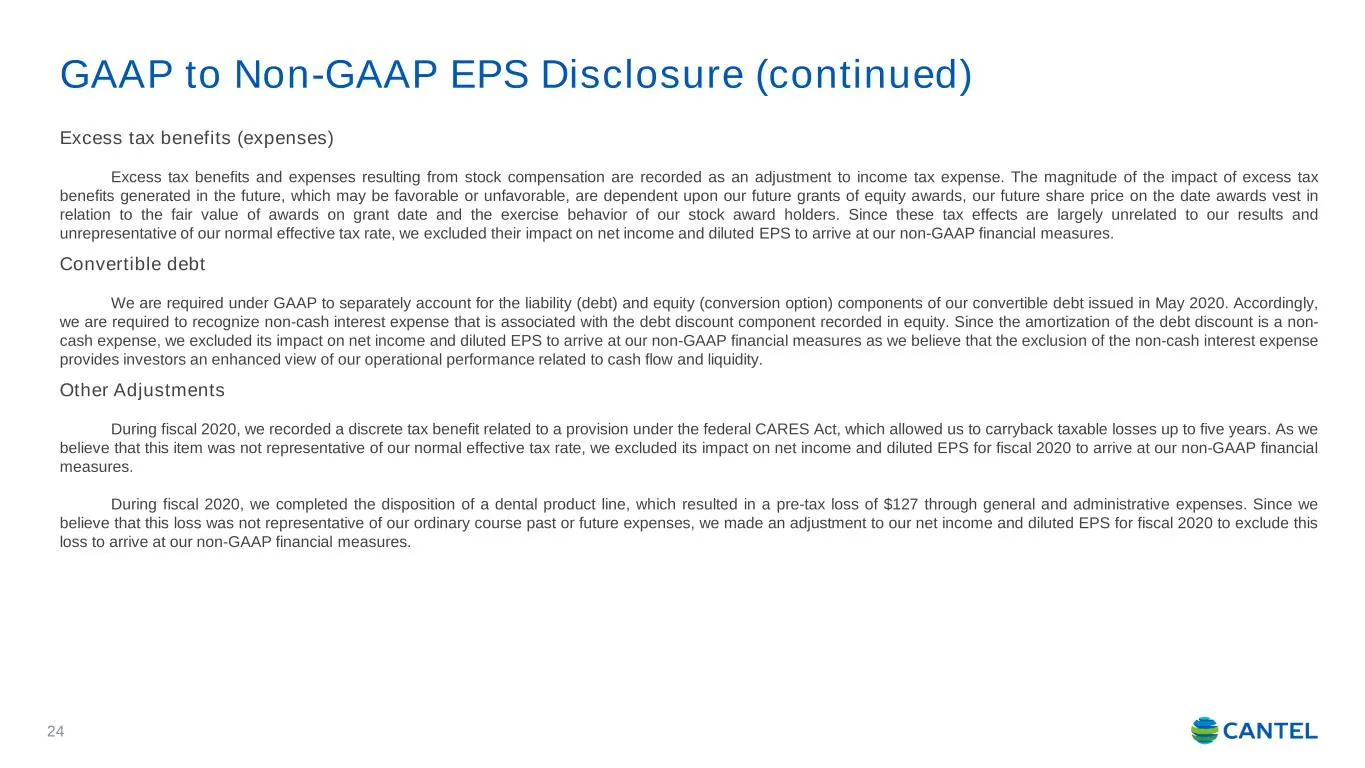
GAAP to Non-GAAP EPS Disclosure (continued) 24 Excess tax benefits (expenses) Excess tax benefits and expenses resulting from stock compensation are recorded as an adjustment to income tax expense. The magnitude of the impact of excess tax benefits generated in the future, which may be favorable or
Slide 26: GAAP to Non-GAAP EPS Disclosure (continued)
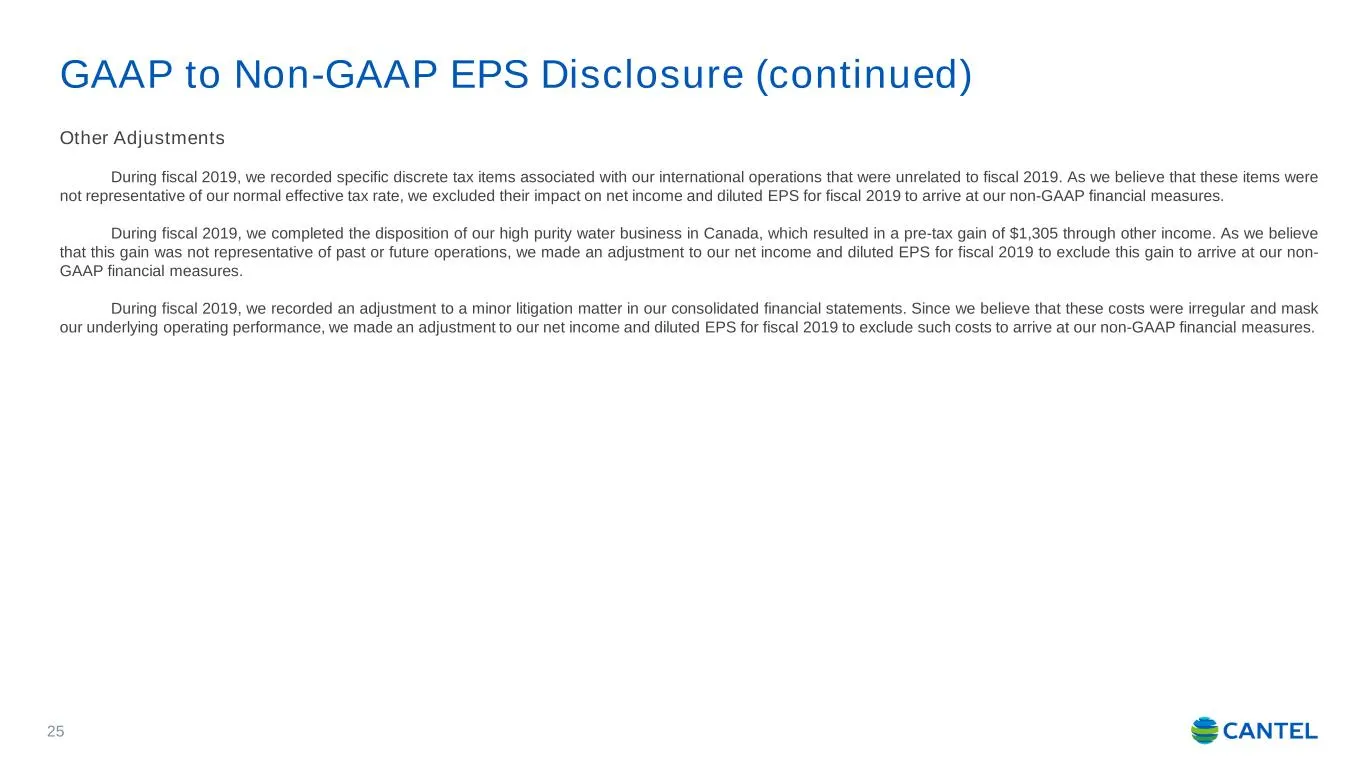
GAAP to Non-GAAP EPS Disclosure (continued) 25 Other Adjustments During fiscal 2019, we recorded specific discrete tax items associated with our international operations that were unrelated to fiscal 2019. As we believe that these items were not representative of our normal effective tax rate, we ex
Slide 27: Historical P&L
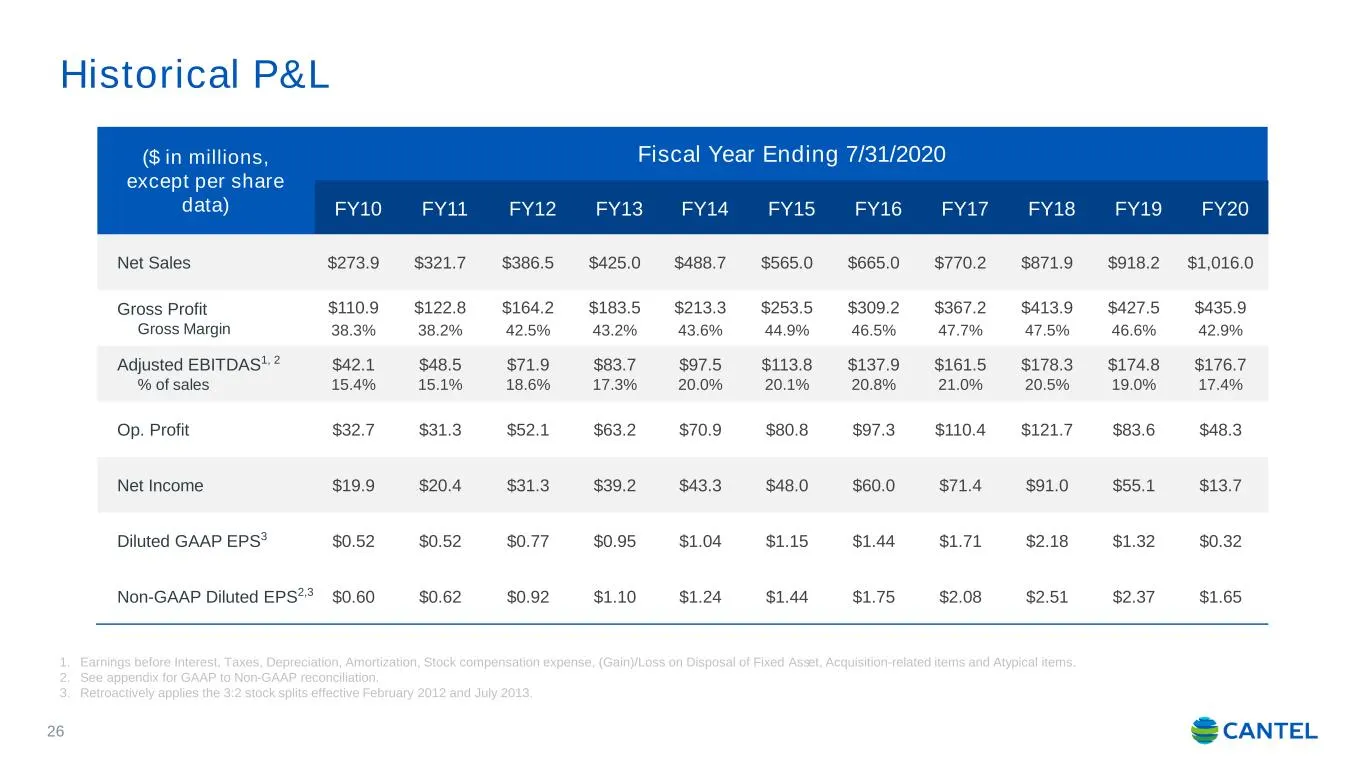
Historical P&L 26 ($ in millions, except per share data) Fiscal Year Ending 7/31/2020 FY10 FY11 FY12 FY13 FY14 FY15 FY16 FY17 FY18 FY19 FY20 Net Sales $273.9 $321.7 $386.5 $425.0 $488.7 $565.0 $665.0 $770.2 $871.9 $918.2 $1,016.0 Gross Profit Gross Margin $110.9 38.3% $122.8 38.2% $164.2 42.5% $183.
Slide 28: Balance Sheet & Cash Flow
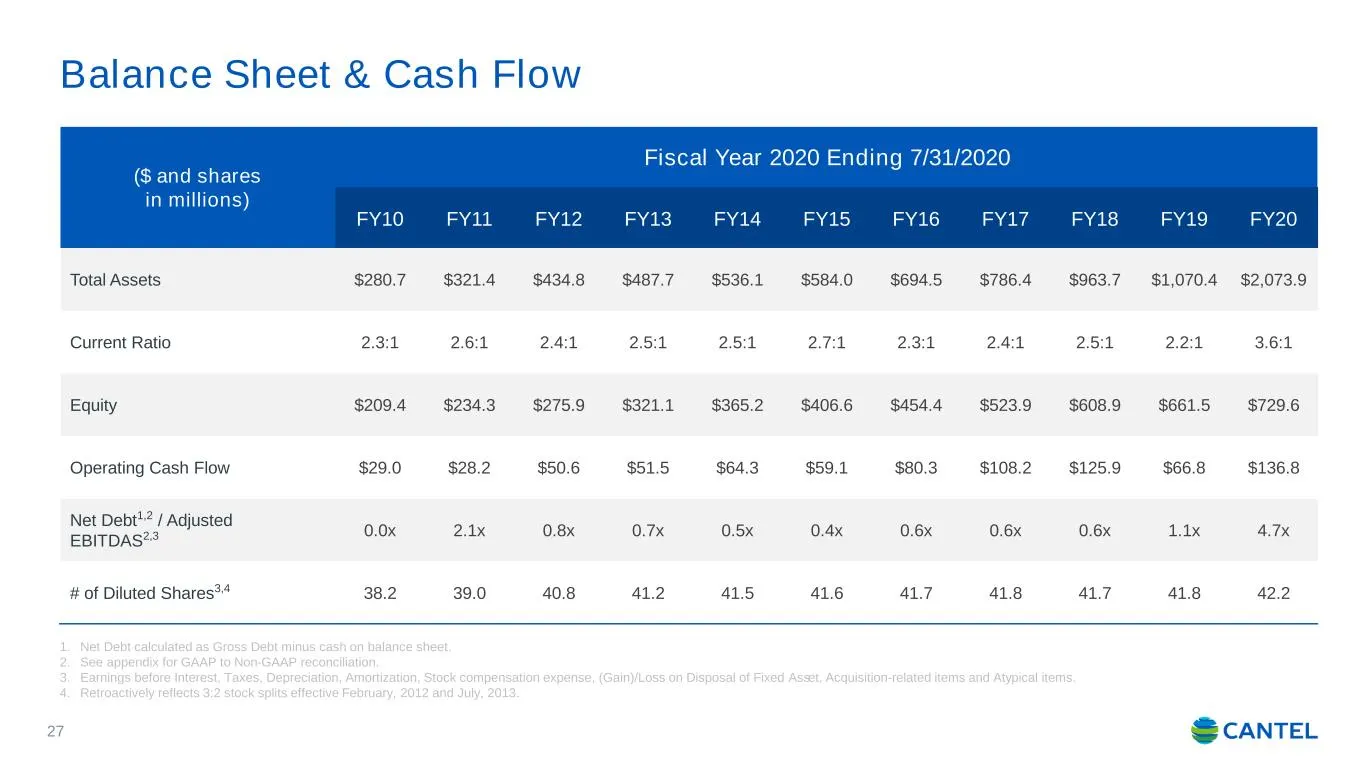
Balance Sheet & Cash Flow 27 1. Net Debt calculated as Gross Debt minus cash on balance sheet. 2. See appendix for GAAP to Non-GAAP reconciliation. 3. Earnings before Interest, Taxes, Depreciation, Amortization, Stock compensation expense, (Gain)/Loss on Disposal of Fixed Asset, Acquisition-related
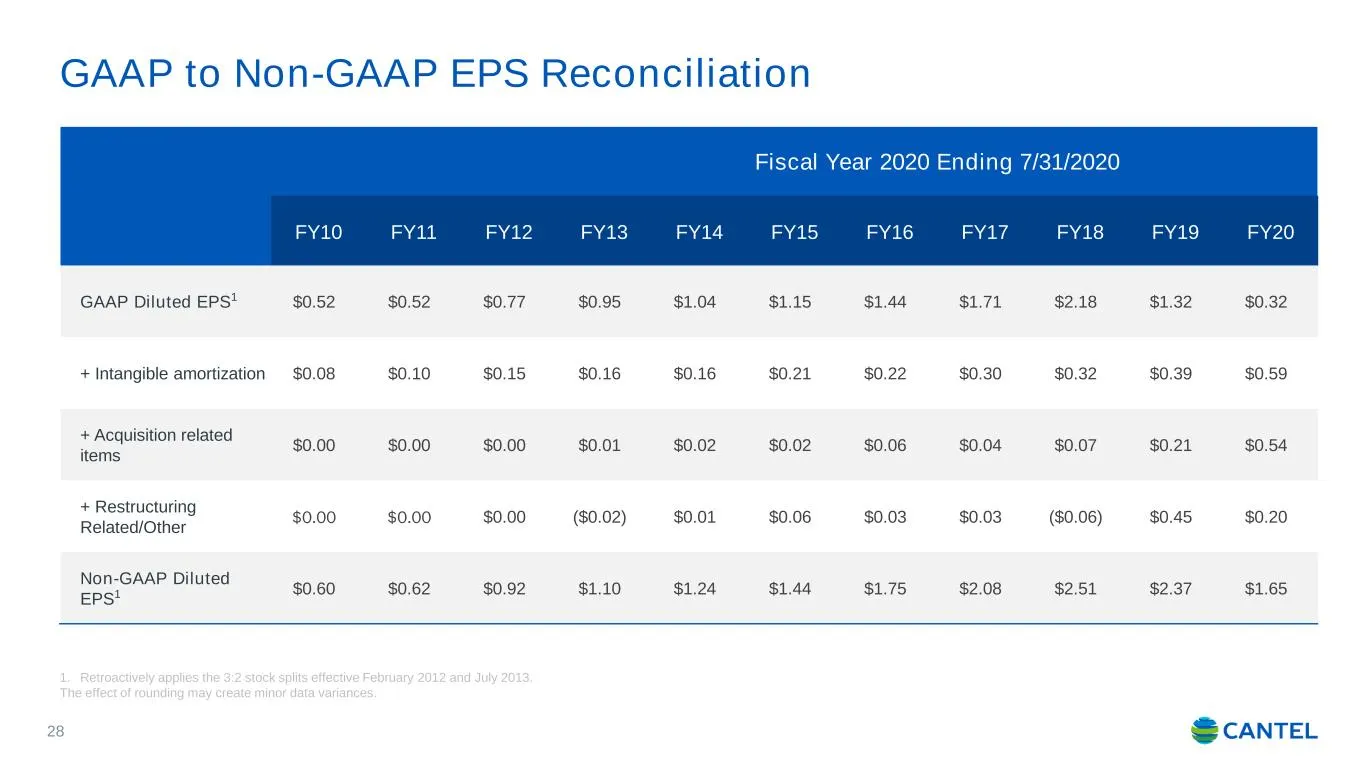
Slide 29: GAAP to Non-GAAP EPS Reconciliation
Fiscal Year 2020 Ending 7/31/2020 FY10 FY11 FY12 FY13 FY14 FY15 FY16 FY17 FY18 FY19 FY20 GAAP Diluted EPS1 $0.52 $0.52 $0.77 $0.95 $1.04 $1.15 $1.44 $1.71 $2.18 $1.32 $0.32 + Intangible amortization $0.08 $0.10 $0.15 $0.16 $0.16 $0.21 $0.22 $0.30 $0.32 $0.39 $0.59 + Acquisition related items $0.00 $
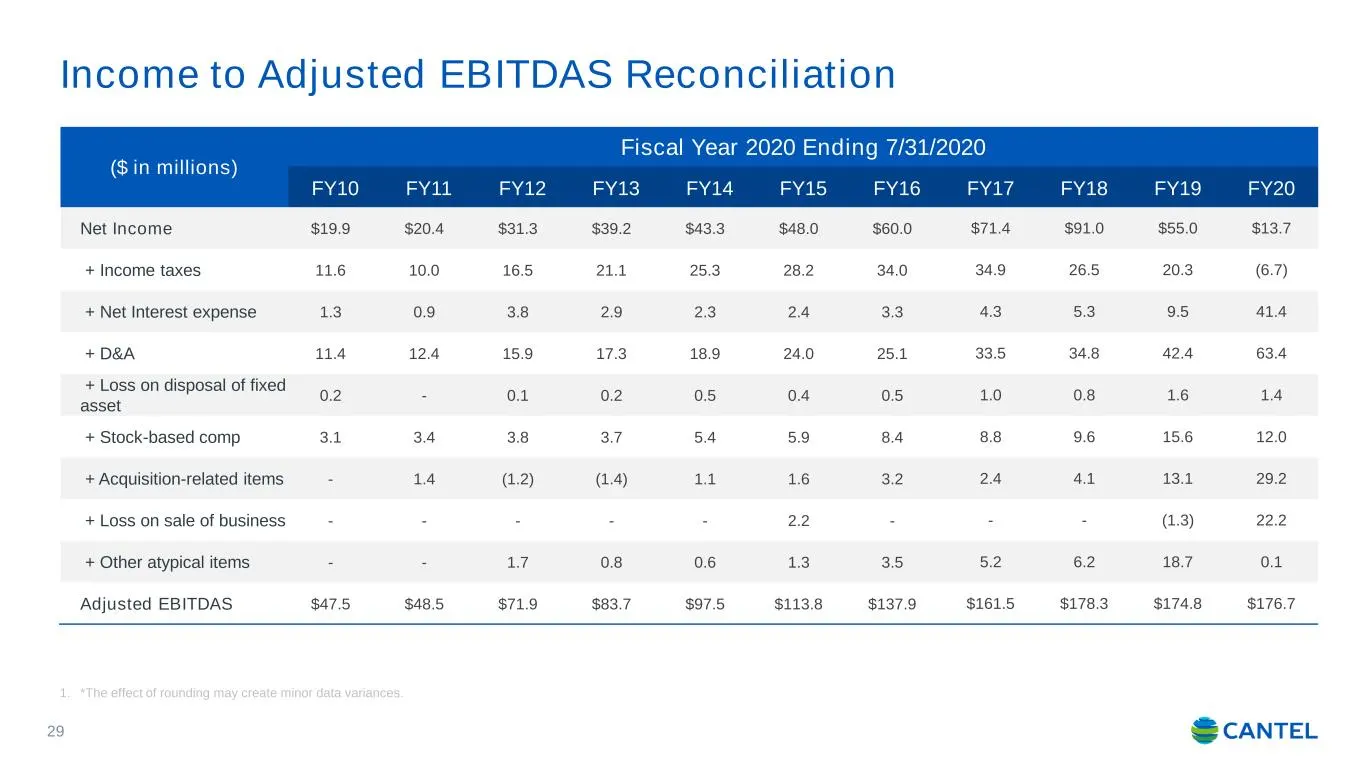
Slide 30: Income to Adjusted EBITDAS Reconciliation
Income to Adjusted EBITDAS Reconciliation 29 1. *The effect of rounding may create minor data variances. ($ in millions) Fiscal Year 2020 Ending 7/31/2020 FY10 FY11 FY12 FY13 FY14 FY15 FY16 FY17 FY18 FY19 FY20 Net Income $19.9 $20.4 $31.3 $39.2 $43.3 $48.0 $60.0 $71.4 $91.0 $55.0 $13.7 + Income taxe
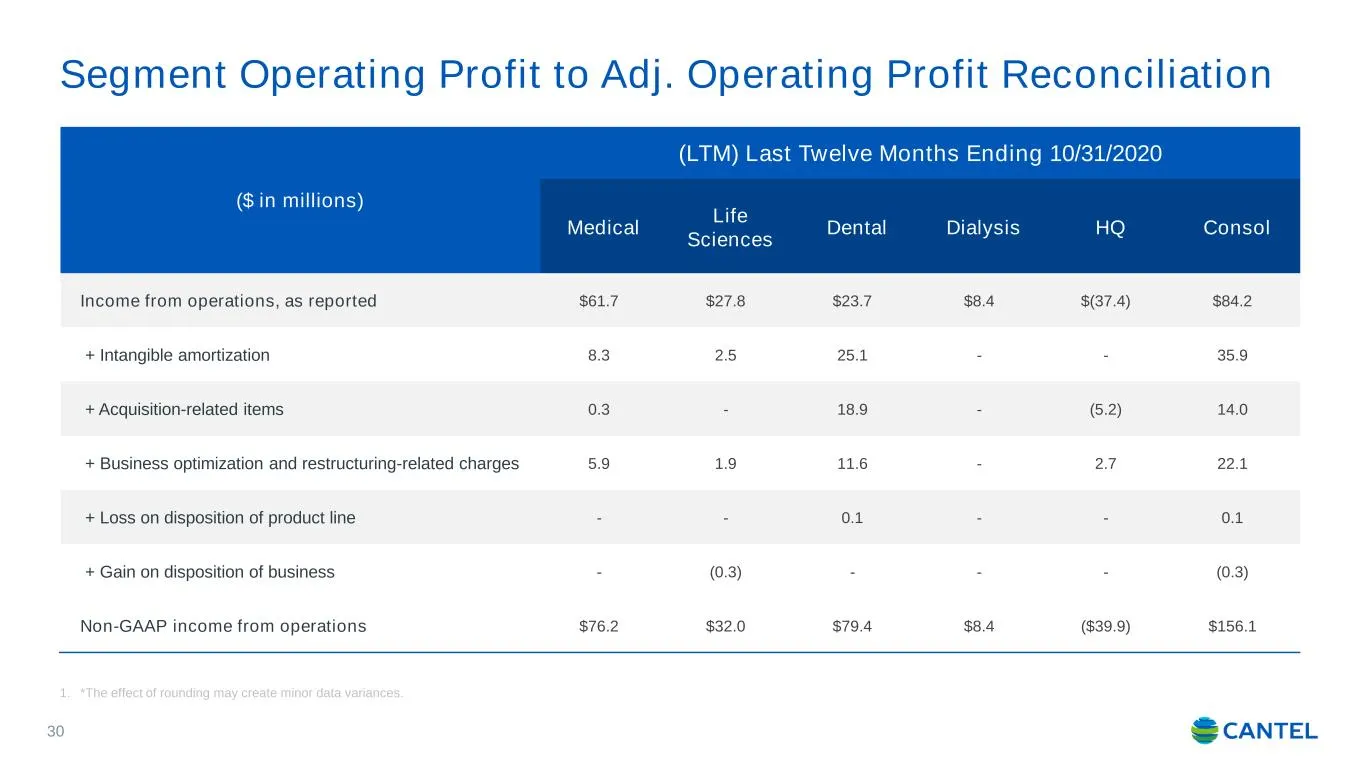
Slide 31: Segment Operating Profit to Adj. Operating Profit Reconciliation
Segment Operating Profit to Adj. Operating Profit Reconciliation 30 1. *The effect of rounding may create minor data variances. ($ in millions) (LTM) Last Twelve Months Ending 10/31/2020 Medical Life Sciences Dental Dialysis HQ Consol Income from operations, as reported $61.7 $27.8 $23.7 $8.4 $(37.4
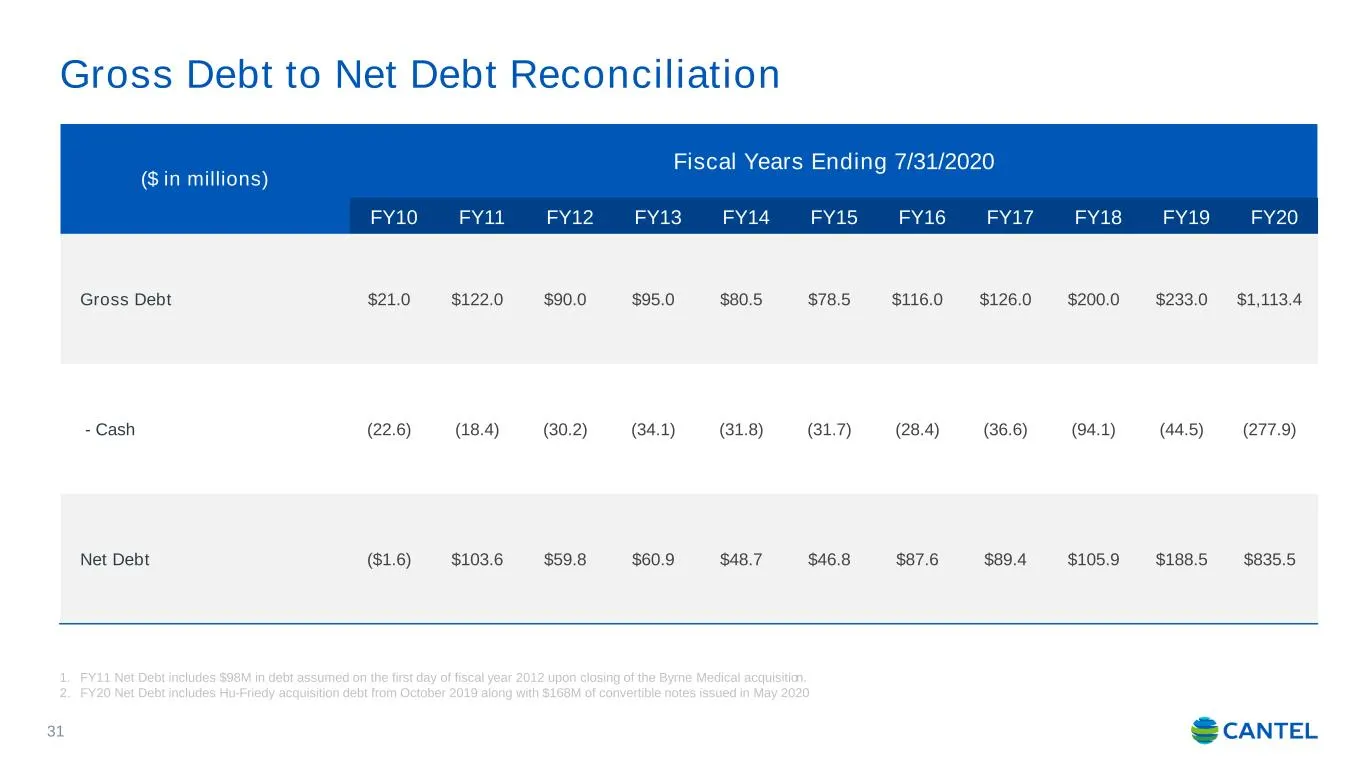
Slide 32: Gross Debt to Net Debt Reconciliation
Gross Debt to Net Debt Reconciliation 31 1. FY11 Net Debt includes $98M in debt assumed on the first day of fiscal year 2012 upon closing of the Byrne Medical acquisition. 2. FY20 Net Debt includes Hu-Friedy acquisition debt from October 2019 along with $168M of convertible notes issued in May 2020
Source: SEC EDGAR · 8-K filed Dec 10, 2020
More decks from Cantel Medical Corp
 Merger or Acquisition (January 2021)16 slides · Jan 12, 2021
 Investor Presentation (January 2020)31 slides · Jan 9, 2020
 Merger or Acquisition (July 2019)17 slides · Jul 30, 2019
 Investor Presentation (March 2019)34 slides · Mar 22, 2019
 Investor Presentation (January 2016)31 slides · Jan 14, 2016
 Investor Presentation (April 2015)28 slides · Apr 30, 2015