Curo — 20th Annual Financial Services Forum (February 2019)
33 slides from Curo's conference presentation, Feb 12, 2019

Slide 1: 20th Annual Financial Services Forum
February 2019 :: 20th Annual Financial Services Forum
Slide 2: Disclaimer
Disclaimer IMPORTANT: You must read the following information before continuing to the rest of the presentation. This presentation has been prepared by CURO Group Holdings Corp. and its subsidiaries (collectively, “we,” “us” or the “Company”) and is being provided to you for informational purposes o
Slide 3: Senior leadership team with over a century of collective industry experience
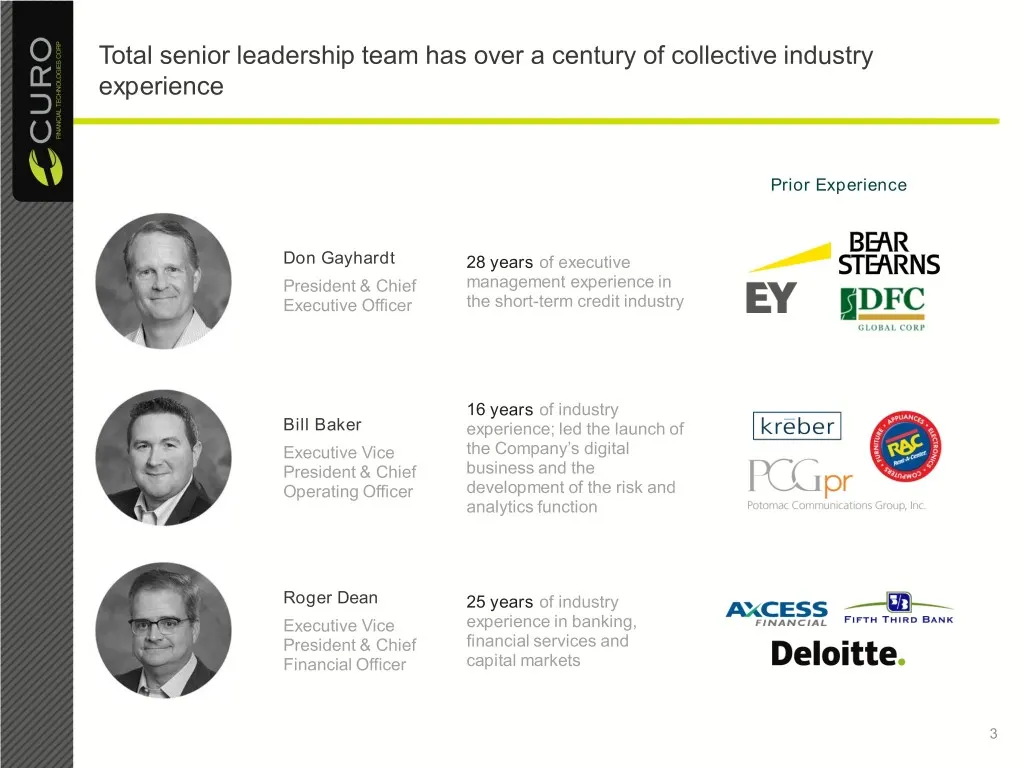
Total senior leadership team has over a century of collective industry experience Prior Experience Don Gayhardt 28 years of executive President & Chief management experience in Executive Officer the short-term credit industry 16 years of industry Bill Baker experience; led the launch of Executive Vi
Slide 4: CURO At a Glance
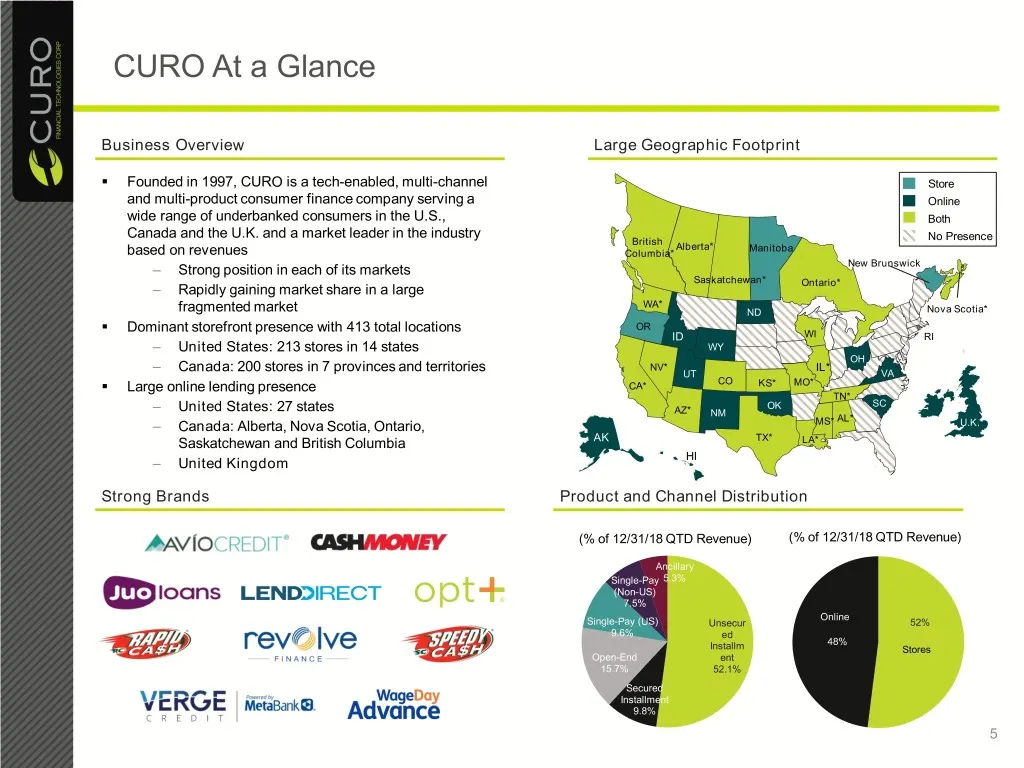
CURO At a Glance Business Overview Large Geographic Footprint . Founded in 1997, CURO is a tech-enabled, multi-channel Store and multi-product consumer finance company serving a Online wide range of underbanked consumers in the U.S., Both Canada and the U.K. and a market leader in the industry Briti
Slide 5: Key Investment Highlights
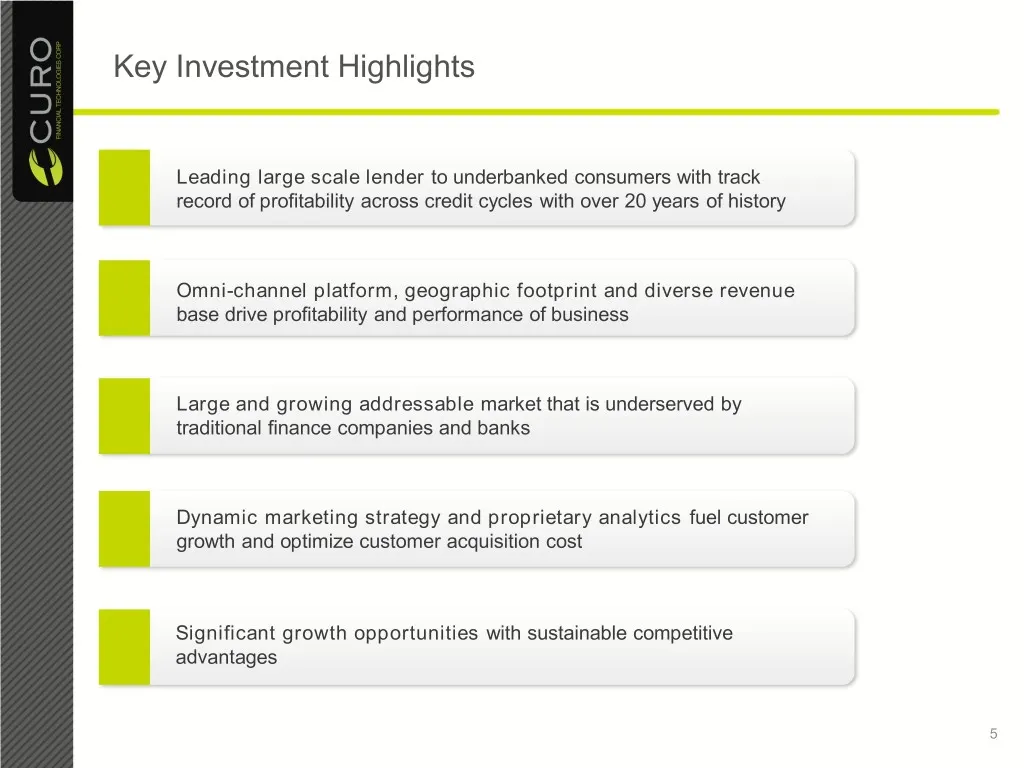
Key Investment Highlights Leading large scale lender to underbanked consumers with track record of profitability across credit cycles with over 20 years of history Omni-channel platform, geographic footprint and diverse revenue base drive profitability and performance of business Large and growing a
Slide 6: Leading Large Scale Lender To Underbanked Consumers With Track Record Of Profitability
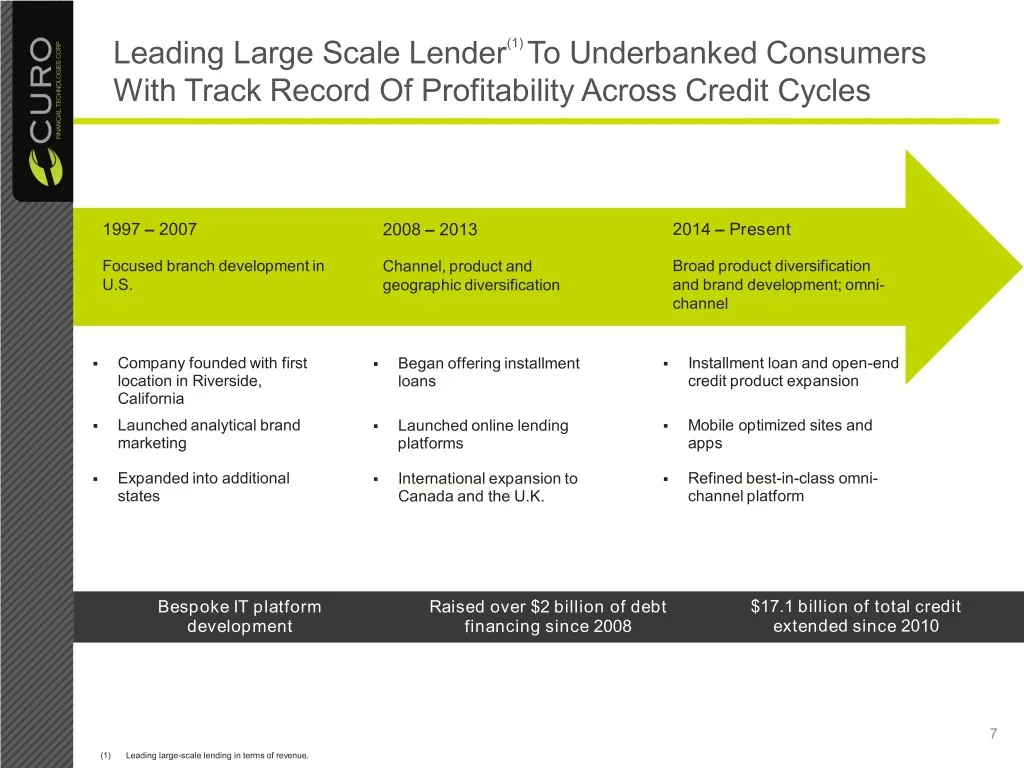
Leading Large Scale Lender(1) To Underbanked Consumers With Track Record Of Profitability Across Credit Cycles 1997 – 2007 2008 – 2013 2014 – Present Focused branch development in Channel, product and Broad product diversification U.S. geographic diversification and brand development; omni- channel
Slide 7: Omni-Channel Platform Supports Call, Click or Come-In
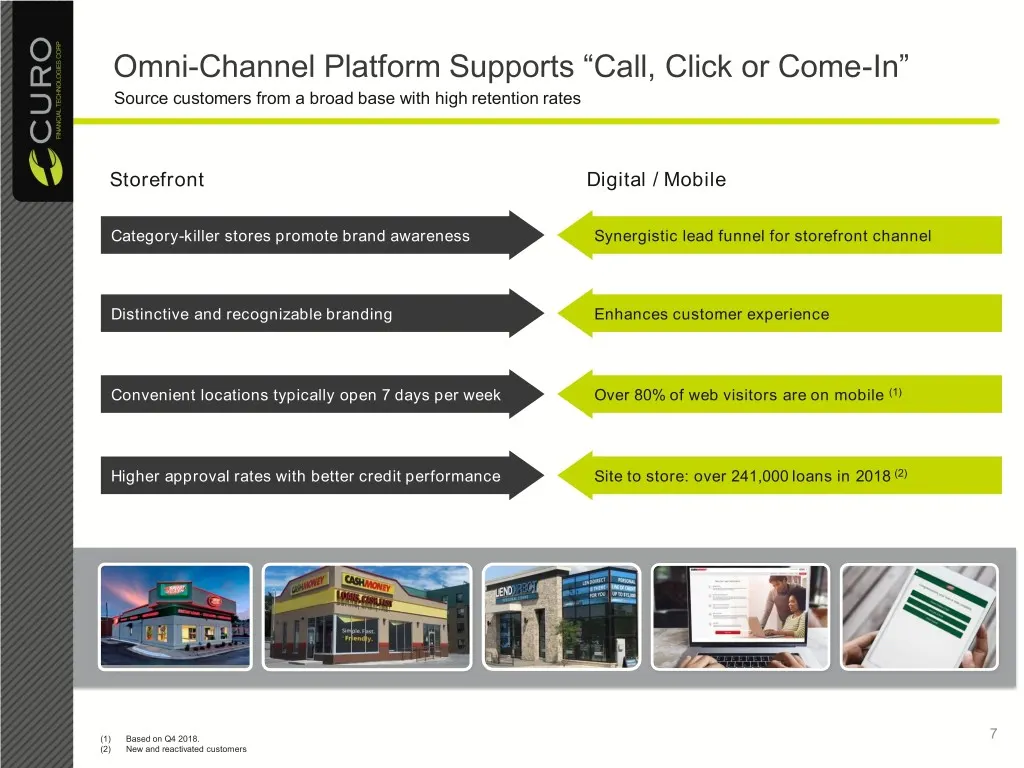
Omni-Channel Platform Supports “Call, Click or Come-In” Source customers from a broad base with high retention rates Storefront Digital / Mobile Category-killer stores promote brand awareness Synergistic lead funnel for storefront channel Distinctive and recognizable branding Enhances customer exper
Slide 8: Comprehensive Product Offerings And Diversified Revenue
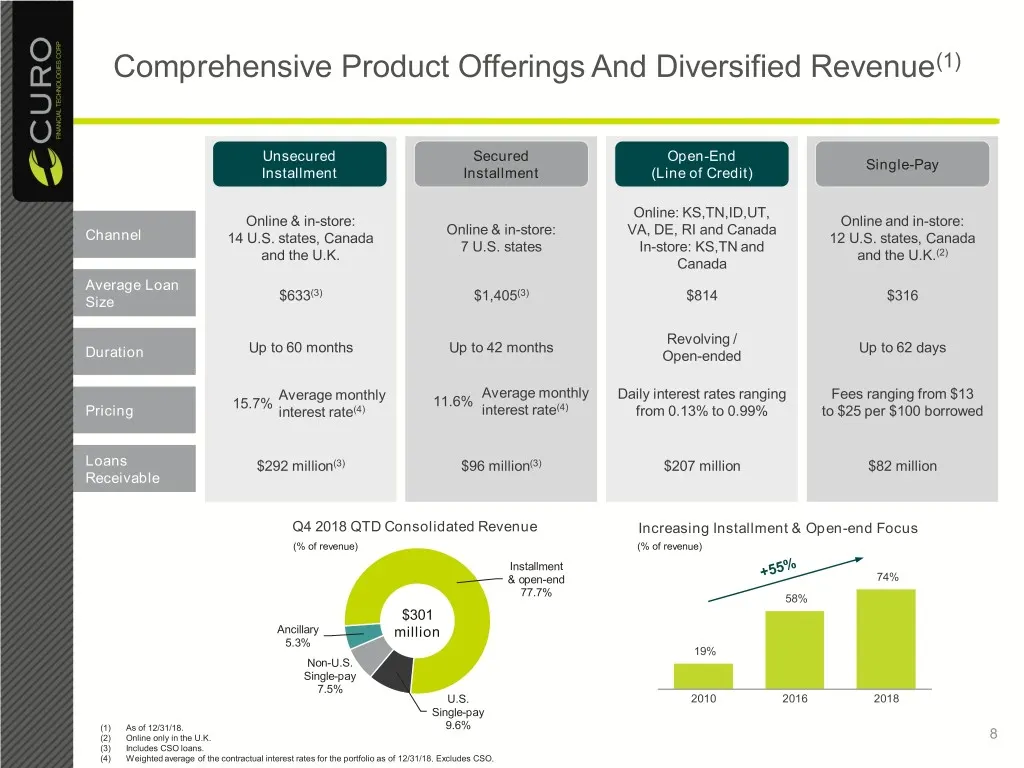
Comprehensive Product Offerings And Diversified Revenue(1) Unsecured Secured Open-End Single-Pay Installment Installment (Line of Credit) Online: KS,TN,ID,UT, Online & in-store: Online and in-store: Online & in-store: VA, DE, RI and Canada Channel 14 U.S. states, Canada 12 U.S. states, Canada 7 U.S.
Slide 9: Large Addressable Market Is Underserved
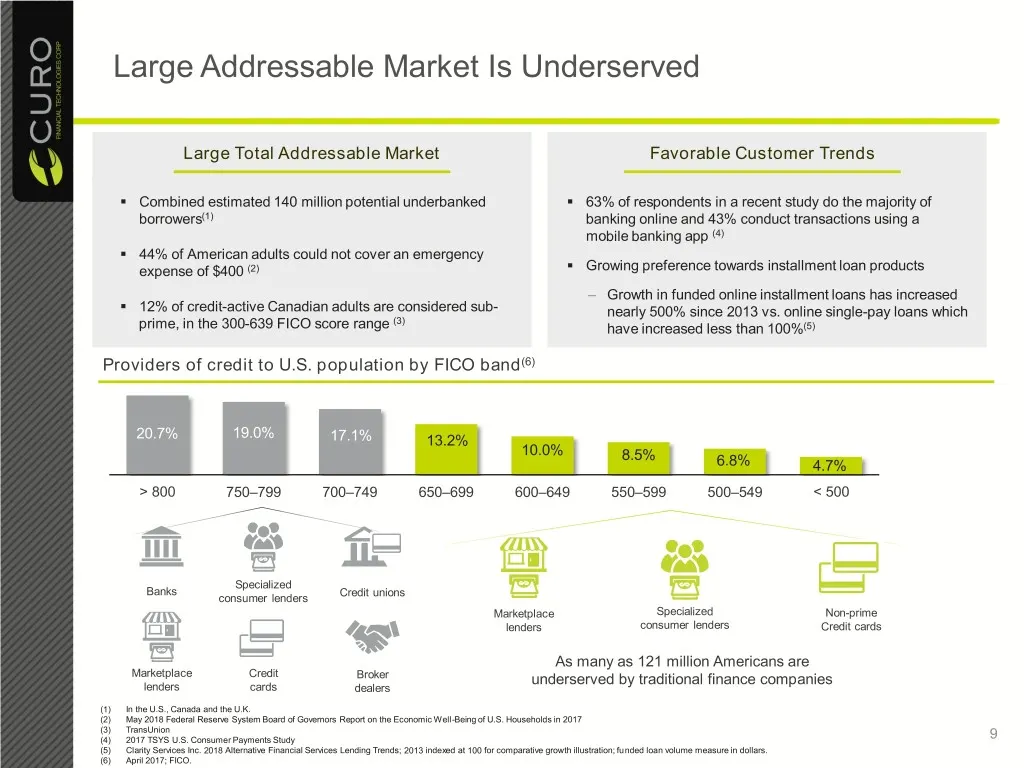
Large Addressable Market Is Underserved Large Total Addressable Market Favorable Customer Trends . Combined estimated 140 million potential underbanked . 63% of respondents in a recent study do the majority of borrowers(1) banking online and 43% conduct transactions using a mobile banking app (4) .
Slide 10: Market Trends Favoring CURO
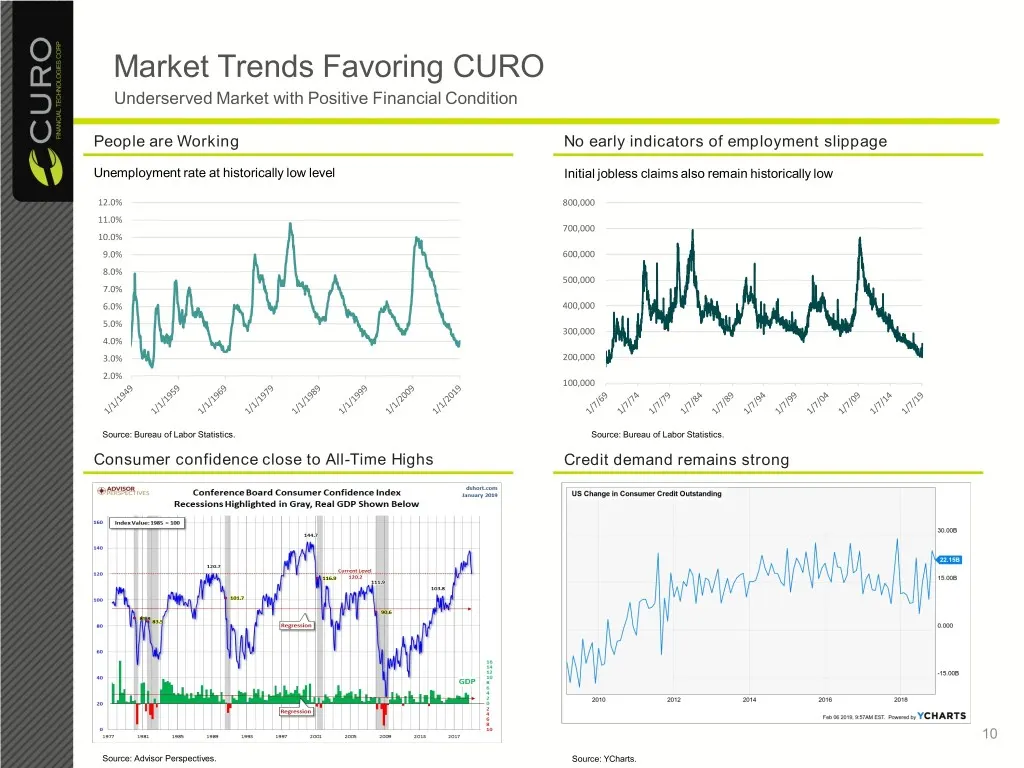
Market Trends Favoring CURO Underserved Market with Positive Financial Condition People are Working No early indicators of employment slippage Unemployment rate at historically low level Initial jobless claims also remain historically low 12.0% 800,000 11.0% 700,000 10.0% 9.0% 600,000 8.0% 500,000 7
Slide 11: Multi-faceted Marketing Strategy And Deep Data Analysis
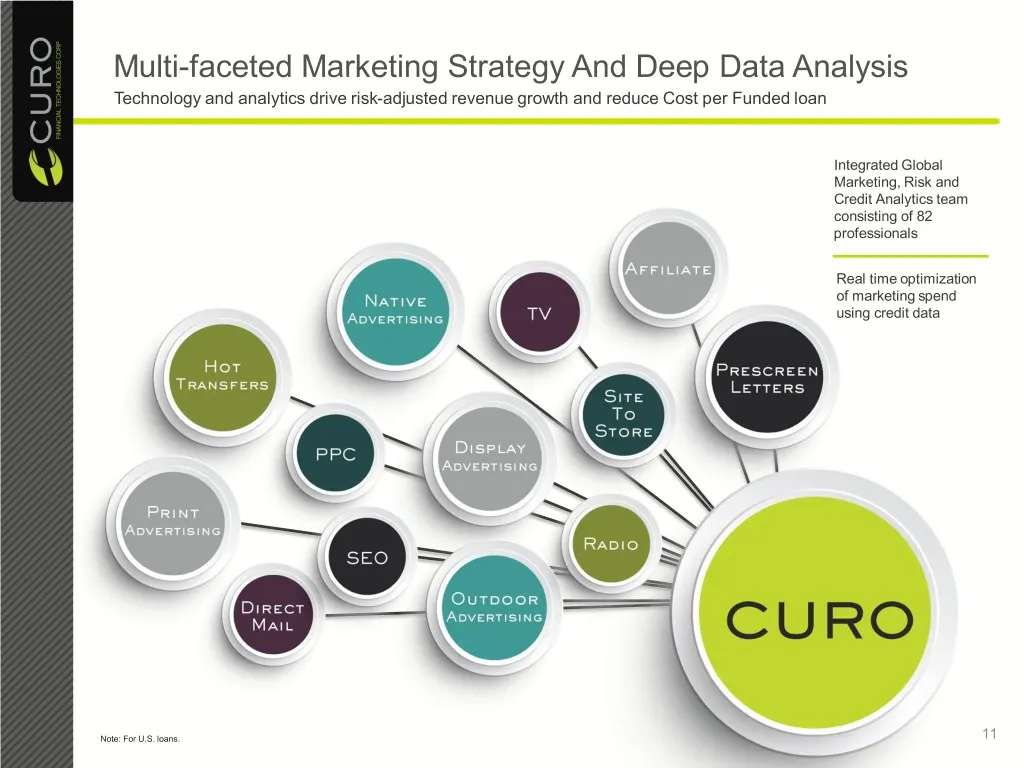
Multi-faceted Marketing Strategy And Deep Data Analysis Technology and analytics drive risk-adjusted revenue growth and reduce Cost per Funded loan Integrated Global Marketing, Risk and Credit Analytics team consisting of 82 professionals Real time optimization of marketing spend using credit data N
Slide 12: Centralized Analytics And IT Platform
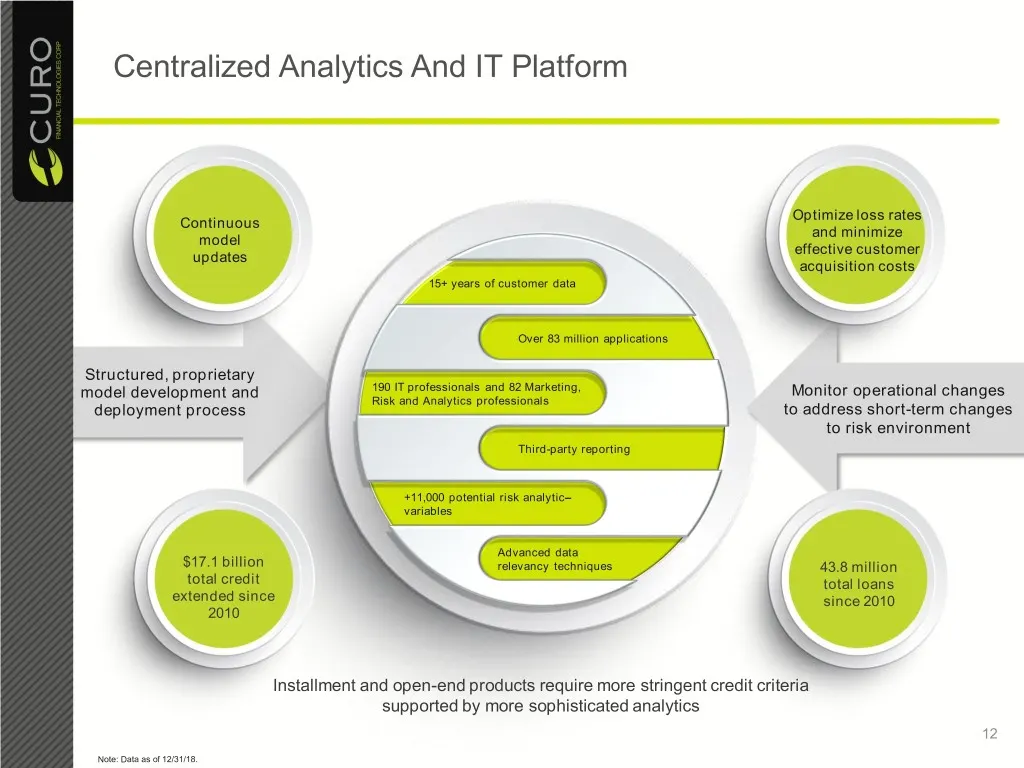
Centralized Analytics And IT Platform Optimize loss rates Continuous and minimize model effective customer updates acquisition costs 15+ years of customer data Over 83 million applications Structured, proprietary model development and 190 IT professionals and 82 Marketing, Monitor operational change
Slide 13: Multiple Opportunities For Continued Significant Growth
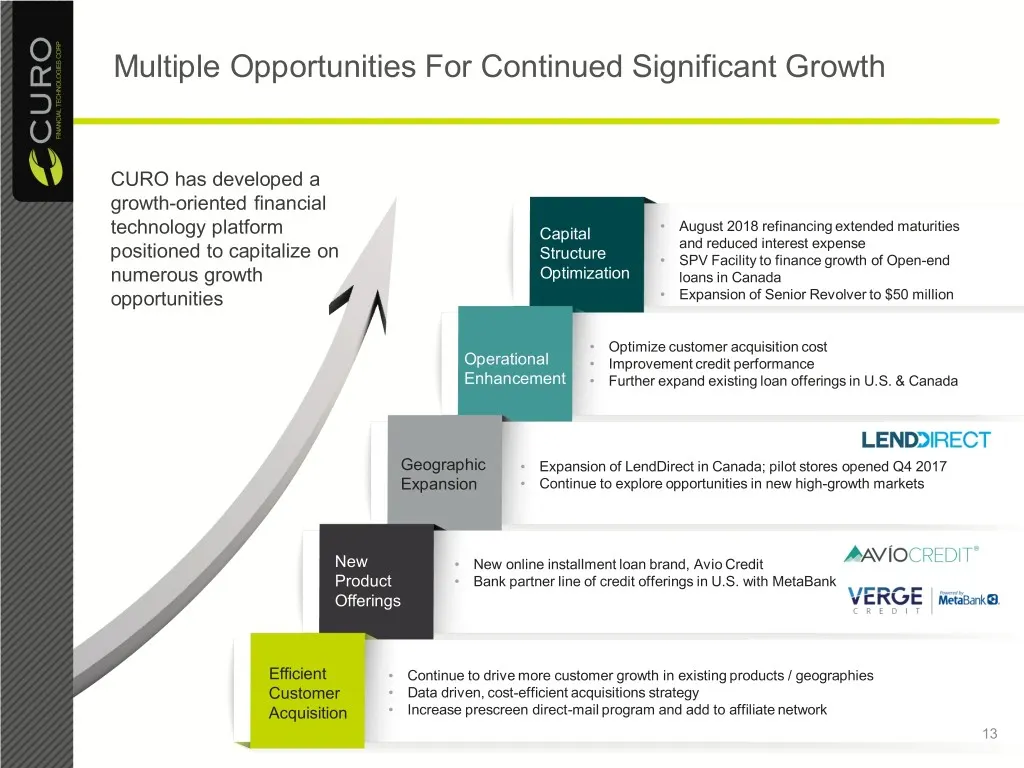
Multiple Opportunities For Continued Significant Growth CURO has developed a growth-oriented financial technology platform Capital • August 2018 refinancing extended maturities and reduced interest expense positioned to capitalize on Structure • SPV Facility to finance growth of Open-end numerous gr
Slide 14: Canada Open-End Transition
Canada Open-End Transition 14
Slide 15: Canada Open-end Overview
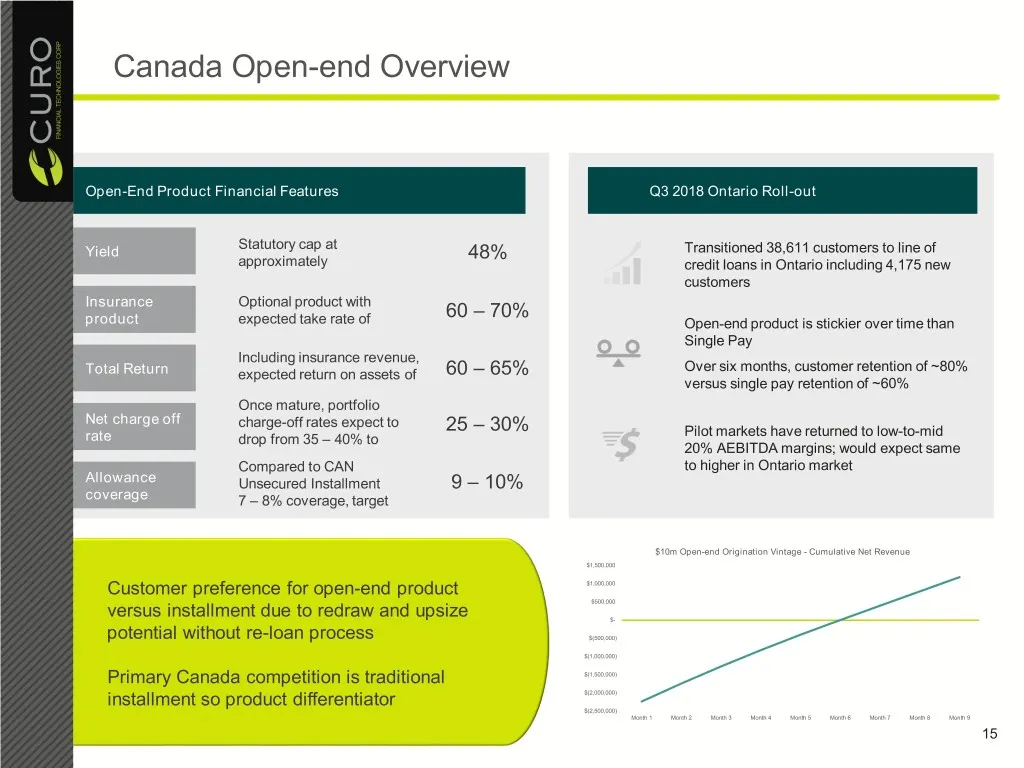
Canada Open-end Overview Open-End Product Financial Features Q3 2018 Ontario Roll-out Statutory cap at Yield 48% Transitioned 38,611 customers to line of approximately credit loans in Ontario including 4,175 new customers Insurance Optional product with 60 – 70% product expected take rate of Open-en
Slide 16: Transition To Multi-Pay Loans In Canada Beginning In 2016
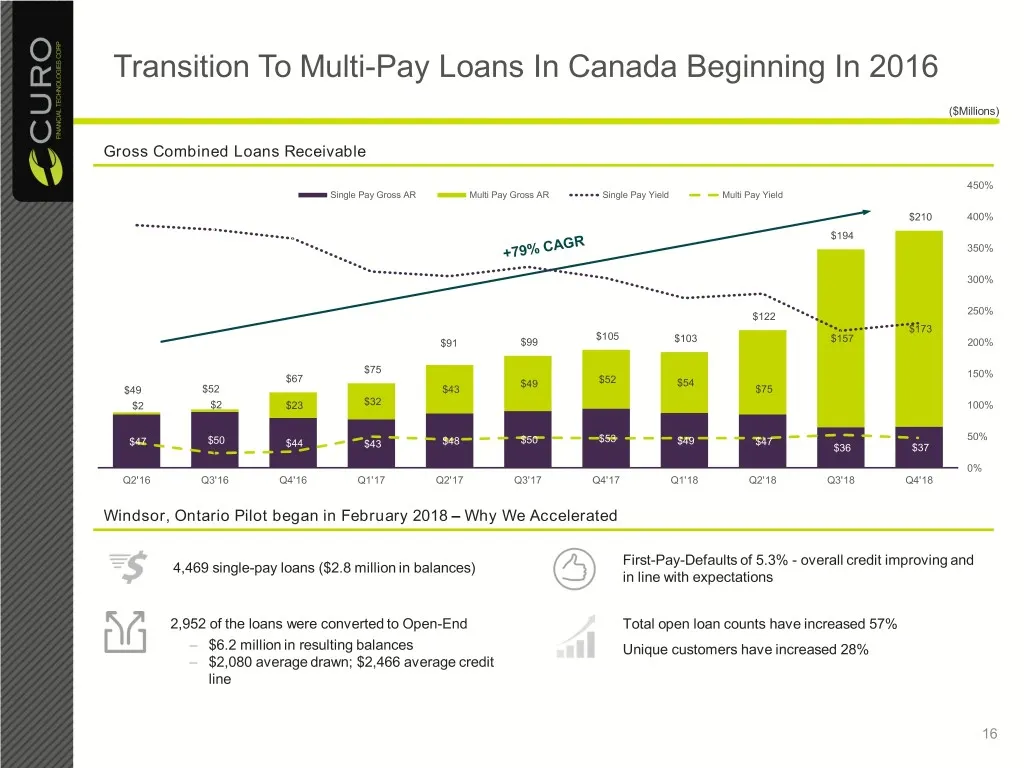
Transition To Multi-Pay Loans In Canada Beginning In 2016 ($Millions) Gross Combined Loans Receivable 450% Single Pay Gross AR Multi Pay Gross AR Single Pay Yield Multi Pay Yield $210 400% $194 350% 300% 250% $122 $173 $105 $91 $99 $103 $157 200% $75 150% $67 $49 $52 $54 $49 $52 $43 $75 $2 $2 $23 $3

Slide 17: U.K. Redress Claims
U.K. Redress Claims 17
Slide 18: The Challenge Facing the U.K. Business
The Challenge Facing the U.K. Business Curo Transatlantic Ltd (“CTL”), Curo Holdings Corp.’s U.K. subsidiary, is currently facing challenges arising from affordability complaints The U.K. payday lending industry faced a dramatic increase in affordability complaints over the course of 2018, acceler
Slide 19: Financial Summary
Financial Summary 19
Slide 20: Financial Results At A Glance
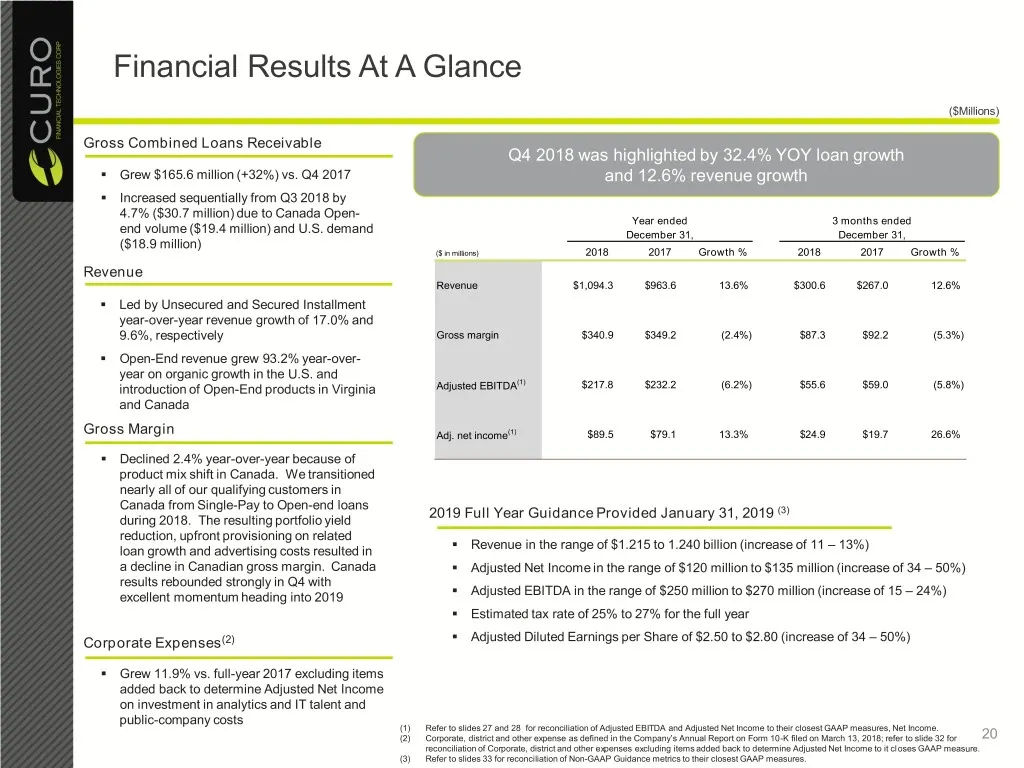
Financial Results At A Glance ($Millions) Gross Combined Loans Receivable Q4 2018 was highlighted by 32.4% YOY loan growth . Grew $165.6 million (+32%) vs. Q4 2017 and 12.6% revenue growth . Increased sequentially from Q3 2018 by 4.7% ($30.7 million) due to Canada Open- Year ended 3 months ended end
Slide 21: Cash Flow Outlook
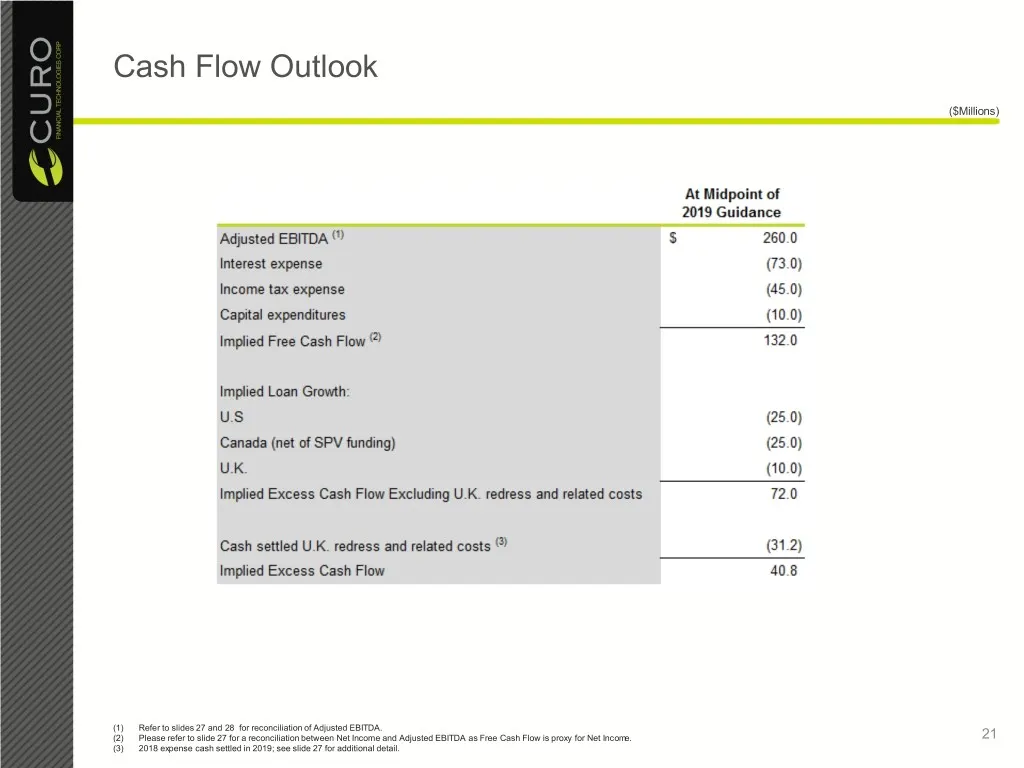
Cash Flow Outlook ($Millions) (1) Refer to slides 27 and 28 for reconciliation of Adjusted EBITDA. (2) Please refer to slide 27 for a reconciliation between Net Income and Adjusted EBITDA as Free Cash Flow is proxy for Net Income. 21 (3) 2018 expense cash settled in 2019; see slide 27 for additional
Slide 22: Historical Financial Summary
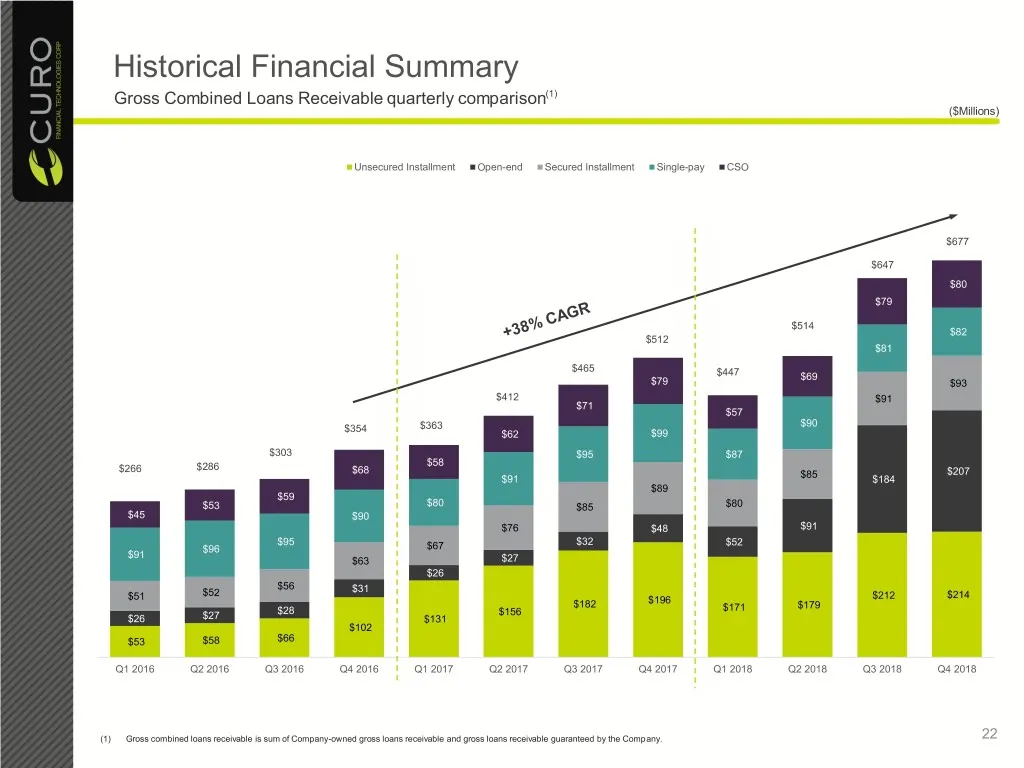
Historical Financial Summary Gross Combined Loans Receivable quarterly comparison(1) ($Millions) Unsecured Installment Open-end Secured Installment Single-pay CSO $677 $647 $80 $79 $514 $82 $512 $81 $465 $447 $69 $79 $93 $412 $91 $71 $57 $90 $354 $363 $62 $99 $303 $95 $87 $58 $266 $286 $68 $207 $91
Slide 23: Net Charge-off Rates
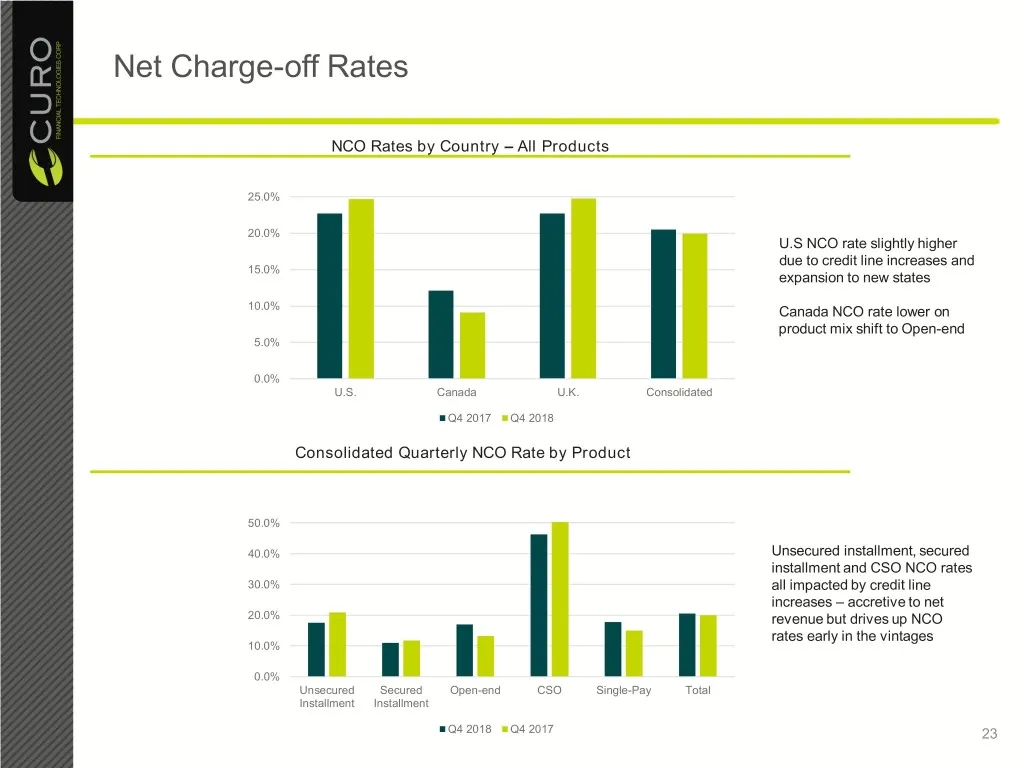
Net Charge-off Rates NCO Rates by Country – All Products 25.0% 20.0% U.S NCO rate slightly higher due to credit line increases and 15.0% expansion to new states 10.0% Canada NCO rate lower on product mix shift to Open-end 5.0% 0.0% U.S. Canada U.K. Consolidated Q4 2017 Q4 2018 Consolidated Quarterly
Slide 24: Consolidated Summary Balance Sheet
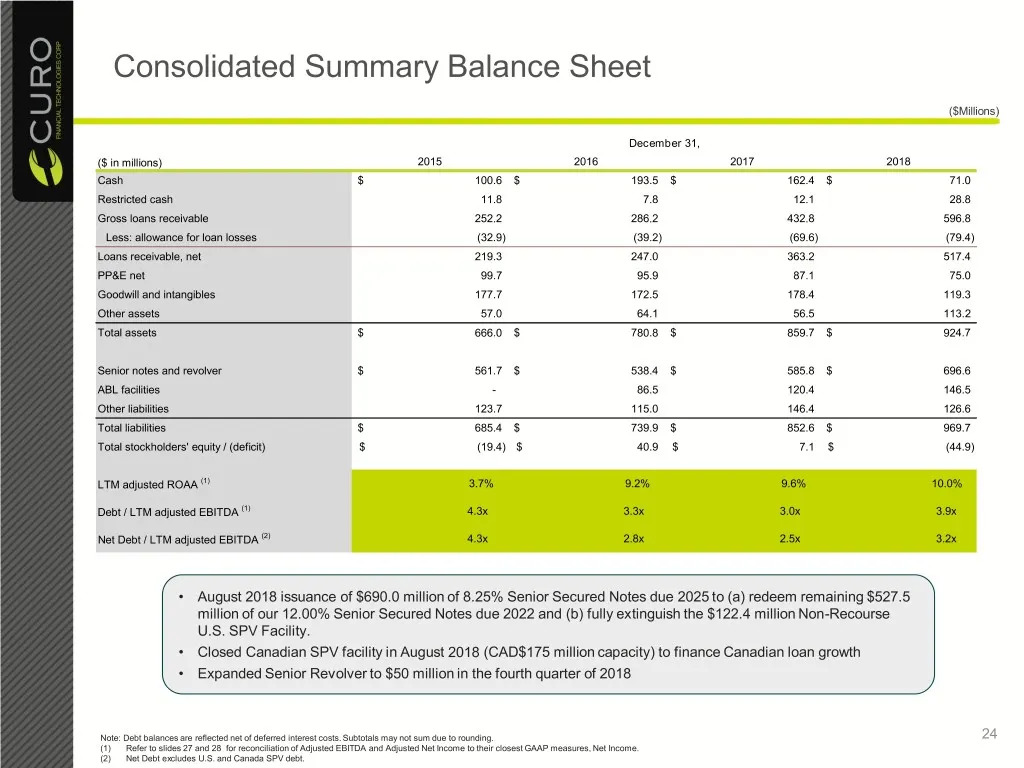
Consolidated Summary Balance Sheet ($Millions) December 31, ($ in millions) 2015 2016 2017 2018 Cash $ 100.6 $ 193.5 $ 162.4 $ 71.0 Restricted cash 11.8 7.8 12.1 28.8 Gross loans receivable 252.2 286.2 432.8 596.8 Less: allowance for loan losses (32.9) (39.2) (69.6) (79.4) Loans receivable, net 219.
Slide 25: Key Investment Highlights
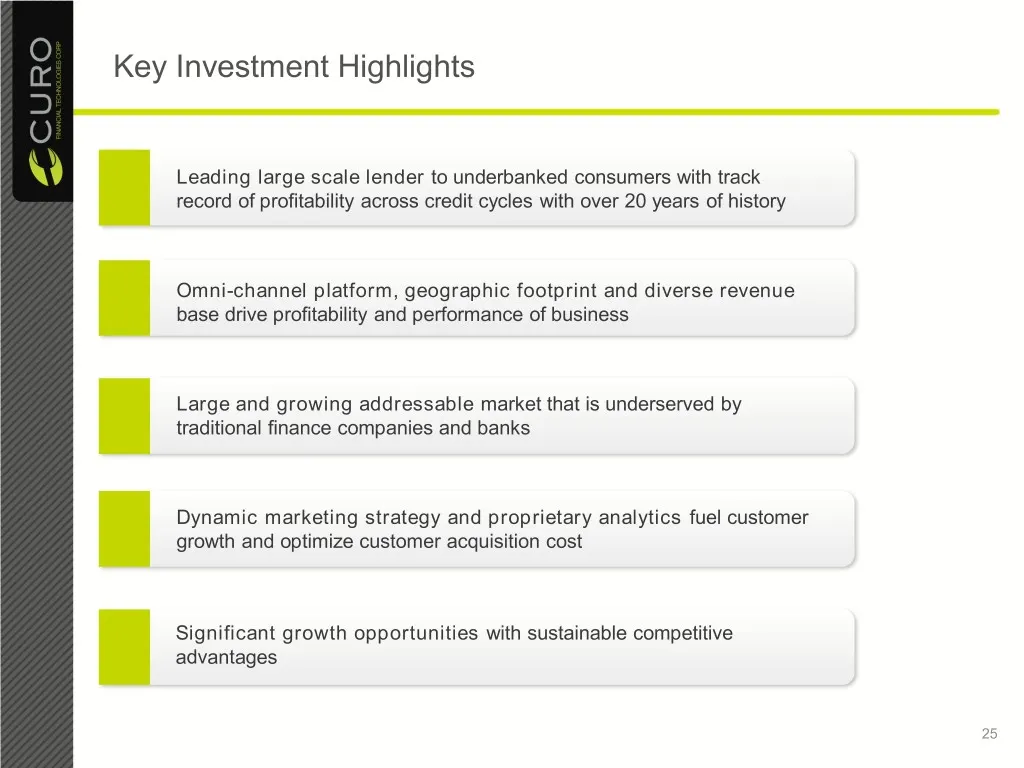
Key Investment Highlights Leading large scale lender to underbanked consumers with track record of profitability across credit cycles with over 20 years of history Omni-channel platform, geographic footprint and diverse revenue base drive profitability and performance of business Large and growing a

Slide 26: Appendix
Appendix 26
Slide 27: Historical Consolidated Adjusted EBITDA Reconciliation
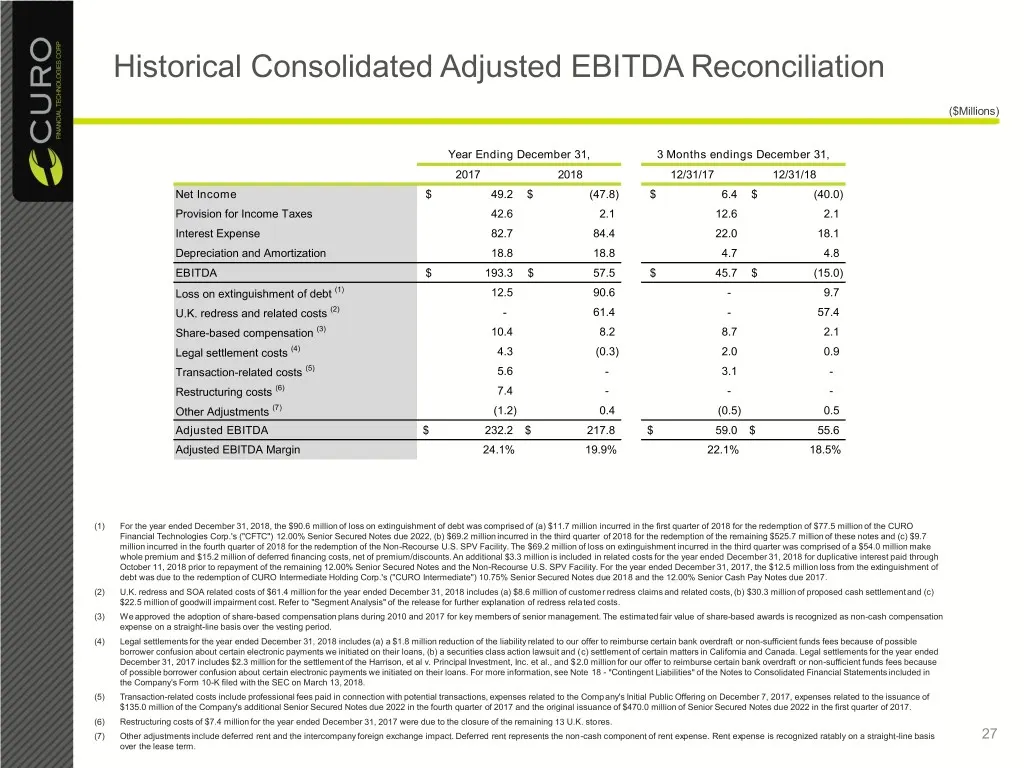
Historical Consolidated Adjusted EBITDA Reconciliation ($Millions) Year Ending December 31, 3 Months endings December 31, 2017 2018 12/31/17 12/31/18 Net Income $ 49.2 $ (47.8) $ 6.4 $ (40.0) Provision for Income Taxes 42.6 2.1 12.6 2.1 Interest Expense 82.7 84.4 22.0 18.1 Depreciation and Amortizat
Slide 28: Historical Consolidated Adjusted Net Income Reconciliation
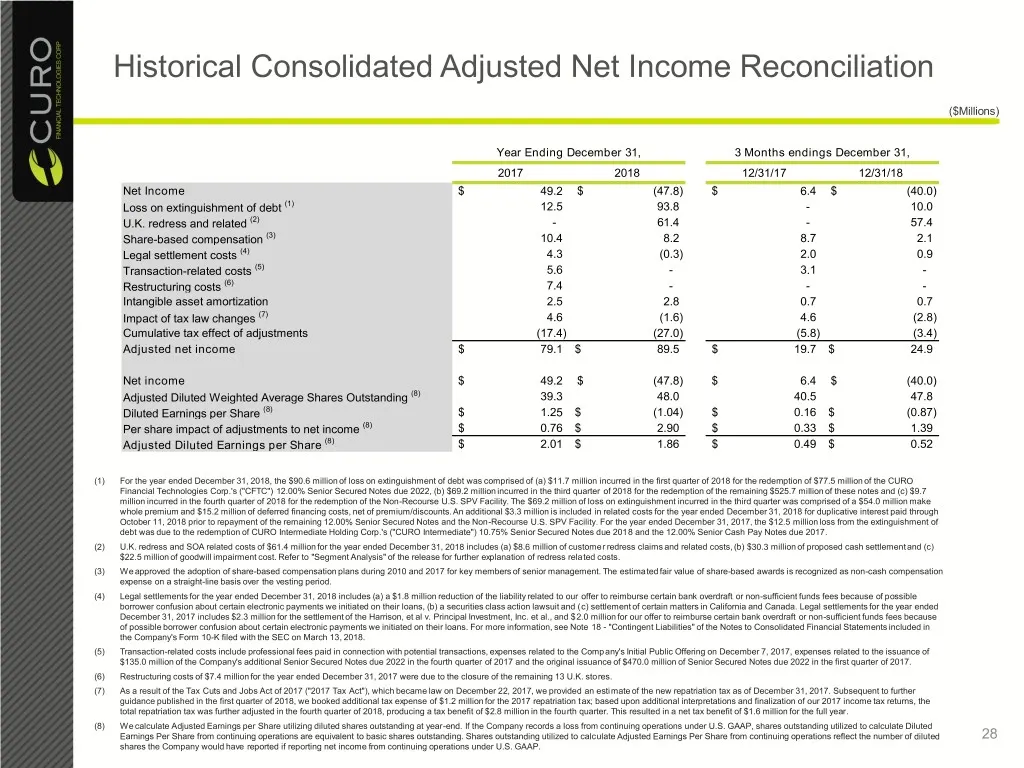
Historical Consolidated Adjusted Net Income Reconciliation ($Millions) Year Ending December 31, 3 Months endings December 31, 2017 2018 12/31/17 12/31/18 Net Income $ 49.2 $ (47.8) $ 6.4 $ (40.0) Loss on extinguishment of debt (1) 12.5 93.8 - 10.0 U.K. redress and related (2) - 61.4 - 57.4 Share-bas
Slide 29: Historical Consolidated Adjusted Return On Average Assets
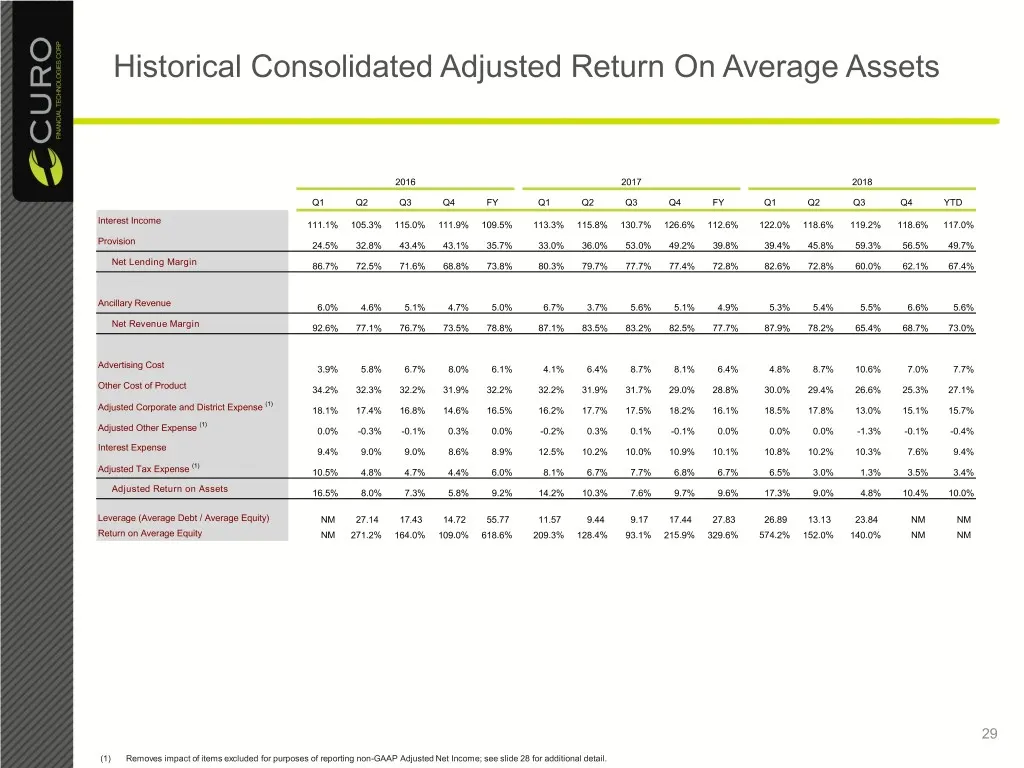
Historical Consolidated Adjusted Return On Average Assets 2016 2017 2018 Q1 Q2 Q3 Q4 FY Q1 Q2 Q3 Q4 FY Q1 Q2 Q3 Q4 YTD Interest Income 111.1% 105.3% 115.0% 111.9% 109.5% 113.3% 115.8% 130.7% 126.6% 112.6% 122.0% 118.6% 119.2% 118.6% 117.0% Provision 24.5% 32.8% 43.4% 43.1% 35.7% 33.0% 36.0% 53.0% 49
Slide 30: Historical Gross Combined Loan Receivables And Adjusted ROAA Reconciliations
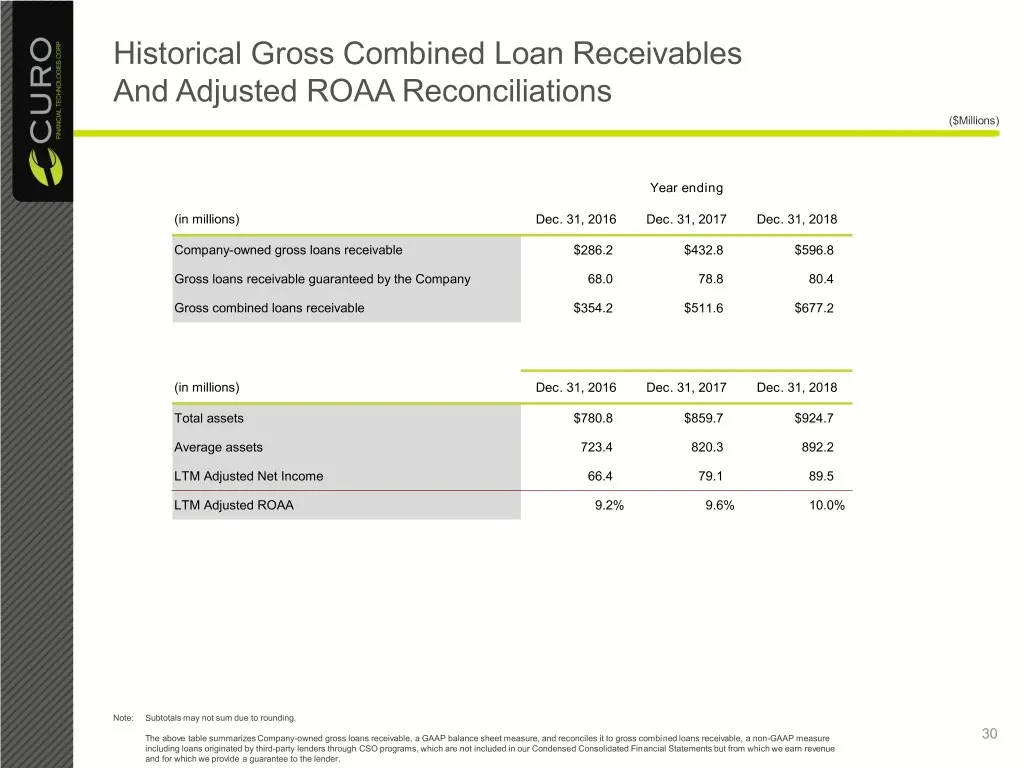
Historical Gross Combined Loan Receivables And Adjusted ROAA Reconciliations ($Millions) Year ending (in millions) Dec. 31, 2016 Dec. 31, 2017 Dec. 31, 2018 Company-owned gross loans receivable $286.2 $432.8 $596.8 Gross loans receivable guaranteed by the Company 68.0 78.8 80.4 Gross combined loans
Slide 31: Adjusted Pre-tax income And Adjusted tax Expense Reconciliations
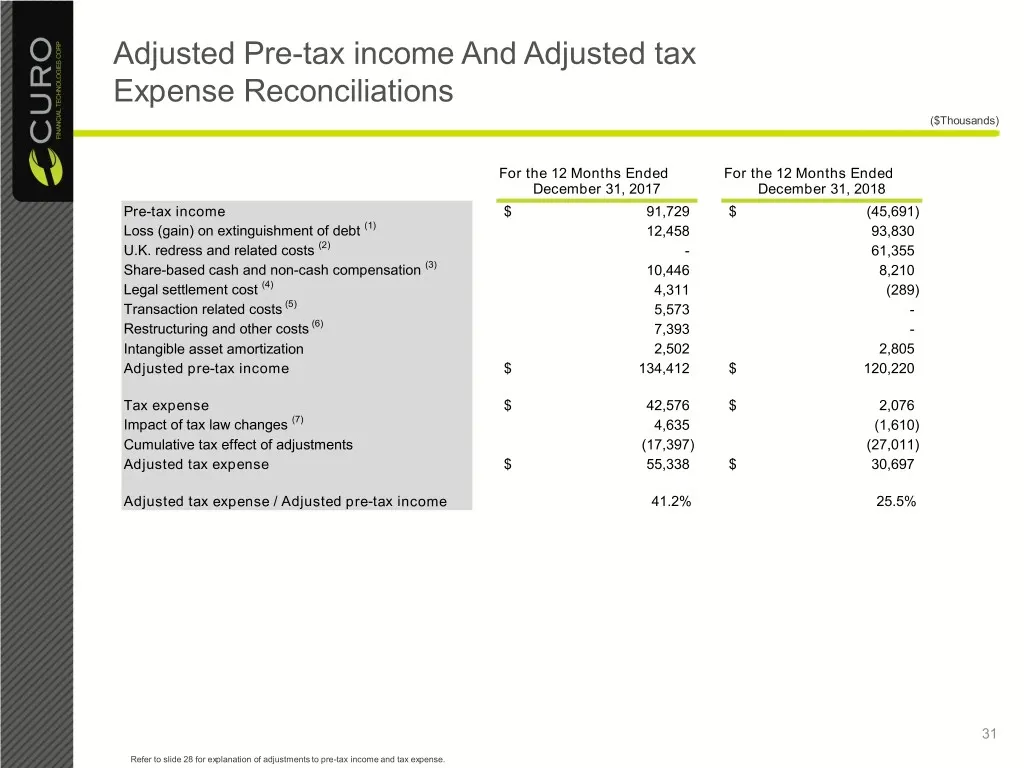
Adjusted Pre-tax income And Adjusted tax Expense Reconciliations ($Thousands) For the 12 Months Ended For the 12 Months Ended December 31, 2017 December 31, 2018 Pre-tax income $ 91,729 $ (45,691) Loss (gain) on extinguishment of debt (1) 12,458 93,830 U.K. redress and related costs (2) - 61,355 Sha
Slide 32: Adjusted Corporate District and Other Expense Reconciliation
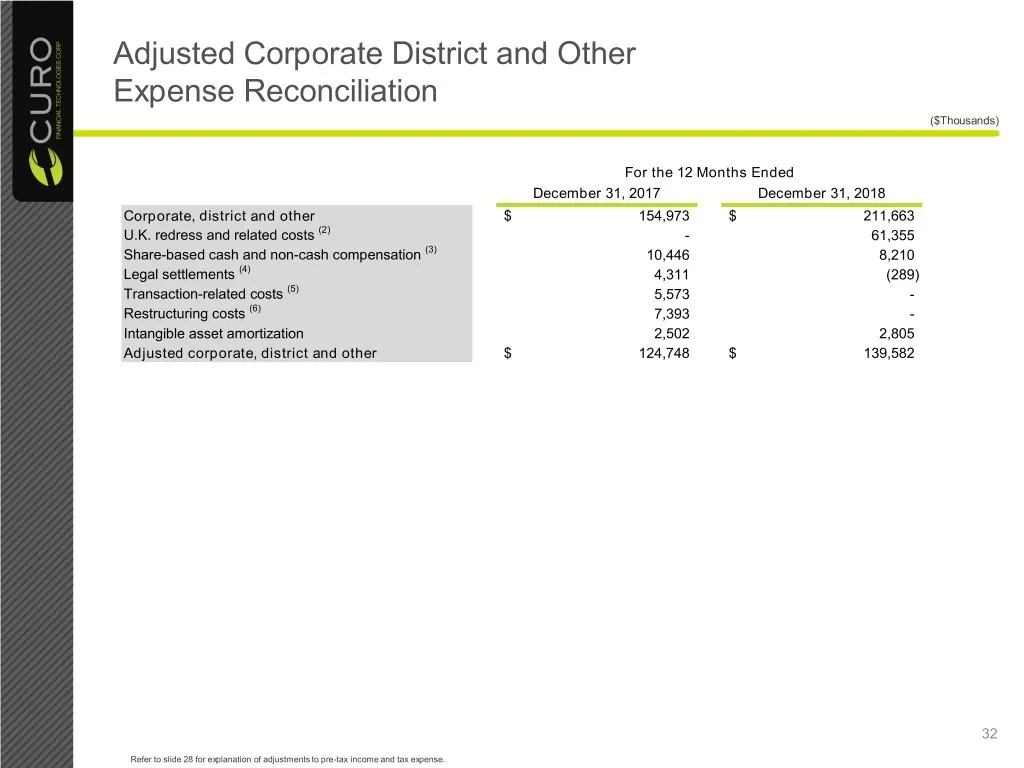
Adjusted Corporate District and Other Expense Reconciliation ($Thousands) For the 12 Months Ended December 31, 2017 December 31, 2018 Corporate, district and other $ 154,973 $ 211,663 U.K. redress and related costs (2) - 61,355 Share-based cash and non-cash compensation (3) 10,446 8,210 Legal settle
Slide 33: Guidance Metrics Reconciliations
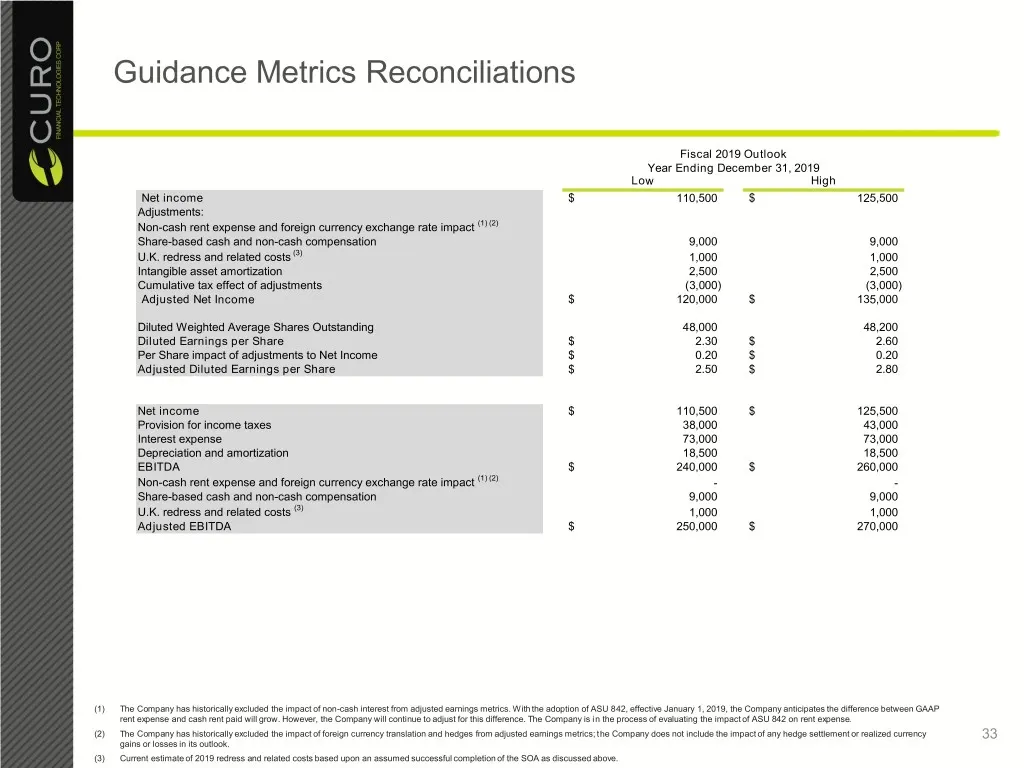
Guidance Metrics Reconciliations Fiscal 2019 Outlook Year Ending December 31, 2019 Low High Net income $ 110,500 $ 125,500 Adjustments: Non-cash rent expense and foreign currency exchange rate impact (1) (2) Share-based cash and non-cash compensation 9,000 9,000 U.K. redress and related costs (3) 1,
Source: SEC EDGAR · 8-K filed Feb 12, 2019
More decks from Curo Group Holdings Corp
 Q4 2023 Earnings Presentation21 slides · Feb 12, 2024
 Investor Presentation (November 2023)15 slides · Nov 13, 2023
 Q3 2023 Earnings Presentation20 slides · Nov 2, 2023
 Debt Investor Presentation (October 2023)21 slides · Oct 23, 2023
 Investor Presentation (September 2023)15 slides · Sep 25, 2023
 Q2 2023 Earnings Presentation21 slides · Aug 3, 2023